Seasonal Comparison of Fecal Coliform Concentrations in the Trask
31
Seasonal Comparison of Fecal Coliform Concentrations in the Trask River and a Study of the Survival of Escherichia coil in Tillamook Bay Water Final Report to the Tillamook Bay National Estuary Project Garibaldi, Oregon 97118-9999 Supported by a Challenge Grant from the Tillamook Bay National Estuary Project December 1996 David B. Alexander and Tara J. Koretsky Department of Biology University of Portland 5000 N. Willamette Boulevard Portland, Oregon 97203
Transcript of Seasonal Comparison of Fecal Coliform Concentrations in the Trask

Seasonal Comparison of Fecal Coliform Concentrations in the Trask River and a
Study of the Survival of Escherichia coil in Tillamook Bay Water
Final Report to the Tillamook Bay National Estuary Project
Garibaldi, Oregon 97118-9999
Supported by a Challenge Grant from the Tillamook Bay National Estuary Project
December 1996
David B. Alexander and Tara J. Koretsky
Department of Biology
University of Portland
5000 N. Willamette Boulevard
Portland, Oregon 97203

2
INTRODUCTION
Fecal contamination has been identified as a priority environmental problem in
Tillamook Bay because of the health risk it poses for the shellfish industry and for those who
use the bay for recreational activities. The Oregon Department of Agriculture and county
health departments monitor water quality in the bay monthly by measuring the most probable
number (MPN) of fecal conforms at 16 sampling sites using a five-tube lactose fermentation
test. None of the shellfish growing areas in the bay is currently classified as "approved" for
continuous shellfish harvest. The Main Bay and Cape Meares growing areas are classified as
"conditionally approved", while the Flower Pot area is classified as "restricted" and the Upper
Bay is classified as "prohibited" (42). Shellfish harvesting is allowed in conditionally approved
or restricted areas only when the concentration of fecal conforms does not exceed the U. S.
Food and Drug Administration's standards for shellfish growing waters or when purification of
the shellfish products can be assured. No shellfish products may be harvested from a
prohibited area for use in interstate commerce. According to the most recent Oregon
Department of Environmental Quality (DEQ) Water Quality Status Report (42), the
classification of six of the 16 sampling sites in Tillamook Bay decreased between 1991 and
1993 due to increases in fecal conform concentrations.
Between October 1991 and September 1993, the Main Bay growing area was closed for
55 days and the Cape Meares area was closed for 77 days under a management plan to control
fecal contamination of shellfish products. Closures such as these, which are based upon
stream gauge levels in the Wilson River, have a severe negative impact on shellfish growers
and on the local economy of the counties surrounding Tillamook Bay. Oyster production has
decreased by 80 percent since the largest commercial grower went out of business in 1990,
and water quality has continued to worsen due to increases in fecal contamination.
Fecal conforms are the most commonly used indicators of fecal contamination in
natural bodies of water. Traditional methods for detecting conform bacteria use standard
bacteriological media to selectively culture gram negative species and to differentiate lactose-
fermenting from lactose-nonfermenting organisms (21). The concentration of bacterial
contaminants in water is determined by membrane filtration or by multiple-tube fermentations
which estimate the MPN of conform bacteria. Fecal (thermotolerant) conforms are

3
differentiated from the more temperature-sensitive conforms that may arise from non-fecal
sources by incubating the cultures at an elevated temperature (44.5 °C).
Microbiologists have identified several problems associated with traditional methods
that rely upon selective cultivation to identify conform bacteria. These methods fail to detect
bacterial contaminants that do not survive handling between the time of sample collection
and the time at which the samples are inoculated into selective and differential culture media,
and they do not detect bacteria that are viable but nonculturable due to environmental
stresses (22, 52). Another disadvantage of viable culture methods is the time required (days)
to confirm the presence of fecal contaminants in the water.
Alternative methods designed to circumvent some of these problems include colorimetric
or fluorimetric tests for specific enzymes involved in lactose fermentation (3, 7) and detection
of the genes that encode these enzymes by extracting DNA from water samples and amplifying
specific sequences with the polymerase chain reaction (2). Enzymatic techniques provide
more rapid results than traditional detection methods, but in many cases still require
cultivation of viable bacteria and fail to detect organisms that are viable but metabolically
inactive due to environmental factors (46). Genetic detection methods can also provide rapid
and reliable results, but the specificity and sensitivity of detection varies depending upon the
method used to extract DNA from the water, the annealing temperature and specificity of the
primer used for the amplification reaction, and the type of probe that is used to identify the
target sequences (2).
Several potential point and nonpoint sources of fecal contamination have been
identified, including runoff from agricultural land, outfall from sewage treatment facilities,
and failing septic systems, but no systematic studies have been conducted to assess the
relative impacts of these sources on water quality in Tillamook Bay. We have therefore
conducted a study to measure the concentrations of fecal conforms in the Trask River, one of
five rivers that drain into the bay, at six sites representing different land use areas and
potential sources of fecal contamination. The normal habitat of these bacteria is the
intestinal tract of warm-blooded animals, so their presence in surface waters indicates that
the water has been contaminated with human or animal waste. The multiple-tube
fermentation method was chosen to measure the MPN of fecal conforms because it is the
method used by the Oregon Department of Agriculture to monitor fecal contamination in the

4
bay and because the time required to obtain results was not a primary concern. Water
temperature, salinity, and dissolved oxygen concentrations were measured at each sampling
site to determine whether a correlation exists between these physical parameters and the
concentration of viable fecal coliforms in the water.
The severity of the public health risk associated with fecal contamination depends on a
number of factors, including how long the bacteria survive in the water. Several environmental
factors have been shown to influence bacterial survival in aquatic habitats. Sunlight is thought
to be the primary factor limiting bacterial survival in seawater (5). Other important factors
include salinity (45), temperature (48), the growth stage of the bacteria (17), competition with
other bacteria (27), predation by protozoa (14), low nutrient concentrations (18), and toxic
substances in the water (28).
Estuaries are profoundly affected by tidal movements which produce wide variations in
salinity and temperature on a daily and seasonal basis. Organisms that live in estuaries must
have wide ranges of tolerance to survive the stressful physical conditions of the habitat.
Indigenous species have acquired adaptations that enable them to tolerate the changing
conditions of an estuary, and nonindigenous species must exhibit similar tolerance in order to
survive. Enteric bacteria •are not indigenous to aquatic habitats, but increasingly find their
way into rivers, lakes, and estuaries through human activity. The longer these bacteria
survive in contaminated water, the more likely they are to become dispersed over a large
geographic area and the greater the risk to human health and to the wildlife that inhabit the
area. For this reason we have also studied the survival of Escherichia colt, a common
indicator of fecal contamination, in water samples collected from Tillamook Bay and from two
major sources of water that enter the bay - the Trask River and the Pacific Ocean. Survival
was monitored over a wide range of temperatures and natural extremes of salinity by
inoculating the water samples with a high concentration of stationary phase bacterial cells
and periodically measuring the number of surviving cells by standard plate counts on a
selective and differential culture medium.
MATERIALS AND METHODS
Trask River sample collection and handling. Midstream water samples were
collected at five sites on the Trask River and one site on Hoquarten slough during low tides on

5
31 July 1996 (tide level = -1.8 ft) and 19 October 1996 (tide level = 2.9 ft). No measurable rain
had fallen for at least 7 days prior to the July (dry season) sample collection. Almost 12 cm of
rain fell during the week preceding the October (wet season) sampling, including 4.8 cm on the
day that the samples were collected.
Site 1 (Memaloose Point site) was located 0.8 mi downstream of river mile 0 on the
Trask River levee, northwest of Tillamook, Oregon (Fig. 1). Site 2 (Hoquarten slough site) was
located at the point where U. S. Highway 101 crosses Hoquarten slough, north of Tillamook.
Site 3 (Third Street bridge site) was located at river mile 1.2 on the Trask River levee, 0.1 mi
downstream of the Tillamook sewage treatment plant. Site 4 (Highway 101 bridge site) was
located at river mile 4.2 on the Trask River, 1 mi downstream from the sewage treatment
ponds near the Tillamook airport. Site 5 (Peninsula site) was located at river mile 14.5 on the
Trask River, 0.5 mi east of a horseshoe bend in the river known as The Peninsula. Site 6
(North Fork site) was located at river mile 20.2 on the North Fork of the Trask River.
Three samples were collected at each site in critically clean, sterile 300-m1 glass BOD
bottles. All of the bottles were filled to the neck and immediately capped with a sterile glass
stopper. At sites 2, 3, and 4, the samples were collected by lowering each bottle into the river
at midstream from a highway bridge. At sites 1 and 6, the bottles were tied to the end of a
10-foot extension rod and placed into the water from the bank of the river. The 10-foot length
was sufficient to reach midstream at site 6, but not at site 1, where the channel is 0.1 mi
wide. At site 5, the river was shallow enough to wade to midstream and collect the samples
by placing the bottles into the water by hand. The bottles were placed in the water neck
downward and moved forward as they filled. Vinyl gloves were worn while collecting the
samples to reduce the risk of contamination with skin microflora. The gloves were changed
between sampling sites to avoid cross contamination.
Water temperature and salinity were measured in the field with a YSI Model 33 salinity
meter (Yellow Springs Instrument Co., Yellow Springs, OH). All measurements were made at
midstream except at site 1, where the probe was placed in the water at the end of a boat ramp.
Dissolved oxygen was measured with a YSI Model 58 dissolved oxygen meter equipped with a
YSI Model 5739 dissolved oxygen probe. Midstream measurements were recorded at sites 5
and 6. The remaining measurements were recorded at a distance of 10 feet from the bank of
the river by placing the probe into the water with the extension rod. The probe's cable was

6
not long enough to reach the water from the highway bridges at sites 2, 3, and 4. The data
obtained from these measurements are listed in Table 1.
MPN determination. The water samples were transported on ice to the Microbiology
Laboratory at the University of Portland and immediately inoculated into Phenol Red Lactose
broth (Difco) to determine the MPN of fecal coliform bacteria. A five-tube MPN determination
(33) was performed for each of the three replicate samples collected at each site. Each water
sample was aseptically inoculated into five replicate tubes of lactose broth at each of three
successive 10-fold dilutions. The tubes were incubated at 44.5 °C for 48 h and examined for
evidence of lactose fermentation after 24 and 48 h. Tubes exhibiting an acid reaction and a
gas volume of at least 10% in the Durham tube after 24 h were scored as positive reactions.
The number of positive reactions at each dilution was used to determine the MPN of fecal
coliforms from a standard MPN table. When acid and gas production occurred only after 48 h
incubation, the tubes were scored as doubtful positive reactions and not included in the MPN
determinations.
Every tube in the five-tube dilution series yielded a positive reaction in the initial analysis
of the wet season samples from the Memaloose Point, Hoquarten slough, and Third Street
bridge sites. It was therefore necessary to dilute these water samples 100-fold and inoculate a
three-tube dilution series on the following day to obtain MPN indices for the three downstream
sites. The tubes were incubated at 44.5 °C for 48 h and evaluated for evidence of lactose
fermentation as described above.
Confirmation of fecal coliform contamination. Eosin Methylene Blue (EMB) agar
(Difco) plates were inoculated from the lactose broths at the highest dilutions exhibiting a
positive or doubtful positive reaction. The plates were examined for the presence of typical
coliform colonies after 24 h incubation at 44.5 °C . The presence of small colonies with a
dark center or with a metallic green sheen confirmed that the lactose fermentation in the
phenol red medium was produced by conform bacteria. Selected colonies (three from each
water sample) were aseptically transferred to Nutrient agar (Difco) slants and Phenol Red
Lactose broths and incubated at 44.5 °C for 24 h. Isolation of thermotolerant, gram
negative, nonsporeforming rods which fermented lactose to acid and gas constituted a
completed test for the presence of fecal coliforms in the water samples.

7
Survival experiments. Escherichia colt strain K12 (Ward's, Rochester, NY) was
obtained from the culture collection at the University of Portland. To prepare the inoculum for
each experiment, the bacterium was grown to stationary phase in 5 ml of Nutrient broth
(Difco) with moderate shaking in a 30 °C water bath. The cells were harvested by centrifuging
the cultures at 3000 x g for 10 min. The harvested cells were washed once with 10 ml sterile
distilled water and resuspended in 5 ml sterile distilled water.
Surface water samples were collected from Tillamook Bay during a low tide (-0.8 ft) on
14 July 1996. The sampling site was located approximately 0.9 km ESE of the Pacific Oyster
Company in Bay City, Oregon, near the Oregon Department of Agriculture sampling site 1.
The samples were obtained by placing clean, sterile 500-m1 screw-cap bottles into the water
neck downward and moving the bottles forward as they filled. Vinyl gloves were worn while
collecting the samples to reduce the risk of contamination with skin microflora.
Water samples were collected in a similar manner from the Pacific Ocean shore and
from the Trask River during a low tide (0.5 ft) on 21 July 1996. The ocean water sample was
collected at Rockaway Beach, Oregon, by wading into the surf to a depth of approximately 1
m. The river water sample was collected at the Peninsula site (river mile 14.5) on the Trask
River. All water samples were transported on ice to the Microbiology Laboratory at the
University of Portland, where they were stored at 4 °C. Water temperature and salinity were
measured in the field with a YSI Model 33 salinity meter. The pH of the samples was
measured in the laboratory with a Corning pH meter equipped with an Orion combination pH
probe. The data obtained from these measurements are summarized in Table 2.
Temperature experiment. Nine 50-m1 aliquots of the Tillamook Bay water were
aseptically transferred into separate sterile 125-m1 flasks. A 100111 sample of the water in
each flask was spread onto an EMB agar (Difco) plate to test for background levels of bacteria
that produce typical coliform colonies. Each flask was subsequently inoculated with 500111 of
washed cells from a stationary phase E. colt culture. Serial dilutions were prepared
immediately after adding the inoculum (0 h) and a standard plate count method was used to
determine the concentration of cells added to each flask. Three flasks were incubated at 4 °C
in a laboratory refrigerator, three were incubated at 11 °C in a low temperature incubator
(Precision/GCA, Chicago, IL), and three were incubated at 23 °C in a climate-controlled
laboratory. The number of viable cells in each flask was determined at 24-h intervals for 96 h

8
using a standard plate count method. EMB agar was used for all plate counts to select and
differentiate E. coli colonies.
Salinity experiment. Three 50-m1 aliquots of the Trask River, Tillamook Bay, and
Pacific Ocean shore water samples were aseptically transferred into sterile 125-m1 flasks. A
1001.1 sample of the water in each flask was spread onto an EMB agar plate to test for
background levels of bacteria that produce typical conform colonies. Each flask was
inoculated with 5001.41 of washed cells from a stationary phase E. coil culture and the
concentration of the inoculum in each flask was determined by a standard plate count. The
water samples were incubated at 11 °C in the low temperature incubator and plate counts
were performed at 24-h intervals for 96 h to assess the survival of E. coil in water from the
three locations. EMB agar was used for all plate counts to select and differentiate E. coif
colonies.
Statistical analyses. The MPN index provided a statistical estimate of the
concentration of fecal conforms in each river water sample within a 95% confidence limit. A
KruskAl-Wallis One-Way ANOVA on Ranks was performed to compare the median MPNs of
fecal coliforms at the six sampling sites. Pairwise comparisons between sampling sites were
made with the Student-Newman-Keuls test. The Mann-Whitney rank sum test was used to
compare dry season and wet season median MPNs at each site. A Pearson Product Moment
Correlation test was run to determine whether correlations existed between the MPN of fecal
coliforms, water temperature, salinity, and the concentration of dissolved oxygen.
Each experimental group consisted of two factors in both survival experiments -
temperature and incubation time in the temperature experiment and water source and
incubation time in the salinity experiment. A two-way repeated measures ANOVA was
performed to determine whether either factor produced significant differences in the mean
concentration of viable E. coil cells (log CFU/ml) in each experiment and to test for significant
interactions between the two factors. The data at each sampling time were then analyzed
independently with a one-way ANOVA to pinpoint when significant differences appeared
between temperatures or between the different sources of water. The Student-Newman-Keuls
method was used for pairwise comparisons between experimental groups. Simple linear
regression analyses were performed to determine whether changes in the concentration of
viable cells with time fit a linear model.

9
RESULTS
Seasonal MPNs of fecal conforms. The concentration of fecal conforms was
significantly higher (P < 0.05) at the Hoquarten slough site than at any of the other sampling
sites in the dry season samples (Fig. 3). The median MPN of fecal conforms in the slough at
that time was 900/100 ml. No significant differences were detected among the remaining
sites (P > 0.05), where the median MPN ranged from 30 to 130/100 ml. Subsequent tests
confirmed that the lactose fermentation observed in the MPN dilution series was produced by
fecal conforms. All of the bacteria isolated from the tubes that yielded positive or doubtful
positive reactions were gram negative, nonsporeforming rods which produced acid and gas in
Phenol Red Lactose broth at 44.5 °C.
The concentration of fecal conforms remained highest at the Hoquarten slough site
following the October rains (Fig. 4). The median MPN in the slough at that time was
110,000/100 ml, a 122-fold increase over the dry season median. Despite the substantial
increase in the concentration of fecal conforms in the slough, the median MPN of the wet
season samples did not differ significantly from that of the dry season samples. It also did not
differ significantly from the median MPNs at the Memaloose Point and Third Street bridge
sites. The median MPN of the wet season samples at Memaloose Point (2300/100 ml) was 32
times greater than that of the dry season samples, while the wet season median at the Third
Street bridge site (1600/100 ml) was 12 times greater than the dry season median. Neither of
these differences was statistically significant. Much lower concentrations of fecal conforms
were detected at the three upstream sites. The median MPN at the Highway 101 site
(240/100 ml) did not differ significantly from those at the Memaloose Point and Third Street
bridge sites, but it did differ significantly from the median MPNs at the Peninsula site
(130/100 ml) and at the North Fork site (50/100 ml). Variation in the MPNs at the
downstream sites, where the conform concentrations were very high, had a profound effect on
the outcome of the statistical comparisons.
Correlation of MPNs with temperature, salinity, and dissolved oxygen. The
MPNs of fecal conforms did not correlate significantly with water temperature (P = 0.39) or
salinity (0.83) in the dry season samples, but did correlate strongly with the concentration of
dissolved oxygen (P < 0.01). The correlation of MPNs with dissolved oxygen (DO) was negative
(r = -0.80), with the lowest DO concentration (2.5 mg/1) recorded at the Hoquarten slough site,
10
where the concentration of fecal conforms was highest. The only other significant correlation
noted at that time was a weak negative correlation between temperature and DO (r = -0.52).
Median MPNs of fecal conforms correlated significantly with water temperature (P < 0.01)
and DO (P < 0.01) in the wet season samples. In both cases, the correlations were negative
(r = -0.93 for the correlation between MPN and water temperature; r = -0.93 for the correlation
between MPN and DO). The salinity of the water was below the limit of detection of the field
meter ( < 0.1 g/kg) at all six sites.
Survival of E. coli at different temperatures. The concentration of viable E. colt in
Tillamook Bay water varied significantly with temperature and with time (P < 0.01), and there
was a significant interaction between temperature and time (P < 0.01). The concentrations of
the inocula added to the flasks did not differ significantly at the beginning of the experiment
(P = 0.14) (Fig. 5). The concentration of viable E. colt remained statistically indistinguishable
after 24 h at 4, 11, or 23 °C (P = 0.11), but at 48 h the flasks incubated at 4 °C had a
significantly higher concentration of viable E. colt than the flasks incubated at 11 or 23 °C
(P < 0.05). At 72 and 96 hours, the concentration of surviving E. coli differed significantly at
all three temperatures (P < 0.05). The flasks incubated at 4 °C maintained the highest
concentration of viable cells, while the flasks incubated at 23 °C had the lowest
concentration. No data point appears for the 23 °C treatment at 96 h in Fig. 5 because the
concentration of E. colt at this point was below the level of detection in this experiment (less
than 103 CFU/ml). The concentration of viable E. colt did not change significantly throughout
the experiment at 4 °C (P = 0.14), while it decreased linearly at 11 °C (r = 0.98) and at 23 °C
(r = 0.97).
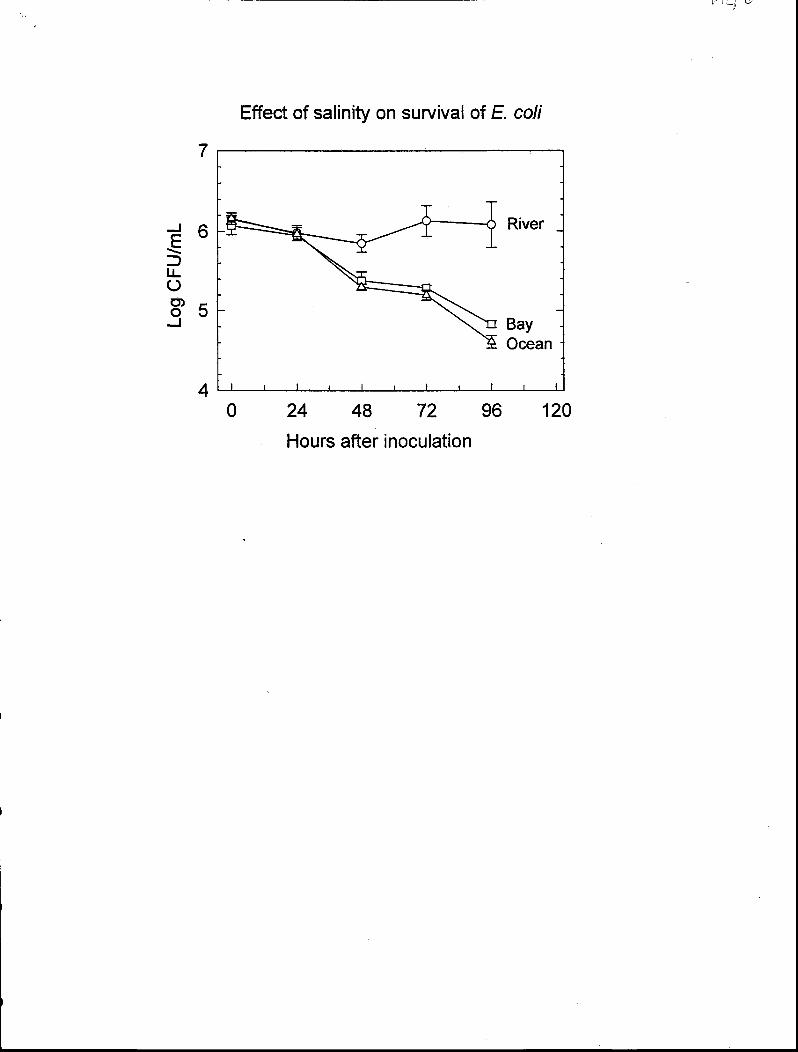
Survival of E. coli at different salinities. The concentration of viable E. colt in river
water, ocean water, and bay water varied significantly with the source of the water and with
incubation time (P < 0.01), and there was a significant interaction between the source of
water and time (P < 0.01) in this experiment. No differences were detected among the three
sources of water at 0 h (P = 0.73) and 24 h (P = 0.96), but at 48 h both the bay water and the
ocean water contained significantly lower concentrations of viable E. colt than the river water
(P < 0.05) (Fig. 6). The concentration of E. colt remained lower in the bay water and ocean
water than in the river water at 72 h and 96 h, but at no time was a difference detected
between the bay and ocean water (P < 0.05). The concentration of viable E. colt decreased

11
linearly in the bay water (r = 0.97) and ocean water (r = 0.97), while it remained unchanged in
the river water (P = 0.98) throughout the experiment.
DISCUSSION
Tillamook Bay is a drowned river valley estuary in which fresh water from five major
rivers mixes with salt water from the Pacific Ocean. The Miami, Kilchis, Wilson, Trask, and
Tillamook rivers drain a watershed consisting of 147,200 ha. Almost 10,000 ha within the
watershed is agricultural land which is used primarily for pasture, hay, and silage production
for dairy herds that occupy the lowlands adjacent to the bay and its tributaries. The dairy
herds produce approximately 292,500 metric tons of manure annually.
The climate of the Tillamook Bay watershed is characterized by short summers and
mild, extended, wet winters. Annual rainfall in the area averages 230 to 380 cm, and surface
water runoff from dairy farms constitutes a major nonpoint source of fecal contamination in
the bay. In 1982 funds were received from the Rural Clean Water Program (RCWP) to initiate
a project to improve water quality in the Tillamook Bay watershed. Information regarding the
effectiveness of the project is inconsistent. According to an RCWP report (47), implementation
of best management practices on 48% of the contracted critical areas in the watershed
reduced the number of restricted oyster beds sites from twelve to six between 1982 and 1991.
The most recent Oregon DEQ Water Quality Status Report (42) states that six of the 16 sites
that are sampled monthly to monitor levels of fecal contamination were downgraded in their
classification for shellfish harvesting between 1991 and 1993. Fecal contamination from
agricultural land and other sources constitutes a potential health risk for the commercial
shellfish industry in Tillamook Bay and for those who use the area for fishing, boating, clam
digging, or other recreational activities. Continued efforts to monitor and improve water
quality in the bay and its tributaries are essential.
Our data indicate that the Trask River carries a substantial load of fecal coliforms and
that the concentration increases sharply following a heavy rainfall. Statistical analyses failed
to detect significant differences between the dry season and wet season concentrations of fecal
coliforms, despite the much higher MPNs at the downstream sites following the October rains.
The failure to substantiate the differences between sampling times with statistical tests reveals
the inherent inaccuracy of MPN estimations of bacterial populations. There is a seven- to ten-

12
fold difference between the upper and lower limits of the 95 percent confidence interval for a
five-tube MPN index, and this range is amplified when a dilution factor is included in the
estimation of population density. The large differences in the MPNs of water samples from the
same site, which differed by as little as one positive tube in the fermentation series, made it
impossible to substantiate differences between sampling times at the most heavily
contaminated sites.
We were able to detect significant differences among the six sites at each sampling time.
The three downstream sites contained the highest concentrations of fecal coliforms. Hoquarten
slough yielded substantially higher concentrations than any other site at both sampling times,
and the 122-fold increase in the MPN following the October rains was the largest difference
between the wet season and dry season samples at any site . The concentration of dissolved
oxygen in the slough was very low (2.5 mg/1) at both sampling times, which is consistent with a
high level of biological activity in a stagnant or slow moving body of water. DO concentrations
at the other sites were 1.4 to 3.0 mg/1 higher after the fall rains, when the current of the river
was noticeably stronger. We did not measure stream velocity in this study, but were aware of
the difference due to the difficulty in obtaining samples at the later sampling time.
The Hoquarten slough site is located on U. S. Highway 101, within the city limits of
Tillamook, Oregon. Several commercial developments are located alongside the slough at this
location, and the surrounding land is predominantly agricultural. In May 1995 the U. S.
Environmental Protection Agency (USEPA) cited a local dairy for discharging pollutants into
the slough in violation of the federal Clean Water Act. The complaint against the dairy was
settled in 1996 without an admission or denial of responsibility (58).
The next highest concentrations of fecal coliforms occurred at the Memaloose Point and
Third Street bridge sites. In the dry season samples, neither site differed significantly from
the other sites on the Trask River, though the Third Street bridge site was the only location
other than Hoquarten slough at which the median MPN was higher than 100/100 ml. In the
wet season samples, the MPNs at both sites exceeded 2000/100 ml. The median MPN at the
next upstream site, the Highway 101 bridge, was 10-fold lower, despite its close proximity to
pasture land. Memaloose Point is located in the channel formed by the convergence of the
Tillamook River and Trask River as they enter Tillamook Bay. The site was chosen to
represent a nonpoint source of fecal contamination from agricultural runoff and to determine

13
the concentration of fecal coliforms entering the bay at a major inlet. The Third Street and
Highway 101 sites were chosen to represent point sources of fecal contamination resulting
from outfall from sewage treatment facilities. The Third Street bridge site is located 0.1 river
mile downstream from the Tillamook sewage treatment plant while the Highway 101 bridge
site is located 1 river mile downstream from the sewage treatment ponds near the Tillamook
airport.
Our data suggest that outfall from the Tillamook sewage treatment facility might
contribute to fecal contamination in the Trask River following a heavy rainfall, though we
have been unable to determine whether the facility discharges excess waste during storms. It
is also possible that the high concentrations of fecal conforms at the Memaloose Point and
Third Street bridge sites resulted from an accumulation of bacterial contaminants in the
lowland area where the flow rate of the river slows considerably. We did not measure stream
velocity in this study, but recommend that it be included in future bacteriological studies.
Fecal conform concentrations were progressively lower at each site upstream of the Highway
101 bridge site in the wet season samples, which is consistent with a downstream
accumulation of pollutants. The MPNs at the two uppermost locations, the Peninsula and
North Fork sites, were similar to those measured during the dry season. The MPNs at these
sites, which ranged from 23 to 170/100 ml, may represent a base concentration of fecal
coliforms that enter the Trask River from sources that are not affected by seasonal changes in
surface water runoff.
Much more information must be gathered to accurately identify the primary sources of
fecal contamination in the Tillamook Bay watershed and to design effective resource
management practices that will minimize the risk to human health and to the estuarine
environment. Similar conditions forced the closure of several commercial shellfish growing
areas in Puget Sound by the Washington State Department of Social and Health Services in
1978 (57). Preliminary investigations identified failing septic systems and small,
noncommercial farms as the primary sources of fecal contamination (12, 15). Subsequent
repair of the septic systems and implementation of improved livestock management practices
significantly reduced the load of fecal coliforms, but not sufficiently to comply with state
water quality standards. Further investigations revealed that fecal bacteria had adapted to
the freshwater stream environment and that the bacteria were capable of proliferating in

14
stream sediment when organic nutrients were deposited by runoff from fields and livestock
waste (57).
Several studies have shown that fecal bacteria can survive and, under certain
conditions, even grow to a limited extent in marine and freshwater sediments (1, 11, 19, 24,
36). Bacteria adsorbed to sediment particles may feed on nutrients associated with the
particles and receive protection from ultraviolet radiation (4), high salinity (20), heavy metal
toxicity (28), and bacteriophage infection (51). These bacteria may act as a reservoir of fecal
contaminants in aquatic environments. Physical forces such as storms, natural upwellings,
sediment disturbances by benthic invertebrates, currents, or wave action can resuspend the
bacteria in the overlying water.
The survival of fecal bacteria in estuarine and marine habitats has been studied
extensively for many years. The conclusion reached in most studies is that nonindigenous
bacteria do not survive for more than a few days or hours in saltwater environments. Several
factors contribute to the steady decline in the number of culturable bacteria, the most
important being short wavelength ultraviolet radiation in sunlight (5, 10, 32, 55). Other
important factors include salinity (45), temperature (48), the growth stage of the bacteria (17),
competition with other organisms (27), predation by protozoa (14, 49), low nutrient
concentrations (18), and toxic substances in the water (28).
We found that temperature significantly affected the survival of E. coli in water samples
from Tillamook Bay. The water temperatures that we measured in the bay varied from a low of
10 °C near the center of the bay during a preliminary sampling trip in March 1996 to a high of
19 °C in a shallow tide pool on a mild, sunny day in April 1996. The 11 °C incubation
temperature most closely represented the mean daily temperature of the water in Tillamook
Bay. The concentration of viable E. coif. decreased by 98% over a 96-h period at this
temperature, though a substantial number of bacteria remained in the water due to the high
concentration of the inoculum in this experiment. The bacteria died more rapidly in bay water
incubated at 23 °C.
None of the temperatures included in the experiment is lethal for E. coil, a mesophilic
bacterium which grows optimally at 37 °C and tolerates temperatures as high as 45 °C.
Therefore, additional abiotic or biotic factors must have caused the bacterium to die more
rapidly at the higher temperatures, such as a more rapid depletion of available nutrients,

15
increased predation by protozoa, or increased sensitivity to toxic substances that may have
been present in the water. The linear decrease in the log number of cells with time at 11 and
23 °C indicates that the bacteria died exponentially at these temperatures. Exponential
death occurs when a bacterial population is unable to maintain itself in stationary phase and
enters the death phase of its growth cycle.
Salinity also affected the survival of E. coll. in our experiments, though the effect was not
as pronounced as that of incubation temperature. We selected river water, bay water, and
ocean water to represent the natural extremes of salinity that fecal contaminants would be
expected to encounter in the Tillamook Bay watershed, and high salinity was probably a
major factor contributing to the more rapid death rate in the bay water and ocean water as
compared to the river water. The salinity of the bay water (10.2 g/kg) apparently exceeded a
threshold level that E. coll. tolerates, causing the bacterium to die exponentially. The rate of
death in this experiment was similar to that observed in bay water at the same incubation
temperature (11 °C) in the temperature experiment. The higher salinity of the ocean water
(18.8 g/kg) did not produce a more rapid death rate. The bay water used in this experiment
was collected during a low tide (-0.8 ft), so the salinity of the water was likely to be near the
low end of the normal range encountered in the bay.
Salinity was not the only factor that differed among the water samples used in this
experiment. The pH varied from 7.5 in the river water to 8.1 in the ocean water, and several
other abiotic and biotic factors that we did not measure may have also affected the survival of
the bacteria. The lack of any evident decline in the concentration of viable E. coli in the river
water over a 96-h period has important implications for the quality of the water in Tillamook
Bay. The results suggest that fecal contaminants entering the Trask River, and possibly the
other rivers that drain into the bay, are capable of surviving in river water for several days
and may not begin to decline in numbers until they reach the more saline environment of the
bay.
Our measurements of bacterial survival in bay water, like those in many previous
investigations, depended upon the ability to culture E. coll. from water samples inoculated
onto a standard bacteriological culture medium. Several studies have shown that
measurements of this type may underestimate the actual number of viable, and potentially
infective, bacteria in marine or estuarine water (22). Studies comparing the number of viable

16
bacteria detected by standard plate counts with the number detected by a direct viable count
method (34) have demonstrated that enteric bacteria may enter a viable but not culturable
state upon exposure to a saltwater environment (44, 61). These dormant (56) or starved (40)
bacteria remain physiologically active, and pathogens may remain capable of producing an
infection, but they lose the ability to grow in standard culture media. Cells that have entered
this physiological state are not detected as "viable" cells by standard plate counts or by MPN
determinations. It is possible that the apparent decline in the number of viable E. colt in our
experiments may have resulted from such a change in the physiology of the bacteria. This
phenomenon also has important implications for the data collected by routine monitoring of
Tillamook Bay, which relies on MPN determinations that may underestimate the level of fecal
contamination.
Most enteric bacteria are not indigenous to estuarine or marine habitats, though some
species - notably Vibrio cholerae, V. parahemolyticus, and Aeromonas hydrophila - naturally
inhabit these environments (9, 29, 31). Both indigenous and nonindigenous populations may
enter the viable but not culturable state (8, 43, 53). Indigenous species not only survive in this
condition, but also can grow when essential nutrients become available. Suitable nutrients may
be supplied by surface water runoff or wastewater outfall in coastal environments (50, 60).
These nutrients may also enable animal pathogens to grow, thereby affecting the health of
aquatic wildlife (26, 30) or waterfowl (16).
It was once thought that large bodies of water rapidly and effectively dilute pollutants to
the point at which the concentration of bacterial pathogens was well below that required to
affect human or animal health. Several studies have shown, however, that particulate wastes
remain associated rather than dispersing. Bacterial cells may settle into marine sediments,
move collectively in ocean currents, attach to surfaces or to one another to form stable biofilms,
or aggregate into droplets that are carried to shore by waves or in windblown aerosols (13, 23,
37, 39). Stable aggregates of bacterial cells may be counted as single colonies on standard plate
counts or as single units in MPN determinations, contributing to the underestimation of bacterial
contamination by these enumeration methods. Careful, repeated monitoring is essential to
understand the fate of fecal contaminants in coastal waters and to assess the potential impact on
human health and on the health of the wildlife that inhabits these areas.

17
We have collected a limited amount of data in this study, but hope that our results will
provide a useful starting point for the design of more extensive investigations of the sources and
fate of fecal contaminants in the Tillamook Bay watershed. Future studies should examine the
rate at which fecal bacteria enter each of the rivers that drain into the bay and correlate these
loading rates with potential point and nonpoint sources of fecal contamination and with
hydrologic parameters such as rainfall and stream flow. It would also be useful to study the
survival of fecal bacteria in freshwater and estuarine sediments and to correlate these
observations with bacterial concentrations in the overlying water. The effects of key
environmental factors such as organic and inorganic nutrients, sunlight, temperature, and
salinity should be included in these investigations. Other enumeration methods should be used
to supplement MPN estimates, and other indicator organisms should be examined in addition to
fecal coliforms. Numerous studies have shown that concentrations of fecal coliforms often
correlate poorly with concentrations of other enteric organisms, such as vibrios, salmonellae,
and enteric viruses (25, 35, 41, 48, 54). As a result, water quality regulations based on
concentrations of enterococci and E. coll have been proposed by the U. S. Environmental
Protection Agency and adopted by several states (6, 59).

18
REFERENCES
1. Ashbolt, N. J., G. S. Grohmann, and C. Kueh. 1993. Significance of specific bacterial
pathogens in the assessment of polluted receiving waters of Sydney. Water Sci. Technol.
27: 449-452.
2. Bej, A. K., R. J. Steffan, J. DiCesare, L. Haft and R. M. Atlas 1990. Detection of
coliform bacteria in water by polymerase chain reaction and gene probes. Appl. Environ.
Microbiol. 56:307-314.
3. Berg, J. D., and L. Fiksdal. 1988. Rapid detection of total and fecal coliforms in water
by enzymatic hydrolysis of 4-methylumbelliferone-6-D-galactoside. Appl. Environ.
Microbiol. 54:2118-2122.
4. Bitton, G., Y. Henis, and N. Lahay. 1972. Effect of several clay minerals and humic
acid on the survival of Klebsiella aerogenes exposed to ultraviolet irradiation. Appl.
Microbiol. 23:870-874.
5. Chamberlin, C. E., and R. Mitchell. 1978. A decay model for enteric bacteria in natural
waters, pp. 325-348. In R. Mitchell (ed.), Water Pollution Microbiology, vol. 2. Wiley, New
York.
6. Chasis, S., K. Mooney, A. McLain, and B. Hanson. 1992. Testing the waters: A
national perspective on beach closings. Report of the Natural Resources Defense Council.
Natural Resources Defense Council, New York.
7. Clark, D. L., B. B. Milner, M. H. Stewart, R. L. Wolfe, and B. H. Olson. 1991.
Comparative study of commercial 4-methylumbellifery1-6-D-glucuronide preparations with
the Standard Methods membrane filtration fecal conform test for the detection of
Escherichia coil in water samples. Appl. Environ. Microbiol. 57:1528-1534.
8. Colwell, R. R., P. R. Brayton, D. J. Grimes, D. B. Roszak, S. A. Hug, and L. M.
Palmer. 1985. Viable but non-culturable Vibrio choierae and related pathogens in the
environment: implications for release of genetically engineered microorganisms.
Bio/Technol. 3:817-820.

19
9. Colwell, R. R., R. J. Seidler, J. Kaper, S. W. Joseph, S. Garges, H. Lockman, D.
Maneval, H. Bradford, N. Roberts, E. Remmers, I. Huq, and A. Huq. 1981.
Occurrence of Vibrio cholerae serotype 101 in Maryland and Louisiana estuaries. Appi.
Environ. Microbiol. 41:555-558.
10. Davies, C. M., and L. M. Evison. 1991. Sunlight and the survival of enteric bacteria in
natural waters. J. Appi. Bacteriol. 70:265-274.
11. Davies, C. M., J. A. H. Long, M. Donald, and N. J. Ashbolt. 1995. Survival of fecal
microorganisms in marine and freshwater sediments. Appi. Environ. Microbiol. 61:1888-
1896.
12. Determan, T., B. Carey, W. Chamberlain, and D. Norton. 1985. Sources affecting the
sanitary conditions of water and shellfish in Minter Bay and Burley Lagoon. Washington
State Department of Ecology Report No. 84-10.
13. Duedall, I. W., B. H. Ketchum, P. K. Park, and D. R. Kester (eds.). 1983. Wastes in
the Ocean, vol. 1. Industrial and Sewage Wastes in the Ocean. Wiley, New York.
14. Enzinger, R. M., and R. C. Cooper. 1976. Role of bacteria and protozoa in the removal
of Escherichia coil from estuarine waters. Appi. Environ. Microbiol. 31:758-763.
15. Erkenbreche, C. 1981. Sediment bacterial indicators in an urban shellfishing subestuary
of the Lower Chesapeake Bay. Appi. Environ. Microbiol. 42:484-492.
16. Friend, M. 1985. Wildlife health implications of sewage disposal in wetlands, pp. 262-
267. In P. J. Godfrey, E. R. Kaynor, S. Pelczarski, and J. Benforado (eds.), Ecological
Considerations in Wetlands Treatment of Municipal Wastewaters. Van Nostrand
Reinhold, New York.
17. Gauthier, M. J., G. N. Flatau, R. L. Clement, and P. M. Munro 1992. Sensitivity of
Escherichia coil. cells to seawater closely depends on their growth stage. J. Appl.
Bacteriol. 7 3:257-262.
18. Gauthier, M. J., P. M. Munro, and V. A. Breittmayer. 1989. Influence of prior growth
conditions on low nutrient response of Escherichia colt in seawater. Can. J. Microbiol.
35:379-383.

20
19. Gerba, C. P., and J. S. McLeod. 1976. Effect of sediments on the survival of Escherichia
colt in marine waters. Appl. Environ. Microbiol. 32:114-120.
20. Ghoul, M., T. Bernard, and M. Cormier. 1986. Evidence that Escherichia colt
accumulates glycine betaine from marine sediment. Appl. Environ. Microbiol. 56:551-554.
21. Greenberg, A. E., L. S. Clesceri, and A. D. Eaton (ed.). 1992. Standard methods for
the examination of water and wastewater, 18th ed. American Public Health Association,
Washington, D.C.
22. Grimes, D. J., R. W. Atwell, P. R. Brayton, L. M. Palmer, D. B. Roszak, F. L.
Singleton, M. L. Tamplin, and R. R. Colwell. 1986. The fate of enteric pathogenic
bacteria in estuarine and marine environments. Microbiol. Sci. 3: 324-329.
23. Hargrave, B. T. 1984. Sinking of particulate matter from the surface water of the ocean,
pp. 155-178. In J. E. Hobbie and P. B. Williams (eds.), Heterotrophic Activity in the Sea.
Plenum Press, New York.
24. Hood, M. A., and G. E. Ness. 1982. Survival of Vibrio cholerae and Escherichia con in
estuarine waters and, sediments. Appl. Environ. Microbiol. 43:578-584.
25. Hood, M. A., G. E. Ness, G. E. Rodrick, and N. J. Blake. 1983. Distribution of Vibrio
cholerae in two Florida estuaries. Microb. Ecol. 9:65-75.
26. Huq, A., E. B. Small, P. A. West, M. I. Huq, R. Rahman, and R. R. Colwell. 1983.
Ecological relationships between Vibrio cholerae and planktonic crustacean copepods.
Appl. Environ. Microbiol. 45:275-283.
27. Jannasch, H. W. 1988. Competitive elimination of Enterobacteriaceae from seawater.
Appl. Environ. Microbiol. 16:1616-1618.
28. Jones, G. E. 1964. Effect of chelating agents on the growth of Escherichia colt in
seawater. J. Bacteriol. 87:484-499.
29. Joseph, S. W., R. R. Colwell, and J. Kaper. 1982. Vibrio parahaemolyticus and
related halophilic vibrios. CRC Crit. Rev. Microbiol. 10:77-124.

21
30. Kaneko, T., and R. R. Colwell. 1978. The annual cycle of Vibrio parahaemolyticus in
Chesapeake Bay. Microb. Ecol. 4:135-155.
31. Kaper, J., H. Lockman, R. R. Colwell, and S. W. Joseph. 1981. Aeromonas
hydrophila: ecology and toxigenicity of isolates from an estuary. J. Appl. Bacterial.
50:359-377.
32. Kapuscinski, R. B., and R. Mitchell. 1981. Solar radiation induces sublethal injury in
Escherichia coli in seawater. Appl. Environ. Microbial. 41:670-674.
33. Koch, A. L. 1994. Growth measurement. In P. Gerhardt, R. G. E. Murray, W. A. Wood,
and N. R. Krieg (ed.), Methods for General and Molecular Bacteriology. American Society
for Microbiology, Washington, D.C.
34. Kogure, K., U. Simidu, and N. Taga. 1979. A tentative direct microscopic method for
counting living marine bacteria. Can. J. Microbial. 25:415-420.
35. Koh, E. G. L., J-H. Huyn, and P. A. LaRock. 1994. Pertinence of indicator organisms
and sampling variables to vibrio concentrations . Appl. Environ. Microbial. 60:3897-3900.
36. LaLiberte, P., and D. J. Grimes. 1982. Survival of Escherichia coil in lake bottom
sediment. Appl. Environ. Microbial. 43:623-628.
37. Liu, D., Y. L. Lau, Y. K. Chau, and G. J. Pacepavicius. 1993. Characterization of
biofilm development on artificial substratum in natural water. Water Res. 27:361-367.
38. Marshall, K. C. 1985. Bacterial adhesion in oligotrophic habitats. Microbial. Sci. 2:321-
326.
39. McFeters, G. A., and D. G. Stuart. 1972. Survival of conforms in natural water: Field
and laboratory studies with membrane filter chambers. Appl. Microbial. 24:805-811.
40. Morita, R. Y. 1985. Starvation and miniaturisation of heterotrophs, with special
emphasis on maintenance of the starved viable state, pp. 111-130. In M. Fletcher and G.
D. Floodgate (eds.), Bacteria in Their Natural Environments. Academic Press, Orlando.
41. Oliver, J. D., R. A. Warner, and D. L. Cleland. 1983. Distribution of Vibrio uutnificus
in the marine environment. Appl. Environ. Microbial. 45:985-998.

22
42. Oregon Department of Environmental Quality. 1994. Estuary and coastal water
quality. Oregon's 1994 Water Quality Status Assessment Report, Section 3.5.
43. Palmer, L. M., A. M. Baya, D. J. Grimes, and R. R. Colwell. 1984. Molecular genetic
and phenotypic alteration of Escherichia colt in natural water microcosms containing
toxic chemicals. FEMS Microbiol. Lett. 21:169-173.
44. Peele, E. R. and R. R. Colwell. 1981. Application of a direct microscopic method for
enumeration of substrate-responsive marine bacteria. Can. J. Microbiol. 27:1071-1075.
45. Pike, E. B., A. H. L. Gameson, and D. J. Gould. 1970. Mortality of coliform bacteria in
seawater samples in the dark. Rev. Int. Oceanogr. Med. 18/19:97-107.
46. Pommepuy, M., J. J. F. Guillard, E. Duprey, A. Derrien, F. LeGuyader, and M.
Cormier. 1992. Enteric bacteria survival factors. Water Sci. Technol. 25:93-103.
47. Rural Clean Water Program Report. 1996. Oregon Tillamook Bay (RCWP 18).
http://h2osparc.wq.ncsu.edujinfoircwp/orprof.html.
48. Rhodes, M. W., and H. I. Kator. 1988. Survival of Escherichia colt and Salmonella
spp. in estuarine environments. Appl. Environ. Microbiol. 54:2902-2907.
49. Rhodes, M. W., and H. I. Kator. 1990. Effects of sunlight and autochthonous microbiota
on Escherichia colt survival in an estuarine environment. Curr. Microbiol. 21:65-73.
50. Rippey, S. R., and V. J. Cabelli. 1979. Membrane filter procedure for enumeration of
Aeromonas hydrophila in fresh waters. Appl. Environ. Microbiol. 38:108-113.
51. Roper, M. M., and K. C. Marshall. 1979. Effects of salinity on sedimentation and of
particulates on survival of bacteria in estuarine habitats. Geornicrobiol. J. 1:103-116.
52. Roszak, D. B., and R. R. Colwell. 1987. Survival strategies of bacteria in the natural
environment. Microbiol. Rev. 51:365-379.
53. Roszak, D. B., D. J. Grimes, and R. R. Colwell. 1984. Viable but nonrecoverable stageof Salmonella enteritidis in aquatic systems. Can. J. Microbiol. 30:334-338.

23
54. Shiaris, M. P., A. C. Rex, G. W. Pettibone, K. Keay, P. McMacus, M. A. Rex, J.
Ebersole, and E. Gallagher. 1987. Distribution of indicator bacteria and Vibrio
parahaemolyticus in sewage-polluted sediments. Appl. Environ. Microbiol. 53:1756-
1761.
55. Sinton, L. W., R. J. Davies-Colley, and R. G. Bell. 1994. Inactivation of enterococci
and fecal conforms from sewage and meatworks effluents in seawater chambers. Appl.
Environ. Microbiol. 60:2040-2048.
56. Stevenson, L. H. 1978. A case for bacterial dormancy in aquatic systems. Microb. Ecol.
4:127-133.
57. Struck, P. H. 1988. The relationship between sediment and fecal conform levels in a
Puget Sound estuary. J. Environ. Health 50:403-407.
58. Tillamook Headlight-Herald. 1996. Clean water act allegedly violated. 4 September
1996, p. A2.
59. U. S. Environmental Protection Agency. 1985. Test methods for Escherichia colt and
enterococci in water by the membrane filter procedure. EPA-600/4-85/076, pp. 1-25. U. S.
Environmental Protection Agency, Washington, D.C.
60. Watkins, W. D., and V. J. Cabelli. 1985. Effect of fecal pollution on Vibrio
parahaemolyticus densities in an estuarine environment. Appl. Environ. Microbiol.
49:1307-1313.
61. Xu, H-S., N. Roberts, F. L. Singleton, R. W. Atwell, D. J. Grimes, and R. R. Colwell.
1982. Survival and viability of nonculturable Escherichta coli and Vibrio cholerae in the
estuarine and marine environment. Microb. Ecol. 8:313-323.

TABLE 1. Water temperature, salinity, and dissolved oxygen concentrations at
the six sampling sites on the Trask River and Hoquarten slough.
Sampling site Temperature (° C) Salinity (g/kg) DissolvedOxygen (mg/1)
31 July 1996
Memaloose Point 16.5 7.5 6.8
Hoquarten slough 16.5 1.2 2.5
Third Street bridge 18.0 0.8 7.4
Hwy 101 bridge 16.0 0.1 8.6
Peninsula 15.0 0.1 9.5
North Fork 12.5 0.0 9.8
19 October 1996
Memaloose Point 9.0 0.0 8.5
Hoquarten slough 10.5 0.0 2.4
Third Street bridge 8.5 0.0 10.4
Hwy 101 bridge 9.0 0.0 11.0
Peninsula 8.5 0.0 11.1
North Fork 8.0 0.0 11.2
24

TABLE 2. Water temperature, salinity, and pH of water samples collected from
Tillamook Bay, the Pacific Ocean shore (Rockaway Beach), and the Trask River
for the bacterial survival experiments.
Sampling site Temperature (° Salinity (g/kg) pH
Trask River 15 0.1 7.5
Tillamook Bay 14 10.2 7.7
Rockaway Beach 15 18.8 8.1
25

26
FIGURE LEGENDS
FIG 1. Location of the sampling sites on the Trask River and Hoquarten slough. Site 1 =
Memaloose Point. Site 2 = Hoquarten slough. Site 3 = Third Street bridge. Site 4 = Highway
101 bridge. Sites 5 and 6 (Peninsula and North Fork sites) are not shown.
FIG 2. Views of the sampling sites on the Trask River and Hoquarten slough. (A) Memaloose
Point. (B) Hoquarten slough. (C) Third Street bridge. (D) Highway 101 bridge. (E) Peninsula.
(F) North Fork.
FIG 3. Mean MPN of fecal coliform bacteria at the six sampling sites on the Trask River and
Hoquarten slough on 31 July 1996 (dry season samples). Data are the means of three
replications. Error bars are the standard error of the means.
FIG 4. Mean MPN of fecal coliform bacteria at the six sampling sites on the Trask River and
Hoquarten slough on 19 October 1996 (wet season samples). Data are the means of three
replications. Error bars are the standard error of the means.
FIG. 5. Survival of Escherichia colt strain K12 in Tillamook Bay water incubated at 4, 11, or
23 °C. Data are the means of three replications. Error bars indicate the standard error of the
means. No data point appears for the 23 °C treatment at 96 h because the concentration of
E. colt at this point was below the level of detection in this experiment ( < 10 3 CFU/ml).
FIG 6. Survival of Escherichia colt strain K12 at 11 °C in water samples collected from the
Trask River, Tillamook Bay, or the Pacific Ocean shore. Data are the means of three
replications. Error bars indicate the standard error of the means.


Fecal Coliform Concentrations in the Trask River
31 July 1996
14001. Memaloose Point
12002. Hoquarten Slough
1000
3. Third St. Bridge
800 4. Hwy 101 Bridge
5. Peninsula600
400 -
200
0
6. North Fork
1 2
T
3 4 5 6
Site Number

Fecal Coliform Concentrations in the Trask River
19 October 1996
120000 1. Memaloose Point
100000 — 2. Hoquarten Slough
80000 - 3. Third St. Bridge
4. Hwy 101 Bridge0 60000 —z 5. Peninsula
6. North Fork3000
w 2000
1000
01 2 3 4
5
6
Site Number

Effect of temperature on survival of E. coil
24 48 72 96
120Hours after inoculation
Effect of salinity on survival of E. coli
7
E6
L0o 5
24 48 72 96 120
Hours after inoculation