TOT School Blueprint module - University of South...
27
1 1
Transcript of TOT School Blueprint module - University of South...
1 1
2
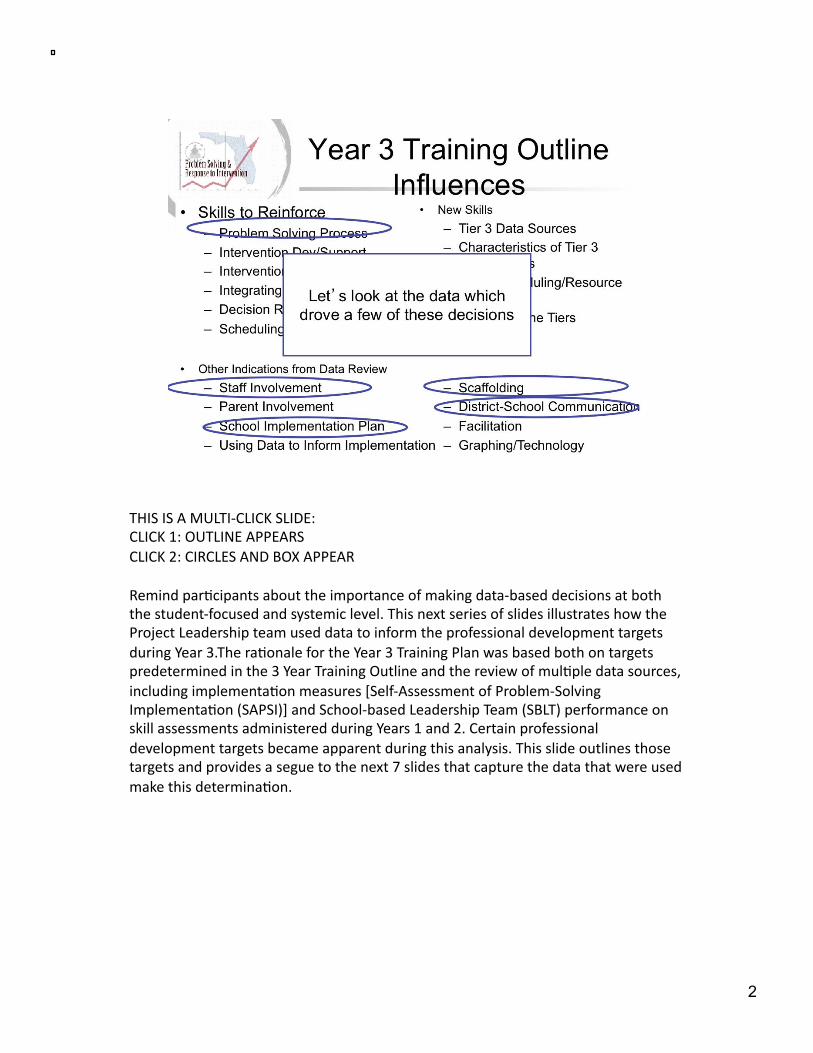
THIS IS A MULTI-‐CLICK SLIDE: CLICK 1: OUTLINE APPEARS CLICK 2: CIRCLES AND BOX APPEAR
Remind par@cipants about the importance of making data-‐based decisions at both the student-‐focused and systemic level. This next series of slides illustrates how the Project Leadership team used data to inform the professional development targets during Year 3.The ra@onale for the Year 3 Training Plan was based both on targets predetermined in the 3 Year Training Outline and the review of mul@ple data sources, including implementa@on measures [Self-‐Assessment of Problem-‐Solving Implementa@on (SAPSI)] and School-‐based Leadership Team (SBLT) performance on skill assessments administered during Years 1 and 2. Certain professional development targets became apparent during this analysis. This slide outlines those targets and provides a segue to the next 7 slides that capture the data that were used make this determina@on.

3 3
This slide includes a graphic display of data gathered across the first two years of the Project through the administra@on of the SAPSI. The items depicted on this graph appear in the Consensus sec@on of the instrument.
Explain to par@cipants that the circled item pertains to the degree to which faculty/staff support and are ac@vely involved with PS/RtI . Although the SBLTs reported growth in this area during the first two years of the Pilot Project, at the end of the 08-‐09 school year the average score across Pilot Schools was s@ll rela@vely low (i.e., approximately 1.5). Based on these data, the Project Leadership Team determined that during the third year of the Pilot Project efforts should be made to support Pilot Schools in bolstering faculty involvement with PS/RtI implementa@on
3

4
This slide includes a graphic display of data gathered across the first two years of the Project through the administra@on of the SAPSI. The items depicted on this graph appear in the Implementa@on sec@on of the instrument.
Explain to par@cipants that the circled items pertain to the use of a strategic plan for PS/RtI implementa@on and communica@on between the district and the school. Although the SBLTs reported growth in these areas during the first two years of the Pilot Project, at the end of the 08-‐09 school year the average score for these items across Pilot Schools was s@ll rela@vely low (i.e., approximately 1.5). Based on these data, the Project Leadership Team determined that during the third year of the Pilot Project efforts should be made to support Pilot Schools in the development of a strategic plan for implementa@on of PS/RtI and to help increase communica@on between the SBLTs and district leadership.

5
THIS IS A MULTI-‐CLICK SLIDE: CLICK 1: COLUMN ON LEFT APPEARS CLICK 2: COLUMN ON RIGHT AND GRAY BOXES APPEAR
This slide provides a summary of the training targets iden@fied by the Project Leadership Team based on the review of the Pilot School implementa@on and skill assessment data. The column on the lec lists the specific training targets and the column on the right indicates the methods by which those needs would be met.
This NASDSE document was created using an analogy of a “blueprint” in construc@on or architecture and draws on both experience and research as guidelines for implementa@on. The intent is to provide school-‐based teams with cri@cal informa@on about how to construct a sound implementa@on plan, and yet allow enough variability that the plan can reflect the unique needs and resources of the school. That is, guidance as to where to put the walls so that the structure is sound, but not what color to paint the walls.
The Blueprint uses a “three-‐column” format: Column 1: Cri@cal implementa@on components are iden@fied and described Column 2: Resources that teams can use in building their PS/RtI model Column 3: Wisdom from the field—prac@cal informa@on from experts in RtI
implementa@on The blueprint is designed for use by both early implementers, as well as veteran implementers by providing a holis@c, step-‐wise approach, but also a self-‐assessment process built into the document to allow teams to review and evaluate exis@ng prac@ces and iden@fy implementa@on gaps.
6

7
This slide can be used to facilitate discussion among par@cipants regarding how @me for building consensus can be incorporated into school schedules, examples of consensus building tools, and the importance of addressing consensus prior to addressing infrastructure and implementa@on.
8
9
10
11
The succeeding slides depict ac@vi@es, informa@on, and/or resources that were used with school-‐based teams to help them develop their own school building level implementa@on plan.
An overview of the NASDSE blueprint is included in Supplemental Materials.
11
12
Overview of Consensus Sec@on – Orient teams to those pages in SBLT Blueprint from NASDSE (pp. 5-‐14). Highlight 5 basic ac@vi@es involved in this sec@on.
Give approx. 10 minutes for team to review sec@on.
12

13
(approx. 10 minutes) Ask teams to assign persons to facilitate, take notes, and monitor @me.
Make sure teams understand, if not already men@oned, that the ac@vi@es presented here are meant to get them started. If they are able to complete the ac@vi@es in the @me frame given, good. If not, they will need to work together back at their schools to complete them.
13
14
Ac@vity is included in Supplemental Materials. Allow teams approximately 15 to 20 minutes to work on this ac@vity.
14
15
This ac@vity is included within Supplemental Materials. Allow teams 15 to 20 minutes to work on this ac@vity.
15
16
This ac@vity is included in Supplemental Materials. Allow teams 15 to 20 minutes to work on this ac@vity.
16
17
This ac@vity is included in Supplemental Materials. Allow teams 15 to 20 minutes to work on this ac@vity. Remind teams that what they don’t finish now should be completed within the context of team @me at their school.
17
Included in the Supplemental Materials are Tier 1 and Tier 2 Planning Sheets as well as guiding ques@ons for teams to consider/complete. The emphasis is on team structure and format, and also data management at Tier 2.
The third part of the building level implementa@on plan (Implementa@on) includes 7 ac@ons for school-‐based teams. Included in these ac@ons are implemen@ng a data management system, provision of ongoing professional development, regular communica@on with school staff, and program evalua@on. The following ac@vi@es provide teams with opportuni@es to map data management resources, review methods for monitoring implementa@on, and discuss methods of increasing staff involvement.
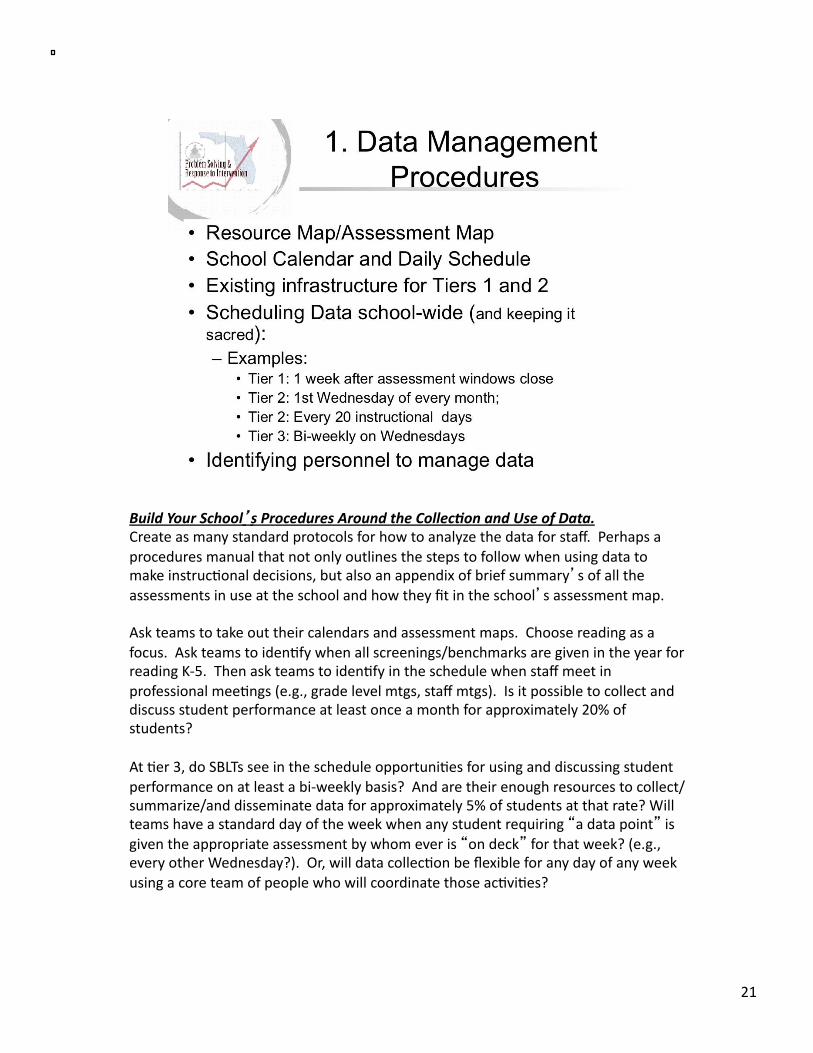
Build Your School’s Procedures Around the Collec4on and Use of Data. Create as many standard protocols for how to analyze the data for staff. Perhaps a procedures manual that not only outlines the steps to follow when using data to make instruc@onal decisions, but also an appendix of brief summary’s of all the assessments in use at the school and how they fit in the school’s assessment map.
Ask teams to take out their calendars and assessment maps. Choose reading as a focus. Ask teams to iden@fy when all screenings/benchmarks are given in the year for reading K-‐5. Then ask teams to iden@fy in the schedule when staff meet in professional mee@ngs (e.g., grade level mtgs, staff mtgs). Is it possible to collect and discuss student performance at least once a month for approximately 20% of students?
At @er 3, do SBLTs see in the schedule opportuni@es for using and discussing student performance on at least a bi-‐weekly basis? And are their enough resources to collect/summarize/and disseminate data for approximately 5% of students at that rate? Will teams have a standard day of the week when any student requiring “a data point” is given the appropriate assessment by whom ever is “on deck” for that week? (e.g., every other Wednesday?). Or, will data collec@on be flexible for any day of any week using a core team of people who will coordinate those ac@vi@es?
21
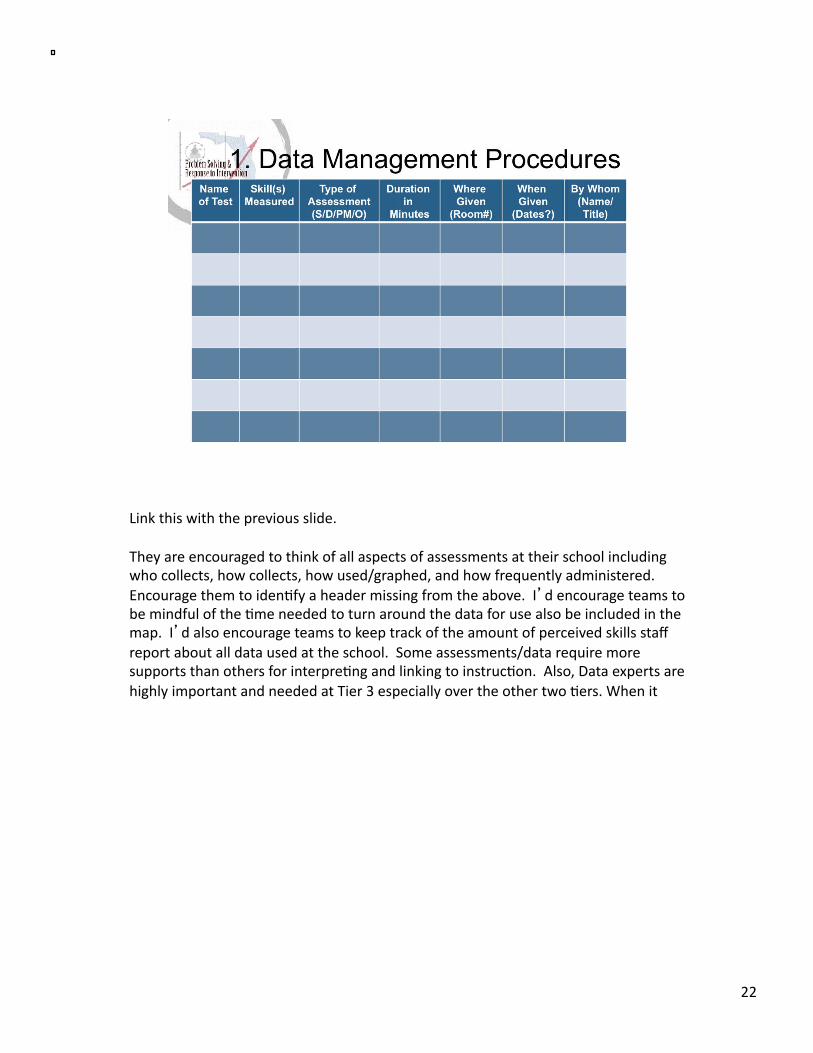
Link this with the previous slide.
They are encouraged to think of all aspects of assessments at their school including who collects, how collects, how used/graphed, and how frequently administered. Encourage them to iden@fy a header missing from the above. I’d encourage teams to be mindful of the @me needed to turn around the data for use also be included in the map. I’d also encourage teams to keep track of the amount of perceived skills staff report about all data used at the school. Some assessments/data require more supports than others for interpre@ng and linking to instruc@on. Also, Data experts are highly important and needed at Tier 3 especially over the other two @ers. When it
22
This script in included in Supplemental Materials.
23

Perhaps, implemen@ng RtI can be simplified for folks on the basis of two broad goals, (1) teach staff how to engage in effec@ve and efficient problem solving and (2) change staff beliefs and percep@ons to support their par@cipa@on with RtI.
If we can do that: then, how do teams know that staff can engage in effec@ve and efficient PS and how do teams know that staff’s beliefs have changed to be more consistent with the goals of PS/RtI?
24
26