Toshka Project Power Study - IWTC...
15
Twelfth International Water Technology Conference, IWTC12 2008 Alexandria, Egypt 1 TOSHKA PROJECT POWER OPERATION (Mubarak Pump Station) N. M. Abdelsalam 1 , M. M. Abdelaziz 2 , A. F. Zobaa 3 and M. S. Aziz 4 1 Engineer, Researcher Assistant, Nile Research Institute, National Water Research Center, Cairo, Egypt 2 Prof., Head of Department, Machine & Electrical Power, Cairo University, Egypt 3 Assistant Prof., Machine & Electrical Power Department, Cairo University, Egypt 4 Prof., Deputy Director of Nile Research Institute, National Water Research Center, Cairo, Egypt ABSTRACT Electric power is one from the importance sources of energy. In the past few years, Egypt power requirements are increasing very tremendously due to the increasing of population, standards of livings, and the vital need for new major projects to face the economic challenges. This research is a part of serial research studying and evaluating power demand and potential supplies. This serial research has evaluated the electric power in Egypt especially hydropower and its future under different conditions and most unfavorable scenarios in addition to the effect of a major national project; Toshka Project; on the power in Egypt. This paper is focused on the effect of the project on the power generation from High Aswan Dam and the power requirements and operation of this major project. Two mathematical models have been developed by the author for the operation of the project. The first model is used to compute the effect of the project on HAD generation and the other model is used to determine the pump operation according to project water requirements all over the year. In addition, the software analyzes the hourly power demand for the Egyptian United Network historical data and to propose the optimum operation hours for the projects pumps hour the year. The research results are illustrated during this research and some important recommendations are highlighted for the decision makers. Keywords: Egyptian United Network, Toshka Project, Hydropower Generation, Power Demand in Egypt. I. GOAL Toshka Project is a national major project in Egypt. It is a major water project designed to irrigate about 540,000 new feddans = (56,700 Acres) by elevating water from Lake Nasser. The estimated required water discharge is about 5.5 BCM/year taken at 265 km upstream the High Aswan Dam. This extracted huge volume from the lake has a major and magic effect on irrigating the desert land. But it, also, has some
Transcript of Toshka Project Power Study - IWTC...
Twelfth International Water Technology Conference, IWTC12 2008 Alexandria, Egypt
1
TOSHKA PROJECT POWER OPERATION
(Mubarak Pump Station)
N. M. Abdelsalam 1, M. M. Abdelaziz
2, A. F. Zobaa
3 and M. S. Aziz
4
1 Engineer, Researcher Assistant, Nile Research Institute, National Water Research
Center, Cairo, Egypt 2 Prof., Head of Department, Machine & Electrical Power, Cairo University, Egypt
3 Assistant Prof., Machine & Electrical Power Department, Cairo University, Egypt
4 Prof., Deputy Director of Nile Research Institute, National Water Research Center,
Cairo, Egypt
ABSTRACT
Electric power is one from the importance sources of energy. In the past few years,
Egypt power requirements are increasing very tremendously due to the increasing of
population, standards of livings, and the vital need for new major projects to face the
economic challenges. This research is a part of serial research studying and evaluating
power demand and potential supplies. This serial research has evaluated the electric
power in Egypt especially hydropower and its future under different conditions and
most unfavorable scenarios in addition to the effect of a major national project; Toshka
Project; on the power in Egypt. This paper is focused on the effect of the project on the
power generation from High Aswan Dam and the power requirements and operation of
this major project. Two mathematical models have been developed by the author for
the operation of the project. The first model is used to compute the effect of the project
on HAD generation and the other model is used to determine the pump operation
according to project water requirements all over the year. In addition, the software
analyzes the hourly power demand for the Egyptian United Network historical data
and to propose the optimum operation hours for the projects pumps hour the year. The
research results are illustrated during this research and some important
recommendations are highlighted for the decision makers.
Keywords: Egyptian United Network, Toshka Project, Hydropower Generation,
Power Demand in Egypt.
I. GOAL
Toshka Project is a national major project in Egypt. It is a major water project
designed to irrigate about 540,000 new feddans = (56,700 Acres) by elevating water
from Lake Nasser. The estimated required water discharge is about 5.5 BCM/year
taken at 265 km upstream the High Aswan Dam. This extracted huge volume from the
lake has a major and magic effect on irrigating the desert land. But it, also, has some
Twelfth International Water Technology Conference, IWTC12 2008 Alexandria, Egypt
2
other major side effects since it is taken from the limited Egyptian share of
55.5 BCM/year and electric source for the project is depending on the united network.
II. INTRODUCTION
As a result of rapidly growing demands and a shortage of financial investment by
governments, private power production is encouraged in the traditionally monopolistic
power industry in developing countries [1]. The amount of distribution generation
(DG) is increasing worldwide, and it is foreseen that in the future it will play an
important role in electrical energy systems. An original approach and computational
method to assess the impact of DG on investment deferral in radial distribution
networks in the medium and long-term have been presented in [2]. Load profiles may
vary from 24-h constant to only nighttime or oppositely only daytime load profiles.
Article [3] presents on the system performance. Optimal dispatch systems at
hydroelectric plants manage the energy conversion process such that under all
conditions the station efficiency is maximized in [4]. The optimal operation of the
reservoir for electric generation with varied conditions such that long and short term
hydrothermal scheduling, distributed regional demand in order to analyze operation
characteristics of electric utilities appropriately, is presented in [5, 6]. In bringing
energy needs and energy availability into balance, there are two main elements such as
energy demand and energy supply. In this regard, every country should put efforts to
attain such a balance and hence conduct research and development studies to develop
its own energy conservation programs for the existing and new energy resources [7].
In 1993 the World Energy Council (WEC) published the results of a major study it had
undertaken of global energy supply and demand in the period 1990 to 2020 under the
title "Energy for Tomorrow's World – the Realities, the Real Option and the Agenda
for Achievement" [8]. About 84 percent of Egypt's electric generating capacity is
thermal power and the remaining 16 percent is hydroelectric power generated mostly
from the Aswan High Dam. Electricity demand, in Egypt, is growing from 5%-7% and
has reached about 11% during the past year due to the increasing power demand, we
will study and manage the available resources to face the increasing requirements and
economic challenges.
III. TOSHKA PROJECT CHARACTERISTICS
This project consists of three main parts: Canal intake, Mubarek Pump Station (MPS),
and South Valley canal. The characteristics of MPS operation are as follow:
1- The required annual water for the total area of the project is 5.5*109 m
3 per year
and the designed discharge capacity of a single pump is estimated to be about
(17*106 m
3/day).
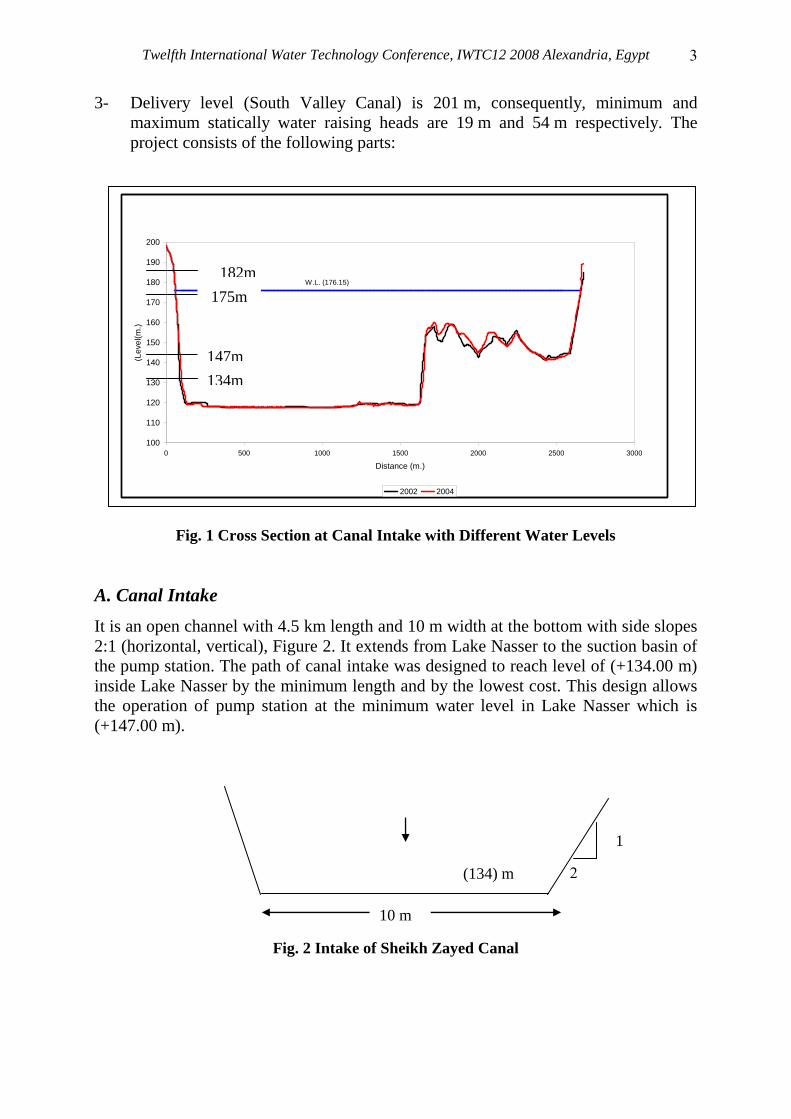
2- Minimum and maximum suction levels (minimum and maximum operational
water levels in Lake Nasser) are 147 m and 182 m, respectively, Figure 1.
Twelfth International Water Technology Conference, IWTC12 2008 Alexandria, Egypt
3
3- Delivery level (South Valley Canal) is 201 m, consequently, minimum and
maximum statically water raising heads are 19 m and 54 m respectively. The
project consists of the following parts:
Fig. 1 Cross Section at Canal Intake with Different Water Levels
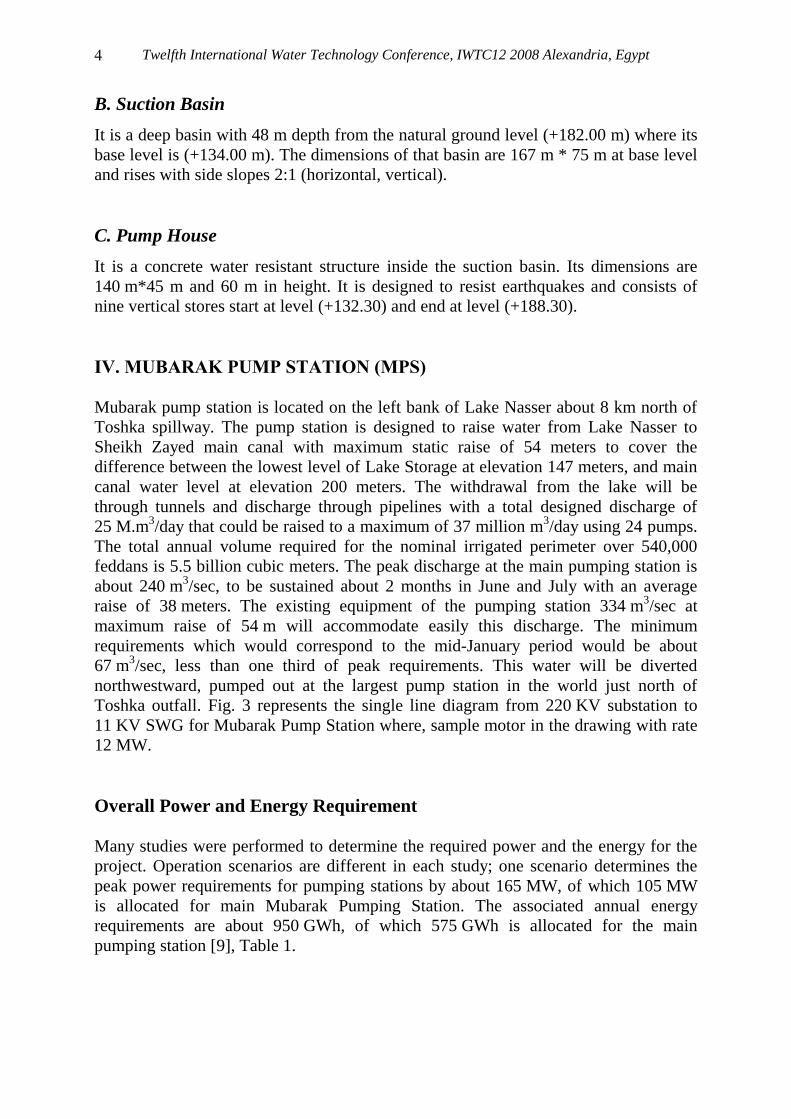
A. Canal Intake
It is an open channel with 4.5 km length and 10 m width at the bottom with side slopes
2:1 (horizontal, vertical), Figure 2. It extends from Lake Nasser to the suction basin of
the pump station. The path of canal intake was designed to reach level of (+134.00 m)
inside Lake Nasser by the minimum length and by the lowest cost. This design allows
the operation of pump station at the minimum water level in Lake Nasser which is
(+147.00 m).
Fig. 2 Intake of Sheikh Zayed Canal
2 (134) m
10 m
1
W.L. (176.15)
100
110
120
130
140
150
160
170
180
190
200
0 500 1000 1500 2000 2500 3000
Distance (m.)
(Level(m
.)
2002 2004
134m
147m
175m
182m
Twelfth International Water Technology Conference, IWTC12 2008 Alexandria, Egypt
4
B. Suction Basin
It is a deep basin with 48 m depth from the natural ground level (+182.00 m) where its
base level is (+134.00 m). The dimensions of that basin are 167 m * 75 m at base level
and rises with side slopes 2:1 (horizontal, vertical).
C. Pump House
It is a concrete water resistant structure inside the suction basin. Its dimensions are
140 m*45 m and 60 m in height. It is designed to resist earthquakes and consists of
nine vertical stores start at level (+132.30) and end at level (+188.30).
IV. MUBARAK PUMP STATION (MPS)
Mubarak pump station is located on the left bank of Lake Nasser about 8 km north of
Toshka spillway. The pump station is designed to raise water from Lake Nasser to
Sheikh Zayed main canal with maximum static raise of 54 meters to cover the
difference between the lowest level of Lake Storage at elevation 147 meters, and main
canal water level at elevation 200 meters. The withdrawal from the lake will be
through tunnels and discharge through pipelines with a total designed discharge of
25 M.m3/day that could be raised to a maximum of 37 million m
3/day using 24 pumps.
The total annual volume required for the nominal irrigated perimeter over 540,000
feddans is 5.5 billion cubic meters. The peak discharge at the main pumping station is
about 240 m3/sec, to be sustained about 2 months in June and July with an average
raise of 38 meters. The existing equipment of the pumping station 334 m3/sec at
maximum raise of 54 m will accommodate easily this discharge. The minimum
requirements which would correspond to the mid-January period would be about
67 m3/sec, less than one third of peak requirements. This water will be diverted
northwestward, pumped out at the largest pump station in the world just north of
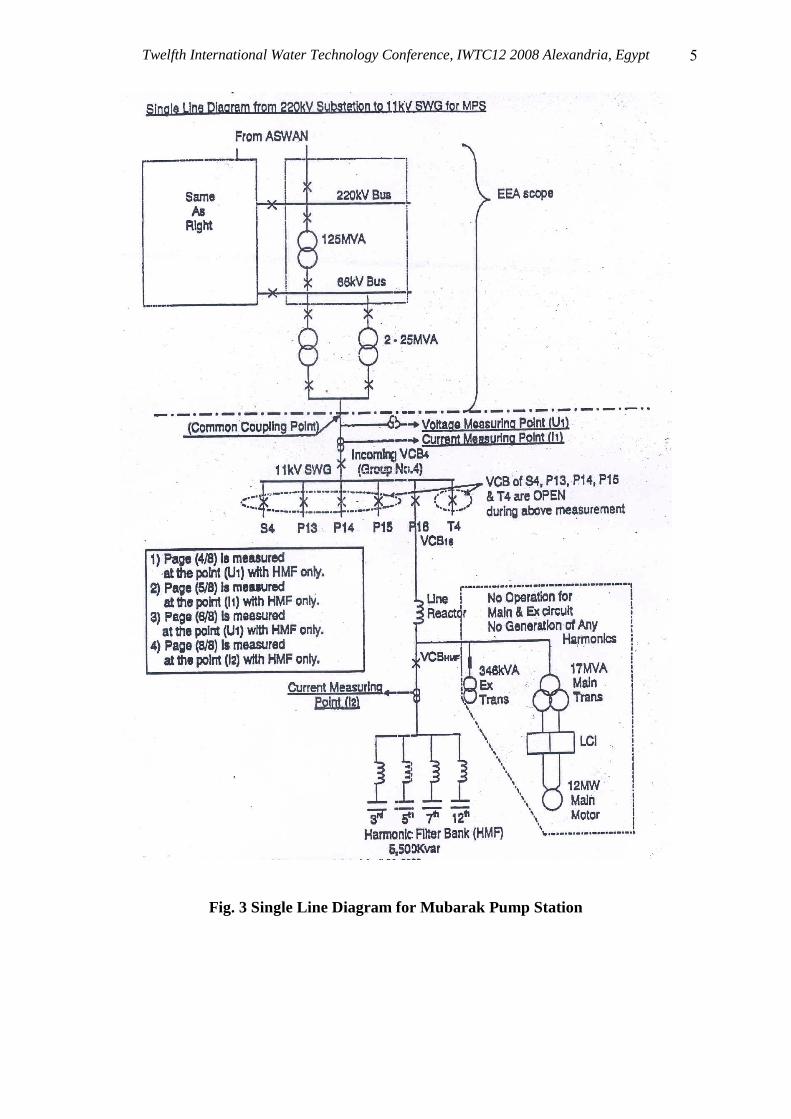
Toshka outfall. Fig. 3 represents the single line diagram from 220 KV substation to
11 KV SWG for Mubarak Pump Station where, sample motor in the drawing with rate
12 MW.
Overall Power and Energy Requirement
Many studies were performed to determine the required power and the energy for the
project. Operation scenarios are different in each study; one scenario determines the
peak power requirements for pumping stations by about 165 MW, of which 105 MW
is allocated for main Mubarak Pumping Station. The associated annual energy
requirements are about 950 GWh, of which 575 GWh is allocated for the main
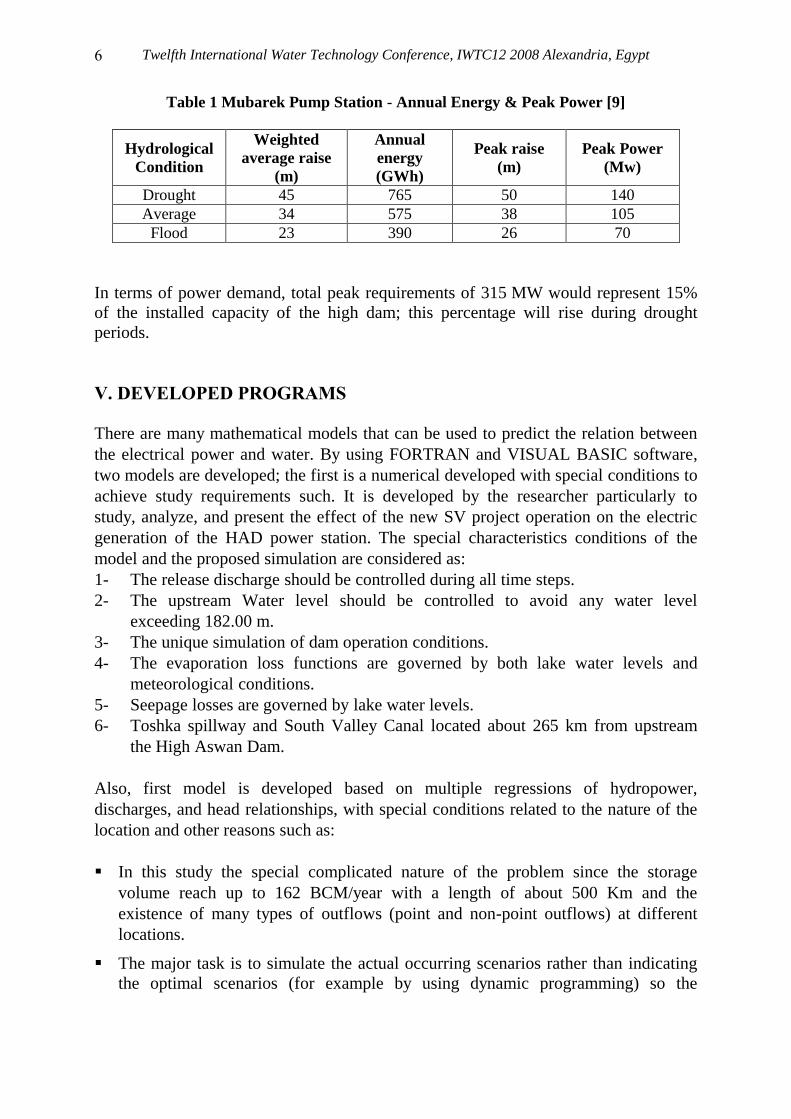
pumping station [9], Table 1.
Twelfth International Water Technology Conference, IWTC12 2008 Alexandria, Egypt
5
Fig. 3 Single Line Diagram for Mubarak Pump Station
Twelfth International Water Technology Conference, IWTC12 2008 Alexandria, Egypt
6
Table 1 Mubarek Pump Station - Annual Energy & Peak Power [9]
Hydrological
Condition
Weighted
average raise
(m)
Annual
energy
(GWh)
Peak raise
(m)
Peak Power
(Mw)
Drought 45 765 50 140
Average 34 575 38 105
Flood 23 390 26 70
In terms of power demand, total peak requirements of 315 MW would represent 15%
of the installed capacity of the high dam; this percentage will rise during drought
periods.
V. DEVELOPED PROGRAMS
There are many mathematical models that can be used to predict the relation between
the electrical power and water. By using FORTRAN and VISUAL BASIC software,
two models are developed; the first is a numerical developed with special conditions to
achieve study requirements such. It is developed by the researcher particularly to
study, analyze, and present the effect of the new SV project operation on the electric
generation of the HAD power station. The special characteristics conditions of the
model and the proposed simulation are considered as:
1- The release discharge should be controlled during all time steps.
2- The upstream Water level should be controlled to avoid any water level
exceeding 182.00 m.
3- The unique simulation of dam operation conditions.
4- The evaporation loss functions are governed by both lake water levels and
meteorological conditions.
5- Seepage losses are governed by lake water levels.
6- Toshka spillway and South Valley Canal located about 265 km from upstream
the High Aswan Dam.
Also, first model is developed based on multiple regressions of hydropower,
discharges, and head relationships, with special conditions related to the nature of the
location and other reasons such as:
In this study the special complicated nature of the problem since the storage
volume reach up to 162 BCM/year with a length of about 500 Km and the
existence of many types of outflows (point and non-point outflows) at different
locations.
The major task is to simulate the actual occurring scenarios rather than indicating
the optimal scenarios (for example by using dynamic programming) so the
Twelfth International Water Technology Conference, IWTC12 2008 Alexandria, Egypt
7
developed approach was used in this study to analyze the actual occurring
conditions for different cases.
It can be briefly summarized the as follows:
Hydropower Module
This module depends on a new equation for HAD turbines operation, this equation was
created by multiple regression analysis using stat graph software. Multiple regression
analysis, is a statistical technique that can be used to analyze the relationship between
a single dependent is named criterion variable which is represented in our study as
power P and two independent variables are named predictor variables which are
represented as discharge through turbines Q and the pressure head H. 153 actual data
record monthly for P, Q, and H from 1988 to 2000 are used to predict this relation,
where these data contains measured power in GW, pressure head in m, and turbines
discharges in M.m3/month. Formula for this relation was represented as linear equation
"P = C1 * Q + C2 * Ht + C" and given as:
P = 689.41 + 0.167 * Q + 9.62 * H1 MW (1)
Where:
H1 is the head acting on the turbines (m).
Q is the outflow discharge through the turbines (m.m3/month.), and it is the
discharge for reservoir.
The correlation factor for the equation was given as R2 = 0.991
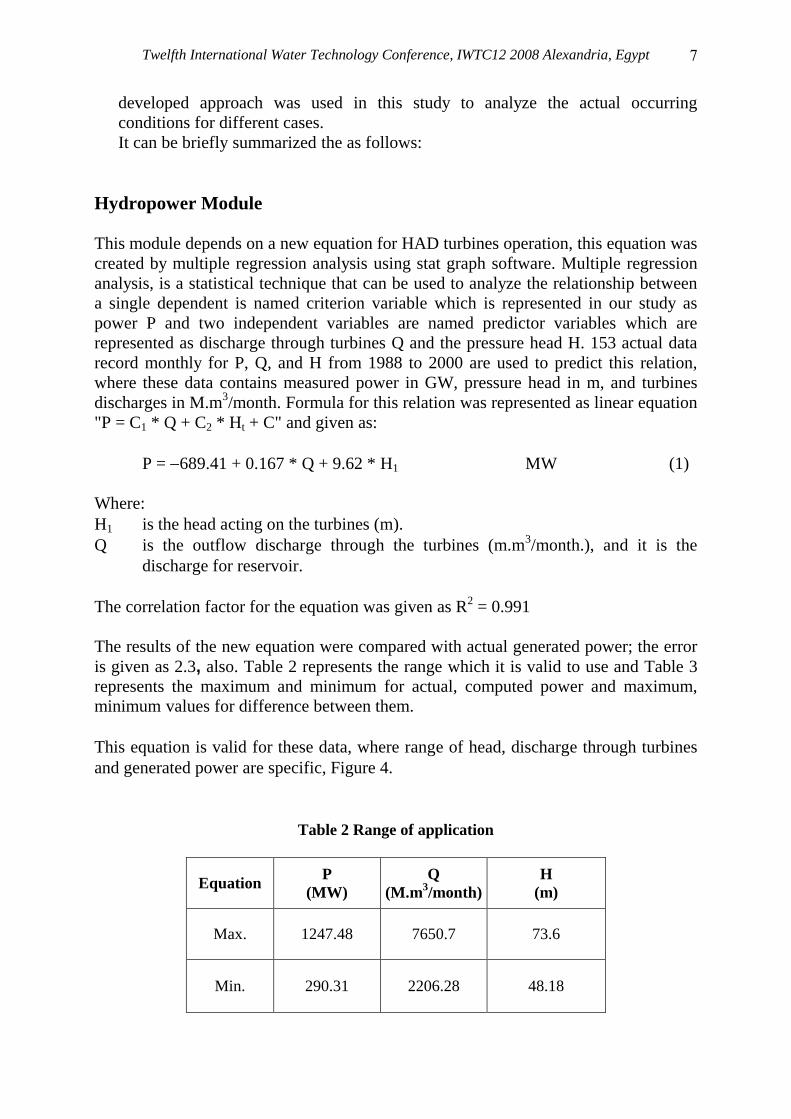
The results of the new equation were compared with actual generated power; the error
is given as 2.3, also. Table 2 represents the range which it is valid to use and Table 3
represents the maximum and minimum for actual, computed power and maximum,
minimum values for difference between them.
This equation is valid for these data, where range of head, discharge through turbines
and generated power are specific, Figure 4.
Table 2 Range of application
Equation P
(MW)
Q
(M.m3/month)
H
(m)
Max. 1247.48 7650.7 73.6
Min. 290.31 2206.28 48.18
Twelfth International Water Technology Conference, IWTC12 2008 Alexandria, Egypt
8
Table 3 Maximum and minimum errors for computed power by equation
Equation P
actual
P
computed Error
Max. 1247 1228 49
Min. 256 215 -125
Fig. 4 Power Computed by New Equation and Power Actual is closed
Second Program Calculations
The computations in the developed program are depending on one main function with
three factors. The first factor is the electrical consumption of a single pump in the
station, the second factor is the water discharge raising rate of a single pump, and the
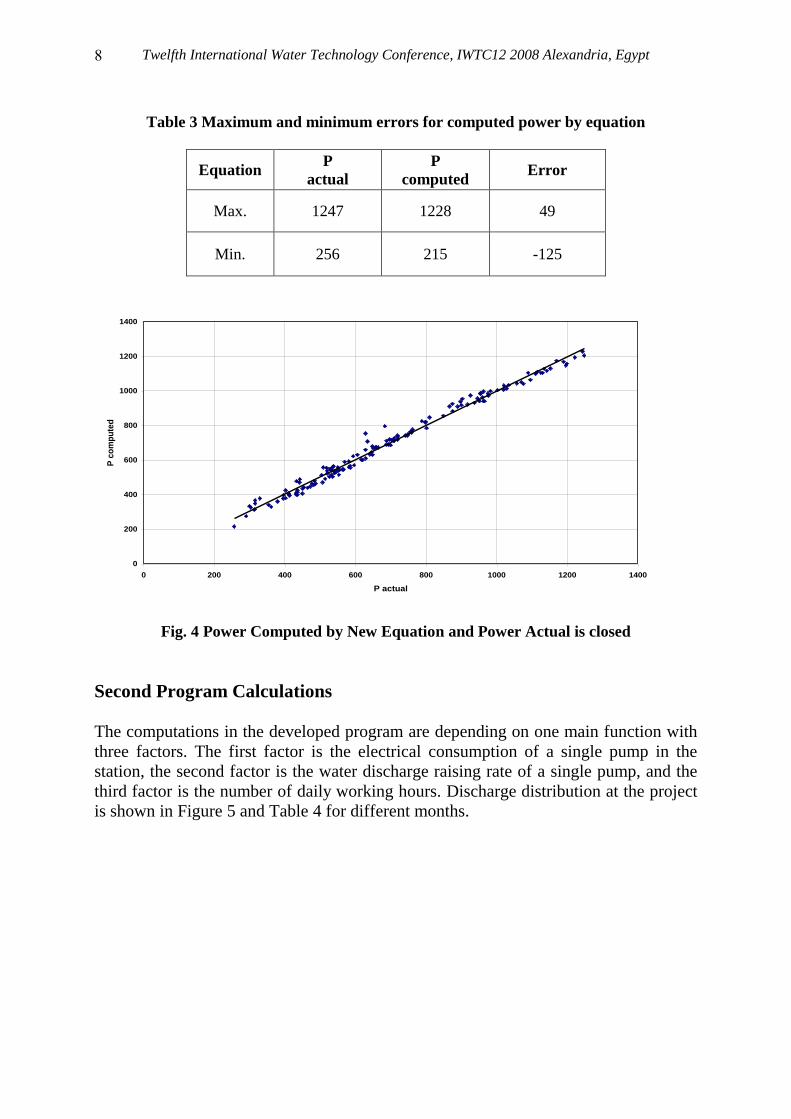
third factor is the number of daily working hours. Discharge distribution at the project
is shown in Figure 5 and Table 4 for different months.
0
200
400
600
800
1000
1200
1400
0 200 400 600 800 1000 1200 1400
P actual
P c
om
pu
ted

Twelfth International Water Technology Conference, IWTC12 2008 Alexandria, Egypt
9
Monthly Discharge at Canal
0
5
10
15
20
25
Januar
y
Febru
ary
Mar
chApri
l
May
June
July
August
Sep
tem
ber
Oct
ober
Nove
mber
Dec
ember
Months
Dis
ch
arg
e m
.m3
/da
y
Fig. 5 Monthly discharge for Toshka Project
Table 4 Project Monthly Discharge in Toshka M.m3/day
Month Discharge
(M.m3/day)
January 8
February 11.13
March 14.09
April 14.09
May 17.22
June 22.96
July 22.43
August 20.17
September 13.74
October 11.13
November 10.43
December 8
From Table 4, it can be shown that the required monthly discharge is different for each
month. Maximum discharge occurred in three months; June, July, and August while
the minimum discharge occurred in two months; January and December, these
variance in the discharge gives work load on the pump station, where it should be
manage this variability. Mubarak Pump Station (MPS) contains 24 pumps with 24
electric motors, 21 for base load and 3 as spare motors, the electrical rate for every
motor is 12 MW per hour and its rate of raising the water is 17 m3/sec. Mubarak pump
station program calculates number of working pumps, the number of working hours,
and working period in day related this equation:

Twelfth International Water Technology Conference, IWTC12 2008 Alexandria, Egypt
11
req
h
p QhD
NQ (1)
Where
pQ = Rate discharge for every pump in the station = 17 m3/day
N = number of working pumps (selected based on scenario)
Dh = represents hours of the day = 24 h
reqQ = water discharge required for irrigation, where; it varies from month to another
h = No. of working hours.
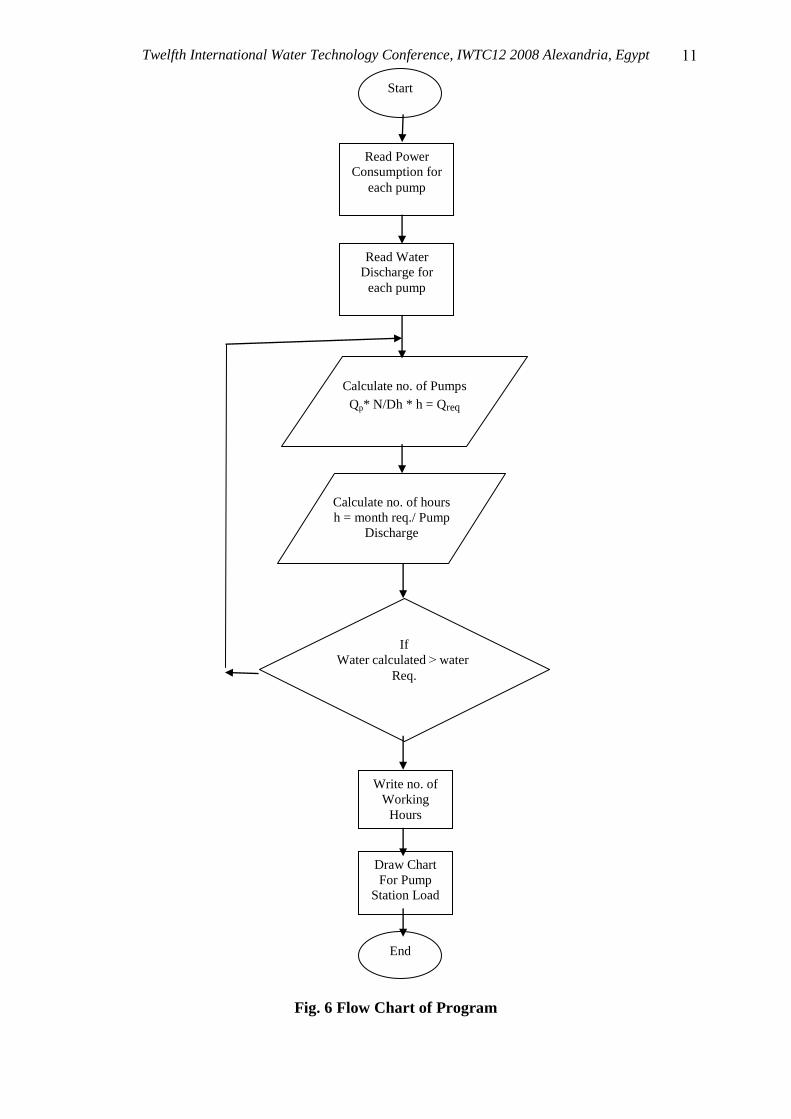
The authors used different scenarios by using MPS program to specify the numbers of
working pumps, working period, and working hours, Figure 6. There are some
conditions in the program, such that:
1. The electric power for working pumps as minimum as possible.
2. Avoid working for all pumps at the same time.
3. Working hours for pumps are continuous during one day to avoid the
starting current effect.
4. Working hours for pumps at minimum hours load for united network
daily load curve.
By taking into consideration the above conditions, the program output gives the
optimum number of pump for working as four pumps from the twenty one pumps at
the station and after that the program computes when and for how long the selected
pumps are working each day.
No. of Working Hours (h) =)(QRateDischargeWaterPump
)(QirmetsWater RequMonthly
p
req. (2)
Twelfth International Water Technology Conference, IWTC12 2008 Alexandria, Egypt
11
Fig. 6 Flow Chart of Program
Start
Read Power
Consumption for
each pump
Read Water
Discharge for
each pump
Calculate no. of Pumps
Qp* N/Dh * h = Qreq
Calculate no. of hours
h = month req./ Pump
Discharge
If
Water calculated < water
Req.
Write no. of
Working
Hours
Draw Chart
For Pump
Station Load
End
Twelfth International Water Technology Conference, IWTC12 2008 Alexandria, Egypt
12
VI. RESULTS AND ANALYSIS
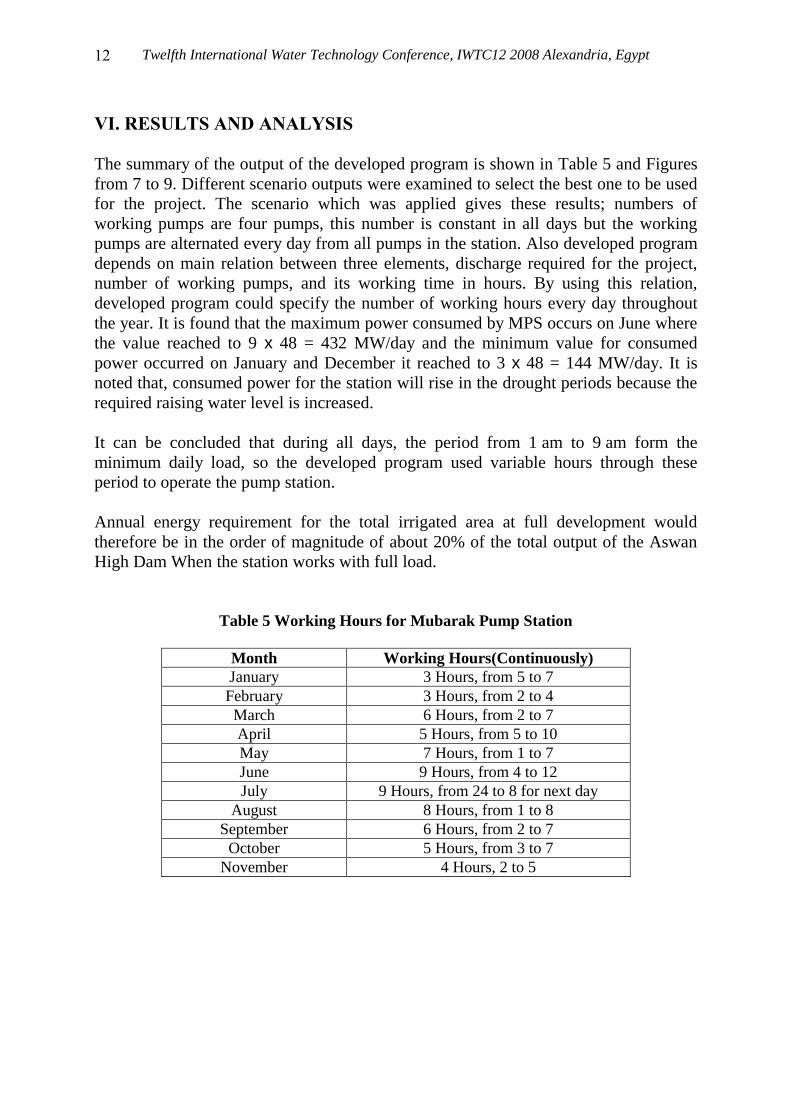
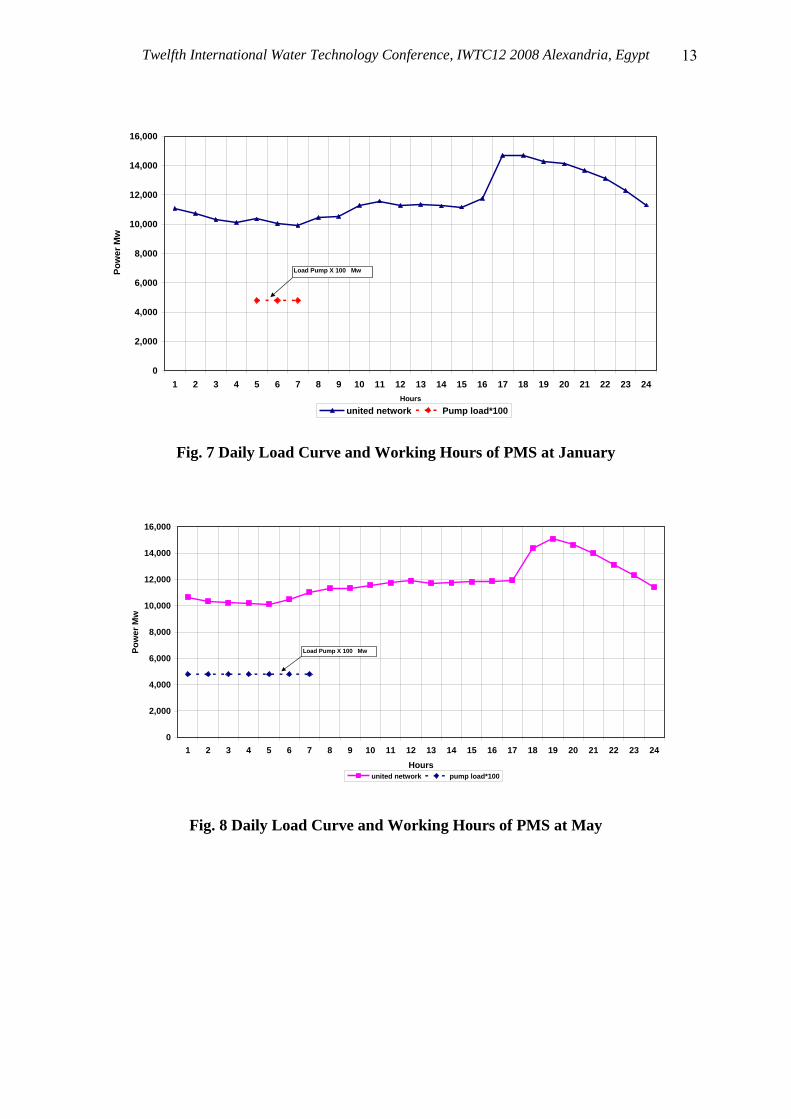
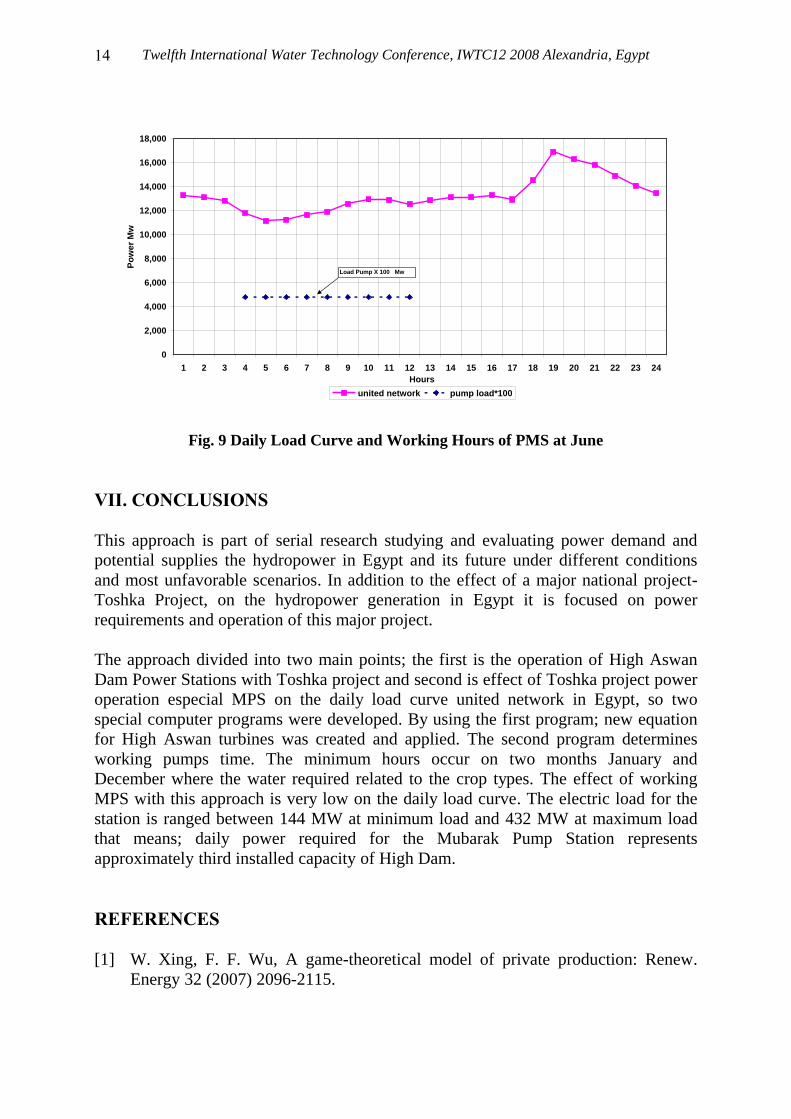
The summary of the output of the developed program is shown in Table 5 and Figures
from 7 to 9. Different scenario outputs were examined to select the best one to be used
for the project. The scenario which was applied gives these results; numbers of
working pumps are four pumps, this number is constant in all days but the working
pumps are alternated every day from all pumps in the station. Also developed program
depends on main relation between three elements, discharge required for the project,
number of working pumps, and its working time in hours. By using this relation,
developed program could specify the number of working hours every day throughout
the year. It is found that the maximum power consumed by MPS occurs on June where
the value reached to 9 x 48 = 432 MW/day and the minimum value for consumed
power occurred on January and December it reached to 3 x 48 = 144 MW/day. It is
noted that, consumed power for the station will rise in the drought periods because the
required raising water level is increased.
It can be concluded that during all days, the period from 1 am to 9 am form the
minimum daily load, so the developed program used variable hours through these
period to operate the pump station.
Annual energy requirement for the total irrigated area at full development would
therefore be in the order of magnitude of about 20% of the total output of the Aswan
High Dam When the station works with full load.
Table 5 Working Hours for Mubarak Pump Station
Month Working Hours(Continuously)
January 3 Hours, from 5 to 7
February 3 Hours, from 2 to 4
March 6 Hours, from 2 to 7
April 5 Hours, from 5 to 10
May 7 Hours, from 1 to 7
June 9 Hours, from 4 to 12
July 9 Hours, from 24 to 8 for next day
August 8 Hours, from 1 to 8
September 6 Hours, from 2 to 7
October 5 Hours, from 3 to 7
November 4 Hours, 2 to 5
Twelfth International Water Technology Conference, IWTC12 2008 Alexandria, Egypt
13
0
2,000
4,000
6,000
8,000
10,000
12,000
14,000
16,000
1 2 3 4 5 6 7 8 9 10 11 12 13 14 15 16 17 18 19 20 21 22 23 24
Hours
Po
we
r M
w
united network Pump load*100
Load Pump X 100 Mw
Fig. 7 Daily Load Curve and Working Hours of PMS at January
0
2,000
4,000
6,000
8,000
10,000
12,000
14,000
16,000
1 2 3 4 5 6 7 8 9 10 11 12 13 14 15 16 17 18 19 20 21 22 23 24
Hours
Po
we
r M
w
united network pump load*100
Load Pump X 100 Mw
Fig. 8 Daily Load Curve and Working Hours of PMS at May
Twelfth International Water Technology Conference, IWTC12 2008 Alexandria, Egypt
14
0
2,000
4,000
6,000
8,000
10,000
12,000
14,000
16,000
18,000
1 2 3 4 5 6 7 8 9 10 11 12 13 14 15 16 17 18 19 20 21 22 23 24
Hours
Po
we
r M
w
united network pump load*100
Load Pump X 100 Mw
Fig. 9 Daily Load Curve and Working Hours of PMS at June
VII. CONCLUSIONS
This approach is part of serial research studying and evaluating power demand and
potential supplies the hydropower in Egypt and its future under different conditions
and most unfavorable scenarios. In addition to the effect of a major national project-
Toshka Project, on the hydropower generation in Egypt it is focused on power
requirements and operation of this major project.
The approach divided into two main points; the first is the operation of High Aswan
Dam Power Stations with Toshka project and second is effect of Toshka project power
operation especial MPS on the daily load curve united network in Egypt, so two
special computer programs were developed. By using the first program; new equation
for High Aswan turbines was created and applied. The second program determines
working pumps time. The minimum hours occur on two months January and
December where the water required related to the crop types. The effect of working
MPS with this approach is very low on the daily load curve. The electric load for the
station is ranged between 144 MW at minimum load and 432 MW at maximum load
that means; daily power required for the Mubarak Pump Station represents
approximately third installed capacity of High Dam.
REFERENCES
[1] W. Xing, F. F. Wu, A game-theoretical model of private production: Renew.
Energy 32 (2007) 2096-2115.
Twelfth International Water Technology Conference, IWTC12 2008 Alexandria, Egypt
15
[2] V.H. Mendez, J. Rivier, J.I. de la Fuente, T. Gomez, J. Arceluz, J. Marin, A.
Madurga, Impact of distributed generation on distribution investment deferral:
Electrical Power and Energy Systems 28 (2006) pp. 244-252.
[3] A.N. Celik, Effect of different load profiles on loss-of-load probability of stand-
alone photovoltaic systems, Renew. Energy 32 (2007) pp. 2096-2115.
[4] R. A. Ponraiah, F. D. Galiana, "Systems to Optimize Conversion Efficiencies at
Ontario Hydro's Hydoelectric Plants", IEEE Transactions on Power Systems,
Vol. 13, No. 3, August 1998.
[5] S. Soares, A.A.F.M. Carneiro, "Optimal Operation of Reservoir Electric
Generation", IEEE Transactions on Power Systems, Vol. 6, No. 3, July 1991.
[6] T. Nakata, and S. Ashina “Optimization for the Operation of Electric Power
Generation Taking Account of Distributed Regional Demand in Japan”, Tohoku
University.
[7] Omer Yuksek, Murat Ihsan Komurcu, Ibrahim Yuksel and Kamil Kaygusuz,"
The role of hydropower in meeting Turkey's electric energy demand", Energy
Policy, Volume 34, Issue 17, November 2006, pp. 3093-3103.
[8] Bjornsson Jakob, Helgason Dr. Thorkell, and Others, " The Potential Role of
Geothermal Energy and Hydropower in the World Energy Scenario in Year
2020", WEC Information, Energy Information, News & Events, Focus,
Publication, Member Services, World Energy Congress. London, 2005.
[9] Consulting Services for the South of EGYPT Development Project," Water
Management Plan", Technical Assistance for Toshka Project, Volume 3, July-
2004.
STILLING
BASIN
INTAKE
CANAL
PUMP
STATION SITE
PUMP STATION
ITE