Toronto RDC Introductory SAS Workshop Workbook · • Read in raw data files in different ways •...
26
Toronto RDC Introductory SAS Workshop Workbook
Transcript of Toronto RDC Introductory SAS Workshop Workbook · • Read in raw data files in different ways •...
Toronto RDC
Introductory SAS Workshop
Workbook

Welcome! In this workshop, we will:
• Start SAS and open a SAS program file • Run our first SAS program and examine the results • Look at the different elements of the SAS System
After learning the basics, we will then:
• Read in raw data files in different ways • Create, modify and merge SAS datasets • Look at helpful tips and techniques you’ll probably even use
But first, we need to log onto the lab computers. You can log onto the workstation by following these steps:
1. Press ctrl-alt-delete (at the same time) 2. Type in your User name: UTOTrainSASXX (the complete user name
is on the sticky note on your desk; not case-sensitive) 3. Type in your Password: RDCsasXX where “XX” is the number in your
username (case-sensitive)
Starting the SAS System
Make your way through the Start Menu until you reach: Start | All Programs | SAS | SAS 9.3 (32) (English)
Open a SAS Program File
• Select File | Open Program… from the menu bar at the top of the window
• Browse to G:\Workshop (Go back to G:\, then into Workshop) • Select selectyear.sas • Click Open
This is the SAS program we saw at the end of the presentation.

Run a SAS Program File Either:
• Click on the little running guy icon below the menu bar or, • Select Run | Submit from the menu bar or, • Right-click in the Program Editor window and select Submit All, or • Select the entire program in the Program Editor, right-click, and select
Submit Selection.
• You can also select a select a portion of the program, click the little running guy icon, and only the code you’ve selected will be run
Elements of the SAS System 3 Basic Windows:
1. Editor: This is where syntax is entered. Note the automatic colour-coding of the syntax (if it’s correct – it is red if it isn’t)
2. Log: This is where you’ll find notes, warnings and errors about the program you ran
3. Output: This is where you’ll find PROC step output
These windows can be switched between using the buttons at the bottom of the SAS windows. 1 Helpful Side Panel:
• Results: Use this to browse through your Output • Explorer: You can find all your SAS datasets here and open them for
viewing and even editing. Extremely handy! (Use the Backspace key to get to the next highest folder once you’ve drilled down to your dataset.)
A Few Good Icons (use with caution!):
• The big X (Clear): Clears the Program Editor window of all text • The “New” Page (New): Clears the LOG or OUPUT window of all text • The circled exclamation point (Break): Stops the running program, very
helpful if you know a long program isn’t going to run successfully
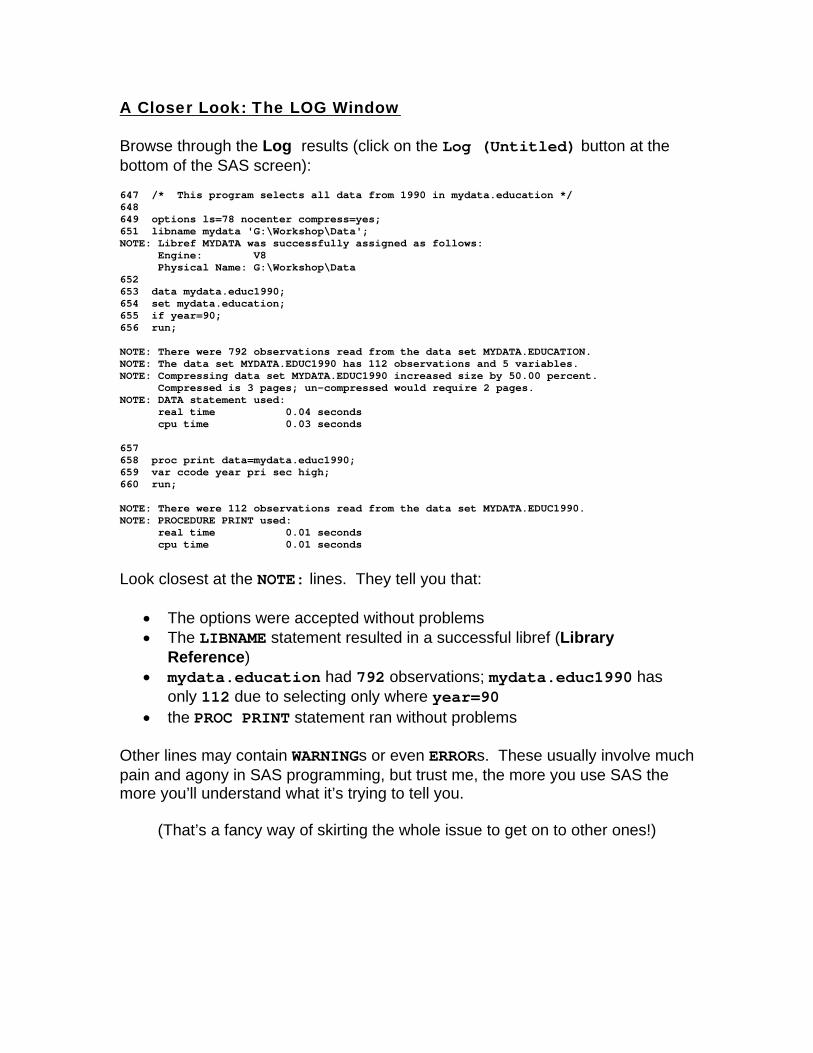
A Closer Look: The LOG Window Browse through the Log results (click on the Log (Untitled) button at the bottom of the SAS screen): 647 /* This program selects all data from 1990 in mydata.education */ 648 649 options ls=78 nocenter compress=yes; 651 libname mydata 'G:\Workshop\Data'; NOTE: Libref MYDATA was successfully assigned as follows: Engine: V8 Physical Name: G:\Workshop\Data 652 653 data mydata.educ1990; 654 set mydata.education; 655 if year=90; 656 run; NOTE: There were 792 observations read from the data set MYDATA.EDUCATION. NOTE: The data set MYDATA.EDUC1990 has 112 observations and 5 variables. NOTE: Compressing data set MYDATA.EDUC1990 increased size by 50.00 percent. Compressed is 3 pages; un-compressed would require 2 pages. NOTE: DATA statement used: real time 0.04 seconds cpu time 0.03 seconds 657 658 proc print data=mydata.educ1990; 659 var ccode year pri sec high; 660 run; NOTE: There were 112 observations read from the data set MYDATA.EDUC1990. NOTE: PROCEDURE PRINT used: real time 0.01 seconds cpu time 0.01 seconds
Look closest at the NOTE: lines. They tell you that:
• The options were accepted without problems • The LIBNAME statement resulted in a successful libref (Library
Reference) • mydata.education had 792 observations; mydata.educ1990 has
only 112 due to selecting only where year=90 • the PROC PRINT statement ran without problems
Other lines may contain WARNINGs or even ERRORs. These usually involve much pain and agony in SAS programming, but trust me, the more you use SAS the more you’ll understand what it’s trying to tell you.
(That’s a fancy way of skirting the whole issue to get on to other ones!)

A Closer Look: The OUTPUT Window 19:28 Monday, December 2, 2002 13 Obs ccode year pri sec high 1 1 90 31.9 8.6 3.7 2 3 90 13.1 5.3 1.0 3 4 90 40.6 7.1 1.0 4 7 90 38.2 6.8 1.0 5 9 90 21.7 3.9 0.5 6 12 90 20.7 23.2 3.8 7 13 90 19.3 15.9 7.5 8 16 90 6.3 5.7 0.1 9 17 90 24.2 16.9 0.9 10 21 90 44.6 7.1 0.8 .. ... .. .... .... ... 99 128 90 41.4 11.9 5.1 100 129 90 43.9 38.5 13.9 101 130 90 42.2 30.7 10.0 102 131 90 26.6 48.4 22.6 103 132 90 54.1 33.0 4.3 104 133 90 36.8 24.1 39.1 105 134 90 24.1 5.5 0.7 106 140 90 27.4 19.9 4.2 107 150 90 44.4 35.7 15.0 108 151 90 32.6 58.6 8.5 109 152 90 21.2 53.1 20.8 110 153 90 24.4 63.2 6.9 111 154 90 22.8 63.3 13.9 112 155 90 56.6 27.1 9.6
Note that Obs isn’t a variable – it’s automatically printed by SAS unless you use the noobs option, as in: proc print data=mydata.educ1990 noobs; run; These data show the educational attainment for the population over age 25 for 112 countries. The values for pri, sec and high are the percentage of Primary, Secondary and High School attained in each country. ccode is the Country Code, and we can see that our SAS program correctly selected all the observations where year=90.
My first tip: PROC PRINT is your friend! Unlike SPSS, SAS datasets don't stare you in the face when you're using the program, so either do a PROC PRINT or open the data file in SAS Explorer.

Reading in Raw Data: In-program This is where it gets a bit more interesting. Suppose we have a text file (after all, that’s what a Raw Data file always is) with a Country Code, a Country Acronym, and a Country Name: 1 DZA Algeria 2 AGO Angola 3 BEN Benin 4 BWA Botswana 5 HVO Burkina Faso 6 BDI Burundi 7 CMR Cameroon 8 CPV Cape verde 9 CAF Central African Rep. (And, to save you the trouble, suppose we also know that the variables start at columns 7, 22 and 43, and are 2, 3 and 20 columns wide.) The SAS DATA step that can read this in is: data mydata.ccodes; input ccode 7-9 cacro $ 22-24 country $ 43-63; cards; 1 DZA Algeria ...the above data... 9 CAF Central African Rep. ; run; Pretty straight-forward, isn’t it?
Now, locate and run readcountrycodes.sas in the G:\Workshop directory. This contains all the Country Codes. Examine the output, noting that we are only interested in the variables ccode and country.
Extra Credit Question: Can you find the data file in SAS?

Reading in Raw Data: From External Files Suppose we had a Raw Data file named countries.txt with the following format: 1,"Algeria" 2,"Angola" ... 155,"Cuba" 156,"Albania" SAS provides a way of reading from this file quite easily. Simply add an INFILE statement to your data step: infile 'G:\Workshop\RawData\countries.txt' dsd; The INFILE statement tells SAS where the Raw Data file is located, and its name. The DSD option is almost mandatory in INFILE statements because it does two important things:
1. It treats consecutive delimiters as a missing value and, 2. It takes the quotation marks off character strings.
So, our SAS code to read the following would look like this: data mydata.countries; length ccode 3 country $ 20; infile 'G:\Workshop\RawData\countries.txt' dsd; input ccode country; run;
Type in the above code into a new Enhanced Editor window in SAS and run it as-is! Your LIBREF for the DATA directory should still be in effect. We will need the SAS dataset this program produces, so give it a whirl. Browse to the dataset and examine it.
Finally, notice the LENGTH statement? It tells SAS to create two variables, ccode and country:
• ccode (Country Code) is numerical and occupies 3 bytes of storage for each value (a way to save space if you’re only counting to 100)
• country is a character variable and is a max of 20 characters long

Merging Data Sets Let’s play a bit with those SAS datasets you’ve been creating... The first program you ran should have created a SAS dataset named educ1990 in your G:\Workshop\Data directory. Verify it’s there, or run selectyear.sas once more. The educ1990 dataset contains education attainment for each country, and the numerical ccode (Country Code), for the year 1990. You also created a dataset named countries in the same location. This dataset contains ccode and country variables. We will need it, too. Our goal here is to take both of these files, and create a third file which contains our educational data, but where we have a common Country Code we want to add the Country Name: In other words (or datasets!), we have this (from countries): ccode country 1 Algeria 2 Angola 3 Benin 4 Botswana
...
...and this (from educ1990)... ccode pri sec high 1 31.9 8.6 3.7 3 13.1 5.3 1.0 4 40.6 7.1 1.0
...
..and want to end up with: ccode country pri sec high 1 Algeria 31.9 8.6 3.7 2 Angola . . . 3 Benin 13.1 5.3 1.0 4 Botswana 40.6 7.1 1.0 ... So, let’s merge educ1990 and countries!

First Things First: Always Sort The SAS procedure PROC SORT can make short work of sorting large datasets (actually, it can be slow as molasses, but anyway...). It’s mandatory to sort each dataset on the key variable: proc sort data=mydata.educ1990; by ccode; run; proc sort data=mydata.countries; by ccode; run;
PROC SORT statements can be used to sort by more than one variable, as well. And, the DESCENDING option before a variable sorts backwards on that variable.)
The Basic One-to-One Merge in SAS This is the one you’ll probably use, usually to merge a file on some sort of individual ID. The SAS procedure PROC MERGE is much more flexible, but the DATA Step gets the job done here just fine. data mydata.ec; merge mydata.educ1990 mydata.countries; by ccode; run;
Locate and run the SAS Program File mergeone.sas. This merges educ1990 and countries on ccode and produces a dataset named ec.
What happens?
1. First, the dataset ec is created in mydata. 2. Then, the two files are called by a MERGE (rather than SET) statement, and
merged on ccode. 3. The final dataset mydata.ec has the same number of observations (152) as the countries dataset – but you already knew that from the reading the log, right?
Check the copious output from PROC PRINT to see how your datasets were merged.

Another Basic One-to-One Merge Merging is so important that we’re going to do it again. Well, this time, you’ll be doing it again. Now that we know how to merge using a numerical variable, we want to see if the same procedure works for merging on character variables. Suppose we have our excellent mydata.ec dataset, but want to merge that with some other dataset which doesn’t come with a Country Code but does come with a Country Name. We will try a merge on Country Name, although of course this might well be less precise than merging on a numerical variable, due to different spellings. Take a look at mydata.rateofex. This is already in your Data directory. Since you don’t know what variables the dataset contains, use a default PROC PRINT, which will print all variables: proc print data=mydata.rateofex; run; The output is: Obs updated currency fgnindol dolinfgn country 1 28JUL94 peso 1.010000 0.990000 Argentina 2 28JUL94 dollar 0.745700 1.341000 Australia 3 28JUL94 schilling 0.095940 10.420000 Austria 4 28JUL94 dinar 2.652200 0.377100 Bahrain 5 28JUL94 franc 0.032780 30.510000 Belgium ...
Using the first merge SAS Program as a template, do the following:
1. Create a dataset named mydata.mergetwo 2. Merge mydata.ec and mydata.rateofex on
country 3. Run a PROC PRINT to verify the results
• What were your results?
• Did you forget to do anything?

A More Complex Data Step – Group Processing We’ve created datasets, now how about modifying an existing one? Let’s go back to the education SAS dataset in your Data directory. It was the one we used to create educ1990.
In a new editor window, write a PROC PRINT statement that will print the variables from education, or use the SAS Explorer to browse to the file in the Data library.
Note that ccode is not unique; for each Country Code, there are multiple observations. Suppose we wanted a way of calculating the mean educational achievement for each Country, at each educational level, across all available years. For example, note that we have values for educational attainment for some years for some countries, but not for all years for all countries: Obs ccode year pri sec high We will: 1 1 60 17.1 2.2 0.3 Sum 2 1 65 9.8 1.7 0.4 and count 3 1 70 13.0 2.2 0.3 non-missing 4 1 75 16.6 2.6 0.6 values for 5 1 80 22.8 3.5 1.2 educational attainment 6 1 85 27.6 5.3 2.3 then, 7 1 90 31.9 8.6 3.7 calculate mean here. 8 3 60 . 1.3 0.3 Sum 9 3 65 . 1.3 0.2 and count 10 3 70 2.3 1.4 0.2 non-missing 11 3 75 5.3 1.7 0.2 values for 12 3 80 8.3 2.2 0.3 educational attainment 13 3 85 10.5 3.2 0.6 then, 14 3 90 13.1 5.3 1.0 calculate mean here. ... We would like to have a mean value calculated for each level of educational attainment like this: Obs firstyear year ccode meanpri meansec meanhigh 1 60 90 1 19.83 3.73 1.26 2 60 90 3 7.90 2.34 0.40
...

Of course, we could use a simple PROC MEANS statement: proc means data=mydata.education; by ccode; run; If you run the above code, you'll get ~39 pages of output, including not only means but the standard deviation, min and max for each education level for each country. We could even output a dataset from that PROC MEANS statement, and then merge that with the education dataset. Instead, we'll calculate the means 'manually' within the data step, and learn a bit about SAS in the process. At first, it might seem easy, but there are a number of SAS tricks and techniques that need to be used to accomplish this.
First, let's set up a new program. Select File | New while in the enhanced program editor in SAS. Enter these options and libname statements to get started: options ls=78 nocenter compress=yes; libname mydata 'G:\Workshop\Data';
Since we know that we will be using group processing (on ccode), let's ensure the dataset is sorted on ccode.
Enter and run: proc sort data=mydata.education; by ccode; run;
Brilliant! Checking the SAS log, our data set is indeed sorted. Calculating a mean We need to do three things to calculate our means:
1. We need to know the sum of the values for each level of educational attainment for each country
2. We need to know the number of non-missing values of educational attainment for each country
3. We need to calculate the mean of each type of educational attainment for each country using mean=sum/n at the last observation for each country.

The Sum This should be pretty simple – let's consider a statement reading: sumpri=pri+sumpri; For every observation, the value of pri gets added to sumpri. Theoretically, we should end up with one large sum at the end of our data set (on the last observation).
We should try this in a data step. Enter and run: /* Note: This data step is designed to not work properly! */ data temp; set mydata.education; by ccode; sumpri=pri+sumpri; run; Notice the data temp statement without a library? That statement simply creates a dataset called temp in the Work directory, which can always be found in Libraries in the SAS Explorer. It gets deleted when you close SAS.
What happens when we run this data step? And, why? In the LOG, you will find a clue: NOTE: Missing values were generated as a result of performing an operation on missing values.
All the observations for sumpri are set to missing for two reasons. It's because:
a) sumpri is set to missing to start with, and an operation on a missing value results in a missing value (sumpri+pri = .+pri = .); b) SAS never remembers the value of a variable from one observation to the next, unless you tell it in some way to remember.
There are a couple of ways of getting around this. This command (as weird as it looks) will do everything we want here – keep the values of sumpri across observations, and also take care of missing values nicely: sumpri+pri;

You might also find this useful in setting up an observation or count variable; just use obs+1; in your data step and the first value for obs will be 1, the second 2, and so on. Let's try it in a data step: data temp; set mydata.education; by ccode; sumpri+pri; run;
What happens? Well, pri is added to sumpri on every observation and the result on the last observation is the value of 31000.5, which is the sum of every non-missing value of pri. You can also do this by using the retain statement, which tells SAS to hold on to the value of a variable across observations from the point it is set. So, the following data step does the same thing as our simple statement, above: /* No need to type this in, but go ahead if you like. */ data temp; set mydata.education; by ccode; retain sumpri 0; if pri ne . then sumpri=sumpri+pri; run; The retain sumpri 0; statement tells SAS to retain the value of sumpri, after initially setting it to a value of 0. Also, we only add to sumpri when pri is not missing. Group Processing With either method, we're getting a sum of pri for our entire dataset, but what about a sum of pri for each country? Here's where a main feature of group processing comes into play. SAS can identify the first and last observation of a group using the first and last statements. So, first.<var> is set to 1 at the first observation of each group (0 otherwise), and last.<var> is set to 1 at the last observation (0 otherwise).

If we use this for our country code variable (ccode), we can set the sum to 0 at the first observation of each ccode.
Enter and run this data step: data temp; set mydata.education; by ccode; if first.ccode then sumpri=0; sumpri+pri; run; Note: The statement “if first.ccode then sumpri=0;” means “if first.code is anything other than missing or zero, then make sumpri equal to 0.”
The values of sumpri are now calculated for each country, not just the whole dataset. Let's apply what we've learned to calculating the number of non-missing values of pri. The Number In the same way that we summed pri, we can count the number of non-missing values of pri. If we incorrectly calculate this number, our means will be off. Let's add a couple of lines to our data step:
data temp; set mydata.education; by ccode; if first.ccode then sumpri=0; if first.ccode then numpri=0; /* Added line */ sumpri+pri; if pri ne . then numpri+1; /* Added line */ run;
This code works! Note that at the last observation for each country, the number of non-missing values of pri is correctly calculated.

The Mean We also have a sum of all non-missing values of pri, and at the last observation for each country, we can output a mean we'll soon calculate by simply adding another two lines.
Run the following code after you've added the two lines, noting that one line has an asterisk in front of it. This “comments” the line out, for troubleshooting problems (note that it makes the line green). We'll remove the asterisk when we've determined that the program runs the way we want it to:
data temp; set mydata.education; by ccode; if first.ccode then sumpri=0; if first.ccode then numpri=0; sumpri+pri; if pri ne . then numpri+1; if last.ccode then meanpri=sumpri/numpri; /* Added line */ * if last.ccode then output; /* Added line */ run;
If you take a look at the temp dataset, you'll see that the means are calculated correctly. But, did you see what's in the SAS log? NOTE: Division by zero detected at line 79 column 34. ccode=141 year=60 pri=. sec=. high=2.1 FIRST.ccode=1 LAST.ccode=1 sumpri=0 numpri=0 meanpri=. _ERROR_=1 _N_=744 NOTE: Mathematical operations could not be performed at the following places. The results of the operations have been set to missing values. Each place is given by: (Number of times) at (Line):(Column). 1 at 79:34
Eek, for country 141, there are no valid values for pri, and so SAS reports a divide-by-zero error trying to divide 0 into 0. (Take a look at the dataset in SAS viewer; at observation # 744 you'll see the problem.) We can fix this by ensuring a mean isn't calculated when the dividend is 0 (see the changed lines): data temp; set mydata.education; by ccode; if first.ccode then sumpri=0; if first.ccode then numpri=0; sumpri+pri; if pri ne . then numpri+1; if last.ccode and numpri>0 then meanpri=sumpri/numpri; /* Changed line*/ if last.ccode then output; /* Changed line*/ run;
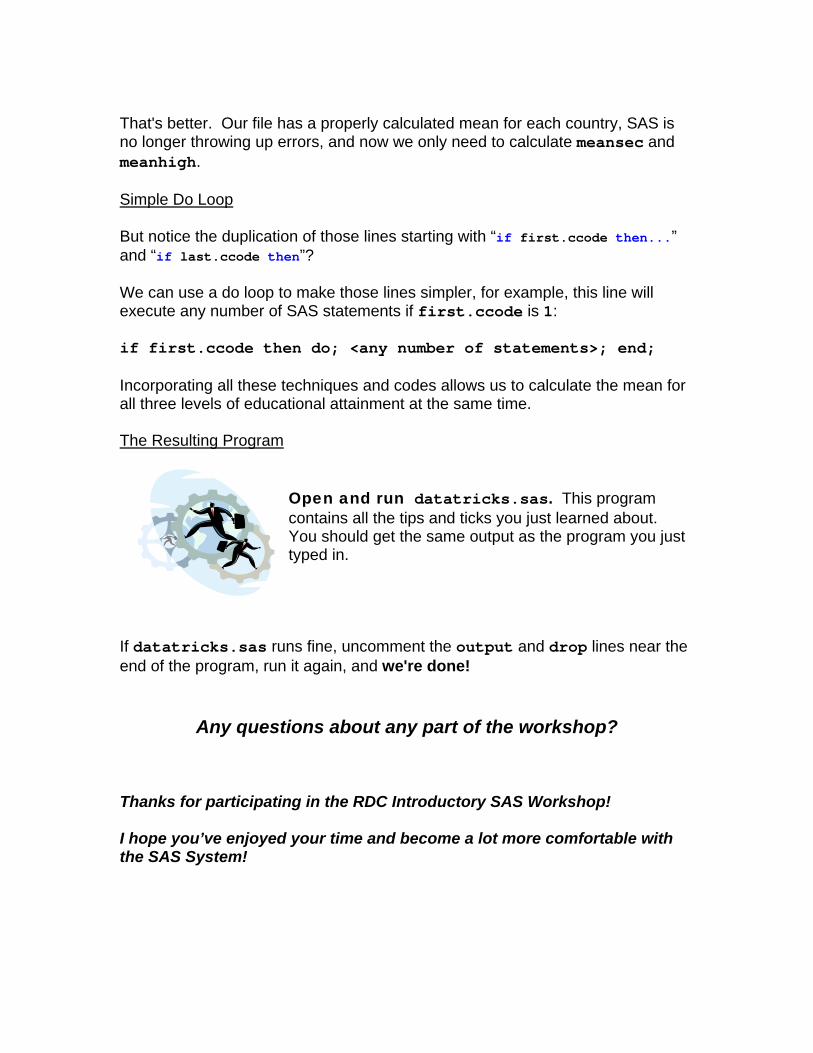
That's better. Our file has a properly calculated mean for each country, SAS is no longer throwing up errors, and now we only need to calculate meansec and meanhigh. Simple Do Loop But notice the duplication of those lines starting with “if first.ccode then...” and “if last.ccode then”? We can use a do loop to make those lines simpler, for example, this line will execute any number of SAS statements if first.ccode is 1: if first.ccode then do; <any number of statements>; end; Incorporating all these techniques and codes allows us to calculate the mean for all three levels of educational attainment at the same time. The Resulting Program
Open and run datatricks.sas. This program contains all the tips and ticks you just learned about. You should get the same output as the program you just typed in.
If datatricks.sas runs fine, uncomment the output and drop lines near the end of the program, run it again, and we're done!
Any questions about any part of the workshop? Thanks for participating in the RDC Introductory SAS Workshop! I hope you’ve enjoyed your time and become a lot more comfortable with the SAS System!

Appendix A: Raw Data File Reading Tips SAS has many, many options and even more peculiarities about reading data from external Raw Data files. It’s not always the easiest thing to accomplish, especially if your Raw Data files are things like equipment logs, web server logs (my specialty), or other electronic files. Here are the options that have saved my bacon many times...
The Most Important INFILE Options
lrecl=<257 to 32,000>
SAS has a default Logical Record Length (LRECL) of a paltry 256 characters, which will surely make some of your variables all set to missing at least once.
If you have missing values on last variables in your INPUT statement, set LRECL high, then check the log to see what the maximum record length was, then set it more realistically to catch abnormally long lines.
dlm=’<delimiter character(s)>‘
The Delimiter option allows you to specify as many different delimiters as you want, or just one. If your delimiter is a tab character, use dlm=’09’x
firstobs=<first record number>
If your Raw Data file has variable names on the first line, use firstobs=2 to skip over the variable names.
missover
If SAS reaches the end of a line unexpectedly, it will by default continue reading values from subsequent lines, which is usually bad. missover will cause SAS to instead write missing values to the variables it can’t find values for, and start properly on the next line again.
obs=<number of records to be read>
obs simply allows you to read only as many records as you need.
(And don’t forget our old pal dsd!)

Appendix B:
Getting Help for SAS
In SAS:
• SAS has in-program help: select Help | SAS Help and Documentation and search from there
• SAS has built-in training: Help | Getting Started With SAS Software
On the WWW:
• http://www.sas.com has sample programs, and lots of other information • There is a popular SAS newsgroup where your questions are almost
guaranteed to be answered within mere hours: http://groups.google.ca/groups?group=comp.soft-sys.sas
In the RDC:
• SAS manuals are available to the left of the Internet Room at the head of the RDC. The documentation installed with SAS will always be more current, however the printed manuals are better organized.
• Dave is available at the RDC to help with any problems you encounter • The University of California, Los Angeles has an amazing web site
devoted to many statistics software packages. Their SAS website is at: http://www.ats.ucla.edu/stat/sas/
Appendix C:
SAS Program Files Used in this Workshop
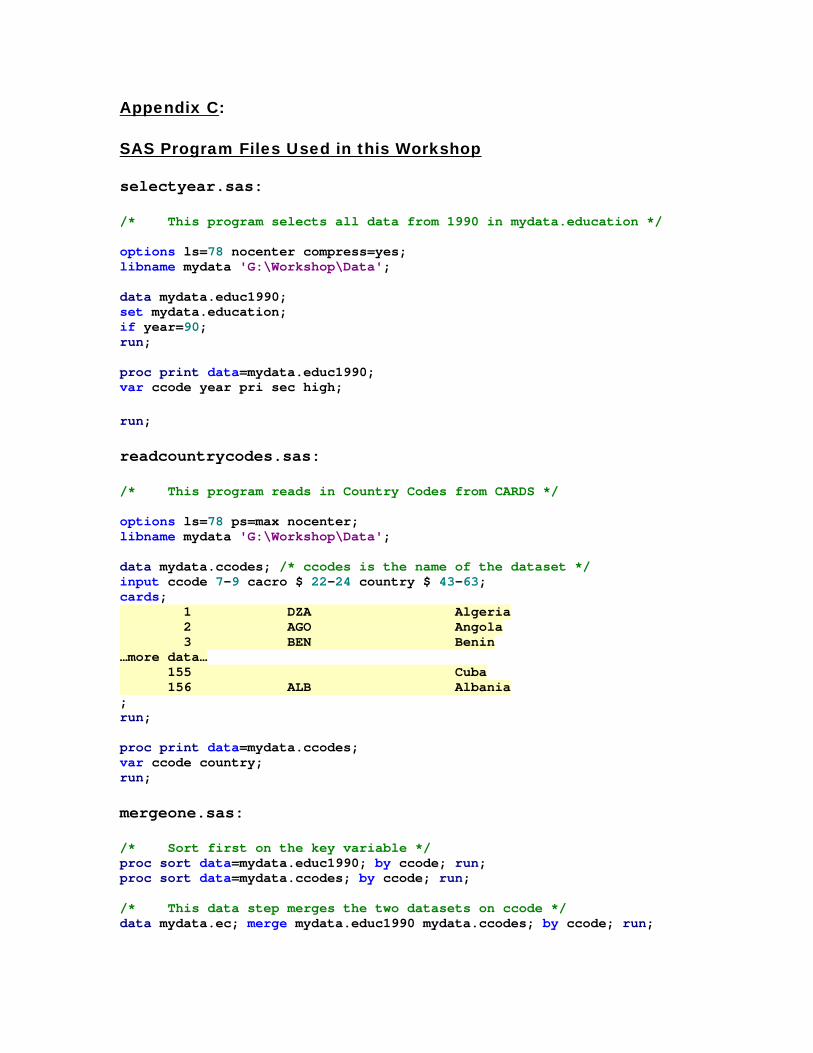
selectyear.sas:
/* This program selects all data from 1990 in mydata.education */ options ls=78 nocenter compress=yes; libname mydata 'G:\Workshop\Data'; data mydata.educ1990; set mydata.education; if year=90; run; proc print data=mydata.educ1990; var ccode year pri sec high;
run;
readcountrycodes.sas:
/* This program reads in Country Codes from CARDS */ options ls=78 ps=max nocenter; libname mydata 'G:\Workshop\Data'; data mydata.ccodes; /* ccodes is the name of the dataset */ input ccode 7-9 cacro $ 22-24 country $ 43-63; cards; 1 DZA Algeria 2 AGO Angola 3 BEN Benin …more data… 155 Cuba 156 ALB Albania ; run; proc print data=mydata.ccodes; var ccode country; run;
mergeone.sas:
/* Sort first on the key variable */ proc sort data=mydata.educ1990; by ccode; run; proc sort data=mydata.ccodes; by ccode; run; /* This data step merges the two datasets on ccode */ data mydata.ec; merge mydata.educ1990 mydata.ccodes; by ccode; run;

/* Trusty proc print */ proc print data=mydata.educ1990 noobs; var ccode pri sec high; run; proc print data=mydata.ccodes noobs; var ccode country; run;
proc print data=mydata.ec noobs; var ccode country pri sec high; run;
datatricks.sas:
/* This program calculates the mean for each level of educational */ /* attainment for each country using mean=sum/num */ /* We start with: Obs ccode year pri sec high 1 1 60 17.1 2.2 0.3 2 1 65 9.8 1.7 0.4 3 1 70 13.0 2.2 0.3 4 1 75 16.6 2.6 0.6 5 1 80 22.8 3.5 1.2 6 1 85 27.6 5.3 2.3 7 1 90 31.9 8.6 3.7 8 3 60 . 1.3 0.3 9 3 65 . 1.3 0.2 10 3 70 2.3 1.4 0.2 11 3 75 5.3 1.7 0.2 12 3 80 8.3 2.2 0.3 13 3 85 10.5 3.2 0.6 14 3 90 13.1 5.3 1.0 We end up with: Obs firstyear year ccode meanpri meansec meanhigh 1 60 90 1 19.83 3.73 1.26 2 60 90 3 7.90 2.34 0.40 */ options ls=78 nocenter compress=yes; libname mydata 'G:\Workshop\Data'; data temp; set mydata.education; by ccode; /* Initialize variables on the first instance of each ccode */ if first.ccode then do; numpri=0; numsec=0; numhigh=0; sumpri=0; sumsec=0; sumhigh=0; end; /* Count and sum the non-missing instances of pri, sec and high */ sumpri+pri; if pri ne . then numpri+1; sumsec+sec; if sec ne . then numsec+1; sumhigh+high; if high ne . then numhigh+1; /* On last observation for each Country, calculate mean and output the result */ if last.ccode then do;

if numpri ne 0 then meanpri=sumpri/numpri; if numsec ne 0 then meansec=sumsec/numsec; if numhigh ne 0 then meanhigh=sumhigh/numhigh; /* Take out the following comment once the program has been checked -- we only want the last observation. */ /* output; */ end; /* After testing, we can drop some variables */ /* drop year pri sec high sumpri sumsec sumhigh numpri numsec numhigh; */ run;

1
Introductory SAS WorkshopIntroductory SAS Workshop
Dave HaansDave HaansToronto RDCToronto RDC
[email protected]@utoronto.ca
What is SAS?What is SAS?No longer stands for No longer stands for ““SStatistical tatistical AAnalysis nalysis SSoftware,oftware,”” although we still use it for thatalthough we still use it for thatSAS is a suite of applications, many of which we SAS is a suite of applications, many of which we will never use will never use ☺☺SAS is available for Windows, Unix, Linux, Mac SAS is available for Windows, Unix, Linux, Mac OS and OS X, IBM OS/390 etc., etc.OS and OS X, IBM OS/390 etc., etc.We will use BASE SAS only in this workshop We will use BASE SAS only in this workshop –– a a small but crucial part of SASsmall but crucial part of SASSAS is the SAS is the ““Gold StandardGold Standard”” for statistics in for statistics in places such as Statistics Canadaplaces such as Statistics Canada
By the end of the workshopBy the end of the workshop……
WeWe’’ll have covered:ll have covered:The SAS Data StepThe SAS Data StepPopular options in programsPopular options in programsCreating variables/modifying data setsCreating variables/modifying data setsMerging data setsMerging data setsPrinting outputPrinting outputGroup processingGroup processing

2
Some SAS TerminologySome SAS Terminology
An An ObservationObservation is a single entry in a SAS is a single entry in a SAS dataset ( dataset ( ““recordrecord””)) A A VariableVariable is a single column in a SAS is a single column in a SAS dataset (dataset (““fieldfield””)) A A FileFile or or DatasetDataset is a table consisting of is a table consisting of columns and rows, that holds data columns and rows, that holds data ((““database tabledatabase table””))
SAS vs. SPSS vs. StataSAS vs. SPSS vs. StataSASSAS•• Uses Uses
programming programming (syntax) (syntax) primarilyprimarily
•• Strength is in Strength is in flexibility in flexibility in manipulating manipulating datasetsdatasets
•• Steeper Steeper learning curvelearning curve
SPSSSPSS•• Uses point and Uses point and
click, primarilyclick, primarily•• Strength is in Strength is in
analyzing analyzing existing existing datasets, data datasets, data entryentry
•• Less dramatic Less dramatic learning curvelearning curve
StataStata
•• Uses interactive Uses interactive sessions or syntaxsessions or syntax
•• Strength is in Strength is in analyzing existing analyzing existing datasetsdatasets
•• Moderate Moderate learning curve; learning curve; syntax is easy to syntax is easy to understandunderstand
•• Does processing Does processing in memoryin memory
SAS FilesSAS Files
1.1. Raw Data FilesRaw Data FilesTextText--only files, of any sizeonly files, of any size
2.2. SAS Data SetsSAS Data SetsReadable by SAS, processed more Readable by SAS, processed more efficientlyefficiently
3.3. SAS Program FileSAS Program FilePlainPlain--text syntaxtext syntax
(We use these…
to create these…
using these!)

3
SAS Program ComponentsSAS Program Components
1.1. DATADATA stepsstepsdata <new dataset name>;data <new dataset name>;
------[Programming][Programming]------
run;run;
2.2. PROCPROC stepsstepsproc print;proc print;
var <variable1 variable2 etc.>;var <variable1 variable2 etc.>;
run;run;
The DATA StepThe DATA Step
Typically (but not always):Typically (but not always):Used to read in raw data files or SAS data Used to read in raw data files or SAS data setssetsCreates a SAS data setCreates a SAS data setUsed to create and/or modify variablesUsed to create and/or modify variablesStarts with a Starts with a DATADATA statement and ends with a statement and ends with a RUNRUN statementstatement
The PROC StepThe PROC Step
Typically, SAS procedures are:Typically, SAS procedures are:Used to read SAS data sets to create reportsUsed to read SAS data sets to create reportsInternal SAS programs used to Internal SAS programs used to process/analyze a SAS data setprocess/analyze a SAS data setThe SAS analysis tools youThe SAS analysis tools you’’ll need to analyze ll need to analyze your datayour dataStarted with a Started with a procproc statement and ended with statement and ended with a a runrun statementstatement

4
Other Important SAS CommandsOther Important SAS Commands
libname <name> <libname <name> <‘‘directorydirectory’’>;>;Called a libref (library reference), this points to the Called a libref (library reference), this points to the directory (or folder) where your datasets residedirectory (or folder) where your datasets reside
options <options>;options <options>;Controls various aspects of the SAS SystemControls various aspects of the SAS SystemRemain in place until SAS session ended or options Remain in place until SAS session ended or options changedchanged
These tend to be placed outside of These tend to be placed outside of datadata and and procproc statementsstatements
A Short SAS ProgramA Short SAS Programselectyear.sasselectyear.sas
/*/*This program selects all data from 1990 in This program selects all data from 1990 in mydata.education */mydata.education */
options ls=78 nocenter compress=yes;options ls=78 nocenter compress=yes;libname mydata libname mydata ‘‘G:G:\\WorkshopWorkshop\\DataData’’;;
data mydata.educ1990;data mydata.educ1990;set mydata.education;set mydata.education;if year=90;if year=90;run;run;
proc print data=mydata.educ1990;proc print data=mydata.educ1990;var ccode year pri sec high;var ccode year pri sec high;run;run;
SAS Program OutputSAS Program Outputselectyear.sasselectyear.sas
Obs ccode year pri sec high1 1 90 31.9 8.6 3.72 3 90 13.1 5.3 1.03 4 90 40.6 7.1 1.04 7 90 38.2 6.8 1.05 9 90 21.7 3.9 0.56 12 90 20.7 23.2 3.87 13 90 19.3 15.9 7.58 16 90 6.3 5.7 0.19 17 90 24.2 16.9 0.9
10 21 90 44.6 7.1 0.8and so on…
(Now, let’s head into the lab!)