TOPLINE REPORT: LINKING DIGITAL TO SHAREHOLDER VALUE ...
39
THE DIGITAL STRENGTH INDEX TOPLINE REPORT: LINKING DIGITAL TO SHAREHOLDER VALUE + PUBLISHED JULY 2017
Transcript of TOPLINE REPORT: LINKING DIGITAL TO SHAREHOLDER VALUE ...

THE DIGITAL STRENGTH INDEXTOPLINE REPORT: LINKING DIGITAL TO SHAREHOLDER VALUE
+
PUBLISHED JULY 2017

If a firm isn’t gaining digital share, it is jeopardizing its future market share – yet few companies look at their
digital growth.
“
”JEFF MALING, CO-CEO ISOBAR US
2
https://hbr.org/2017/09/are-you-accurately-measuring-your-companys-digital-strength
+THE DIGITAL STRENGTH INDEX

3
Isobar and alpha-DNA are currently producing three digital strength reports.
The following is the July 2017 Topline report. For other reports, visit digitalstrength.isobar.com
DIGITAL STRENGTH REPORTS
+THE DIGITAL STRENGTH INDEX
1 32GROWTH REPORTTOPLINE REPORT PEER REPORTS
This reports provides a survey of
the top 1,000 companies. It scores
the leading industries and identifies
key leaders and laggards in major
categories such as audience and
content engagement.
This report is produced quarterly
following the conclusion of earnings
calls. It analyzes the past quarter’s
growth and the future quarter’s
projected growth through a lens of
digital strength to identify those
companies and industries on the
right track or at risk.
These reports analyze digital strength
at the peer group level. Using SIC
industry codes and custom peer
groups, we have created 200+ peer
groups for analysis. Domestic
airlines will be published in July
2017 with other peer groups
following close behind.
STRENGTH INDEX / WHITEPAPER
The index and associated white paper provide the underlying proof of the links between digital strength, revenue and
shareholder value.
4+THE DIGITAL STRENGTH INDEX
A CASE FOR DIGITAL TRANSFORMATION
At Isobar, we’ve spent 20 years advising companies on digital and helping them build leading digital experiences. Our clients have included HBO, Enterprise, and the U.S. Air Force. Clients that are public companies have struggled with these investments, questioning the size and speed of payback. Disruption is happening everywhere, but it’s easy to imagine one’s business has unique, high barriers to entry that others don’t. And some of the most disruptive things companies can do – new digital business models, even new brands – can have long paybacks and cannibalize existing businesses.
One short week of the Wall Street Journal told the story: • An article explained “Why All CEOs Need to be Tech
CEOs”• The J. Crew Group chairman lamented the company’s
slow movement to digital both in marketing and its supply chain
• Ford’s valuation fell behind Tesla’s, and it replaced its CEO because the company wasn’t moving fast enough against digital natives Uber and Google
The following week? Amazon bought Whole Foods.
Digital is a boardroom topic, and Digital Transformation is the imperative of 2017.

5+THE DIGITAL STRENGTH INDEX
A CASE FOR DIGITAL TRANSFORMATION
alpha-DNA and Isobar have partnered to create the Digital Strength Index. The Index is an aggregate measure of the top 1,000 public companies. Based on over five years of data gathering, analysis and benchmarking, the primary focus of the measure is to assess the digital performance of companies and translate that into forward-looking, top-line growth expectations. We have proven the link between digital strength and shareholder value in a way that passes the rigorous standards of hedge funds.
Isobar has always believed in a link between digital strength and shareholder value, for good and for ill. Companies that give only glancing attention to digital risk long-term value destruction. When we met alpha-DNA –a data provider to hedge funds that uses digital data to predict revenue growth – we knew we could prove our intuition was right and give clients an empirical way to measure their investments in digital transformation.

6
K E Y F I N D I N G S
+THE DIGITAL STRENGTH INDEX
As part of the ongoing Isobar and alpha-DNA Digital Strength Index (DSI) study, we look at nearly 10,000 data points across the top 1,000 companies in the U.S. We use the Global Industry Classification Standard (GICS), the taxonomy of the financial community, and apply a proprietary scoring mechanism.
DIGITALSTRENGTH TOPLINE REPORT
7
This report is our broad, annual review of the
link between digital strength, shareholder
value and future revenue.
Convincing empirical evidence emerges:
• Companies in the top decile of the DSI have next-year revenue of +10%. The bottom decile has -8%. That’s a nearly 20-point difference between digital leaders and laggards in a single year.
• Companies in the top decile beat quarterly estimates 65% over the past 5 years. The bottom decile? Just 45% of the time.
• The gap between leaders and laggards holds regardless of industry.
• The long-term impact of being a digital laggard is devastating, with a 12% loss in shareholder value over a three-year period, a decline that increases with time.
+THE DIGITAL STRENGTH INDEX

8+THE DIGITAL STRENGTH INDEX
KEY FINDINGS
It’s a world of digital haves and digital have nots.
• Divide the long list of companies into 20 roughly equal segments; the top twentile – the top 50 companies – are greater than the sum of the next 19 twentiles in nearly every category.
• There are 30 digital leaders in the top twentile in four or more categories, making them digitally dominant.
• Think most companies don’t compete digitally with the top 50? Consider Amazon’s purchase of Whole Foods –proof that a competitive landscape can change instantly.
Of the 11 GICS industry sectors, Consumer Discretionary and Information Technology lead in digital strength.
• Real estate is relatively low on the DSI, but has the most Momentum; i.e., the most indicators with positive acceleration.
• Telcos have huge Magnitude (overall digital presence), but suffer from low Momentum and low Growth. Will their entry into content (Direct TV, Verizon) make them more digitally relevant?

9+THE DIGITAL STRENGTH INDEX
KEY FINDINGS
Social is even more segregated between the haves and have nots.
If Facebook alone were a country, it would be the most populous on earth — yet many of the top 1,000 companies have little or no social presence.
• 30% of the top 1000 have no Facebook presence
• 40% have no YouTube presence
• 70% have no Instagram presence
Major industries such as travel still suffer from complex, difficult-to-use online systems.
Engagement time is great for media companies like Netflix and Pandora or a service like H&R Block, but it’s a negative for Alaska Air and Spirit Airlines, which should let users book travel quickly.
Consumer package goods is struggling to find relevance in digital.
Companies such as Colgate Palmolive and Dr Pepper have very low engagement online. Does this make them vulnerable to upstart brands with strong social followings? Or does this eventually give them less power as more brands sell online and shelf space is no longer finite?

A B O U T T H E D I G I T A L S T R E N G T H I N D E X
10+THE DIGITAL STRENGTH INDEX

DIGITALBUREAU
11
PART 1: Aggregates vast amounts of digital data by company into a digital bureau.
+THE DIGITAL STRENGTH INDEX
We define digital identities for the top 1,000 public companies by building, maintaining and updating a proprietary Digital Bureau of companies and brands. It’s broad-based and includes various data types across website, search and social platforms.
Every month we track more than 75 billion digital consumer interactions to hone in on change in velocity across businesses. Raw data is then cleaned and aggregated into a time series associated with each digital entity.

DIGITALBUREAU
12
PART 1: CONTINUED
+THE DIGITAL STRENGTH INDEX
R A N K I N GRank of a brand relative to its competitors measured across multiple data sources
A U D I E N C EMeasure of a brand’s overall consumer base in the digital context
T R A F F I CRepresents the quantity and quality of digital consumer interactions for a brand
E Y E B A L L SMeasure of a brand’s share of overall digital content consumed
T I M E S P E N TMeasure of a brand’s time engagement during a digital consumer interaction
I N T E R A C T I O N SMeasure of a brand’s content engagement during a digital consumer interaction
I N T E R E S TIntensity of consumer searches for a brand relative to its peers
L O YA L I S TConsumer patronage for a brand across the large digital social networks
DIGITAL DIMENSIONS

STRENGTH INDEX
13+THE DIGITAL STRENGTH INDEX
M A G N I T U D ESize of a company’s digital presence (web, search, social)
S H A R EShare of digital relative to share of totalrevenue (offline + online)
M O M E N T U MSequential digital acceleration in recent times
G R O W T HForward looking topline growth rate projections
T R A J E C T O RYCorrelation of digital demand trends to overall revenue trends
PART 2: Uses proprietary learning algorithm to build an index comprised of five building blocks.
We define digital identities for the top 1,000 public companies by building, maintaining and updating a proprietary Digital Bureau of companies and brands. It’s broad-based and includes various data types across website, search and social platforms.
D I G I TA L S T R E N G T H I N D E XAggregate measure of the relative digital position of a company

FINANCIAL ANALYSIS
14+THE DIGITAL STRENGTH INDEX
PART 3: Translates revenue estimates into ESP estimates and identifies asymmetries against analyst expectations.
F U N D A M E N TA L S D ATA B A S E
alpha-DNA’s financial clients use a more timely version of this information to inform their trading decisions. We use it to confirm that our data is correctly predicting revenue, earnings and shareholder value.
REVENUE EARNINGS PER SHARE
E X P E C TAT I O N S D ATA B A S E
P R I C E D ATA B A S E
CONSENSUS ESTIMATES RECOMMENDATION AND REVISIONS SURPRISE HISTORY
STOCK PRICE MARKET CAP OPTIONS
Access to annual and interim/quarterly data and detailed historical financial statements (10K, 10Q content) for all public companies in the U.S.
Estimates provide comprehensive consensus- and detail-level estimates and statistics from leading investment banks and research firms.
Price database provides access to U.S. market prices, including historical and daily pricing across multiple asset classes.

T O P L I N E R E V E N U E G R O W T H Y O Y %
15+THE DIGITAL STRENGTH INDEX
Top 1,000 companies rank order by our proprietary Digital Strength signal every month
(consensus expectation next quarter)
-8.2 -6.3 -3.0 -.02
-0 1.9 3.3 4.3 5.4 6.0 9.6
LEADERS
LAGGARDS
POOR DIGITAL STRENGTH
GOOD DIGITAL STRENGTH
% 45.7 48.8 49.1 53.0 52.9 54.8 56.3 63.651.0 55.2
Top-ranked stocks based on Digital Strength Index have beaten quarterly consensus revenue expectation ~64% of the time, compared to a revenue beat rate of only ~46% respectively for bottom-ranked stocks.
% O F C O M P A N I E S B E A T I N G R E V E N U E E S T I M A T E
DIGITAL STRENGTH IS A STRONG PREDICTOR OF REVENUE GROWTH
The first question to be asked of any index is whether it is truly predictive. In this case, the top decile of digital strength companies have next year revenues of +10%, whereas the bottom decile has -8% – a nearly 20-point difference between laggards and leaders in a single year. The index is even predictive in a shorter window, with an 18-point difference between top and bottom companies in terms of beating quarterly revenue estimates.

16
DIGITAL STRENGTH IS A LEADING GROWTH INDICATOR BY SECTOR
+THE DIGITAL STRENGTH INDEX
CONSUMER DISCRETIONARY .8% 4.6% 6.0%
CONSUMER STAPLES (2.8%) 1.7% 4.1%
ENERGY (14.4)% (11.5)% (5.9)%
HEALTHCARE 3.6% 8.8% 17.6%
INDUSTRIALS (1.1%) .3% 3.3%
INFORMATION TECHNOLOGY (1.5%) 3.3% 9.1%
MATERIALS (5.0%) (2.8%) 3.1%
TELECOM SERVICES 6.4% 6.7% 9.1%
UTILITIES .5% 1.3% 3.8%
Bottom 1/3
(YoY% next year, average)
T O P L I N E R E V E N U E G R O W T H , B R E A K D O W N B Y S E C T O R
Average Top 1/3
While it may be easy to see digital strength as critical for industries in the throes of disruption (e.g., media, retail), it may be easy to assume that it is less important for industries where digital is seemingly a smaller part of the value proposition (e.g., energy). In fact, the strength index is equally predictive across industries. For example, while energy had a very tough 2016, identified digital leaders (as calculated at the beginning of 2016) outperformed laggards by 8 percentage points even while the industry as a whole declined 11.5%.

17
DIGITAL WEAKNESS IS A STRONG PREDICTOR OF VALUE EROSION
+THE DIGITAL STRENGTH INDEX
(0.6) (1.0) (1.3)(3.0)
(6.3)
(10.8)(12.5)
1-m 2-m 3-m 1-y 2-y 3-y Max
Relative (under)performance in stock price of the weakest (Bottom 10%)Digital Strength Index companies overtime during 2012-2016
In our portfolio of the Top 1,000 companies, during the 2012-2016 period, companies lagging their peers in terms of digital performance often continue to slide down the vicious cycle of value erosion.
T H E C O S T O F B E I N G A D I G I TA L L A G G A R D H A S S E R I O U S L O N G - T E R M I M P L I C A T I O N S

CONCLUSION
18
In summary, CEOs and boards should
strongly consider Digital Strength as they
contemplate the investments required to
transform their businesses in the digital
economy. While success may follow a
different investment profile and metrics than
they are used to, Digital Strength will
translate into revenue increases and
improvement in shareholder value.
+THE DIGITAL STRENGTH INDEX
Based upon five years of empirical data, digital strength is a strong predictor of revenue and shareholder value. The data also shows that digital leaders outperform digital laggards in all industries versus simply those with visible disruption occurring (e.g., retail, media). It is also important to note that being a digital laggard may represent a fundamental business model challenge (e.g., retail store video rental with Blockbuster), but those business model challenges can be addressed (e.g., Netflix successfully pivoted from mailing DVDs to content streaming) with a proper digital transformation strategy.
It is also important to note that being a “modern” company does not inoculate you from disruption as LinkedIn’s eclipsing of online recruiting pioneer Monster illustrates. Even Digital Strength as defined by our own index does not inoculate companies from digital disruption. It is possible to gain digital strength through outsized offline and online media spending which drives traffic to web, mobile and social channels. While effective in the short term and a part of any long-term digital strategy, companies should fundamentally embrace digital transformation as a more sustainable form of competitive advantage.
DIGITAL DIMENSIONS IS TIED TO INCREASED REVENUE AND SHAREHOLDER VALUE

TOPLINE REPORT
19+THE DIGITAL STRENGTH INDEX

20
THE TOPLINE REPORT COVERS FOUR MAIN AREAS
+THE DIGITAL STRENGTH INDEX
A sector level summary of digital strength illustrating which industries are leaders and laggards across the strength components
Key website rankings (such as audience, content engagement) and the leaders and laggards in each
Interest rankings illustrating the top companies in terms of branded search
Social rankings illustrating the leaders and laggards in key social platforms such as Facebook and YouTube
21+THE DIGITAL STRENGTH INDEX
SUMMARYANALYSIS
D I G I TA L S T R E N G T H I S H I G H LY C O N C E N T R AT E D , O F F E R I N G R I S K A N D O P P O R T U N I T Y F O R T H E T O P 1 0 0 0 C O M PA N I E S .
• The bottom twentile is littered with REITS, energy companies and other companies which are more investment vehicles than companies like P&G. The bottom is therefore less interesting except that real estate has the most momentum of any industry so these REITS are beginning to see the power of digital in their industry.
• Social is even more segregated between the haves and have nots. Many of the top 1,000 companies have very little or no social presence at all. On the surface this makes some sense. Do you really want to “like” your local oil drilling company on Facebook? Probably not. However, where there is white space, there is opportunity. Boeing, for example, dominates YouTube because of its vast library of plane videos. Could other companies use social in non-traditional ways to improve their profile?
• It is a world of digital haves and digital have nots. The top 50 companies (the top twentile) are greater than the sum of the next 19 twentiles in nearly every category. This can be interpreted in a number of ways. Clearly digital companies like Facebook, Google and even Apple (a digital company with physical products) dominate digital ranking. That is no surprise. Most of these companies were built the same way. First they gained an audience and then they monetized, which is an important lesson for traditional corporations looking to transform digitally. In addition, while it might be more helpful to look at your peer group than to compare yourself to Amazon, that only holds true until Amazon turns its sights on you.
• Furthermore, there are 30 digital leaders who are in the top twentile in four or more categories making them truly dominant digitally. There are 52 companies that lead in three or more categories.

22+THE DIGITAL STRENGTH INDEX
A NOTE ON THE DATA SET AND METHODOLOGY
• Site data reflects public sites and login pages, but not behind-the-firewall sites. We therefore know that millions of people hit the login page for Chase, but we don’t know how much time they spend on the Chase banking site. While more data would always be better, the public data is very predictive even without the private data.
• We use GICS codes for our industry classification. We also have formed custom peer groups (including Priceline in our airline peer group, for example). Ultimately, we have 200+ peer groups and the ability to slice and dice the data in many ways.
• Our index is from 1 to 100, with 1 as the lowest score and 100 as the highest score.
• We utilize Z scores a fair amount in our analysis. A Z score indicates how many standard deviations an element is from the mean. It is a simple way to show relative performance. The Z scores are calculated per peer group. So while a company may have one Z score when compared against the entire data set, they will have a different Z score when compared against their peer group.
NOTE: We will continually update the data and on a custom basis will add private companies, foreign companies and create custom peer groups. We reflect M&A activity; however, if a merger occurs after our published data, than obviously it is not included.
• The total companies covered in the index is 1,029. This approximates the Russell 1000, but is not exact. It covers U.S. companies and certain foreign companies traded through ADRs in the U.S. For example, Honda is covered whereas BMW is not.
• This coverage currently is for public companies only which excludes companies such as Enterprise Holdings and Frontier Airlines.
• For the most part, data is summarized at the ticker level (e.g., Disney) rather than the brand level (e.g., media). We will break down the analysis by brand, but this analysis lacks the tie-back to revenue or shareholder value, which is why our core analysis focuses at the ticker level.
SECTOR SCORES
# COMPANIES 221 58 68 135 113 151 168 57 83 8 44
OVERALL DSI 69 51 54 37 42 45 61 35 41 41 36
MAGNITUDE 76 67 34 35 39 47 58 34 14 73 46
WEBSITE SCORE 0.09 (0.11) (0.25) 0.00 (0.10) (0.02) 0.22 (0.21) (0.25) 0.18 (0.01)
SEARCH SCORE 0.13 0.02 (0.14) (0.07) (0.14) (0.10) 0.26 (0.14) (0.14) 0.35 (0.13)
SOCIAL SCORE 0.22 0.08 (0.11) (0.09) (0.11) (0.10) 0.26 (0.14) (0.14) 0.35 (0.13)
PENETRATION SCORE 0.06 (0.00) (0.08) (0.07) (0.08) (0.07) 0.20 (0.08) (0.09) 0.03 (0.08)
ENGAGEMENT SCORE 0.19 (0.27) (0.30) 0.06 (0.13) 0.05 0.13 (0.36) (0.36) 0.22 0.05
POPULARITY SCORE 0.14 0.06 (0.09) (0.08) (0.09) (0.08) 0.14 (0.09) (0.09) (0.02) (0.09)
SHARE 70 53 36 35 43 44 63 26 42 51 33
MOMENTUM 43 43 53 48 51 52 51 56 62 35 43
GROWTH 51 40 75 50 43 45 49 48 55 27 43
TRAJECTORY 55 52 46 46 52 44 52 46 48 46 49
CONS DISC
CONS STAPLES
ENERGY FINANCIAL HEALTHCARE INDUSTRIAL INFO TECH
MATERIAL REAL ESTATE
TELECOM UTILITIES
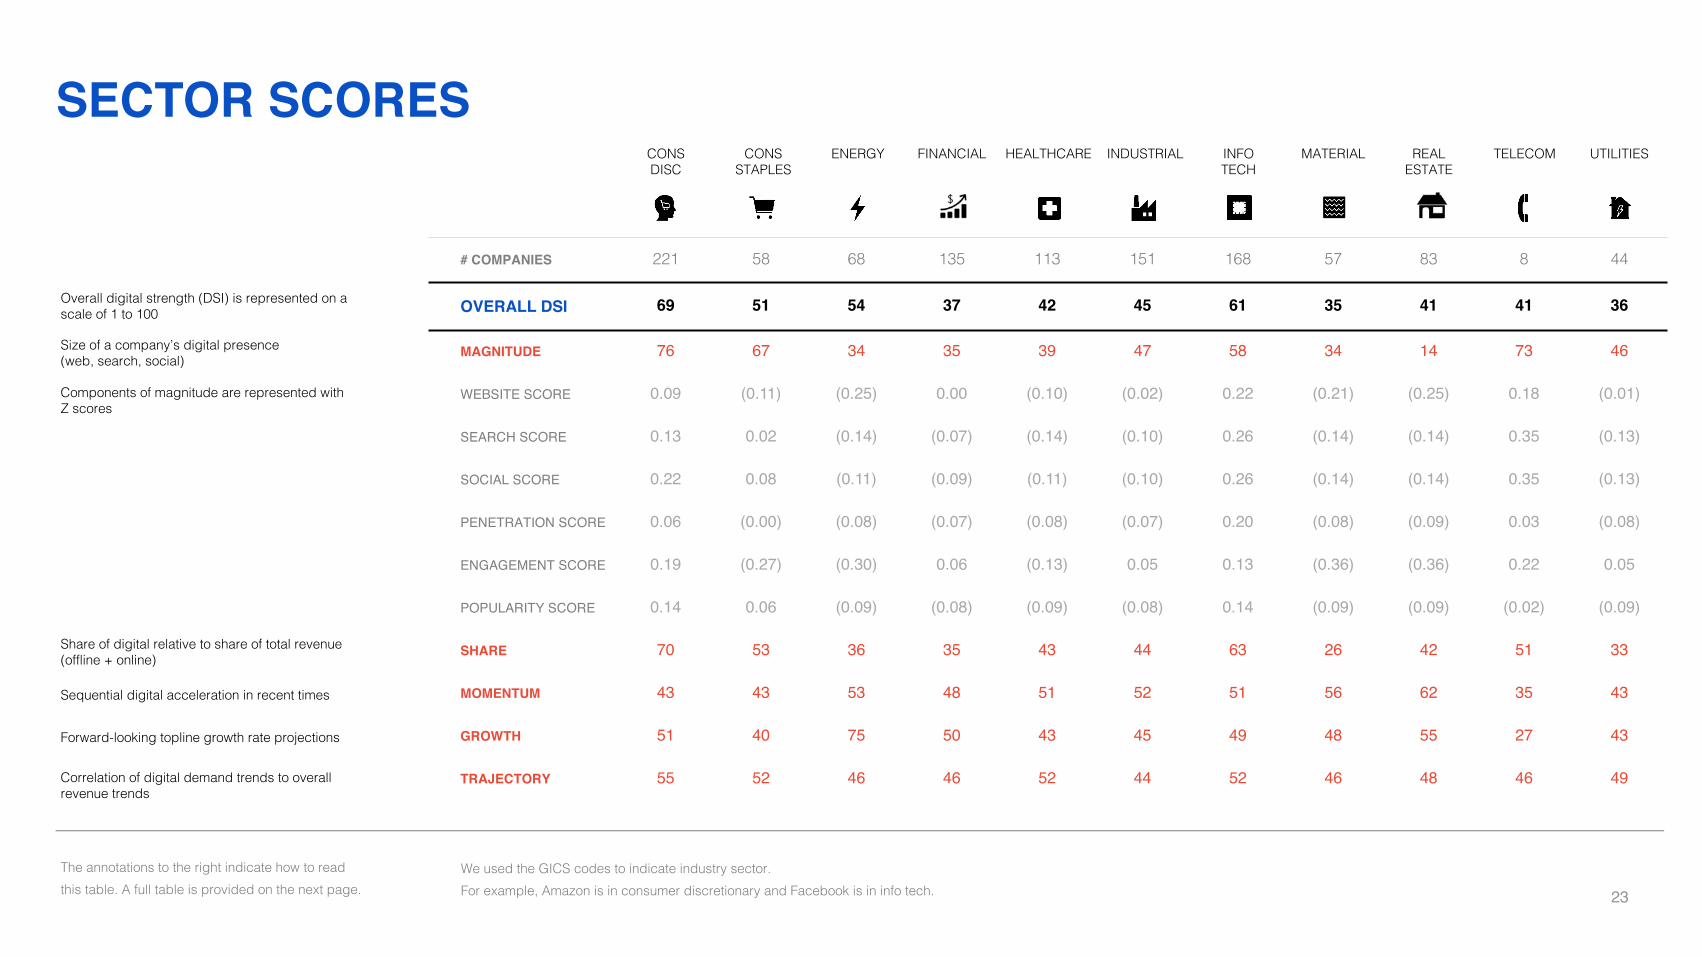
Overall digital strength (DSI) is represented on a scale of 1 to 100
Components of magnitude are represented with Z scores
Share of digital relative to share of total revenue (offline + online)
Sequential digital acceleration in recent times
Forward-looking topline growth rate projections
Correlation of digital demand trends to overall revenue trends
Size of a company’s digital presence (web, search, social)
We used the GICS codes to indicate industry sector. For example, Amazon is in consumer discretionary and Facebook is in info tech.
The annotations to the right indicate how to read this table. A full table is provided on the next page. 23

SECTOR SCORES
# COMPANIES 221 58 68 135 113 151 168 57 83 8 44
OVERALL DSI 69 51 54 37 42 45 61 35 41 41 36
MAGNITUDE 76 67 34 35 39 47 58 34 14 73 46
WEBSITE SCORE 0.09 (0.11) (0.25) 0.00 (0.10) (0.02) 0.22 (0.21) (0.25) 0.18 (0.01)
SEARCH SCORE 0.13 0.02 (0.14) (0.07) (0.14) (0.10) 0.26 (0.14) (0.14) 0.35 (0.13)
SOCIAL SCORE 0.22 0.08 (0.11) (0.09) (0.11) (0.10) 0.26 (0.14) (0.14) 0.35 (0.13)
PENETRATION SCORE 0.06 (0.00) (0.08) (0.07) (0.08) (0.07) 0.20 (0.08) (0.09) 0.03 (0.08)
ENGAGEMENT SCORE 0.19 (0.27) (0.30) 0.06 (0.13) 0.05 0.13 (0.36) (0.36) 0.22 0.05
POPULARITY SCORE 0.14 0.06 (0.09) (0.08) (0.09) (0.08) 0.14 (0.09) (0.09) (0.02) (0.09)
SHARE 70 53 36 35 43 44 63 26 42 51 33
MOMENTUM 43 43 53 48 51 52 51 56 62 35 43
GROWTH 51 40 75 50 43 45 49 48 55 27 43
TRAJECTORY 55 52 46 46 52 44 52 46 48 46 49
CONS DISC
CONS STAPLES
ENERGY FINANCIAL HEALTHCARE INDUSTRIAL INFO TECH
MATERIAL REAL ESTATE
TELECOM UTILITIES
It is no surprise that consumer discretionary and info tech lead given the high proportion of digital companies in their ranks. It is also not surprising that real estate (mainly represented by REITS) and energy lag. However, real estate shows the most momentum suggesting that they are waking up to digital. Conversely, telecom has a large digital presence, but is suffering from poor growth and poor momentum suggesting that this industry with few very large players is in a battle for share with challenges to long-term growth. Yahoo is listed separately in these numbers from Verizon (AT&T includes DIRECTV), but it will be interesting to watch if AT&T or Verizon can expand outside of their core offering. Search is strangely dominated by telecom which illustrates their massive investment in media to steal share from other competitors.
Sector Score Detail – without annotations
24

25+THE DIGITAL STRENGTH INDEX
SUMMARY ANALYSIS –WEBSITE METRICS
W E L O O K E D AT S I X M E T R I C S I N C L U D E D W I T H I N O U R D I G I TA L S T R E N G T H I N D E X R E L AT E D T O W E B S I T E S .
Fifty-two companies were in the top 50 in at least three of the six categories, illustrating the high concentration in the Index. Only Facebook scored in the top 50 in all categories. While many of the companies are digital native, there are a strong set of traditional companies (e.g., Walmart, American Express) who are amongthe leaders.
Companies in top Twentile in 6 CategoriesFacebook
Companies in top Twentile in 5 CategoriesAlibaba Group Holding Ltd. Sponsored ADRComcast Corporation Class ASalesforce.com Inc.Expedia Inc.Alphabet Inc. Class CIntuit Inc. Netflix Inc. Pandora Media Inc.Wells Fargo & Company Wal-Mart Stores Inc. Yelp Inc. Zillow Group Inc. Class C
Companies in top Twentile in 3 CategoriesAdobe Systems Incorporated CBS Corporation Class BCapital One Financial CorporationCisco Systems Inc. Walt Disney Company Dell Technologies Inc. Class V eBay Inc. Endurance International Group Holdings Inc. FedEx Corporation Twenty-First Century Fox Inc. Class B GoDaddy Inc. Class A Groupon Inc. HP Inc. IAC/InterActiveCorp. Microsoft Corporation News Corporation Class B Oracle Corporation Spirit Airlines Inc. Sony Corporation Sponsored ADR AT&T Inc. TripAdvisor Inc. Time Warner Inc.
Companies in top Twentile in 4 CategoriesApple Inc. Amazon.com Inc.American Express Company Bank of America Corporation Best Buy Co. Inc. Discovery Communications Inc. Class C Home Depot Inc. JPMorgan Chase & Co. LinkedIn Corporation Class A Match Group Inc. Priceline Group Inc. PayPal Holdings Inc. Target Corporation Twitter Inc. United Parcel Service Inc. Class BVerizon Communications Inc. Yahoo! Inc.

26+THE DIGITAL STRENGTH INDEX
Monthly audience is heavily skewed towards the top with the digital leaders owning nearly all the top spots with a few additional companies noted below.
While the lower-scoring industries (energy, real estate) dominate the lower echelons, there were a few surprises such as Continental Building Products (an area with some digital momentum) and Travel Centers of America (companies with lots of locations typically have a larger audience).
Overall, there is significant room for improvement. While Facebook-like audiences are not realistic for many companies, a solid audience of customers and investors is essential for future momentum.
35,453
800 262 125 74 51 37 29 22 17 13 10 7 5 4 3 2 1 1 1
LOWHIGH
ActivisionCisco
John Wiley & Sons Inc.
Class AThomson Reuters
Corporation
Continental Building Products
Ligand Pharmaceuticals
New Market Corporation
Nu SkinRange Resources
Wesco InternationalTravel Centers of
America
EXAMPLE COMPANIES FROM TOP 5% EXAMPLE COMPANIES FROM BOTTOM 5%
AUDIENCE
Monthly Audience (users per million)
M E A S U R E O F A C O M P A N Y ’ S O V E R A L L C O N S U M E R B A S E I N T H E D I G I TA L C O N T E X T

27+THE DIGITAL STRENGTH INDEX
LOWHIGH
EXAMPLE COMPANIES FROM TOP 5% EXAMPLE COMPANIES FROM BOTTOM 5%
TRAFFIC
Monthly Page Views (k)
S E T O F M E A S U R E S T H A T R E P R E S E N T T H E Q U A N T I T Y A N D Q U A L I T Y O F D I G I TA L C O N S U M E R I N T E R A C T I O N S F O R A C O M P A N Y
1,249,161
20,523 6,868 3,223 1,899 1,300 905 668 486 370 276 199 143 96 63 40 24 13 7 2
Adobe SystemsBank of America
Capital OneeBay
FacebookHome Depot
JPMorgan Chase & Co.News Corp.
OracleTwitterYahoo!
Assured GuarantyBrookdale Senior
Living Inc.Century
AluminumEquity
CommonwealthLeggett & Platt
Liberty Property TrustNational Retail Properties Inc.
Rowan Cos. STORE Capital
Corporation

28+THE DIGITAL STRENGTH INDEX
LOWHIGH
EXAMPLE COMPANIES FROM TOP 5% EXAMPLE COMPANIES FROM BOTTOM 5%
EYEBALLS
Monthly Page Views (k)
M E A S U R E S A C O M P A N Y ’ S S H A R E O F O V E R A L L D I G I TA L C O N T E N T C O N S U M E D
14,932,402
132,932 51,903 20,926 11,682 7,630 5,292 3,491 2,553 1,743 1,259 925 587 399 230 141 90 44 22 7
ADPBest Buy
Salesforce.comExpedia
GoDaddyIAC
Microsoft Target
UPSYelp
Alexion Pharmaceuticals
Continental Building Products
Cloud Peak EnergyEquity OneMedivation
Nu Skin Two Harbors Investment
WPX Energy

29+THE DIGITAL STRENGTH INDEX
LOWHIGH
EXAMPLE COMPANIES FROM TOP 5% EXAMPLE COMPANIES FROM BOTTOM 5%
TIME ENGAGEMENT
Time Engagement (seconds)
D I M E N S I O N S T H A T C A P T U R E A C O M P A N Y ’ S A B I L I T Y T O E N G A G E C O N S U M E R S D U R I N G A D I G I TA L I N T E R A C T I O N
1,028
564
468 415
378 347
317 295 274 254 239 222 208 192 175 160 146 125 102 58
Alaska Air GroupCable OneDiscovery
CommunicationsDISH Network
H&R BlockNorwegian Cruise Line
Pandora Media
Spirit AirlinesVeriSign
Affiliated Managers Group Inc.Dr Pepper Snapple
Group Inc.
Hospitality Properties Trust
Life Storage Inc.OPKO Health Inc.
Surgical Care Affiliates Inc.
Ventas Inc.Western Alliance
Bancorp
Time engagement is great if you are a media company like Netflix or Pandora. Or a service such as H&R Block. However, it is not a positive distinction for travel companies like Alaska Air and Sprit Airlines. While travel booking is involved, the goal should be a design that allows users to complete the task as simply as possible. There is an argument to be made that the cruise lines require more research and have more content to consume, but they should also be striving to quickly and easily complete bookings. Dr Pepper and other CPG brands are notably in the bottom on this list. Brands such as Coca Cola have done a much better job of using content, music and entertainment to engage users and keep their brand in front of the digitally-minded consumer. Our analysis would suggest that this will create long-term relative advantage for Coca Cola over Dr Pepper.

30+THE DIGITAL STRENGTH INDEX
LOWHIGH
EXAMPLE COMPANIES FROM TOP 5% EXAMPLE COMPANIES FROM BOTTOM 5%
CONTENT ENGAGEMENT
Content Engagement (pages)
D I M E N S I O N S T H A T C A P T U R E A C O M P A N Y ’ S A B I L I T Y T O E N G A G E C O N S U M E R S D U R I N G A D I G I TA L I N T E R A C T I O N
Aetna Inc.Carnival Corporation
Alphabet Inc.Kohl's Corporation
Match Group Inc.Polaris
Industries Inc.Royal Caribbean
Cruises Ltd.
Wells Fargo & CompanyZillow Group Inc.
Colgate PalmoliveCSRA Inc.
Equity One Inc.Intercontinental Exchange Inc.
LPL Financial Holdings Inc.
Mettler-Toledo International
PacWest BancorpUnited States Steel
Corporation
14.5
9.4 8.2
7.4 6.9 6.3 5.9 5.5 5.1 4.8 4.4 4.1 3.9 3.7 3.5 3.2 3.0 2.7 2.4
1.8
Retail, travel, dating and real estate dominate the pages per session. With regards to travel, the question is whether the user is consuming necessary content or the process is unnecessarily complex. Notable again are the CPG companies such as Colgate-Palmolive on bottom of the list. Consumers spend on average 20 hours a week on the internet. If CPG brands cannot effectively engage, they risk disruption. This is especially true when the dam breaks on online commerce for grocery. Without shelf space as a competitive advantage and barrier to entry, CPG brands could seriously suffer. Look no further than Harry’s razors entering Target to see what disruption might look like.

31+THE DIGITAL STRENGTH INDEX
LOWHIGH
EXAMPLE COMPANIES FROM TOP 5% EXAMPLE COMPANIES FROM BOTTOM 5%
Monthly Interest (k)
I N T E N S I T Y O F C O N S U M E R S E A R C H E S F O R A C O M P A N Y
American Airlines Group Inc.
AutoZone Inc.Groupon Inc.
J.C. Penney Company
Inc.McDonald's CorporationNetflix Inc.
Starbucks Corporation
Verizon Communications Inc.
Walgreens Boots Alliance Inc.
ACADIA Pharmaceuticals Inc.
AGNC Investment Corp.
American Homes 4 Rent
B/E Aerospace Inc.Care Capital
Properties Inc.Eversource
Energy
Forestar Group Inc.Nobilis Health Corp.Marvell Technology
Group Ltd.
INTEREST
8,896
1,592 545 223 111 67 45 30 21 13 10 7 5 3 2 1 0 0 0 0
Interest measures consumer searches for a brand. Companies with many locations have an advantage as location searches increase (e.g., where is the nearest Starbucks?).

32+THE DIGITAL STRENGTH INDEX
LOWHIGH
EXAMPLE COMPANIES FROM TOP 5% EXAMPLE COMPANIES FROM BOTTOM 5%
Facebook Loyalists (k)
Amazon.com Inc.Abercrombie &
Fitch Co.Walt Disney Company
Domino's Pizza Inc.
Foot Locker Inc.Coca-Cola Company
NIKE Inc.
PepsiCo Inc.Visa Inc.
310 companies have no Facebook presence at all.
44,480
7,276
3,038 1,450 730 360 166 87 43 23 13 7 3 1 0 0 0 0 0 0
F A C E B O O K L O YA L I S T S
It is clear that many corporations consider Facebook a personal medium, meaning it is dominated by consumer brands. However, as the most dominant social medium by far, it is worth considering a strategy for Facebook even if you are a B2B company. Video is a growing trend on Facebook and offers significant opportunity even for companies of all types. The Futurism channel on Facebook provides an interesting example for companies who have complex context that they need to present in an understandable way.

33+THE DIGITAL STRENGTH INDEX
LOWHIGH
EXAMPLE COMPANIES FROM TOP 5% EXAMPLE COMPANIES FROM BOTTOM 5%
CBS CorporationDelta Air Lines Inc.
Walt Disney Company
Electronic Arts Inc.
General Motors Company
Michael Kors Holdings Ltd
NVIDIA Corporation
Ralph Lauren Corporation
Urban Outfitters Inc.
281 companies have no Twitter presence
12,850
906 366 181 93 54 36 24 16 11 7 4 3 1 0 0 0 0 0 0
Twitter Loyalists (k)
T W I T T E R L O YA L I S T S
Twitter Is dominant as a real-time news channel and as a customer-service channel (and as the favorite late-night channel for the nation’s President). While Twitter has had its challenges monetizing its business, it should remain a key part of any social media strategy.

34+THE DIGITAL STRENGTH INDEX
LOWHIGH
EXAMPLE COMPANIES FROM TOP 5% EXAMPLE COMPANIES FROM BOTTOM 5%
Autodesk Inc.AMC Networks Inc.Boeing Company
Ford Motor Company
Twenty-First Century Fox Inc.
IBMIntel Corporation
Lowe's Companies Inc.
Tesla Inc. 400 companies have no YouTube presence
YOUTUBE
4,085
90 37 18 10 5 3 2 1 1 0 0 0 0 0 0 0 0 0 0
YouTube Loyalists (k)
Y O U T U B E L O YA L I S T S
YouTube could present an interesting opportunity for brands. It is a very underutilized channel with most of the traffic being associated with movie companies (AMC Networks) or how-to videos (Autodesk). However, Boeing has successfully leveraged its vast trove of videos to create a nice presence. And given the popularity of video with all consumers, it remains a channel with possibilities for all brands.

35+THE DIGITAL STRENGTH INDEX
LOWHIGH
EXAMPLE COMPANIES FROM TOP 5% EXAMPLE COMPANIES FROM BOTTOM 5%
Citigroup Inc.Chipotle Mexican
Grill Inc.Discovery
Communications
GameStop Corp. Hilton Worldwide
Holdings Inc.Marriott International Inc.
MGM Resorts
InternationalToyota Motors
Wendy's Company
750 companies have no presence.
GOOGLE+
20,103
164 7 1 0 0 0 0 0 0 0 0 0 0 0 0 0 0 0 0
Google+ Loyalists (k)
G O O G L E + L O YA L I S T S
While clearly the laggard of social channels, Google+ does offer upside for companies. It is a green field where companies could choose to innovate and experiment.

36+THE DIGITAL STRENGTH INDEX
LOWHIGH
EXAMPLE COMPANIES FROM TOP 5% EXAMPLE COMPANIES FROM BOTTOM 5%
American Eagle Outfitters Inc.
Coach Inc.Dunkin' Brands
Group Inc.
Gap Inc.Harley-
Davidson Inc.Nordstrom Inc.
Kate Spade & Co
Lululemon Athletica Inc.
Ulta Beauty Inc.
652 companies have no presence.
11,681
679 222 75 25 9 3 1 0 0 0 0 0 0 0 0 0 0 0 0
Instagram Loyalists (k)
I N S TA G R A M L O YA L I S T S
Similar to YouTube, Instagram could provide an interesting opportunity for companies. While associated with fashion and consumer brands, it isn’t hard to imagine how a real estate company could better leverage Instagram to humanize their brand and make it more accessible.

37
CONTRIBUTORS
Arun Muthupalaniappan
Arun is co-founder and Managing Partner at alpha-DNA. Through his 20+ year career, he has led data-centric capabilities transformation across Fortune 500 brands. He has a successful track record of designing and monetizing information-based strategies across consumer finance, retail, ecommerce, and advertising businesses. Prior to founding alpha-DNA in 2014, Arun was Senior Vice President, Global Analytics & Research at The Western Union Company. He has also held leadership roles at Sears Holdings, GE Capital (Analytics Center of Excellence) and STARCOM (Media Research). Arun holds a Masters degree in Marketing from MICA and a Bachelors in Business Administration from Loyola College.
CO-FOUNDER, ALPHA-DNA
Rod FertigCO-FOUNDER, ALPHA-DNA
Jeff MalingCO-CEO, ISOBAR US
Jeff is co-CEO of Isobar US. Jeff has spent his 20+ year professional services career helping clients create breakthrough customer experience strategies. Jeff is a firm believer that great digital experiences have the power to transform business processes and disrupt industries. Jeff was a founder/owner of pioneering digital agency Roundarch, which became Isobar US in 2011. He also actively serves clients, including BNY Mellon, LEGO, Umpqua, Royal Caribbean, and the U.S. Air Force. Prior to Isobar, Jeff was a leader in Deloitte Consulting’s CRM practice and Accenture’s financial services practice. Jeff has an MBA in Finance from the University of Chicago, and an MA and BA in History from Tufts University.
Rod is co-founder and Partner of alpha-DNA. He has spent over a decade leading customer and digital analytics transformation inside large global financial services businesses. Rod is passionate about creating structure around unstructured digital data, making it truly actionable for improved high-value decisions. Prior to alpha-DNA, Rod was Vice President, Global Analytics & Research at The Western Union Company where he led their digital analytics, pricing strategy and account-based relationship optimization teams. He has also held roles at Capital One where he was responsible for credit risk management and policy, offer strategy and customer value optimization. Rod has a BS degree in Economics from Duke University.
+THE DIGITAL STRENGTH INDEX

38
CONTACT
300 East RandolphSuite 4000
Chicago, IL 606011 (800) 700 0098
117011 Lincoln Avenue PMB 73
Parker, CO 801341 (877) 874 8628
Your digital
transformation
starts here:
+THE DIGITAL STRENGTH INDEX
DIGITALSTRENGTH.ISOBAR.COM

+