Topline MRT & LRTStudy 2009 (For Press Briefing)
28
Confidential & Proprietary • Copyright © 2007 The Nielsen Company July 2009 MRT LRT Travel Habits Study Presentation of Findings
-
Upload
bing-kimpo-media-communications -
Category
Business
-
view
4.023 -
download
0
Transcript of Topline MRT & LRTStudy 2009 (For Press Briefing)

Confidential & Proprietary • Copyright © 2007 The Nielsen Company
July 2009
MRT LRT Travel Habits StudyPresentation of Findings
Confidential & ProprietaryCopyright © 2007 The Nielsen Company
Page 2
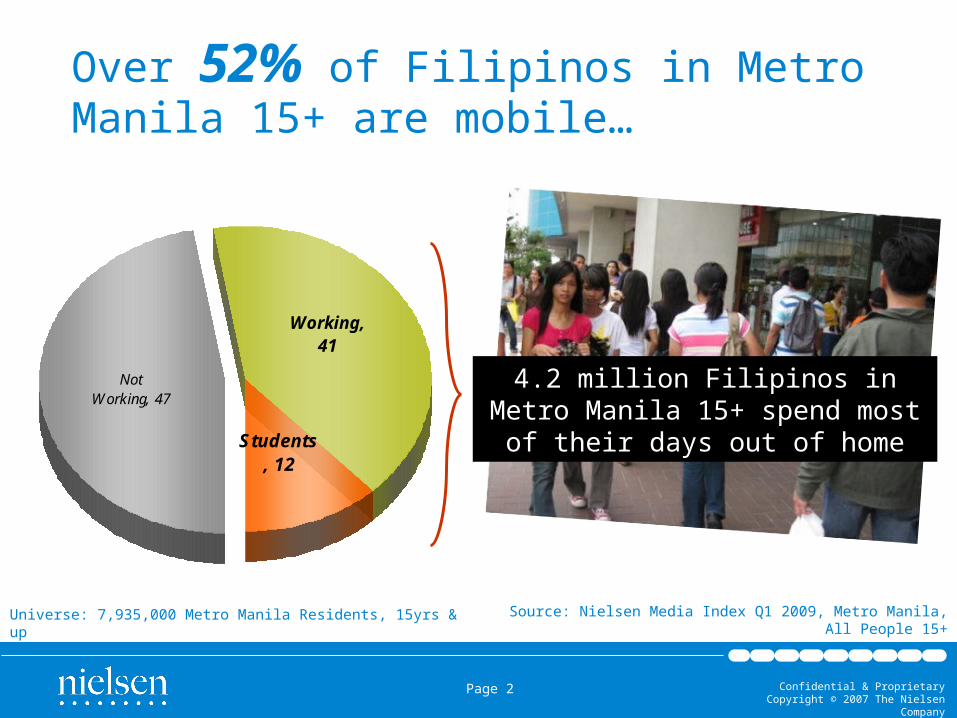
Students, 12
Not Working, 47
Working, 41
Over 52% of Filipinos in Metro Manila 15+ are mobile…
4.2 million Filipinos in Metro Manila 15+ spend most of their days out of home
Source: Nielsen Media Index Q1 2009, Metro Manila, All People 15+Universe: 7,935,000 Metro Manila Residents, 15yrs & up

Confidential & ProprietaryCopyright © 2007 The Nielsen Company
Page 3
93
62
51
18
30
47
36
12
5
96
6863
32 31
25 25
13
10
10
20
30
40
50
60
70
80
90
100
TV* Outdoor** Radio* Internet*** Cable TV* Newspaper* Cinema** VCD/DVD** Magazine*
2004 2009
Exposure to Out-of-Home Media grew over time…
Source: Nielsen Media Index Q1 2009, Metro Manila, All People 15+
Confidential & ProprietaryCopyright © 2007 The Nielsen Company
Page 4
2008 Advertising Expenditure

Confidential & ProprietaryCopyright © 2007 The Nielsen Company
Page 5
Radio18%
Print7%
OOH2%
TV73%
Note: OOH includes Nielsen Monitoring of Billboard in 4 Areas in Metro Manila, Trains Advertising from Trackworks/MPAS and LCD TV from Focus Media
Share of Media Ad Spend 2008
2008 Philippine Media Spend Landscape
Confidential & ProprietaryCopyright © 2007 The Nielsen Company
Page 6
Some advertisers sustaining Ad Spend levels…
Confidential & ProprietaryCopyright © 2007 The Nielsen Company
Page 7
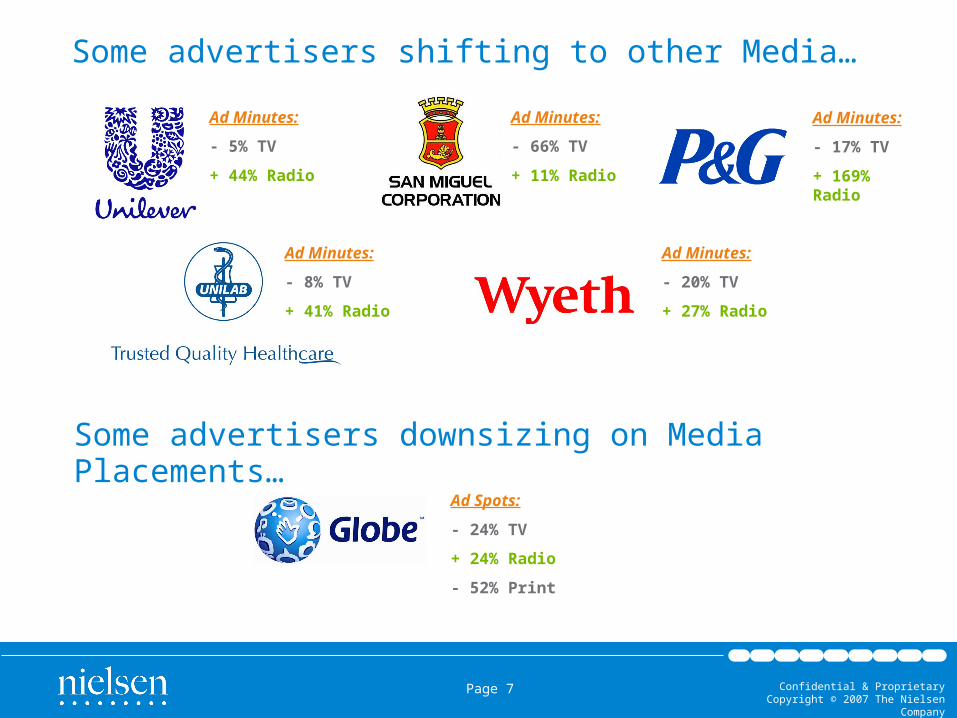
Some advertisers shifting to other Media…
Ad Minutes:
- 5% TV
+ 44% Radio
Ad Spots:
- 12% Print
Ad Minutes:
- 17% TV
+ 169% Radio
Ad Spots:
+ 112% PrintAd Minutes:
- 8% TV
+ 41% Radio
Ad Spots:
- 13% Print
Ad Minutes:
- 66% TV
+ 11% Radio
Ad Spots:
- 27% PrintAd Minutes:
- 20% TV
+ 27% Radio
Ad Spots:
- 40% Print
Some advertisers downsizing on Media Placements…
Ad Spots:
- 24% TV
+ 24% Radio
- 52% Print

Confidential & ProprietaryCopyright © 2007 The Nielsen Company
Page 8
Weekly Media Audience (% Share)
Disconnect between consumption & spend Total Population, 10+
5
10
21
21
14
29TV
Radio
Outdoor
Cinema
DVD
Internet 27
18
73
TV
Radio
OOH*
Media Spend (Jan-Dec ‘08) (% Share)
Source: Nielsen Media Index Study

Confidential & ProprietaryCopyright © 2007 The Nielsen Company
Page 9
Bridging the Gap
Consumer
Advertiser/
Agency
Advertising Information
Audience Measurement
Strategic Decision Systems
Media Owner
Media Touch Points
Confidential & ProprietaryCopyright © 2007 The Nielsen Company
Page 10
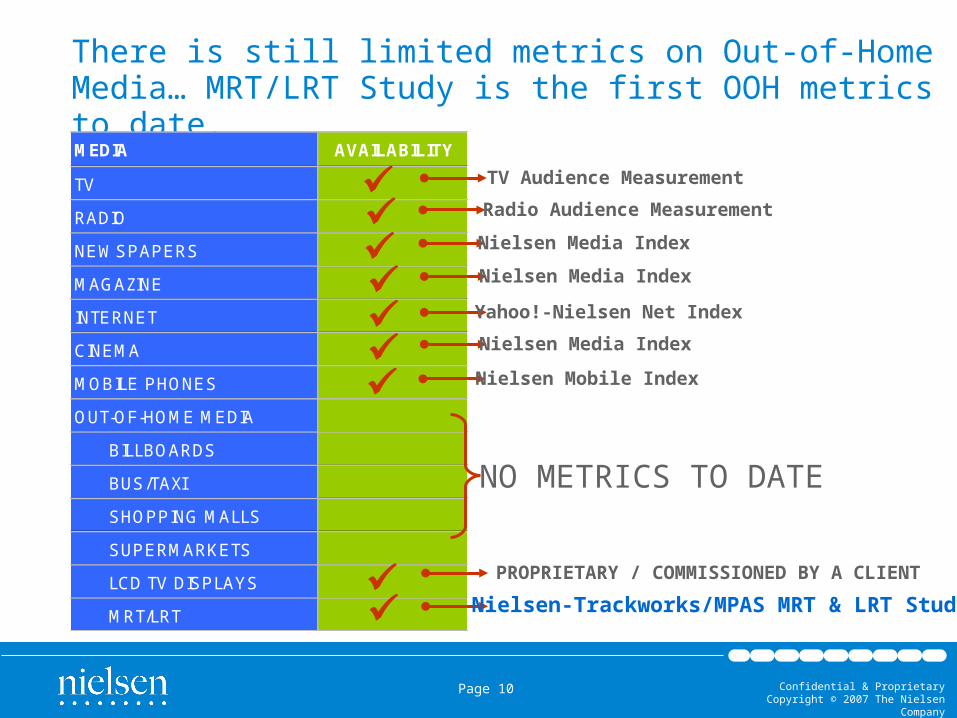
There is still limited metrics on Out-of-Home Media… MRT/LRT Study is the first OOH metrics to date. MRT caters more to the 25 to
49 age segment.MEDIA AVAILABILITY
TV
RADIO
NEWSPAPERS
MAGAZINE
INTERNET
CINEMA
MOBILE PHONES
OUT-OF-HOME MEDIA
BILLBOARDS
BUS/TAXI
SHOPPING MALLS
SUPERMARKETS
LCD TV DISPLAYS
MRT/LRT
TV Audience MeasurementRadio Audience Measurement
Nielsen Media Index
Nielsen Media Index
Yahoo!-Nielsen Net IndexNielsen Media Index
PROPRIETARY / COMMISSIONED BY A CLIENT
Nielsen-Trackworks/MPAS MRT & LRT Study
NO METRICS TO DATE
Nielsen Mobile Index

Confidential & ProprietaryCopyright © 2007 The Nielsen Company
Page 11
IN PARTNERSHIPWITH
MRT – LRT Travel Habits Study which aims to:
Determine WHO MRT/LRT riders
are
Establish WHAT are the habits & train ridership patterns of
MRT/LRT riders
Know HOW to reach your
target market!
Confidential & ProprietaryCopyright © 2007 The Nielsen Company
Page 12
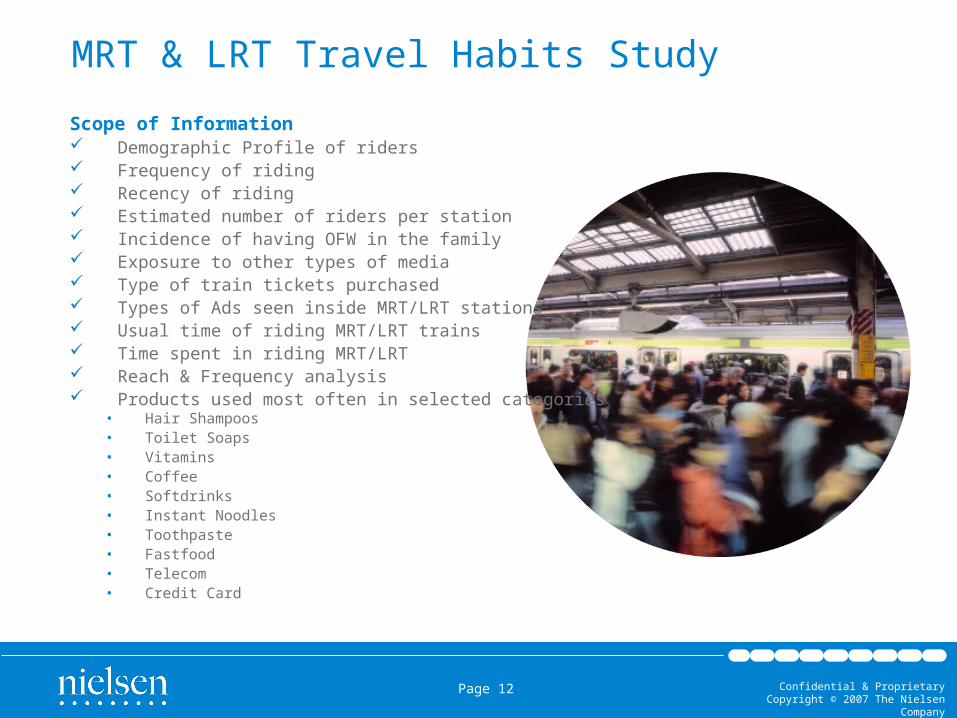
MRT & LRT Travel Habits StudyScope of Information Demographic Profile of riders Frequency of riding Recency of riding Estimated number of riders per station Incidence of having OFW in the family Exposure to other types of media Type of train tickets purchased Types of Ads seen inside MRT/LRT stations Usual time of riding MRT/LRT trains Time spent in riding MRT/LRT Reach & Frequency analysis Products used most often in selected categories
• Hair Shampoos• Toilet Soaps• Vitamins• Coffee• Softdrinks• Instant Noodles• Toothpaste• Fastfood• Telecom• Credit Card

Confidential & ProprietaryCopyright © 2007 The Nielsen Company
Page 13
Getting to Know the Train Riders

Confidential & ProprietaryCopyright © 2007 The Nielsen Company
Page 14
Train Riders in Metro Manila
Source: Nielsen Media Index Q1 2009, Metro Manila, All People 15+
27
73
MRT/LRT Riders
%
Projected estimate of 5,787,000
Metro Manila residents

Confidential & ProprietaryCopyright © 2007 The Nielsen Company
Page 15
125
27 2814
18
915
17
16 121314
979 11
75
11 13
9
7
10 8 512
18
15
21
14
15
TOTAL MRT LRT1 LRT2
50 +
45 to 49
40 to 44
35 to 39
30 to 34
25 to 29
20 to 24
15 to 19
Train Profile
Source: Nielsen-Trackworks/MPAS MRT & LRT Study
Age GroupMRT caters more to the 25 to 49 age segment.
LRT riders are skewed towards the younger age group.
Confidential & ProprietaryCopyright © 2007 The Nielsen Company
Page 16
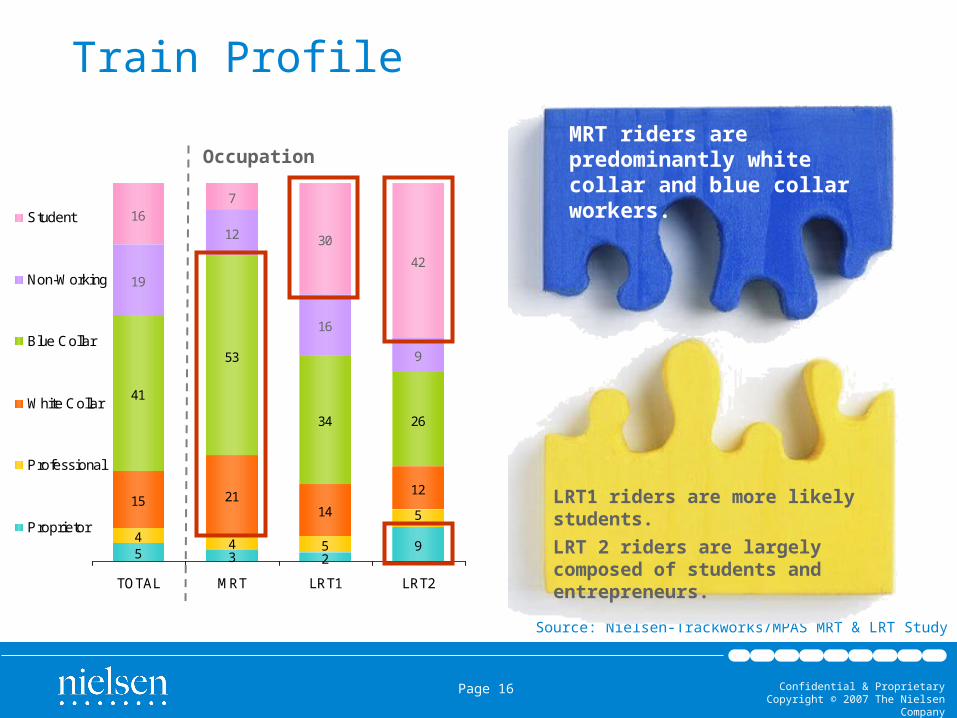
5 3 294
21 12
41
53
34 26
19
12
16
9
167
30
42
54
51415
TOTAL MRT LRT1 LRT2
Student
Non-Working
Blue Collar
White Collar
Professional
Proprietor
Train Profile
Source: Nielsen-Trackworks/MPAS MRT & LRT Study
OccupationMRT riders are predominantly white collar and blue collar workers.
LRT1 riders are more likely students. LRT 2 riders are largely composed of students and entrepreneurs.

Confidential & ProprietaryCopyright © 2007 The Nielsen Company
Page 17
MRT and LRT have unique markets but they appear to complement each other
Source: Nielsen-Trackworks/MPAS MRT & LRT Study
MRT • caters more to the 25 to 49 age segment.• predominantly working group consisting of white and blue collar workers
LRT1• skewed towards 10 to 24 age segment• more likely studentsLRT2• skewed towards 10 to 24 and 50+ age segment• largely consists of students and entrepreneurs
Confidential & ProprietaryCopyright © 2007 The Nielsen Company
Page 18
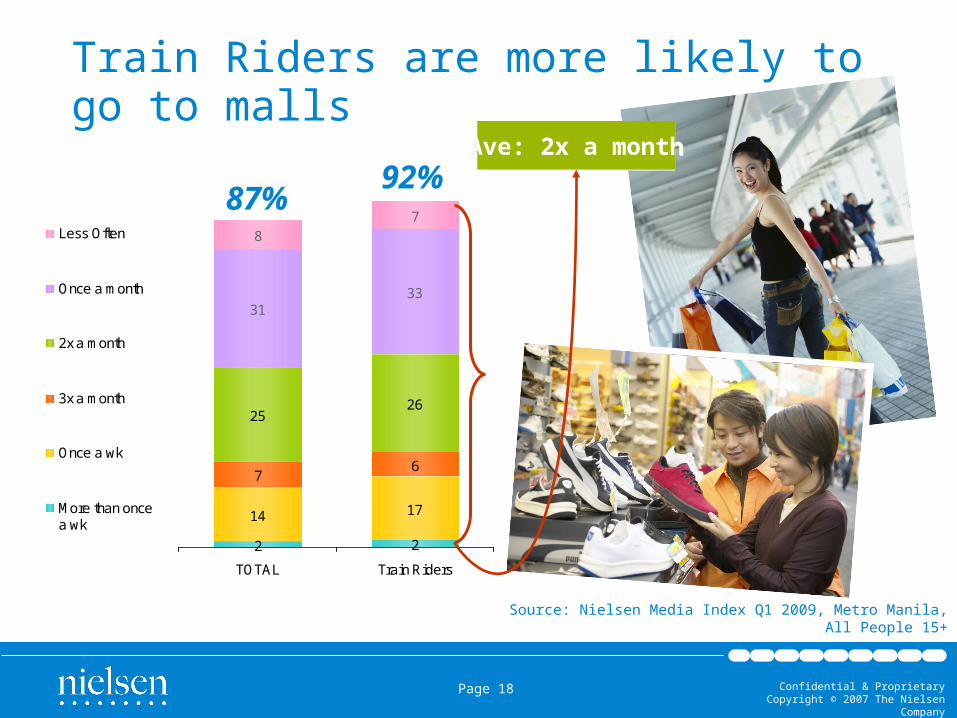
2 2
17
6
2526
3133
87
14
7
TOTAL Train Riders
Less Often
Once a month
2x a month
3x a month
Once a wk
More than oncea wk
Train Riders are more likely to go to malls
87% 92%
Source: Nielsen Media Index Q1 2009, Metro Manila, All People 15+
Ave: 2x a month

Confidential & ProprietaryCopyright © 2007 The Nielsen Company
Page 19
3 4
19
10
24 24
27 28
67
18
10
TOTAL Train Riders
Less Often
Once a month
2x a month
3x a month
Once a wk
More than oncea wk
… and are more likely to dine out in fast food outlets
89% 92%
Source: Nielsen Media Index Q1 2009, Metro Manila, All People 15+
Ave: 2x a month
Confidential & ProprietaryCopyright © 2007 The Nielsen Company
Page 20
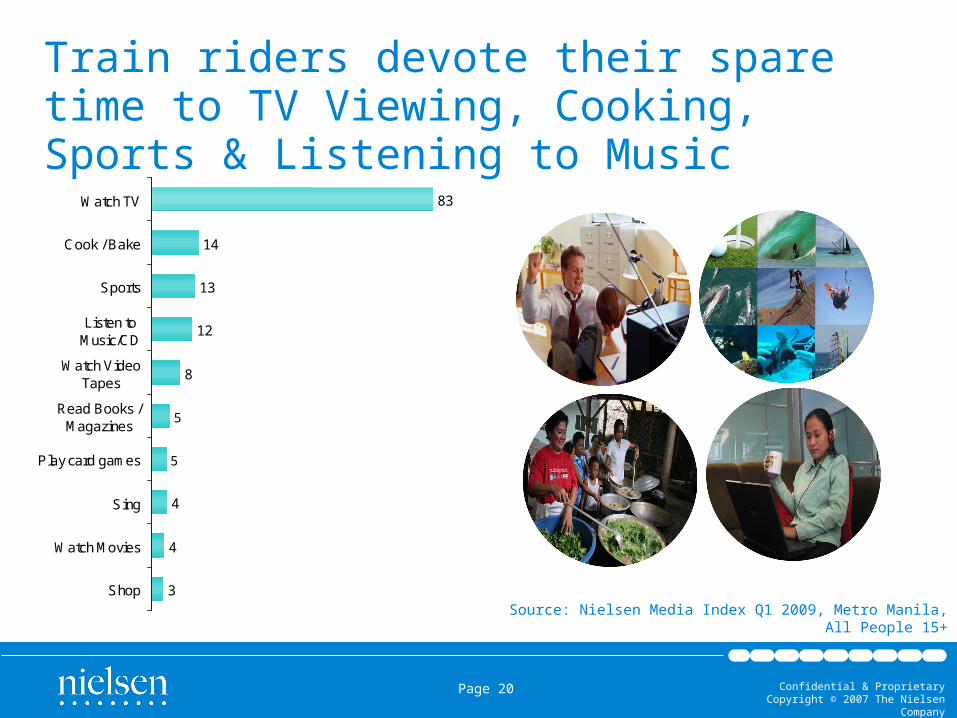
83
14
13
12
8
4
4
3
5
5
Watch TV
Cook / Bake
Sports
Listen toMusic/CD
Watch VideoTapes
Read Books /Magazines
Play card games
Sing
Watch Movies
Shop
Train riders devote their spare time to TV Viewing, Cooking, Sports & Listening to Music
Source: Nielsen Media Index Q1 2009, Metro Manila, All People 15+

Confidential & ProprietaryCopyright © 2007 The Nielsen Company
Page 21
45
18
15
8
3
2
2
1
2
2
Basketball
Badminton
Volleyball
Boxing
Billards / Pool
Tennis
Aerobics /Gymnastics
Swimming
Jogging / Running
Bowling
Basketball, Badminton and Volleyball are the top 3 sports train riders are engaged in.
Source: Nielsen Media Index Q1 2009, Metro Manila, All People 15+

Confidential & ProprietaryCopyright © 2007 The Nielsen Company
Page 22
Train Riders tend to be…
Source: Nielsen Media Index Q1 2009, Metro Manila, All People 15+
STATEMENTS THAT DEFINE TRAIN RIDERS SCORESIt Is Important To Be Attractive To The Opposite Sex 107I Am A Regular Cinema Goer 105When I Need Information, The First Place I Look Is The Internet 103I Ask People's Advice Before Buying New Things 103I Spend A Lot Of Money On Toiletries And Cosmetics 103People Come To Me For Advice Before Buying New Things 102I Can Not Resist Buying Magazines 102
Physically conscious Information and Technology Driven Cautious Buyers Movie fanatics
?
Confidential & ProprietaryCopyright © 2007 The Nielsen Company
Page 23
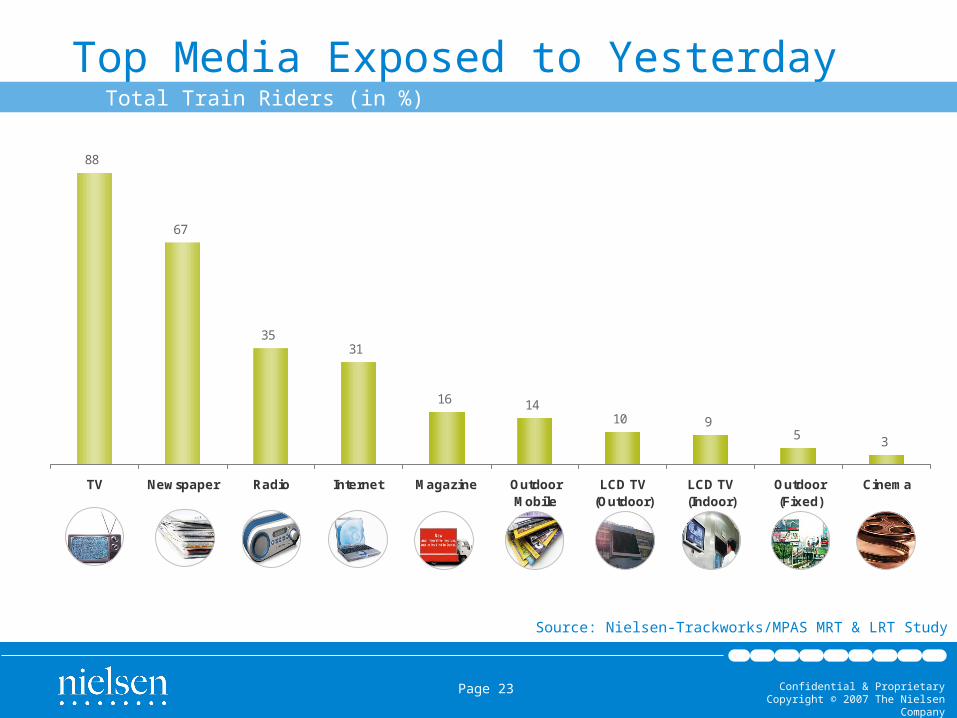
88
67
3531
16 1410 9
5 3
TV Newspaper Radio Internet Magazine OutdoorMobile
LCD TV(Outdoor)
LCD TV(Indoor)
Outdoor(Fixed)
Cinema
Top Media Exposed to YesterdayTotal Train Riders (in %)
Source: Nielsen-Trackworks/MPAS MRT & LRT Study

Confidential & ProprietaryCopyright © 2007 The Nielsen Company
Page 24
100 98 96
8581 79
44
Toothpaste Toilet Soap Hair Shampoo Instant Noodles Coffee Softdrinks Vitamins
Top Products ConsumedTotal Train Riders (in %)
Source: Nielsen-Trackworks/MPAS MRT & LRT Study
Confidential & ProprietaryCopyright © 2007 The Nielsen Company
Page 25
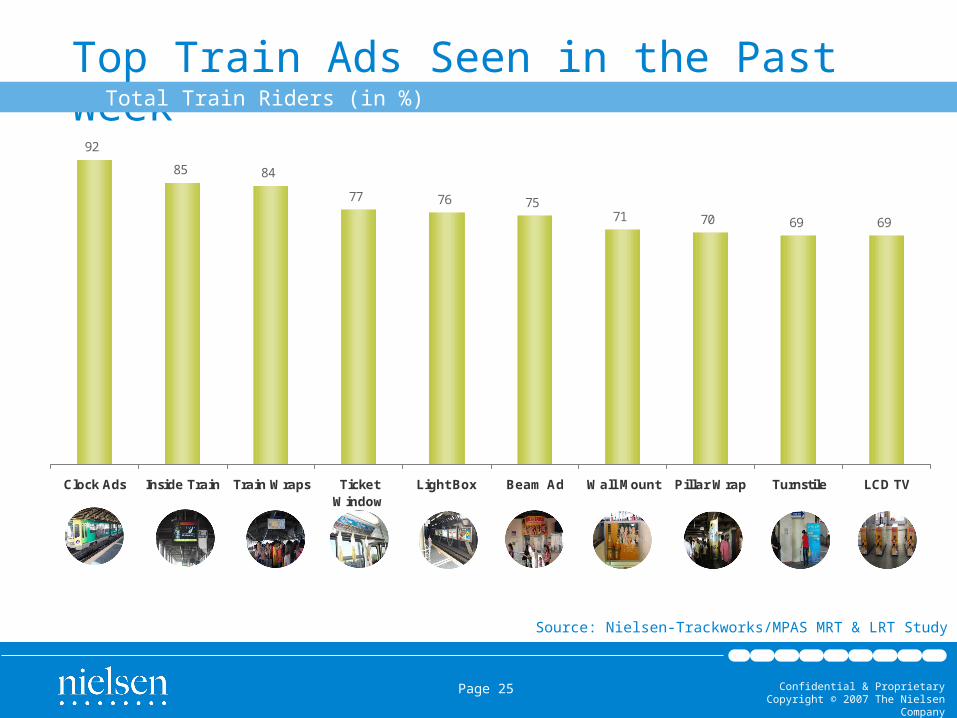
92
85 84
77 76 7571 70 69 69
Clock Ads Inside Train Train Wraps TicketWindow
Light Box Beam Ad Wall Mount Pillar Wrap Turnstile LCD TV
Top Train Ads Seen in the Past WeekTotal Train Riders (in %)
Source: Nielsen-Trackworks/MPAS MRT & LRT Study

Confidential & ProprietaryCopyright © 2007 The Nielsen Company
Page 26
7
24
10
16
0
0
0
0 10 20 30 40 50 60 70 80 90 100
Everyday
4-6 days a wk
2-3 days a wk
Once a wk
2-3x a month
Once a month
Less Often
Frequency of Riding TrainsTotal Train Riders (in %)
Source: Nielsen-Trackworks/MPAS MRT & LRT Study
Ave: 4x a week
Confidential & ProprietaryCopyright © 2007 The Nielsen Company
Page 27
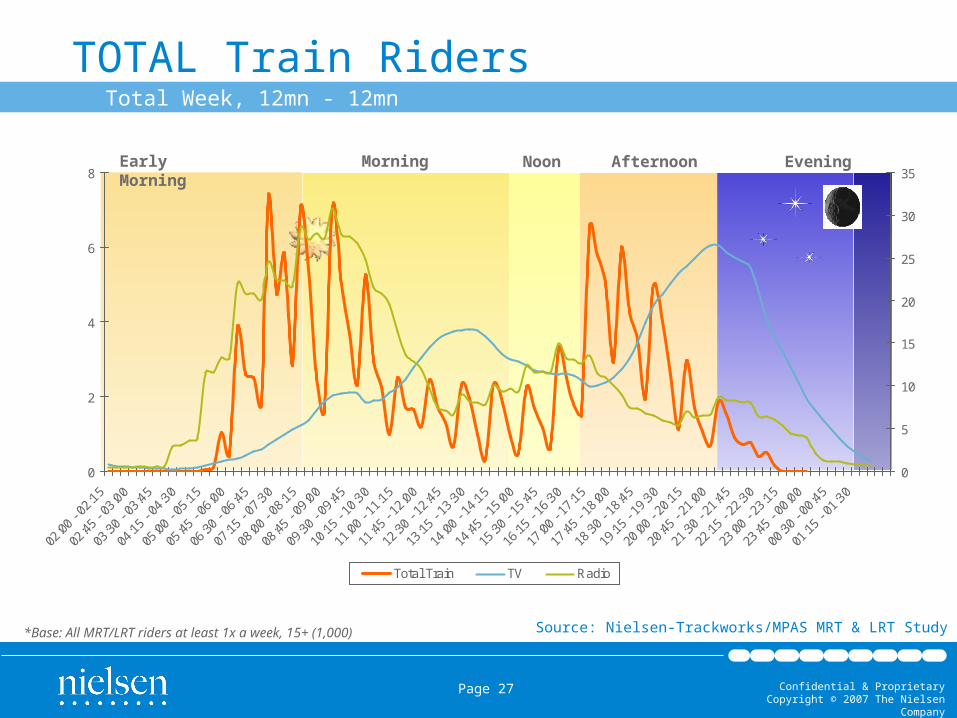
Early Morning Morning AfternoonNoon Evening
TOTAL Train RidersTotal Week, 12mn - 12mn
*Base: All MRT/LRT riders at least 1x a week, 15+ (1,000) Source: Nielsen-Trackworks/MPAS MRT & LRT Study
0
2
4
6
8
02:00
- 02:15
02:45
- 03:00
03:30
- 03:45
04:15
- 04:30
05:00
- 05:15
05:45
- 06:00
06:30
- 06:45
07:15
- 07:30
08:00
- 08:15
08:45
- 09:00
09:30
- 09:45
10:15
- 10:30
11:00
- 11:15
11:45
- 12:00
12:30
- 12:45
13:15
- 13:30
14:00
- 14:15
14:45
- 15:00
15:30
- 15:45
16:15
- 16:30
17:00
- 17:15
17:45
- 18:00
18:30
- 18:45
19:15
- 19:30
20:00
- 20:15
20:45
- 21:00
21:30
- 21:45
22:15
- 22:30
23:00
- 23:15
23:45
- 00:00
00:30
- 00:45
01:15
- 01:30
0
5
10
15
20
25
30
35
Total Train TV Radio

Confidential & ProprietaryCopyright © 2007 The Nielsen Company
Page 28Confidential & Proprietary • Copyright © 2007 The Nielsen Company
Thank you.