Dynamic Coordination of Signal Processing Functions Using ITU-T Rec. G.799.2
description

CEE 764 – Fall 2010CEE 764 – Fall 2010
Topic 7Topic 7
Special Issues on Signal Special Issues on Signal CoordinationCoordination
CEE 764 – Fall 2010CEE 764 – Fall 2010
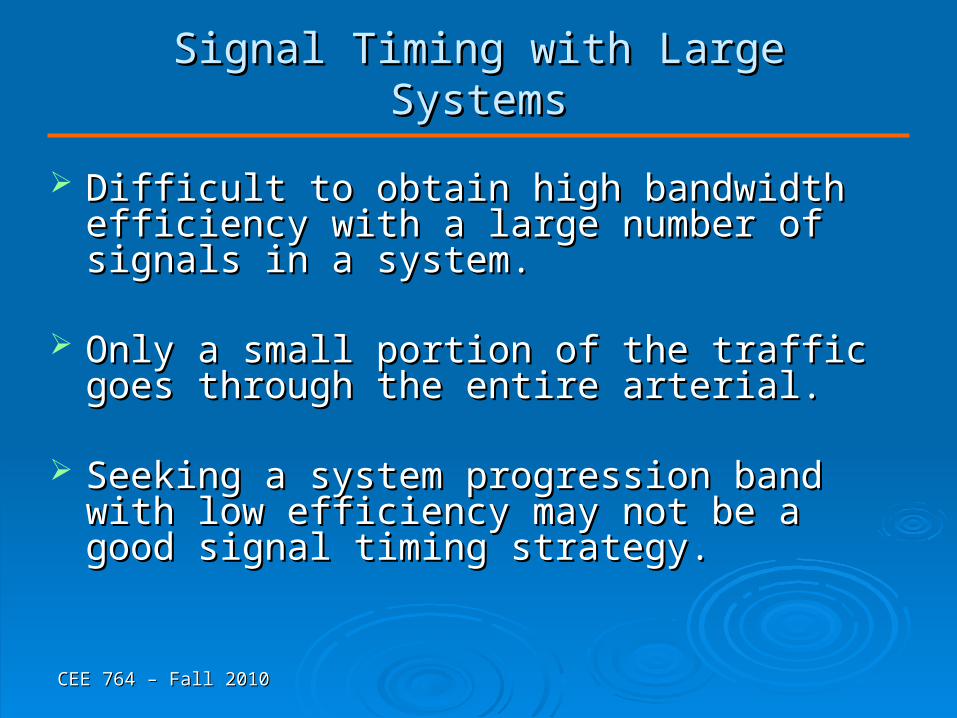
Signal Timing with Large SystemsSignal Timing with Large Systems
Difficult to obtain high bandwidth efficiency with Difficult to obtain high bandwidth efficiency with a large number of signals in a system.a large number of signals in a system.
Only a small portion of the traffic goes through Only a small portion of the traffic goes through the entire arterial.the entire arterial.
Seeking a system progression band with low Seeking a system progression band with low efficiency may not be a good signal timing efficiency may not be a good signal timing strategy.strategy.
CEE 764 – Fall 2010CEE 764 – Fall 2010
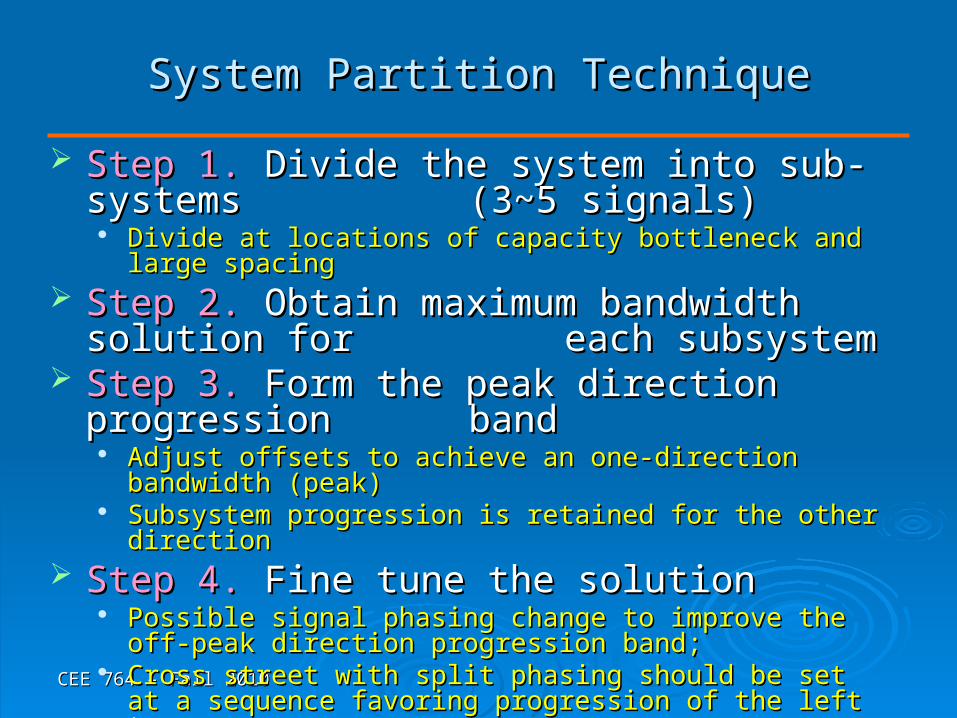
System Partition TechniqueSystem Partition Technique
Step 1.Step 1. Divide the system into sub-systems Divide the system into sub-systems (3~5 signals)(3~5 signals)
Divide at locations of capacity bottleneck and large spacing Divide at locations of capacity bottleneck and large spacing Step 2.Step 2. Obtain maximum bandwidth solution for Obtain maximum bandwidth solution for
each subsystemeach subsystem Step 3.Step 3. Form the peak direction progression Form the peak direction progression
bandband Adjust offsets to achieve an one-direction bandwidth (peak)Adjust offsets to achieve an one-direction bandwidth (peak) Subsystem progression is retained for the other directionSubsystem progression is retained for the other direction
Step 4.Step 4. Fine tune the solution Fine tune the solution Possible signal phasing change to improve the off-peak Possible signal phasing change to improve the off-peak
direction progression band; direction progression band; Cross street with split phasing should be set at a sequence Cross street with split phasing should be set at a sequence
favoring progression of the left turns.favoring progression of the left turns.
CEE 764 – Fall 2010CEE 764 – Fall 2010
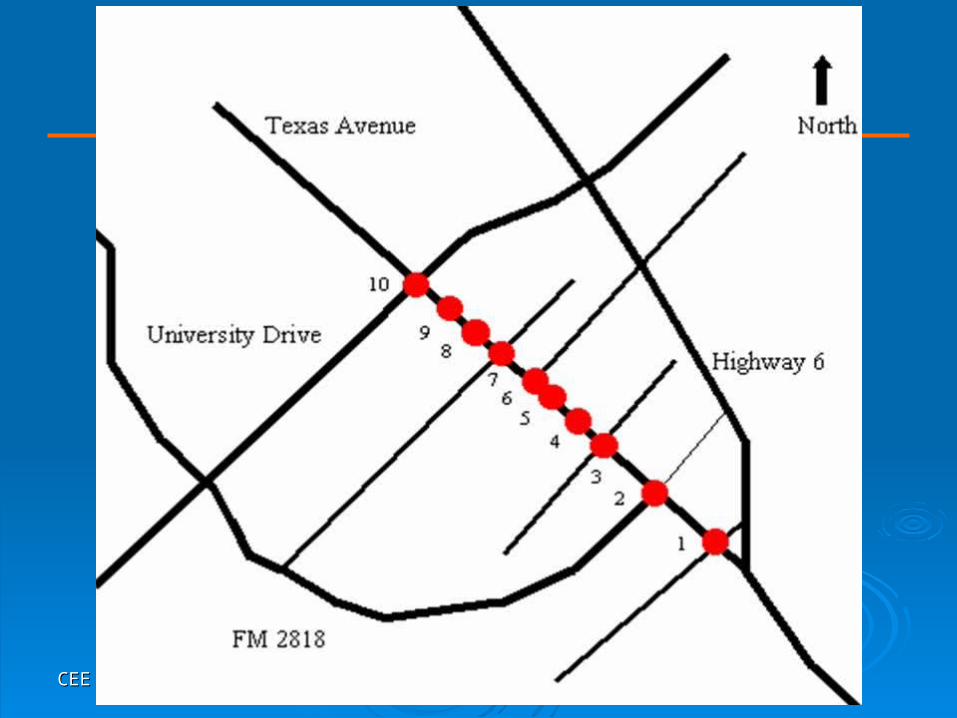
EXAMPLEEXAMPLE
CEE 764 – Fall 2010CEE 764 – Fall 2010
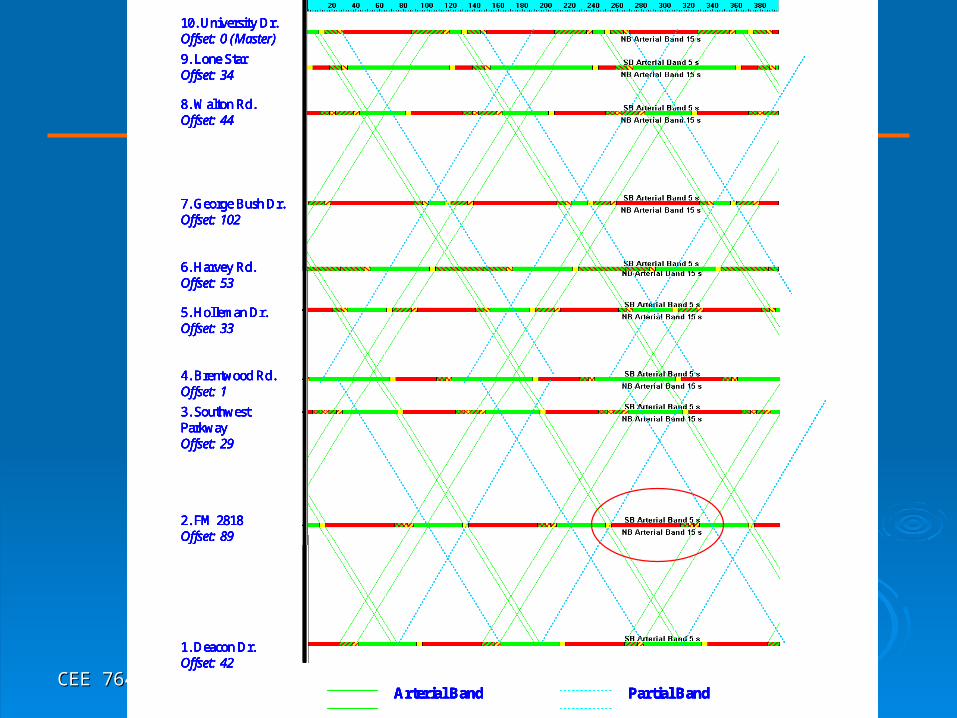
EXAMPLEEXAMPLE
10. University Dr.Offset: 0 (Master)
9. Lone StarOffset: 34
8. Walton Rd.Offset: 44
7. George Bush Dr.Offset: 102
6. Harvey Rd.Offset: 53
5. Holleman Dr.Offset: 33
4. Brentwood Rd.Offset: 1
3. Southwest ParkwayOffset: 29
2. FM 2818Offset: 89
1. Deacon Dr.Offset: 42
Arterial Band Partial Band
10. University Dr.Offset: 0 (Master)
9. Lone StarOffset: 34
8. Walton Rd.Offset: 44
7. George Bush Dr.Offset: 102
6. Harvey Rd.Offset: 53
5. Holleman Dr.Offset: 33
4. Brentwood Rd.Offset: 1
3. Southwest ParkwayOffset: 29
2. FM 2818Offset: 89
1. Deacon Dr.Offset: 42
Arterial Band Partial Band
10. University Dr.Offset: 0 (Master)
9. Lone StarOffset: 34
8. Walton Rd.Offset: 44
7. George Bush Dr.Offset: 102
6. Harvey Rd.Offset: 53
5. Holleman Dr.Offset: 33
4. Brentwood Rd.Offset: 1
3. Southwest ParkwayOffset: 29
2. FM 2818Offset: 89
1. Deacon Dr.Offset: 42
10. University Dr.Offset: 0 (Master)
9. Lone StarOffset: 34
8. Walton Rd.Offset: 44
7. George Bush Dr.Offset: 102
6. Harvey Rd.Offset: 53
5. Holleman Dr.Offset: 33
4. Brentwood Rd.Offset: 1
3. Southwest ParkwayOffset: 29
2. FM 2818Offset: 89
1. Deacon Dr.Offset: 42
10. University Dr.Offset: 0 (Master)
9. Lone StarOffset: 34
8. Walton Rd.Offset: 44
7. George Bush Dr.Offset: 102
6. Harvey Rd.Offset: 53
5. Holleman Dr.Offset: 33
4. Brentwood Rd.Offset: 1
3. Southwest ParkwayOffset: 29
2. FM 2818Offset: 89
1. Deacon Dr.Offset: 42
Arterial Band Partial BandArterial Band Partial Band
CEE 764 – Fall 2010CEE 764 – Fall 2010
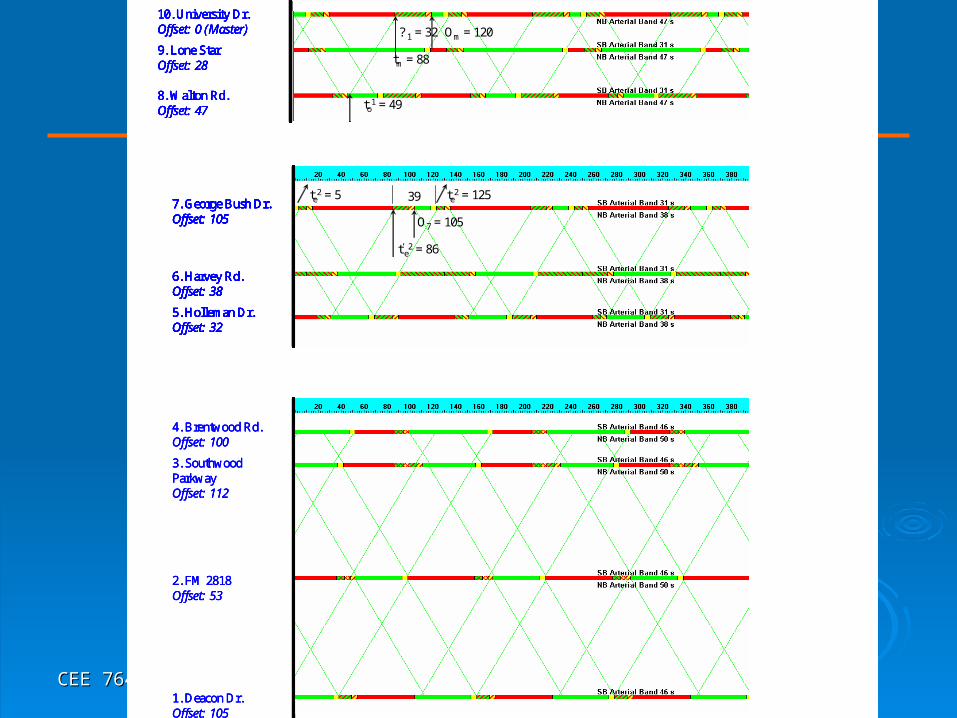
EXAMPLEEXAMPLE
4. Brentwood Rd.Offset: 100
3. SouthwoodParkwayOffset: 112
2. FM 2818Offset: 53
1. Deacon Dr.Offset: 105
10. University Dr.Offset: 0 (Master)
9. Lone StarOffset: 28
8. Walton Rd.Offset: 47
? 1 = 32
tm = 88
to1 = 49
Om = 120
7. George Bush Dr.Offset: 105
6. Harvey Rd.Offset: 38
5. Holleman Dr.Offset: 32
O7 = 105
t’e2 = 86
te2 = 125te
2 = 5 39
4. Brentwood Rd.Offset: 100
3. SouthwoodParkwayOffset: 112
2. FM 2818Offset: 53
1. Deacon Dr.Offset: 105
4. Brentwood Rd.Offset: 100
3. SouthwoodParkwayOffset: 112
2. FM 2818Offset: 53
1. Deacon Dr.Offset: 105
10. University Dr.Offset: 0 (Master)
9. Lone StarOffset: 28
8. Walton Rd.Offset: 47
? 1 = 32
tm = 88
to1 = 49
Om = 120
10. University Dr.Offset: 0 (Master)
9. Lone StarOffset: 28
8. Walton Rd.Offset: 47
10. University Dr.Offset: 0 (Master)
9. Lone StarOffset: 28
8. Walton Rd.Offset: 47
10. University Dr.Offset: 0 (Master)
9. Lone StarOffset: 28
8. Walton Rd.Offset: 47
? 1 = 32
tm = 88
to1 = 49
Om = 120
7. George Bush Dr.Offset: 105
6. Harvey Rd.Offset: 38
5. Holleman Dr.Offset: 32
O7 = 105
t’e2 = 86
te2 = 125te
2 = 5 397. George Bush Dr.Offset: 105
6. Harvey Rd.Offset: 38
5. Holleman Dr.Offset: 32
O7 = 105
t’e2 = 86
te2 = 125te
2 = 57. George Bush Dr.Offset: 105
6. Harvey Rd.Offset: 38
5. Holleman Dr.Offset: 32
O7 = 105
t’e2 = 86
te2 = 125te
2 = 57. George Bush Dr.Offset: 105
6. Harvey Rd.Offset: 38
5. Holleman Dr.Offset: 32
O7 = 105
t’e2 = 86
te2 = 125te
2 = 57. George Bush Dr.Offset: 105
6. Harvey Rd.Offset: 38
5. Holleman Dr.Offset: 32
7. George Bush Dr.Offset: 105
6. Harvey Rd.Offset: 38
5. Holleman Dr.Offset: 32
O7 = 105
t’e2 = 86
te2 = 125te
2 = 5 39
CEE 764 – Fall 2010CEE 764 – Fall 2010
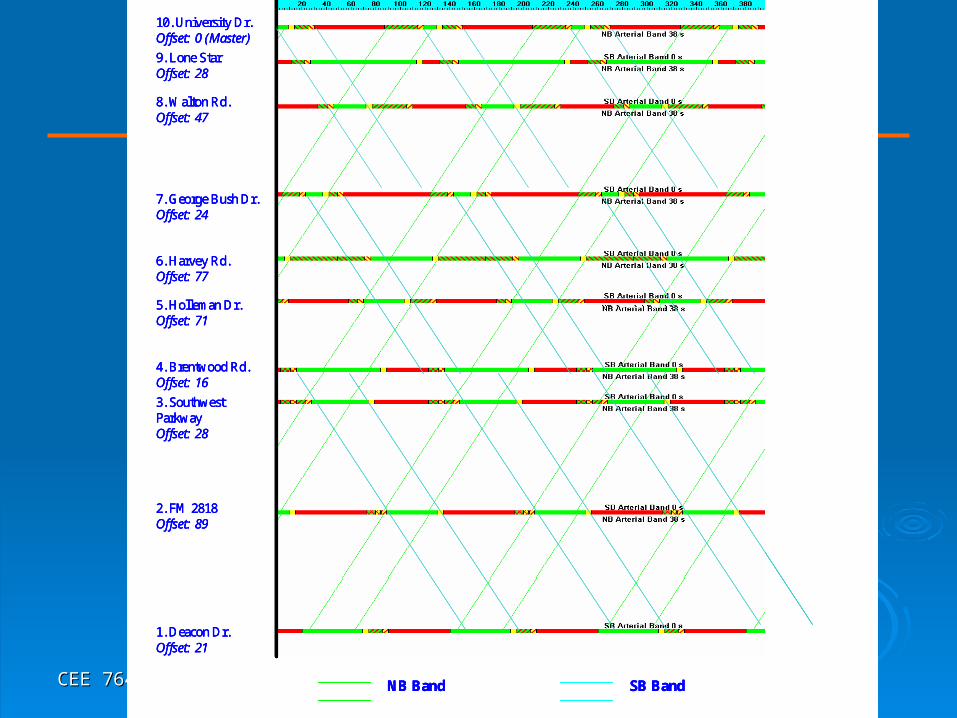
EXAMPLEEXAMPLE
10. University Dr.Offset: 0 (Master)
9. Lone StarOffset: 28
8. Walton Rd.Offset: 47
7. George Bush Dr.Offset: 24
6. Harvey Rd.Offset: 77
5. Holleman Dr.Offset: 71
4. Brentwood Rd.Offset: 16
3. Southwest ParkwayOffset: 28
2. FM 2818Offset: 89
1. Deacon Dr.Offset: 21
NB Band SB Band
10. University Dr.Offset: 0 (Master)
9. Lone StarOffset: 28
8. Walton Rd.Offset: 47
7. George Bush Dr.Offset: 24
6. Harvey Rd.Offset: 77
5. Holleman Dr.Offset: 71
4. Brentwood Rd.Offset: 16
3. Southwest ParkwayOffset: 28
2. FM 2818Offset: 89
1. Deacon Dr.Offset: 21
10. University Dr.Offset: 0 (Master)
9. Lone StarOffset: 28
8. Walton Rd.Offset: 47
7. George Bush Dr.Offset: 24
6. Harvey Rd.Offset: 77
5. Holleman Dr.Offset: 71
4. Brentwood Rd.Offset: 16
3. Southwest ParkwayOffset: 28
2. FM 2818Offset: 89
1. Deacon Dr.Offset: 21
NB Band SB BandNB Band SB Band
CEE 764 – Fall 2010CEE 764 – Fall 2010
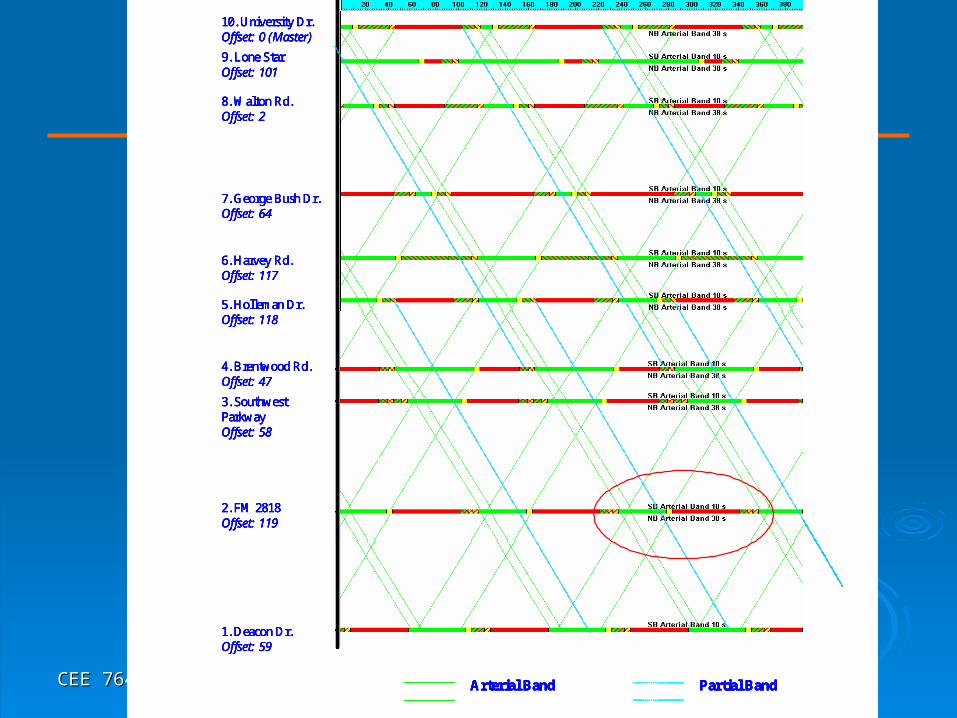
EXAMPLEEXAMPLE
Arterial Band Partial Band
10. University Dr.Offset: 0 (Master)
9. Lone StarOffset: 101
8. Walton Rd.Offset: 2
7. George Bush Dr.Offset: 64
6. Harvey Rd.Offset: 117
5. Holleman Dr.Offset: 118
4. Brentwood Rd.Offset: 47
3. Southwest ParkwayOffset: 58
2. FM 2818Offset: 119
1. Deacon Dr.Offset: 59
Arterial Band Partial Band
10. University Dr.Offset: 0 (Master)
9. Lone StarOffset: 101
8. Walton Rd.Offset: 2
7. George Bush Dr.Offset: 64
6. Harvey Rd.Offset: 117
5. Holleman Dr.Offset: 118
4. Brentwood Rd.Offset: 47
3. Southwest ParkwayOffset: 58
2. FM 2818Offset: 119
1. Deacon Dr.Offset: 59
Arterial Band Partial BandArterial Band Partial Band
10. University Dr.Offset: 0 (Master)
9. Lone StarOffset: 101
8. Walton Rd.Offset: 2
7. George Bush Dr.Offset: 64
6. Harvey Rd.Offset: 117
5. Holleman Dr.Offset: 118
4. Brentwood Rd.Offset: 47
3. Southwest ParkwayOffset: 58
2. FM 2818Offset: 119
1. Deacon Dr.Offset: 59
10. University Dr.Offset: 0 (Master)
9. Lone StarOffset: 101
8. Walton Rd.Offset: 2
7. George Bush Dr.Offset: 64
6. Harvey Rd.Offset: 117
5. Holleman Dr.Offset: 118
4. Brentwood Rd.Offset: 47
3. Southwest ParkwayOffset: 58
2. FM 2818Offset: 119
1. Deacon Dr.Offset: 59
CEE 764 – Fall 2010CEE 764 – Fall 2010
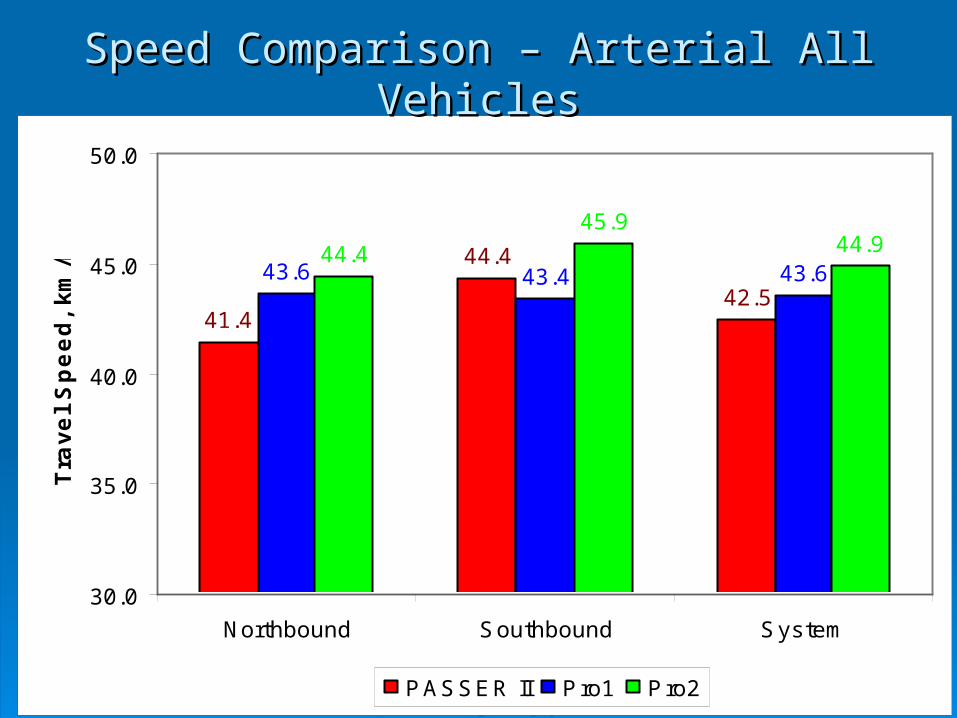
41.4
44.4
42.543.6 43.4 43.6
44.4
45.944.9
30.0
35.0
40.0
45.0
50.0
Northbound Southbound System
Tra
ve
l S
pe
ed
, k
m/h
r
PASSER II Pro1 Pro2
Speed Comparison – Arterial All VehiclesSpeed Comparison – Arterial All Vehicles
CEE 764 – Fall 2010CEE 764 – Fall 2010
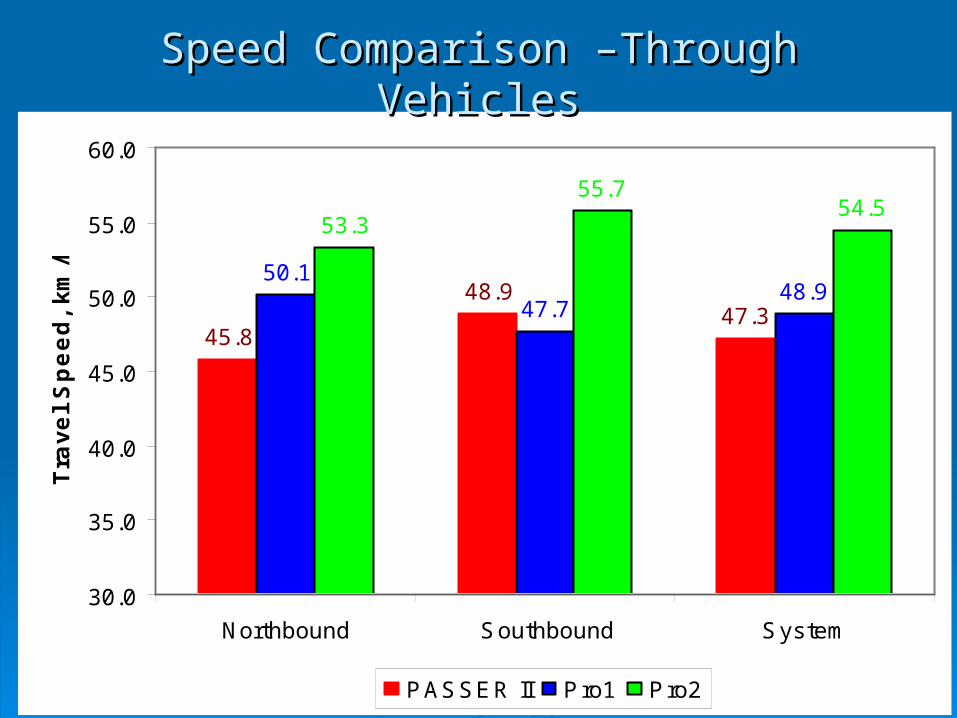
45.8
48.947.3
50.1
47.748.9
53.3
55.754.5
30.0
35.0
40.0
45.0
50.0
55.0
60.0
Northbound Southbound System
Tra
ve
l S
pe
ed
, k
m/h
r
PASSER II Pro1 Pro2
Speed Comparison –Through VehiclesSpeed Comparison –Through Vehicles
CEE 764 – Fall 2010CEE 764 – Fall 2010
AdvantagesAdvantages
Maintain maximum progression for the peak Maintain maximum progression for the peak direction.direction.
The one directional progression band for the peak direction is the The one directional progression band for the peak direction is the maximum that can be achieved from any optimization solutions. maximum that can be achieved from any optimization solutions.
Maintain maximum progression for the Maintain maximum progression for the subsystems.subsystems.
Subsystems have larger bandwidths on both directions.Subsystems have larger bandwidths on both directions.
More control and handle on queue and stopsMore control and handle on queue and stops Progression on the off-peak direction is partially maintained. But the Progression on the off-peak direction is partially maintained. But the
users have complete control on where to stop vehicles and store users have complete control on where to stop vehicles and store queues.queues.
CEE 764 – Fall 2010CEE 764 – Fall 2010
Pedestrian Timing TreatmentPedestrian Timing Treatment
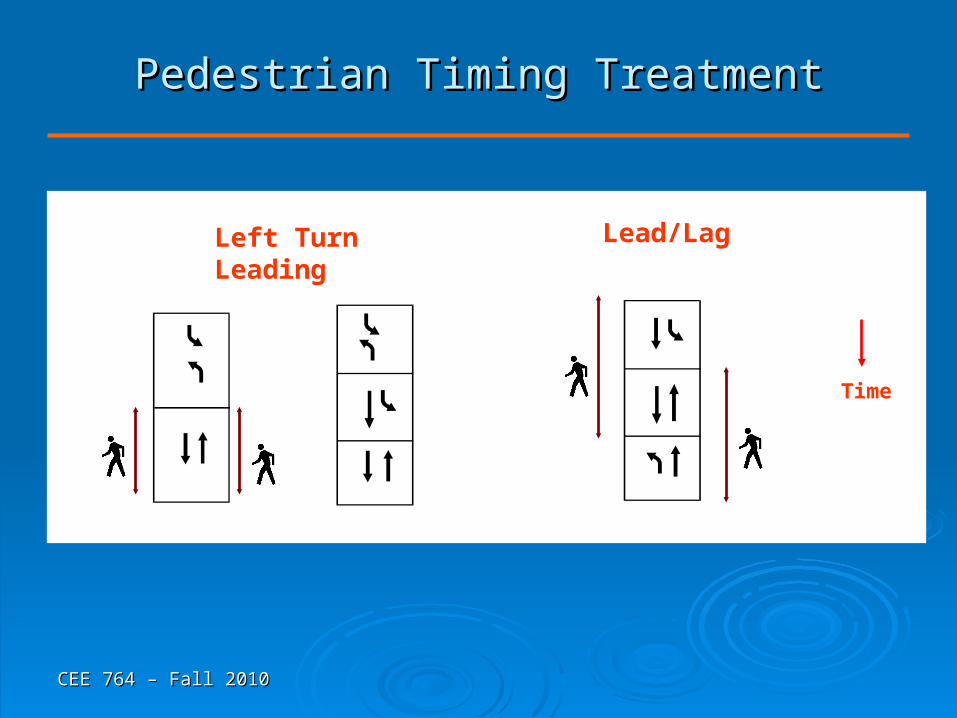
Pedestrian crossing times are handled by Pedestrian crossing times are handled by concurrent vehicle through phasesconcurrent vehicle through phases
Green time of vehicle phase must satisfy the Green time of vehicle phase must satisfy the WALK + FDWWALK + FDW
Vehicle demands are low at minor streets, but Vehicle demands are low at minor streets, but pedestrian crossing times are high (wide street)pedestrian crossing times are high (wide street)
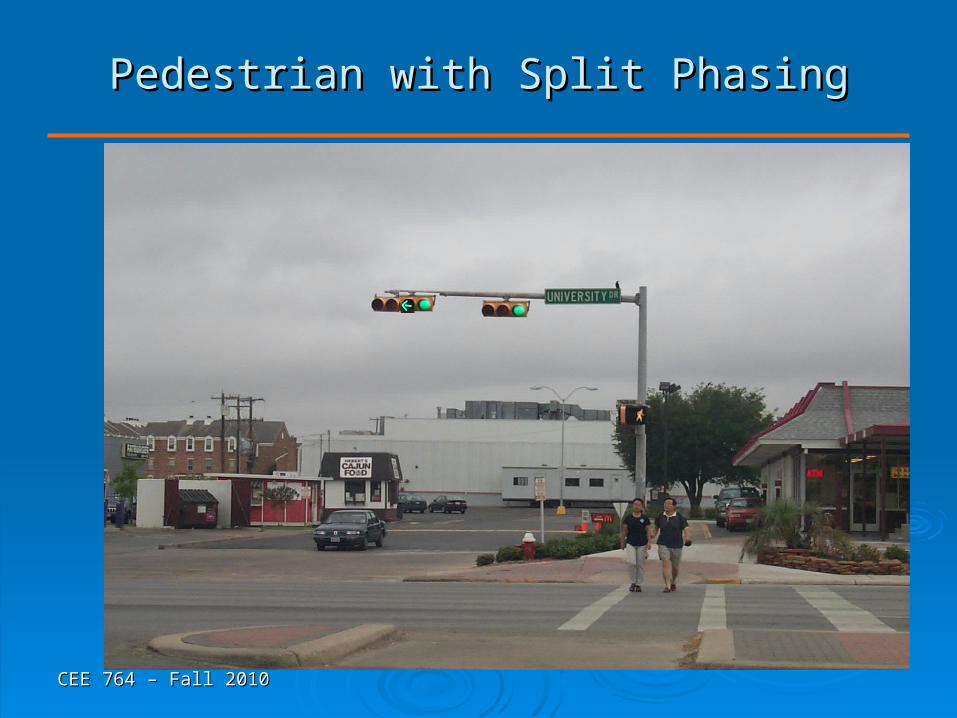
Split phasing presents more challengesSplit phasing presents more challenges Two timing treatmentsTwo timing treatments
Vehicle minimumVehicle minimum Pedestrian minimumPedestrian minimum
CEE 764 – Fall 2010CEE 764 – Fall 2010
Pedestrian Timing TreatmentPedestrian Timing Treatment
Left Turn Leading
Lead/Lag
Time
CEE 764 – Fall 2010CEE 764 – Fall 2010
Pedestrian with Split PhasingPedestrian with Split Phasing
CEE 764 – Fall 2010CEE 764 – Fall 2010
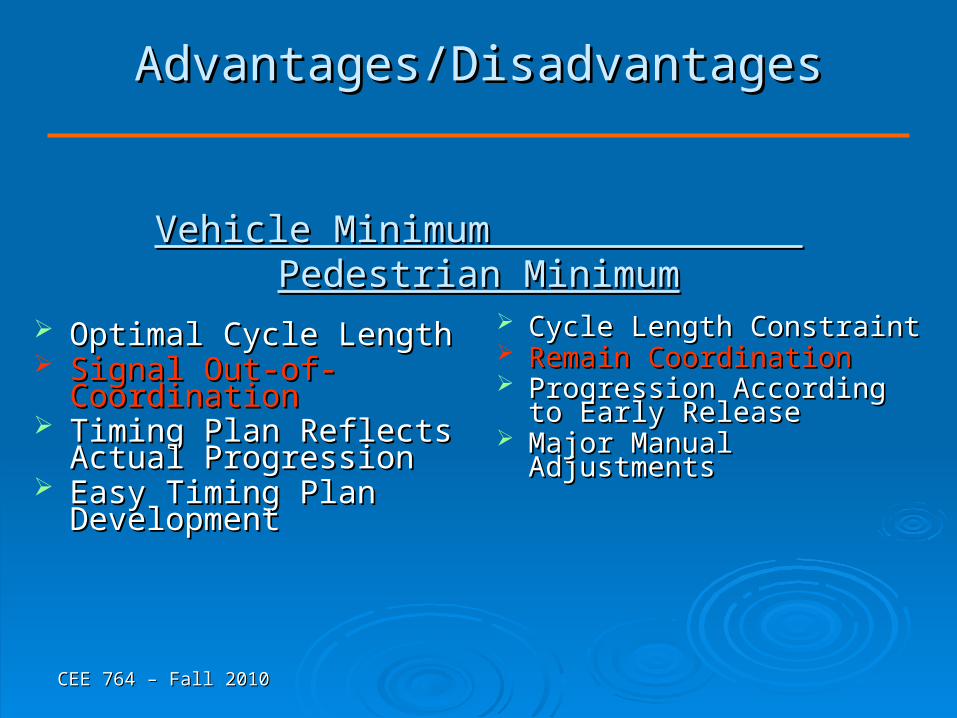
Advantages/DisadvantagesAdvantages/Disadvantages
Vehicle Minimum Pedestrian MinimumVehicle Minimum Pedestrian Minimum
Optimal Cycle LengthOptimal Cycle Length Signal Out-of-CoordinationSignal Out-of-Coordination Timing Plan Reflects Actual Timing Plan Reflects Actual
ProgressionProgression Easy Timing Plan Easy Timing Plan
DevelopmentDevelopment
Cycle Length ConstraintCycle Length Constraint Remain CoordinationRemain Coordination Progression According to Progression According to
Early ReleaseEarly Release Major Manual AdjustmentsMajor Manual Adjustments
CEE 764 – Fall 2010CEE 764 – Fall 2010
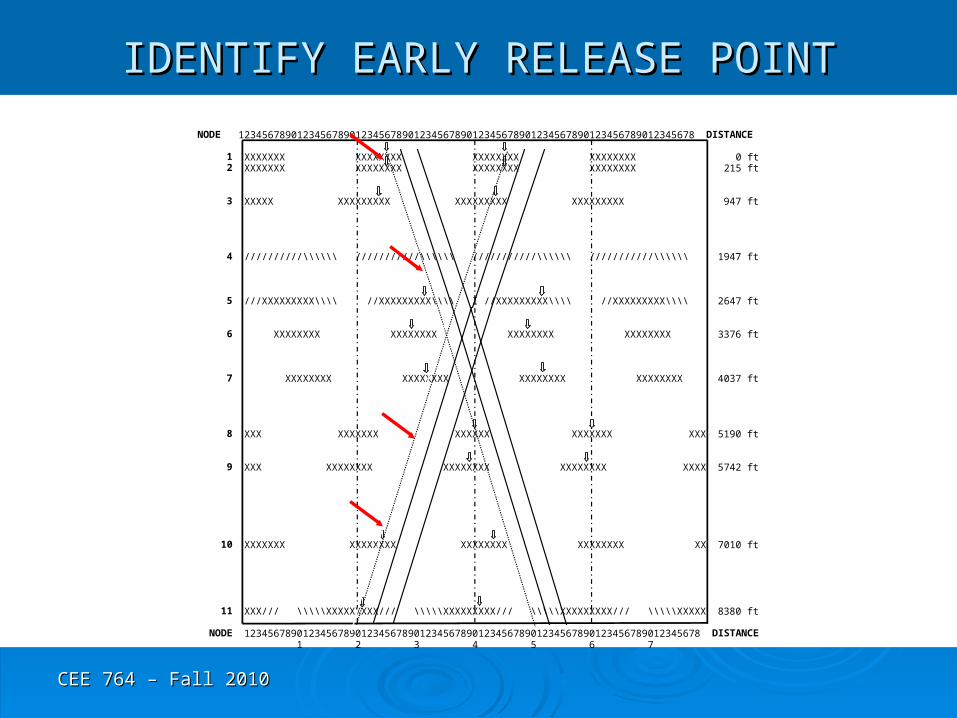
NODE 123456789012345678901234567890123456789012345678901234567890123456789012345678 DISTANCE
1 XXXXXXX XXXXXXXX XXXXXXXX XXXXXXXX 0 ft 2 XXXXXXX XXXXXXXX XXXXXXXX XXXXXXXX 215 ft
3 XXXXX XXXXXXXXX XXXXXXXXX XXXXXXXXX 947 ft
4 //////////\\\\\\ ///////////\\\\\\ ///////////\\\\\\ ///////////\\\\\\ 1947 ft
5 ///XXXXXXXXX\\\\ //XXXXXXXXX\\\\ I //XXXXXXXXX\\\\ //XXXXXXXXX\\\\ 2647 ft
6 XXXXXXXX XXXXXXXX XXXXXXXX XXXXXXXX 3376 ft
7 XXXXXXXX XXXXXXXX XXXXXXXX XXXXXXXX 4037 ft
8 XXX XXXXXXX XXXXXX XXXXXXX XXX 5190 ft
9 XXX XXXXXXXX XXXXXXXX XXXXXXXX XXXX 5742 ft
10 XXXXXXX XXXXXXXX XXXXXXXX XXXXXXXX XX 7010 ft
11 XXX/// \\\\\XXXXXXXXX/// \\\\\XXXXXXXXX/// \\\\\XXXXXXXXX/// \\\\\XXXXX 8380 ft
NODE 123456789012345678901234567890123456789012345678901234567890123456789012345678 DISTANCE 1 2 3 4 5 6 7
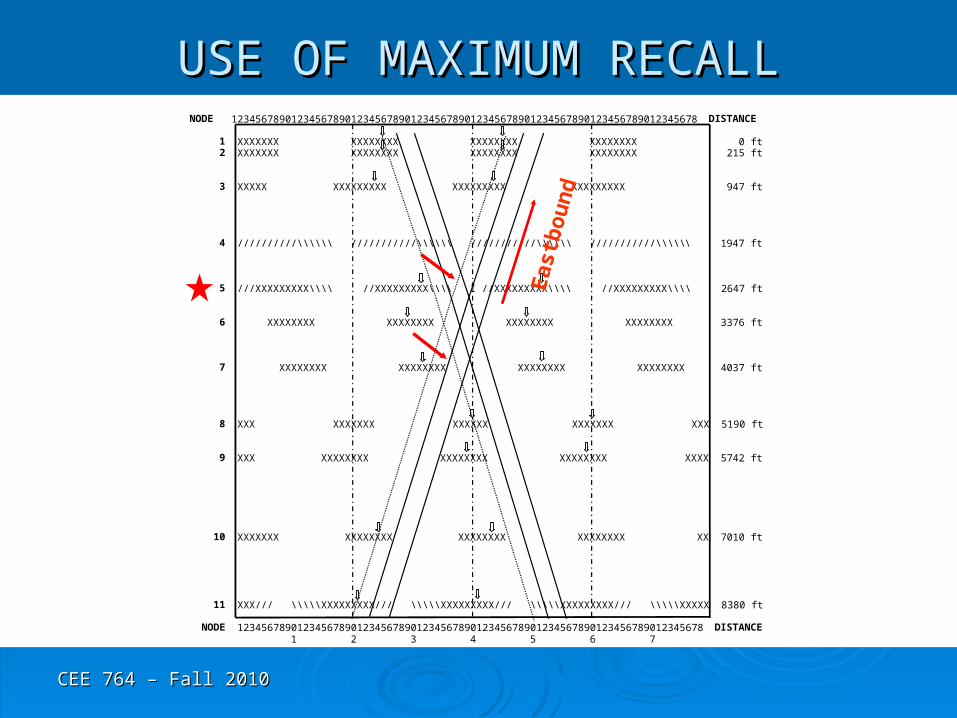
IDENTIFY EARLY RELEASE POINTIDENTIFY EARLY RELEASE POINT
CEE 764 – Fall 2010CEE 764 – Fall 2010
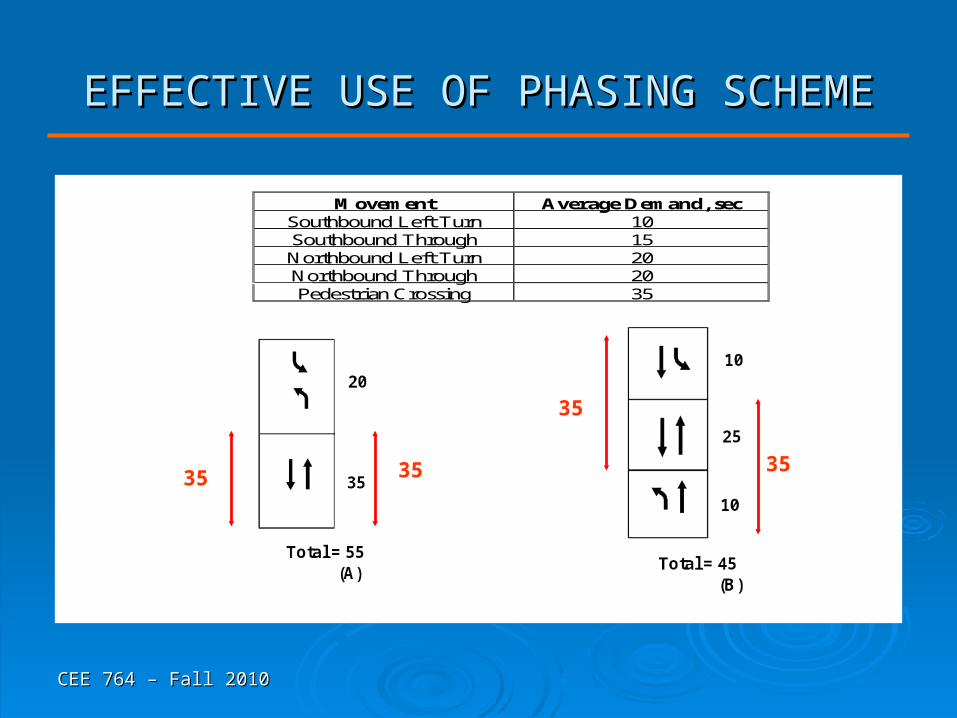
EFFECTIVE USE OF PHASING SCHEMEEFFECTIVE USE OF PHASING SCHEME
Movement Average Demand, secSouthbound Left Turn 10Southbound Through 15Northbound Left Turn 20Northbound Through 20Pedestrian Crossing 35
35
3535 35
CEE 764 – Fall 2010CEE 764 – Fall 2010
NODE 123456789012345678901234567890123456789012345678901234567890123456789012345678 DISTANCE
1 XXXXXXX XXXXXXXX XXXXXXXX XXXXXXXX 0 ft 2 XXXXXXX XXXXXXXX XXXXXXXX XXXXXXXX 215 ft
3 XXXXX XXXXXXXXX XXXXXXXXX XXXXXXXXX 947 ft
4 //////////\\\\\\ ///////////\\\\\\ ///////////\\\\\\ ///////////\\\\\\ 1947 ft
5 ///XXXXXXXXX\\\\ //XXXXXXXXX\\\\ I //XXXXXXXXX\\\\ //XXXXXXXXX\\\\ 2647 ft
6 XXXXXXXX XXXXXXXX XXXXXXXX XXXXXXXX 3376 ft
7 XXXXXXXX XXXXXXXX XXXXXXXX XXXXXXXX 4037 ft
8 XXX XXXXXXX XXXXXX XXXXXXX XXX 5190 ft
9 XXX XXXXXXXX XXXXXXXX XXXXXXXX XXXX 5742 ft
10 XXXXXXX XXXXXXXX XXXXXXXX XXXXXXXX XX 7010 ft
11 XXX/// \\\\\XXXXXXXXX/// \\\\\XXXXXXXXX/// \\\\\XXXXXXXXX/// \\\\\XXXXX 8380 ft
NODE 123456789012345678901234567890123456789012345678901234567890123456789012345678 DISTANCE 1 2 3 4 5 6 7
USE OF MAXIMUM RECALLUSE OF MAXIMUM RECALL
Eas
tbou
nd
CEE 764 – Fall 2010CEE 764 – Fall 2010
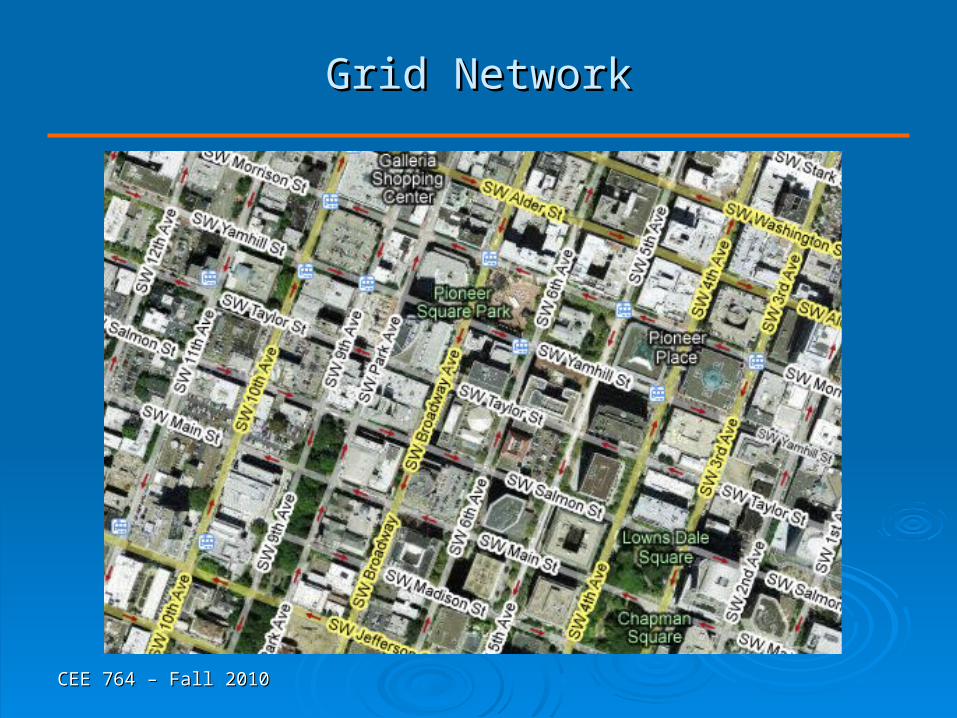
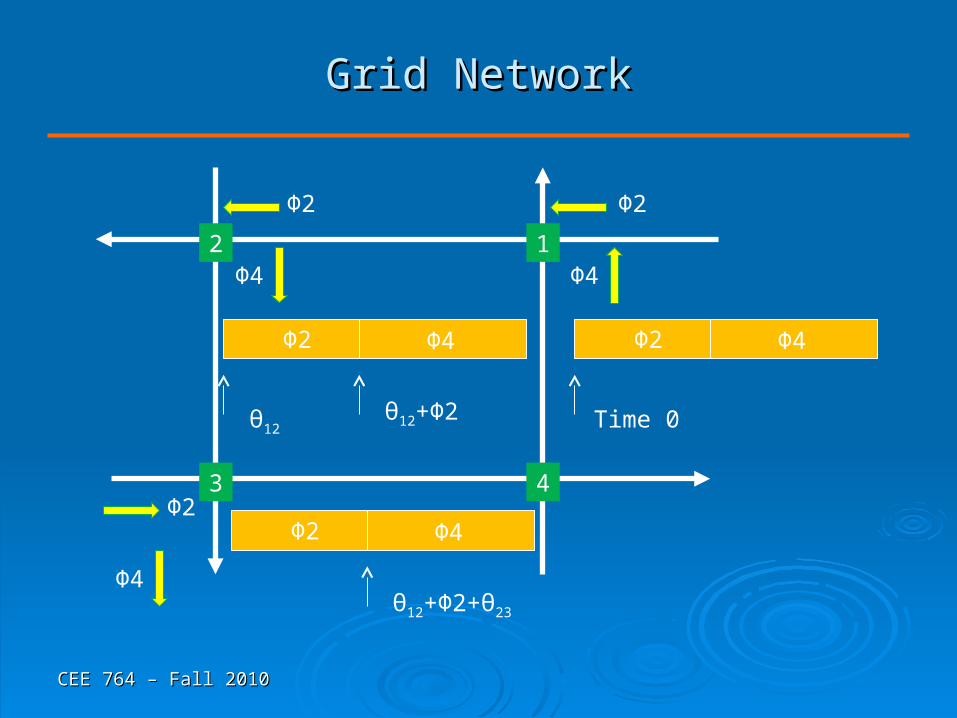
Grid NetworkGrid Network
CEE 764 – Fall 2010CEE 764 – Fall 2010
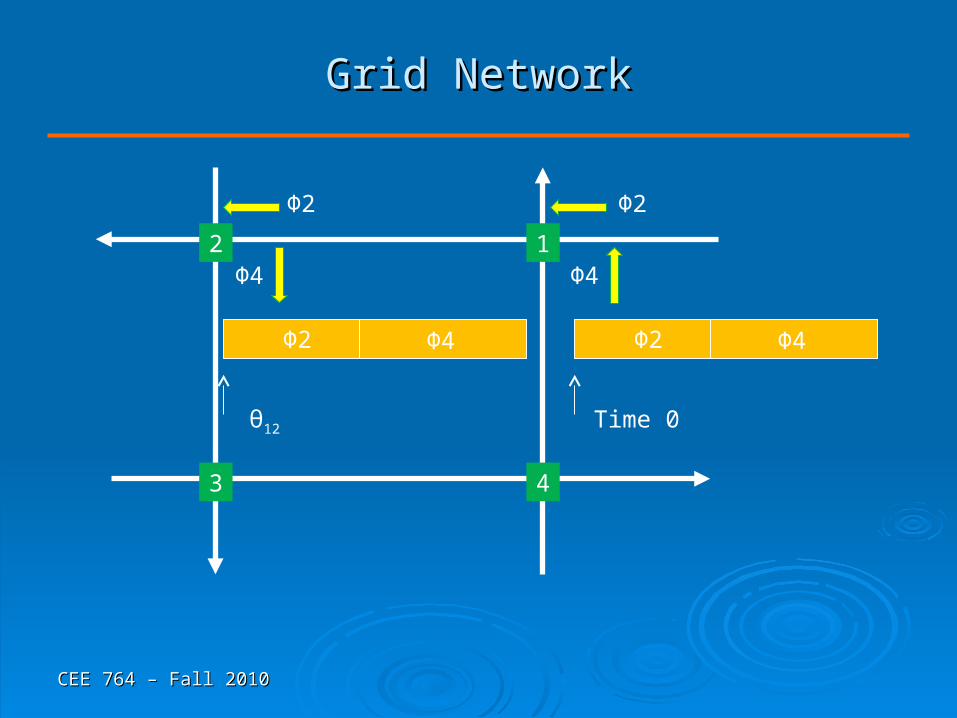
Grid NetworkGrid Network
Φ2
Φ4
Φ4Φ2
Φ2
Φ4
Φ4Φ2
12
3 4
Time 0θ12
CEE 764 – Fall 2010CEE 764 – Fall 2010
Grid NetworkGrid Network
Φ2
Φ4
Φ4Φ2
Φ2
Φ4
Φ4Φ2
12
3 4
Time 0θ12
Φ4Φ2
θ12+Φ2+θ23
Φ2
Φ4
θ12+Φ2
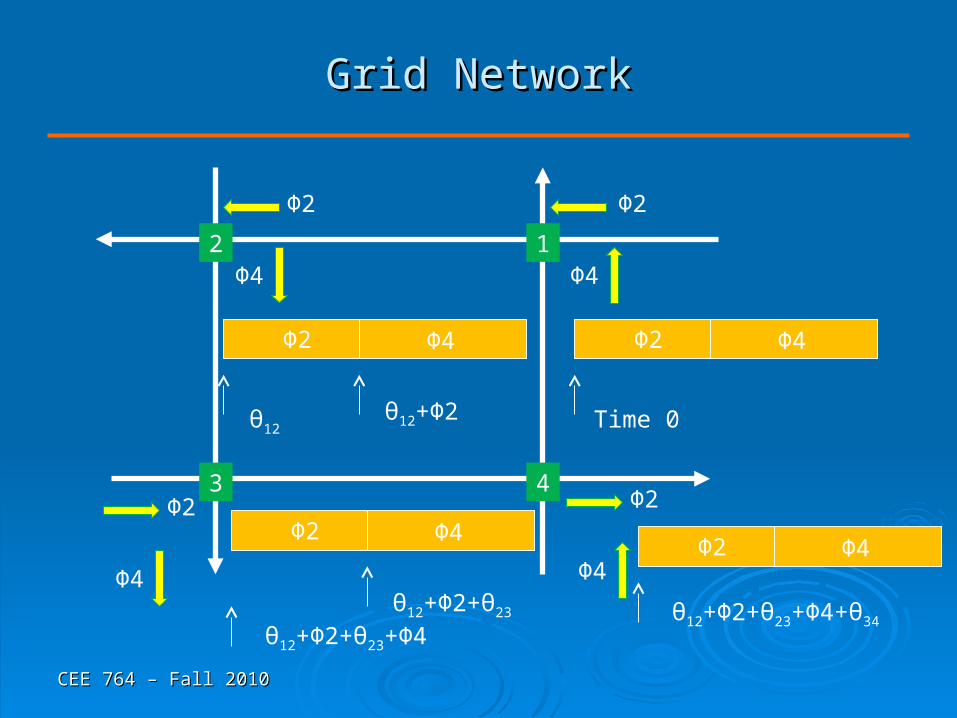
CEE 764 – Fall 2010CEE 764 – Fall 2010
Grid NetworkGrid Network
Φ2
Φ4
Φ4Φ2
Φ2
Φ4
Φ4Φ2
12
3 4
Time 0θ12
Φ4Φ2
θ12+Φ2+θ23
Φ4Φ2
θ12+Φ2+θ23+Φ4+θ34
Φ2
Φ4
Φ2
Φ4
θ12+Φ2+θ23+Φ4
θ12+Φ2
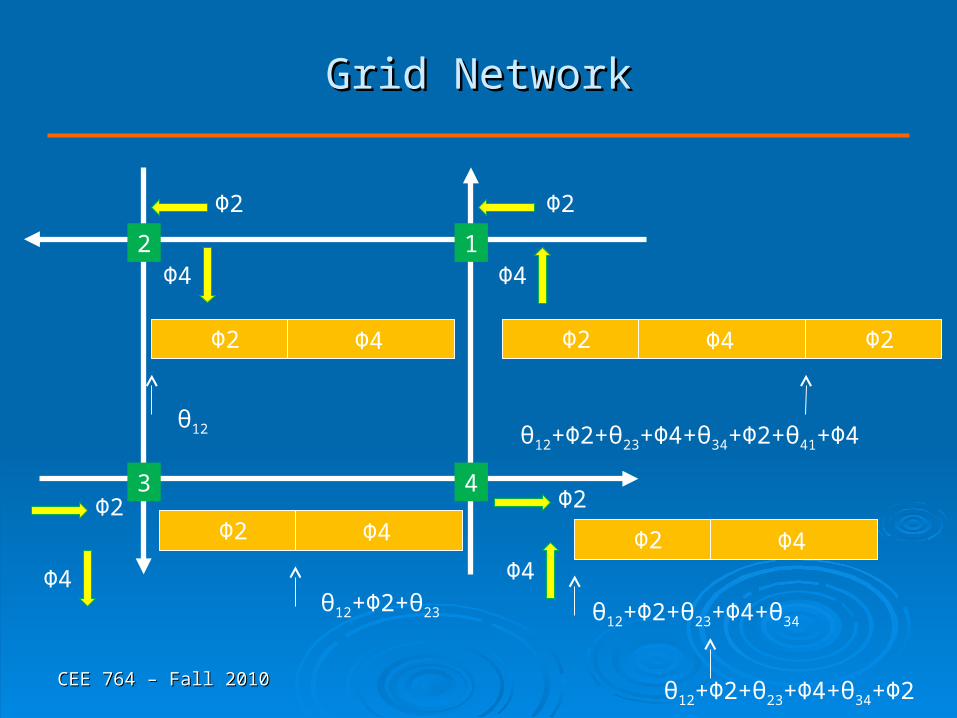
CEE 764 – Fall 2010CEE 764 – Fall 2010
Grid NetworkGrid Network
Φ2
Φ4
Φ4Φ2
Φ2
Φ4
Φ4Φ2
12
3 4
θ12
Φ4Φ2
θ12+Φ2+θ23
Φ4Φ2
θ12+Φ2+θ23+Φ4+θ34
Φ2
θ12+Φ2+θ23+Φ4+θ34+Φ2+θ41+Φ4
Φ2
Φ4
Φ2
Φ4
θ12+Φ2+θ23+Φ4+θ34+Φ2
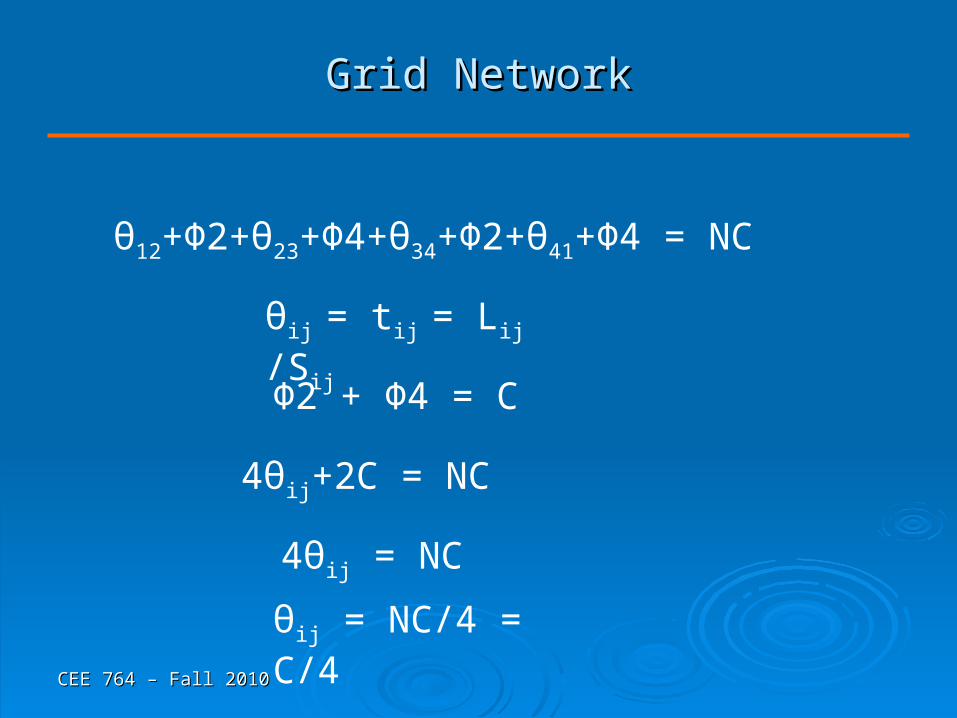
CEE 764 – Fall 2010CEE 764 – Fall 2010
Grid NetworkGrid Network
θ12+Φ2+θ23+Φ4+θ34+Φ2+θ41+Φ4 = NC
θij = tij = Lij /Sij
Φ2 + Φ4 = C
4θij+2C = NC
4θij = NC
θij = NC/4 = C/4
CEE 764 – Fall 2010CEE 764 – Fall 2010
ExampleExample
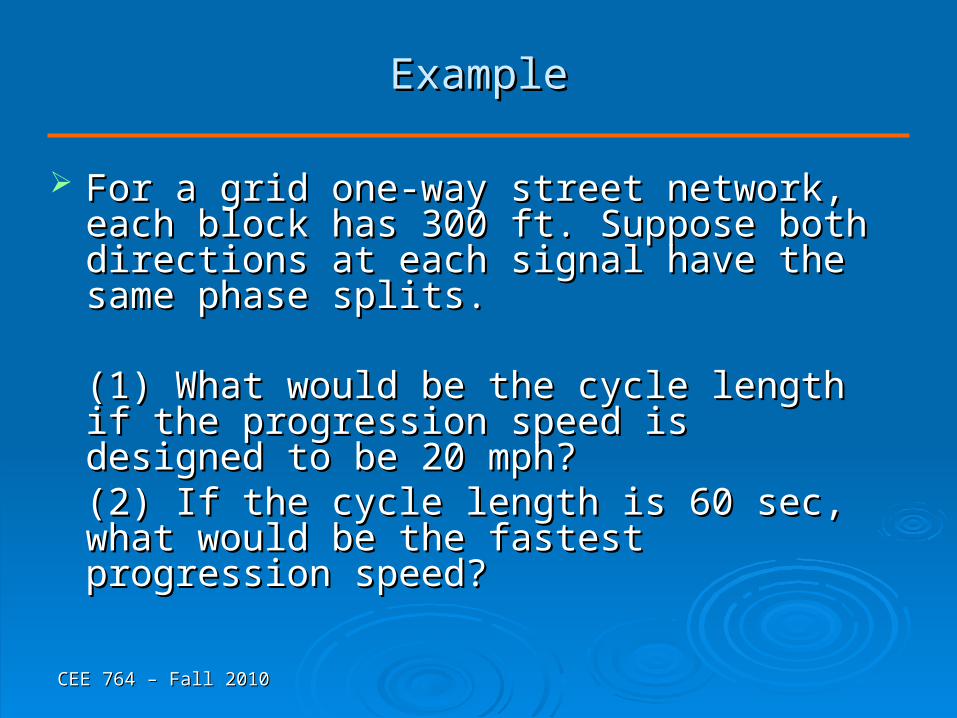
For a grid one-way street network, each block For a grid one-way street network, each block has 300 ft. Suppose both directions at each has 300 ft. Suppose both directions at each signal have the same phase splits. signal have the same phase splits.
(1) What would be the cycle length if the (1) What would be the cycle length if the progression speed is designed to be 20 mph?progression speed is designed to be 20 mph?(2) If the cycle length is 60 sec, what would be (2) If the cycle length is 60 sec, what would be the fastest progression speed?the fastest progression speed?