TOPIC 7 Global systems - Homepage | Wiley · TOPIC 7 Global systems ... Hydrosphere (the waters)...
48
c07GlobalSystems Page 290 16/07/17 2:25 PM 290 Jacaranda Science Quest 10 Australian Curriculum TOPIC 7 Global systems 7.1 Overview 7.1.1 Why learn this? We are living in the anthropocene era — an age in which humans are dominating and disrupting many of our planet’s natural sys- tems. Is it time for us to recognise our effect and take responsibility for our actions? How much fur- ther can we push our global life-support systems? Within the next century, will our species be a mere footprint on what is left of Earth? 7.1.2 Think about global systems • Which organism is being blamed for causing the sixth mass extinction? • What has both a ‘layer’ and a ‘zone’ in it? • When is the ‘laughing gas’ nitrous oxide nothing to laugh about? • If global cooling did increase the size of the human brain, what effects might global warming have? • Are humans still evolving? • Are you a climate-change sceptic? LEARNING SEQUENCE 7.1 Overview 290 7.2 Revisiting cycles and spheres 292 7.3 Climate patterns 297 7.4 Global warming 300 7.5 Heating up for Thermageddon? 306 7.6 Some cool solutions 311 7.7 Global warming — believe it or not? 314 7.8 Ozone alert! 317 7.9 Biodiversity and climate change 321 7.10 Biosphere 2 326 7.11 SWOT analyses and fishbone diagrams 332 7.12 Project: The fifty years after... 334 7.13 Review 335 Numerous videos and interactivities are embedded just where you need them, at the point of learning, in your learnON title at www.jacplus.com.au. They will help you to learn the concepts covered in this topic. UNCORRECTED PAGE PROOFS
Transcript of TOPIC 7 Global systems - Homepage | Wiley · TOPIC 7 Global systems ... Hydrosphere (the waters)...

c07GlobalSystems Page 290 16/07/17 2:25 PM
290 Jacaranda Science Quest 10 Australian Curriculum
TOPIC 7Global systems
7.1 Overview7.1.1 Why learn this?We are living in the anthropocene era — an age in which humans are dominating and disrupting many of our planet’s natural sys-tems. Is it time for us to recognise our effect and take responsibility for our actions? How much fur-ther can we push our global life-support systems? Within the next century, will our species be a mere footprint on what is left of Earth?
7.1.2 Think about global systems • Which organism is being blamed for causing the sixth mass extinction? • What has both a ‘layer’ and a ‘zone’ in it? • When is the ‘laughing gas’ nitrous oxide nothing to laugh about? • If global cooling did increase the size of the human brain, what effects might global warming have? • Are humans still evolving? • Are you a climate-change sceptic?
LEARNING SEQUENCE7.1 Overview 2907.2 Revisiting cycles and spheres 2927.3 Climate patterns 2977.4 Global warming 3007.5 Heating up for Thermageddon? 3067.6 Some cool solutions 3117.7 Global warming — believe it or not? 3147.8 Ozone alert! 3177.9 Biodiversity and climate change 321
7.10 Biosphere 2 3267.11 SWOT analyses and fishbone diagrams 3327.12 Project: The fifty years after... 3347.13 Review 335
Numerous videos and interactivities are embedded just where you need them, at the point of learning, in your learnON title at www.jacplus.com.au. They will help you to learn the concepts covered in this topic.
UNCORRECTED PAGE P
ROOFS

c07GlobalSystems Page 291 16/07/17 2:25 PM
TOPIC 7 Global systems 291
7.1.3 Your questAre you involved in causing the sixth mass extinction?It has been suggested that humans have unleashed the sixth mass extinction in Earth’s history. Human activities such as destroying habitats, over-hunting, overfishing, intro-ducing species, spreading diseases and burning fossil fuels are thought to be the key trig-gers of this mass destruction.
There have been five other mass extinctions recorded over the past 540 million years. Fossil evidence suggests that in each of these other mass extinctions at least 75 per cent of all animal species were destroyed. These extinc-tions are thought to have been caused by climate changes.
Scientists suggest that, prior to human expansion about 500 years ago, mammal extinctions were very rare. On average, only two species died out every million years. In the last 500 years, however, at least 80 of 5570 mammal species have become extinct. This is alarming in terms of biodiversity.
Of concern is the increasing list of critically endangered or currently threatened species. If these species become extinct and biodiversity loss continues, scientists suggest that the sixth mass extinction could arrive within 3 to 22 centuries. While this may seem like a long timeframe, compared with all but one of the other five mass extinctions it is considered by palaeobiologists to be fast.
The most abrupt mass extinction, in which an estimated 76 per cent of species (including dinosaurs) were wiped out, occurred around 65 million years ago (at the end of the Cretaceous period). It is generally accepted that this was caused by a comet or asteroid crashing into our planet, resulting in firestorms and dust clouds, which in turn led to global cooling. The four earlier mass extinctions are estimated to have taken hundreds of thousands to millions of years as they were due mainly to naturally caused global cooling or warming.
Investigate, think and discuss1. (a) List examples of human activities that are suggested to be key triggers for the sixth mass extinction.
(b) Do you agree or disagree with the suggestion that humans are causing a mass extinction? Justify your response.
2. (a) Compare the rate of mammal extinction prior to and after human expansion.(b) Suggest what effect this extinction rate has on biodiversity.(c) Suggest why scientists are concerned about loss of biodiversity.
3. (a) Research and construct summary reports on the five recorded mass extinctions.(b) Select one of the mass extinctions and write a story that could be acted out by characters living
during the time of the extinction. Be sure to include examples of biodiversity prior to the mass extinction and then the biodiversity loss during or at the end of the extinction.
(c) Communicate your story to others using multimedia (e.g. animation, slowmation or documentary), cartoons or songs.
UNCORRECTED PAGE P
ROOFS

c07GlobalSystems Page 292 16/07/17 11:40 AM
292 Jacaranda Science Quest 10 Australian Curriculum
7.2 Revisiting cycles and spheres 7.2.1 Life’s Earth support zone All habitats on Earth are located in what could be considered a life-support zone. This thin layer of our planet includes the atmosphere, the ocean depths, and the upper part of Earth’s crust and its sediments.
7.2.2 The biosphere The biosphere is the life-support system of our planet. It consists of the atmosphere , lithosphere , hydrosphere and biota (living things), the interactions between them, and the radiant energy of the sun. The biosphere includes all of the ecosys-tems on Earth. Interactions within the bio-sphere include the cyclical movement of essential elements such as carbon, nitrogen and phosphorus.
Atmosphere (the air)Includes oxygen,
methane, carbon dioxide and ozone
Hydrosphere (the waters)
Includes water and dissolved carbon
dioxide
BiosphereEarth’s life
support system
Lithosphere (thesoil) Includes humus
in soil, rocks (e.g.limestone),coal and oil
Biota (livingthings) Includes organic
compounds:carbohydrates,lipids, proteins
The biosphere can be considered Earth’s life-support system.
ECOSYSTEMDynamic systemof organismsinteracting witheach other andtheir environment
MOLECULESTwo or more atoms bonded together
ORGANELLESand CYTOPLASM
CELLThe smallest unit that is itself alive
Components from which cells are constructed
MULTICELLULAR ORGANISMIndividual composed ofmany specialised cells
POPULATIONGroup of organisms of the same species in the samearea
COMMUNITYPopulations oforganisms livingin the samehabitat
BIOSPHEREEntire surface of the Earth andits organisms
Ability toperform simplebiologicalfunctions
Social order;evolution
Unique phenomena that emerge as complexity increases
SUBATOMIC PARTICLESProtons, neutrons,and electrons
ATOMSSmallest unit of a substance that retains the properties of that substance
Higher biologicalproperties, e.g. sight, emotion,intelligence
Species interaction(predation,parasitism,mutualism)
LIFECapacity toperform complexbiologicalfunctions
There is pattern, order and organisation within their environments.
UNCORRECTED PAGE P
ROOFS
c07GlobalSystems Page 293 16/07/17 2:25 PM
TOPIC 7 Global systems 293
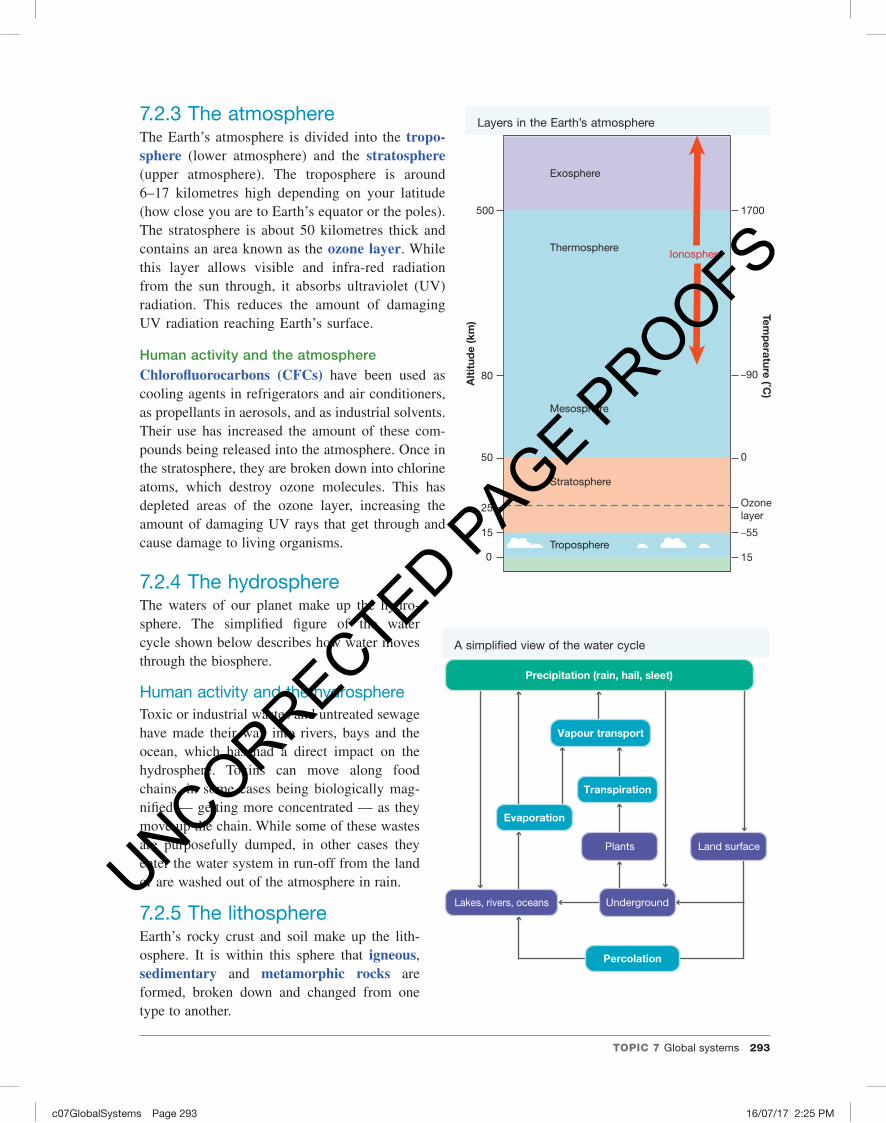
7.2.3 The atmosphereThe Earth’s atmosphere is divided into the tropo-sphere (lower atmosphere) and the stratosphere (upper atmosphere). The troposphere is around 6–17 kilometres high depending on your latitude (how close you are to Earth’s equator or the poles). The stratosphere is about 50 kilometres thick and contains an area known as the ozone layer. While this layer allows visible and infra-red radiation from the sun through, it absorbs ultraviolet (UV) radiation. This reduces the amount of damaging UV radiation reaching Earth’s surface.
Human activity and the atmosphereChlorofluorocarbons (CFCs) have been used as cooling agents in refrigerators and air conditioners, as propellants in aerosols, and as industrial solvents. Their use has increased the amount of these com-pounds being released into the atmosphere. Once in the stratosphere, they are broken down into chlorine atoms, which destroy ozone molecules. This has depleted areas of the ozone layer, increasing the amount of damaging UV rays that get through and cause damage to living organisms.
7.2.4 The hydrosphereThe waters of our planet make up the hydro-sphere. The simplified figure of the water cycle shown below describes how water moves through the biosphere.
Human activity and the hydrosphereToxic or industrial wastes and untreated sewage have made their way into rivers, bays and the ocean, which has had a direct impact on the hydrosphere. Toxins can move along food chains, in some cases being biologically mag-nified — getting more concentrated — as they move up the chain. While some of these wastes are purposefully dumped, in other cases they enter the water system in run-off from the land or are washed out of the atmosphere in rain.
7.2.5 The lithosphereEarth’s rocky crust and soil make up the lith-osphere. It is within this sphere that igneous, sedimentary and metamorphic rocks are formed, broken down and changed from one type to another.
500 1700
–90
0
Ozonelayer
50
80
25
15 –55
150
Exosphere
Thermosphere
Mesosphere
Stratosphere
Troposphere
Temp
erature (˚C)
Alt
itud
e (k
m)
Ionosphere
Layers in the Earth’s atmosphere
Vapour transport
Transpiration
Evaporation
Precipitation (rain, hail, sleet)
Percolation
Lakes, rivers, oceans
Land surfacePlants
Underground
A simplified view of the water cycle
UNCORRECTED PAGE P
ROOFS

c07GlobalSystems Page 294 16/07/17 2:25 PM
294 Jacaranda Science Quest 10 Australian Curriculum
The land surface of our planet is divided into regions called biomes. The criterion used to divide regions into biomes is the dominant vege-tation type. Environmental factors (such as latitude, temperature and rainfall) influence the type of veg-etation that can survive in a par-ticular area and so can be used to predict the type of biome that may exist there. The figure at right shows examples of Earth’s biomes and the relationship between the distribution of vegetation types and temperature and rainfall.
Human activity and the lithosphereOverstocking, soil exhaustion, salinity, pesticides, unstable landfill, salinisation, toxic see page, excessive clearing, chem-ical emissions, deforestation and soil erosion can all be very destructive to the lithosphere. Overgrazing and deforest-ation may also result in desertification. They can have detrimental effects on hab-itats and resources and hence the survival of organisms within the ecosystem.
7.2.6 The carbon cycleCarbon is present in various organic and inorganic compounds within the biosphere. It can be found in the hydrosphere as dissolved carbon dioxide, and in the lithosphere as coal or oil deposits and rocks such as limestone. Within the atmosphere it may be present as methane or carbon dioxide, and within living things it may occur as proteins, carbohydrates or lipids.
The carbon cycle models how carbon moves through the biosphere. Carbon travels from the non-living atmosphere to living things when carbon dioxide is absorbed by photosynthetic organisms (such as plants). A simplified version of the carbon cycle is shown at the top of the following page. Can you see the areas within the cycle where the non-living parts of the biosphere (atmosphere, lithosphere and hydrosphere) and the living parts (biota) interact?
Equator
30°N
Tropic of Cancer
30°S
Tropic of Capricorn
Polar and high mountain ice
Chaparral
Temperate grassland
Tropical forest
Savanna
Desert
Tropical deciduous forest
Coniferous forest
Tundra (arctic and alpine)
The type of dominant vegetation within biomes is influenced by environmental factors.
Excessive clearing and deforestation affect the lithosphere.
WHAT DOES IT MEAN?The term lithosphere comes from the Greek words lithos, meaning ‘stone’, and sphaira, meaning ‘globe’ or ‘ball’.
UNCORRECTED PAGE P
ROOFS

c07GlobalSystems Page 295 16/07/17 2:25 PM
TOPIC 7 Global systems 295
Human activity and the carbon cycleIncreased human populations and industrialisa-tion have resulted in an increase in the burning of fossil fuels. Human activity has also led to changed patterns in land use and deforestation. All of these have contributed to an increase in the carbon dioxide that has been added to the atmosphere. Increased levels of this greenhouse gas have added to the enhanced greenhouse effect and global warming. Increased global tem-peratures may result in melting icecaps, rising sea levels, coastal flooding and unusual weather patterns. These events may threaten the survival of organisms in many ecosystems.
7.2.7 The nitrogen and phosphorus cyclesThe nitrogen cycle models how nitrogen moves through the biosphere. A simplified version of this cycle is shown in the figure below. Can you see the areas in which the non-living parts of the biosphere and the living parts interact with each other?
The phosphorus cycle models how phosphorus moves from the lithosphere to the hydrosphere and then through food chains and back.
Human activity and the nitrogen and phosphorus cyclesLarge amounts of chemical fertilisers rich in nitrogen and phosphorus have been used on agri-cultural crops to enhance their growth. The large
respiration
eating
death
death andexcretion
formation of
burning of
decomposition
respiration
respiration
photosynthesis
CO2 in air Ocean
Organic matterin consumers
Fossil fuels(e.g. coal, oil,
limestone)
Organic matterin dead organisms
and in detritus
Decomposersand detritivores
Organic matterin producers
A simplified view of how carbon is cycled within an ecosystem
Plantprotein
Dead plantsand animals
Animalprotein
Nitrogen in air
Ammonia
Nitrites
Nitrates insoil and water
Nitrites
Animalwaste
decomposer
denitrifyingbacteria
nitrifyingbacteria
nitrogen-�xingbacteria
Ammonia
A simplified view of how nitrogen is cycled within an ecosystem
Dissolved phosphatein soil and water
Phosphatein rocks
Deep seasediments
Shallow seasediments
Animalprotein
Plantprotein
Waste anddead animals
weathering,erosion
run-offfrom rivers
may be trappedfor millions of
years
A simplified view of how phosphorus is cycled within an ecosystem
UNCORRECTED PAGE P
ROOFS
diacriTech
Highlight
c07GlobalSystems Page 296 16/07/17 2:25 PM
296 Jacaranda Science Quest 10 Australian Curriculum
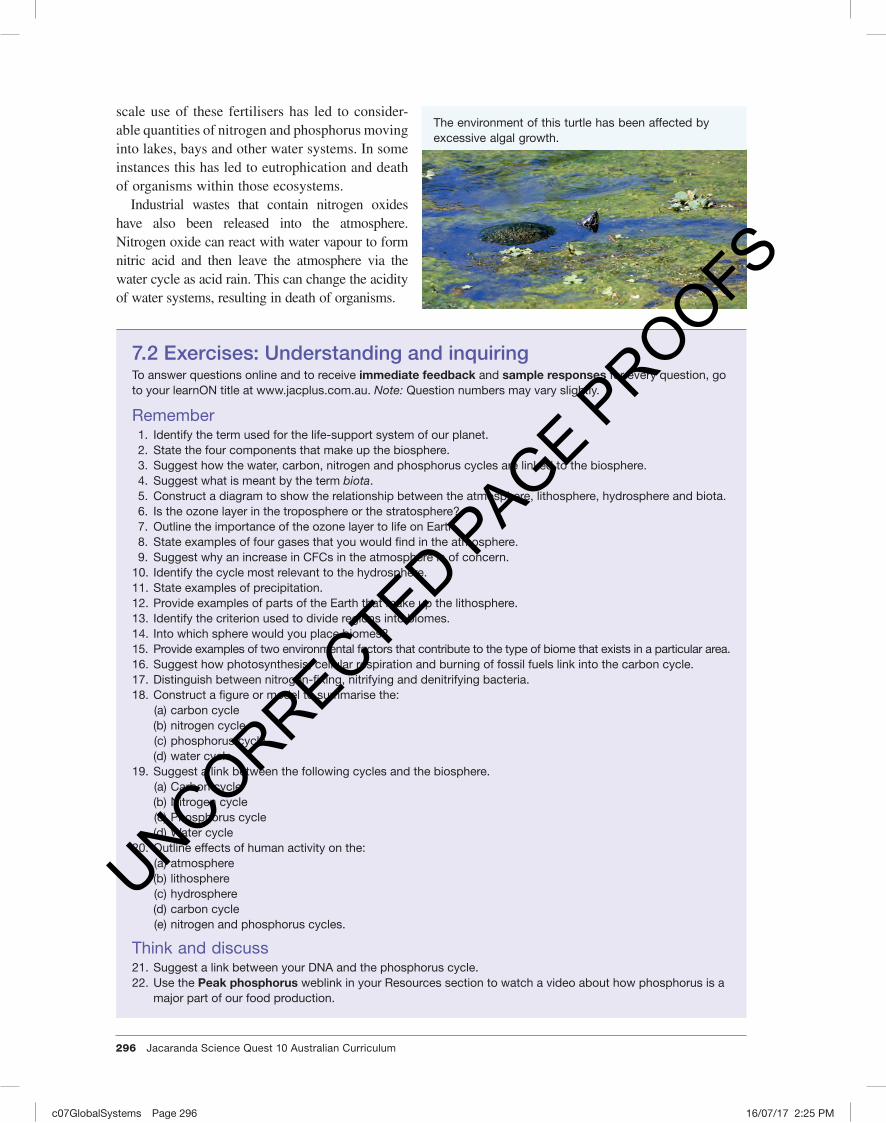
scale use of these fertilisers has led to consider-able quantities of nitrogen and phosphorus moving into lakes, bays and other water systems. In some instances this has led to eutrophication and death of organisms within those ecosystems.
Industrial wastes that contain nitrogen oxides have also been released into the atmosphere. Nitrogen oxide can react with water vapour to form nitric acid and then leave the atmosphere via the water cycle as acid rain. This can change the acidity of water systems, resulting in death of organisms.
The environment of this turtle has been affected by excessive algal growth.
7.2 Exercises: Understanding and inquiringTo answer questions online and to receive immediate feedback and sample responses for every question, go to your learnON title at www.jacplus.com.au. Note: Question numbers may vary slightly.
Remember1. Identify the term used for the life-support system of our planet.2. State the four components that make up the biosphere.3. Suggest how the water, carbon, nitrogen and phosphorus cycles are linked to the biosphere.4. Suggest what is meant by the term biota.5. Construct a diagram to show the relationship between the atmosphere, lithosphere, hydrosphere and biota.6. Is the ozone layer in the troposphere or the stratosphere?7. Outline the importance of the ozone layer to life on Earth.8. State examples of four gases that you would find in the atmosphere.9. Suggest why an increase in CFCs in the atmosphere is of concern.
10. Identify the cycle most relevant to the hydrosphere.11. State examples of precipitation.12. Provide examples of parts of the Earth that make up the lithosphere.13. Identify the criterion used to divide regions into biomes.14. Into which sphere would you place biomes?15. Provide examples of two environmental factors that contribute to the type of biome that exists in a particular area.16. Suggest how photosynthesis, cellular respiration and burning of fossil fuels link into the carbon cycle.17. Distinguish between nitrogen-fixing, nitrifying and denitrifying bacteria.18. Construct a figure or model to summarise the:
(a) carbon cycle(b) nitrogen cycle(c) phosphorus cycle(d) water cycle.
19. Suggest a link between the following cycles and the biosphere.(a) Carbon cycle(b) Nitrogen cycle(c) Phosphorus cycle(d) Water cycle
20. Outline effects of human activity on the:(a) atmosphere(b) lithosphere(c) hydrosphere(d) carbon cycle(e) nitrogen and phosphorus cycles.
Think and discuss21. Suggest a link between your DNA and the phosphorus cycle.22. Use the Peak phosphorus weblink in your Resources section to watch a video about how phosphorus is a
major part of our food production.
UNCORRECTED PAGE P
ROOFS

c07GlobalSystems Page 297 16/07/17 2:25 PM
TOPIC 7 Global systems 297
7.3 Climate patterns7.3.1 Climate patternsThe Earth’s climate is always changing. It always has and always will. So why has climate change become the single most important issue for so many people in the twenty-first century?
The variation of climate over the Earth’s surface is largely the result of four major influences.
1. The amount of energy from the sun reaching the surfaceBecause the Earth is almost spherical in shape, the energy from the sun that reaches the Earth’s surface is spread over a larger area in the polar regions than near the equator. That is, the amount of energy reaching each square metre of the Earth’s surface in the polar regions is less than near the
23. The figure below shows a more detailed view of how processes such as photosynthesis (green arrows) and cellular respiration (purple arrows) are involved in interactions between the atmosphere (exchange of gases) and living things. Copy and complete the figure below, inserting the following words: atmosphere, light energy, glucose, oxygen, water, carbon dioxide.
obtainedfrom
releasedinto
obtainedfrom
releasedinto
splits into
absorbedby
used to produce
used to produce
used to produce
used to produce
used to produce
combine to form
energy used tobreak bonds
Atmosphere
Chlorophyll
Hydrogen
Explore more with this weblink: Peak phosphorus
Complete this digital doc: Worksheet 7.1: Nature’s time machineSearchlight ID: doc-19472
Complete this digital doc: Worksheet 7.2: Cycles in natureSearchlight ID: doc-19473
RESOURCES — ONLINE ONLY
Atmosphere
Equator
Latitude 60°S
South Pole
Radiationfrom the sun
More radiation absorbed and reflected by the atmosphere
Radiation spreadover larger area
The spherical shape of Earth results in less of the sun’s energy reaching each square metre of the Earth’s surface in the polar regions than near the equator.
UNCORRECTED PAGE P
ROOFS
diacriTech
Highlight
diacriTech
Highlight
diacriTech
Highlight
diacriTech
Highlight
c07GlobalSystems Page 298 16/07/17 2:25 PM
298 Jacaranda Science Quest 10 Australian Curriculum
equator. It is the difference in surface temper-ature between the poles and the tropics that causes the movement of air that we know as wind.
2. The differing abilities of land and water to absorb and emit radiant heatDuring daylight hours the land absorbs radiant heat from the sun more quickly than water. At night heat is radiated from the land more quickly than from the water. As a result, the ocean tem-perature changes less on a daily basis than air and land temperatures, and coastal climates are protected from the high and low temperature extremes of inland climates.
3. The tilt of the Earth’s axisThe tilt of the Earth’s axis results in the polar regions receiving little or no solar radiation for six months of each year.
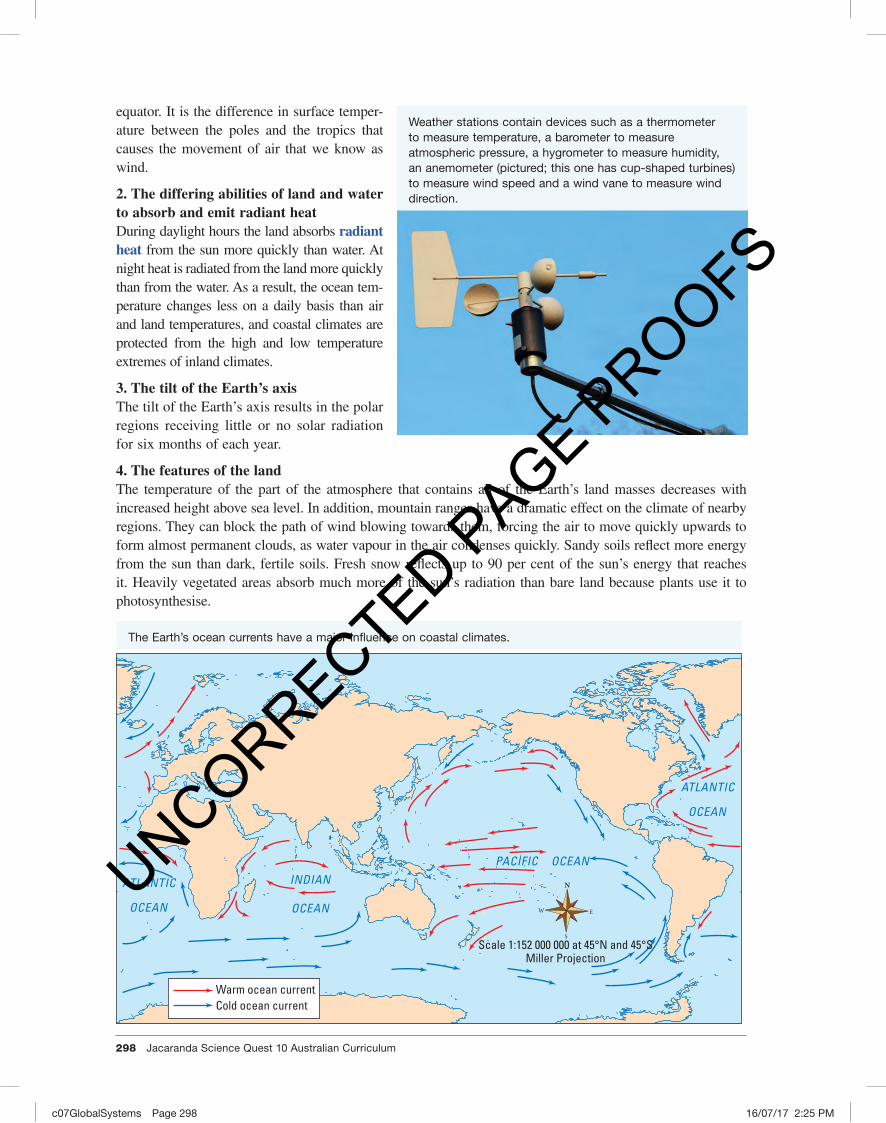
4. The features of the landThe temperature of the part of the atmosphere that contains all of the Earth’s land masses decreases with increased height above sea level. In addition, mountain ranges have a dramatic effect on the climate of nearby regions. They can block the path of wind blowing towards them, forcing the air to move quickly upwards to form almost permanent clouds, as water vapour in the air condenses quickly. Sandy soils reflect more energy from the sun than dark, fertile soils. Fresh snow reflects up to 90 per cent of the sun’s energy that reaches it. Heavily vegetated areas absorb much more of the sun’s radiation than bare land because plants use it to photosynthesise.
Weather stations contain devices such as a thermometer to measure temperature, a barometer to measure atmospheric pressure, a hygrometer to measure humidity, an anemometer (pictured; this one has cup-shaped turbines) to measure wind speed and a wind vane to measure wind direction.
PACIFIC OCEANINDIAN
OCEANOCEAN
ATLANTIC
OCEAN
ATLANTIC
Warm ocean currentCold ocean current
Scale 1:152 000 000 at 45°N and 45°SMiller Projection
The Earth’s ocean currents have a major influence on coastal climates.
UNCORRECTED PAGE P
ROOFS

c07GlobalSystems Page 299 16/07/17 2:25 PM
TOPIC 7 Global systems 299
7.3.2 Ocean currentsThe water in the Earth’s oceans is constantly moving in currents. Ocean currents are the result of the tempera-ture difference between the tropics and poles, and the Earth’s rotation. Warm surface water near the equator sinks and cools as it moves towards the poles, while the cold water in polar regions rises and warms as it moves towards the equator. Warm and cold ocean cur-rents move huge volumes of water past coastal regions and have a major influ-ence on their climate. The Gulf Stream (at top left in the map on previous page), for example, carries warm water from the equator into the North Atlantic Ocean, keeping Great Britain, Norway and Iceland warmer than other regions at similar latitudes. Cold water currents cool coastal regions that would other-wise be hot.
7.3.3 The influence of windThe differences in surface temperature between the poles and the tropics cause the large-scale convection currents that create wind. Cold air near the poles sinks and moves towards the equator, and hot air near the equator rises and moves towards the poles.
The globe diagram above shows the effects of these convection currents during March and September, when the sun is directly over the equator. The winds shown are called prevailing winds and are generally those most frequently observed in each region. The direction of prevailing winds is complicated by latitude, the rotation of the Earth about its own axis, the tilt of the Earth’s axis and the Earth’s orbit around the sun. The actual wind direction at any time depends on numerous other factors including the amount of friction caused by the land surface, ocean currents, local variations in air pressure and temperature, variations in water and land temperature, and altitude.
The wind direction in turn influences air temperatures. For example, during the Australian summer, regions along most of the south coast experience high temperatures when the northerly winds bring in hot and dry air from above the land to the north. The same regions can experience cold southerly winds, which bring in cool and damp air from above the oceans to the south.
North Pole
South Pole
Polareasterlies
Polareasterlies
South-westerlies
North-westerlies
North-easttrade winds
South-easttrade winds
0°
30°S
60°S
30°N
60°N
Convection currents carry warm air towards the poles and cool air towards the equator. Wind patterns are complicated by the rotation of the Earth.
7.3 Exercises: Understanding and inquiringTo answer questions online and to receive immediate feedback and sample responses for every question, go to your learnON title at www.jacplus.com.au. Note: Question numbers may vary slightly.
Remember1. List four major factors that influence the variation of climate over the Earth’s surface.2. What causes the large-scale convection currents in the air that create prevailing winds?3. List five factors that determine the wind direction at any given time or place.
UNCORRECTED PAGE P
ROOFS

c07GlobalSystems Page 300 16/07/17 2:25 PM
300 Jacaranda Science Quest 10 Australian Curriculum
7.4 Global warming7.4.1 Revisiting the greenhouse effectEarth’s atmosphere acts like a giant invisible blanket that keeps temperatures on our planet’s surface within a range that supports life. Within the atmosphere, greenhouse gases trap some of the energy leaving the Earth’s surface to help maintain these warm temperatures. The maintenance of Earth’s temperatures by these atmospheric gases is called the greenhouse effect.
4. Outline the causes of warm and cold ocean currents.5. Explain why Great Britain, Norway and Iceland experience warmer climates than other regions at similar
latitudes.
Think6. Why do sandy soils reflect more of the sun’s radiation than dark, fertile soils?7. Explain why the average temperature of the Earth’s atmosphere was constantly changing for millions of
years before humans existed.8. Outline the likely effect on land-based living organisms caused by:
(a) rising sea levels(b) an increase in average temperatures.
Investigate, discuss and reflect9. Research, discuss and reflect on each of the following statements about climate change and state your own
opinion.(a) Australia has vast resources of coal, much of which is exported. The Australian coal industry provides
employment and other benefits for the economy. If targets for the reduction of global emissions are high enough to damage the Australian coal industry, the government should not agree to them.
(b) Developing countries that have little or no industry have not contributed to global warming. These countries should be allowed to increase their carbon dioxide emissions so that they can develop industries and improve their living standards.
10. (a) Carefully examine the table below and suggest what types of vegetation may be found in an environment with a:(i) mean annual temperature between 0 °C and 15 °C and a mean annual rainfall around 50–100 cm(ii) mean annual temperature between 20 °C and 28 °C and a mean annual rainfall around 250–400 cm(iii) mean annual temperature between 20 °C and 28 °C and a mean annual rainfall around 20–30 cm.
(b) Find out the mean annual temperature and mean annual rainfall of your local environment. What type of vegetation would you expect to find there? Is this the case? If it is not, suggest possible reasons for the difference.
(c) Find out what climate change is predicted to occur in your local area due to global warming. Which vegetation would be best suited to this type of environment?
Vegetation type Mean annual temp. (°C)Mean annual
precipitation (cm)
Tundra −15–−5 0–100
Northern coniferous forests
−5–0 50–150
Mediterranean −4–17 0–60
Grassland 3–18 50–100
Temperate deciduous forest
3–19 50–300
Desert −5–30 0–50
Savanna 17–30 50–200
Tropical forests 18–30 100–450
UNCORRECTED PAGE P
ROOFS
c07GlobalSystems Page 301 16/07/17 2:25 PM
TOPIC 7 Global systems 301
7.4.2 Revisiting global warming What’s the problem? It’s a hot topic. Global temperatures have been increasing and are expected to continue to increase at an accelerated rate. The rising temperature of Earth is known as global warming . This may result in melting icecaps, rising sea levels, increased coastal fl ooding, unusual weather patterns and ocean currents, and con-sequent threats to the survival of some living things.
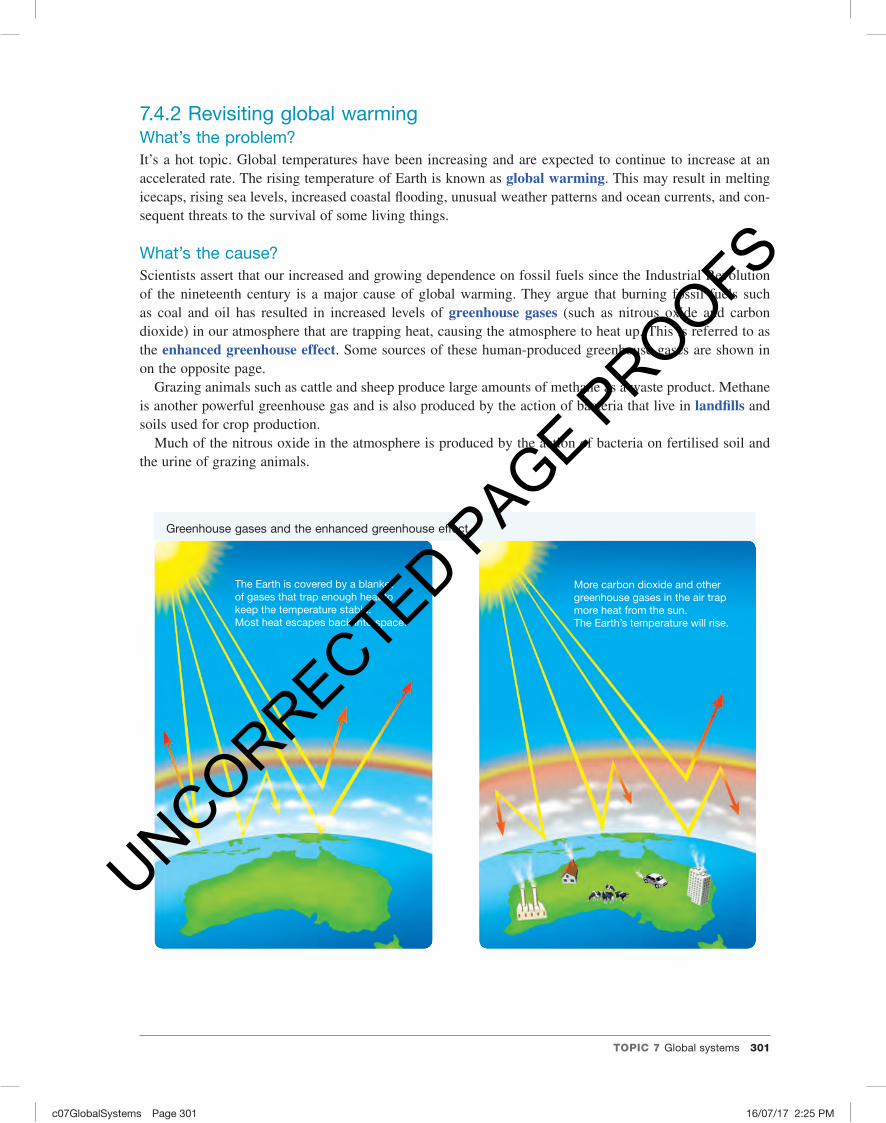
What’s the cause? Scientists assert that our increased and growing dependence on fossil fuels since the Industrial Revolution of the nineteenth century is a major cause of global warming. They argue that burning fossil fuels such as coal and oil has resulted in increased levels of greenhouse gases (such as nitrous oxide and carbon dioxide) in our atmosphere that are trapping heat, causing the atmosphere to heat up. This is referred to as the enhanced greenhouse effect . Some sources of these human-produced greenhouse gases are shown in on the opposite page.
Grazing animals such as cattle and sheep produce large amounts of methane as a waste product. Methane is another powerful greenhouse gas and is also produced by the action of bacteria that live in landfi lls and soils used for crop production.
Much of the nitrous oxide in the atmosphere is produced by the action of bacteria on fertilised soil and the urine of grazing animals.
The Earth is covered by a blanketof gases that trap enough heat to keep the temperature stable.Most heat escapes back into space.
More carbon dioxide and othergreenhouse gases in the air trap more heat from the sun. The Earth’s temperature will rise.
Greenhouse gases and the enhanced greenhouse effect
UNCORRECTED PAGE P
ROOFS

c07GlobalSystems Page 302 16/07/17 2:25 PM
302 Jacaranda Science Quest 10 Australian Curriculum
7.4.3 Connecting the carbon cycle to global warmingPhotosynthesis and cellular respirationLight energy, carbon dioxide and water are used by phototrophic organisms such as plants to make glucose and oxygen. This process is called photosynthesis.
All living things use cellular respiration. During this process glucose is converted into a form of energy that the cells can use. Carbon dioxide is one of the products of this reaction.
So, in terms of the carbon cycle, carbon dioxide is taken from the atmosphere during photosyn-thesis and released back during cellular respira-tion. This suggests that if producers are reduced in number or removed from the atmosphere, there will be less carbon dioxide removed from the atmosphere, resulting in an overall increase in this gas. This explains why cutting down trees and replacing them with buildings or crops with lower photosynthetic rates can contribute to the enhanced greenhouse effect.
Decomposition and fossil fuelsCarbon dioxide is also released from dead and non-living parts of ecosystems. Some of the carbon dioxide from the atmosphere dissolves into the sea and is absorbed by sea plants and
CarbondioxideCFCs
Methane
Nitrousoxide
Deforestation
Decomposition
Cellularrespiration
Burningfossil fuels
Bacteria infertilisers
Ricepaddies
Livestocke.g. cows
Bacteria in bogsand land�ll
Dry-cleaning
Refrigerants
Aerosols
Plastic foamproduction
Greenhousegases
Some sources of greenhouse gases
eating
deathdeath andexcretion
photosynthesis
CO2 in air
Organic matterin producers
Organic matterin consumers
Decomposersand detritivores
Organic matterin dead organisms
and in detritus
respiration
respiration
respiration
decomposition
Sources of carbon dioxide within the carbon cycle are coloured blue.
formation of
death
photosynthesis
dissolvesinto
CO2 in airFossil fuels
(e.g. coal, oil,limestone)
Sea Organic matterPhotosyntheticorganisms
respiration
burning of
Carbon dioxide is obtained from a variety of sources (coloured blue) within an ecosystem.
6CO2 + 12H2O C6H12O6 + 6O2 + 6H2Ovisible light energy
chlorophyll
C6H12O6 + 6O2 6CO2 + 6H2O + energy
UNCORRECTED PAGE P
ROOFS

c07GlobalSystems Page 303 16/07/17 2:25 PM
TOPIC 7 Global systems 303
other photosynthetic organisms. These organ-isms and those that eat them eventually die. Some of their carbon may be used in the for-mation of fossil fuels. When these fossil fuels are burned, carbon dioxide is released back into the atmosphere.
7.4.4 The ozone factorOzone (O3) in the lower atmosphere is also a significant contributor to the enhanced green-house effect. Although ozone occurs naturally, it is also produced by a photochemical reac-tion that takes place when sunlight falls on emissions from motor vehicles, power stations and bushfires.
7.4.5 Secrets in the iceFor thousands of years, snow has fallen in Antarctica. The snow turns to ice, which builds up over time. Dust, gases and other substances from the air become trapped in the ice. The trapped substances provide information about what was in the air at the time the snow fell.
Scientists have used ice cores to track the air temperature and concentration of carbon dioxide near the Earth’s surface in the past. The graphs below show how these have changed over the 420 000 years leading up to the year 2000.
Ozone is produced by photochemical reactions involving emissions from motor vehicles and industry.
This ice core was drilled from more than 3.7 km below the surface. Parts of it are more than 150 000 years old.
400 000 300 000 200 000 100 000
Number of years ago
100
150
200
250
300
350
CO
2 (p
pm
)
0
CO2 in the air over 420 000 years
400 000 300 000 200 000 100 000
Number of years ago
–4
–2
0
2
4
Tem
per
atur
e d
iffer
ence
(°C
)
0
Temperature variation over 420 000 years
The carbon dioxide concentration is shown in parts per million (ppm) by volume. The temperature difference shown is the deviation from the average temperature now (represented by 0 on the vertical scale). The pattern of changing temperatures resembles the pattern of the change in carbon dioxide concentrations.
UNCORRECTED PAGE P
ROOFS
diacriTech
Highlight

c07GlobalSystems Page 304 16/07/17 2:25 PM
304 Jacaranda Science Quest 10 Australian Curriculum
It is clear that there has been a dramatic increase in the amount of carbon dioxide in the atmosphere in recent history. During the current decade the concentration of carbon dioxide has risen to approximately 400 parts per million. There appears to be no significant change in global temperature cycles. However, the graph at right shows that since the Indus-trial Revolution there has been a dramatic change in the trend of carbon dioxide in the atmosphere.
7.4.6 Climate modelsMeteorologists and other scientists use com-puter modelling to make predictions about climate change and the possible consequences. The computer programs used to model climate change simulate the circulation of air in the atmosphere and water in the oceans. An immense amount of data collected from the atmosphere, ocean and land surface is used, together with mathematical equations that describe the circulation. The laws of physics and chemistry, including the laws of conservation of energy and Newton’s Laws of Motion, are an important part of the modelling process.
7.4.7 Global temperatureAlthough the exact future increase in average global temperature is not certain, it is generally agreed that during the next 100 years it could increase by between 1 ºC and 4 ºC. Although that doesn’t sound like much, the consequences are very serious. Computer modelling suggests that the global temperature will not increase evenly across the continents. According to CSIRO, in Australia temperatures could increase by up to 2 ºC by 2030 and up to 6 ºC by 2070. As a consequence there will be more hot days and fewer cold days, an increase in rainfall in the north-east and a decrease in the south, more bushfires, and more destructive tropical cyclones.
7.4.8 Rising sea levelsAccording to tide-gauge records, the average global sea level has increased by between 10 cm and 20 cm during the past 100 years. Sea levels are expected to rise further due to:
• the warming ocean water and its resulting thermal expansion
• the melting of glaciers, the polar ice-caps and the ice sheets of Greenland and Antarctica. According to NASA, sea ice in the Arctic is melting at the rate of 9 per cent every ten years. Of the world’s 88 glaciers, 84 are receding due to melting ice.
Rising sea levels are likely to cause the flooding of low-lying islands and coastal regions.
0
Car
bo
n d
ioxi
de
(pp
m)
Time (before 2005)
350
300
250
5000
0
300
350
19001800
10 000
400
This graph shows the dramatic increase in atmospheric carbon dioxide since the Industrial Revolution.
The low-lying Pacific nation of Kiribati is planning to relocate its population because of the threat of rising sea levels.
UNCORRECTED PAGE P
ROOFS
diacriTech
Highlight

c07GlobalSystems Page 305 16/07/17 2:25 PM
TOPIC 7 Global systems 305
7.4.9 Frozen soilMuch of the soil on or below the surface of very high mountains in the polar regions is permanently frozen. Known as permafrost, this soil is likely to gradually thaw out as global air temperatures increase. There is a massive amount of carbon stored in permafrost and scientists fear that as it thaws, large quantities of carbon dioxide and methane will be released into the atmosphere. This in turn would increase the rate of climate change.
Another problem associated with the thawing of permafrost is the risk of the collapse of buildings, bridges, roads, pipelines and other structures in populated areas of the northern polar regions. The founda-tions or bases of many of these structures are embedded in permafrost. As it thaws, any ice present melts, making the soil damp and unstable.
7.4 Exercises: Understanding and inquiringTo answer questions online and to receive immediate feedback and sample responses for every question, go to your learnON title at www.jacplus.com.au. Note: Question numbers may vary slightly.
Remember1. Suggest why Earth’s atmosphere has been described as a giant invisible blanket.2. What is:
(a) the greenhouse effect(b) the enhanced greenhouse effect(c) global warming?
3. Suggest four consequences of global warming.4. Give examples of three types of greenhouse gases and at least two sources for each.5. Identify the links between photosynthesis, cellular respiration, decomposition, fossil fuels and global
warming.6. Explain why ozone in the Earth’s stratosphere is important to humans and all other life on Earth.7. Explain how scientists are able to determine the air temperature and the amount of carbon dioxide in the
atmosphere hundreds of thousands of years ago when such measurements were never recorded.8. Explain how the thawing of permafrost could increase the rate of global warming.
Think and discuss9. Outline the actions that individuals can take to slow the rate of global warming.
10. (a) In your own words, describe what is meant by the term enhanced greenhouse effect. (b) Suggest a model or simulation that could communicate this concept to others.11. Suggest how whales that live on plankton could be affected by global warming.12. (a) Which of the following actions would you be prepared to take so that you can contribute to the fight
against global warming?• Walk, cycle or use public transport rather than relying on someone to drive you to school, work or
leisure activities.• Change your diet so that you eat less meat and more fruit and vegetables.• Recycle paper, aluminium and steel cans, glass and plastics.• Stop using electric clothes dryers and use outdoor clothes lines in dry weather and indoor folding
clothes-airers in wet weather to dry clothes. (b) Select one of the actions in part (a) that the government could enforce by passing new laws and explain
how it could be done.13. Explain why the average temperature of the Earth’s atmosphere was constantly changing for millions of
years before humans existed.14. Outline the likely effect on land-based living things caused by:
(a) rising sea levels(b) an increase in average temperatures(c) significantly increased rainfall(d) significantly decreased rainfall.
15. Explain why it is necessary for the Australian government to create legislation to address the problem of global warming.
UNCORRECTED PAGE P
ROOFS
diacriTech
Highlight

c07GlobalSystems Page 306 16/07/17 2:25 PM
306 Jacaranda Science Quest 10 Australian Curriculum
7.5 Heating up for Thermageddon?7.5.1 Biological implicationsWill some parts of Earth get too hot for humans? Computer models are predicting that this could happen in some parts of the tropics in the future. Some scientists have suggested that under these hot and humid conditions, even someone standing in the shade in front of a fan could die of heat stress.
Changes in the Earth’s climate due to global warming will probably affect the survival of living organisms. The survival of every living thing on Earth is dependent on the characteris-tics of its habitat, including some that will be affected by climate change. Some living things will be affected more than others.
Investigate and report16. In which industrial processes were CFCs used before they were phased out?17. Use the internet or other sources to find out how carbon capture can be used to reduce the amount of
carbon dioxide in the Earth’s atmosphere.18. There are many people who do not believe that climate change and global warming are taking place. There
are others who acknowledge that they are taking place but do not believe they are serious problems. Use the internet and other sources to list the arguments that these two groups of people use to support their beliefs.
19. There are new technologies being developed to reduce the amount of carbon dioxide produced per tonne of coal. Research the integrated gasification combined cycle (IGCC).
20. Tetrachloroethene is a solvent commonly used in the dry-cleaning industry in Australia. Not only is this chemical harmful to our health, it can also contribute to photochemical smog. Find out more about this chemical and new technologies, including ‘green dry-cleaning’, that are being developed, researched or used as alternatives.
21. Research and report on the contribution of two of the following to climate change research.• National Climate Change Adaptation Research Facility• Terrestrial Ecosystem Research Network• Department of Environment and Primary Industries• CSIRO• Greenhouse Gas Online• Climate Change Research Centre• Fisheries Research and Development Corporation• Climate Change Research Strategy for Primary Industries.
22. Use the Global warming weblink in your Resources section to find out more about what you can do in your home to reduce the amount of carbon dioxide you produce. Create a brochure to teach people how they can help slow global warming.
Explore more with this weblink: Global warming
Complete this digital doc: Worksheet 7.3: Ozone layerSearchlight ID: doc-19474
RESOURCES — ONLINE ONLY
UNCORRECTED PAGE P
ROOFS
diacriTech
Rectangle
Note to ED: Please check and advise on the content continuity of this section for accuracy.
c07GlobalSystems Page 307 16/07/17 2:25 PM
TOPIC 7 Global systems 307
7.5.2 Will climate change shape human evolution?Could Earth get too hot for humans? Is there enough variation within our species so that if things do get too hot to handle at least some of us will survive and our species will continue?
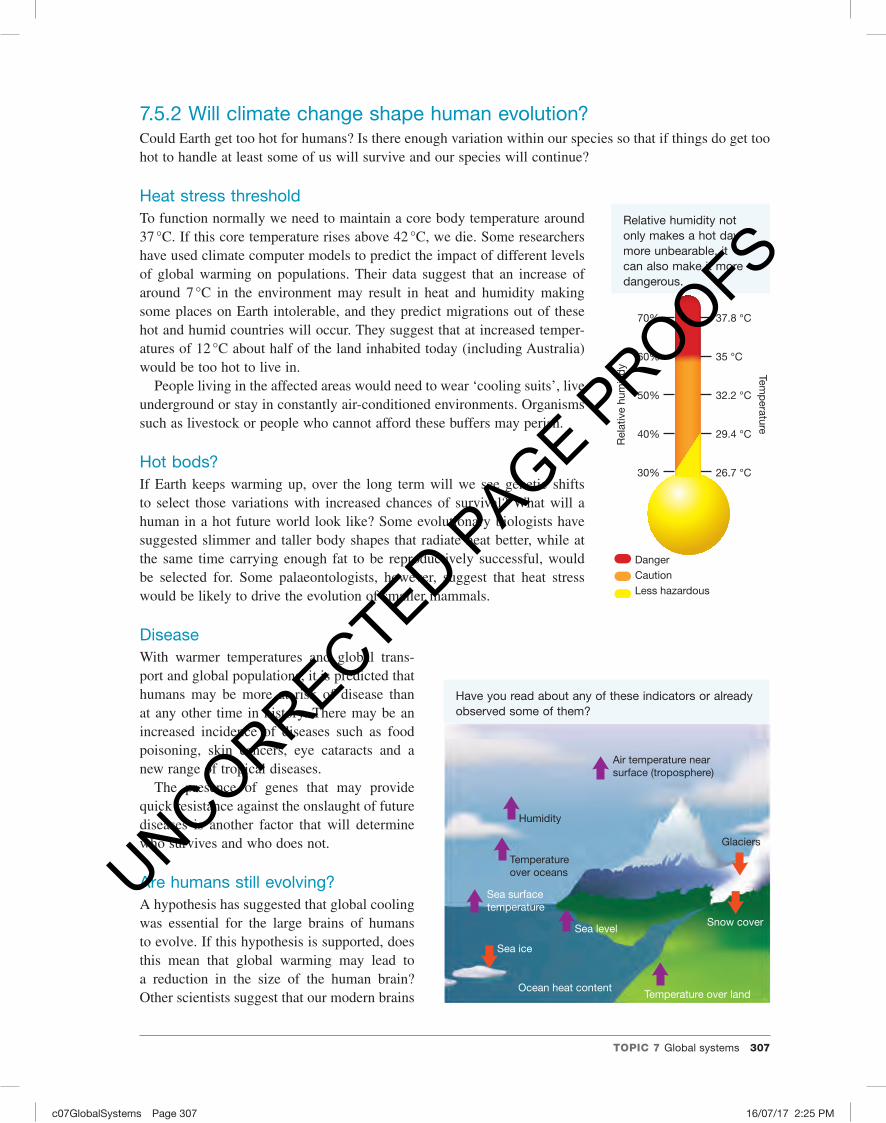
Heat stress thresholdTo function normally we need to maintain a core body temperature around 37 °C. If this core temperature rises above 42 °C, we die. Some researchers have used climate computer models to predict the impact of different levels of global warming on populations. Their data suggest that an increase of around 7 °C in the environment may result in heat and humidity making some places on Earth intolerable, and they predict migrations out of these hot and humid countries will occur. They suggest that at increased temper-atures of 12 °C about half of the land inhabited today (including Australia) would be too hot to live in.
People living in the affected areas would need to wear ‘cooling suits’, live underground or stay in constantly air-conditioned environments. Organisms such as livestock or people who cannot afford these buffers may perish.
Hot bods?If Earth keeps warming up, over the long term will we see genetic shifts to select those variations with increased chances of survival? What will a human in a hot future world look like? Some evolutionary biologists have suggested slimmer and taller body shapes that radiate heat better, while at the same time carrying enough fat to be reproductively successful, would be selected for. Some palaeontologists, however, suggest that heat stress would be likely to drive the evolution of smaller mammals.
DiseaseWith warmer temperatures and global trans-port and global populations, it is predicted that humans may be more at risk of disease than at any other time in history. There may be an increased incidence of diseases such as food poisoning, skin cancers, eye cataracts and a new range of tropical diseases.
The presence of genes that may provide quick resistance against the onslaught of future diseases is another factor that will determine who survives and who does not.
Are humans still evolving?A hypothesis has suggested that global cooling was essential for the large brains of humans to evolve. If this hypothesis is supported, does this mean that global warming may lead to a reduction in the size of the human brain? Other scientists suggest that our modern brains
Rel
ativ
e hu
miti
dy
70%
60%
50%
40%
30%
37.8 °C
35 °C
32.2 °C
29.4 °C
26.7 °C
Temp
erature
DangerCautionLess hazardous
Relative humidity not only makes a hot day more unbearable, it can also make it more dangerous.
Air temperature near surface (troposphere)
Glaciers
Snow cover
Temperature over land
Sea level
Sea ice
Ocean heat content
Sea surface temperature
Temperature over oceans
Humidity
Have you read about any of these indicators or already observed some of them?
UNCORRECTED PAGE P
ROOFS

c07GlobalSystems Page 308 16/07/17 2:25 PM
308 Jacaranda Science Quest 10 Australian Curriculum
have enabled us to develop culture and that, as long as we have culture and technology, we will have a buffer against hot climates.
Research suggests that the human brain is still evolving. Scientists have identified two genes involved in regulating brain size that have been subject to recent natural selection.
7.5.3 Climate sensitivityHow hot things get will depend on how much more carbon dioxide is pumped into the atmosphere and how much warming it produces. This is known as climate sensitivity. The Intergovernmental Panel on Climate Change (IPCC) suggests that temperatures may rise between 1.9 and 4.5 °C (around 3 °C) for every dou-bling of carbon dioxide concentration in the atmosphere. However, the IPCC’s computer model is based only on fast feedback processes and excludes slower processes such as the release of methane from thawing permafrost.
With a climate sensitivity of around 1.9 °C, it may take centuries for our planet to warm by 7 °C. With a climate sensitivity of around 4.5 °C, however, the increase could reach 7 °C within a century if we continue with our current levels of carbon dioxide production.
7.5.4 PalaeoclimatesPalaeoclimates offer a unique perspective in that they can show the wide range of climates over various time scales, and transitions between them. This information can be used to develop climate models for future climate studies. The figure below shows examples of various palaeoclimates throughout Earth’s history.
0 10 20 30 40 50
0.20
0.15
0.10
0.05
0.00
Freq
uenc
y o
f o
ccur
renc
e
Wet-bulb temperature (°C)
Earth after a rise of 12 °C
0 10 20 30 40 50
0.20
0.15
0.10
0.05
0.00
Freq
uenc
y o
f o
ccur
renc
e
Wet-bulb temperature (°C)
Earth today40
35
30
25
20
15Wet-bulbtemperature(°C)
Wet-bulbtemperature(°C)
40
35
30
25
20
15
An increase in heat and humidity due to climate change could render half the world uninhabitable. In regions where the ‘wet-bulb’ temperature (the temperature to which objects can be cooled by evaporation) exceeds 35 °C (the human heat-stress limit), it would be impossible for people to survive without some kind of cooling system.
UNCORRECTED PAGE P
ROOFS
diacriTech
Highlight

c07GlobalSystems Page 309 16/07/17 2:25 PM
TOPIC 7 Global systems 309
7.5.5 Ocean lifeSome marine life will suffer and could even become extinct because of changes in water temperature. Changing temperatures and ocean currents could separate some marine species from their food source. Some marine animals depend on microscopic plankton that float along with the currents. Others depend on species from warmer or colder layers of water than the layer in which they live. It is also possible that some species will suffer from the reduction of oxygen dissolved in ocean water because of increases in tempera-ture. The habitats of some species could be destroyed by rising sea levels.
Cretac (100 Ma)
LGM (21 ka)
Present Day (1990s)
Ord (445 Ma)
PETM (55 Ma)
LIA (1800s)
A2 (2090s)
°C Surface Air Temperature
0–4–20 4 8 12 16 20 22 24 26 28 30 32 36
P/T (250 Ma)
Will the study of palaeoclimates throughout history help us develop climate models to predict climates of the future? (Ka = thousand years ago; Ma = million years ago)
UNCORRECTED PAGE P
ROOFS

c07GlobalSystems Page 310 16/07/17 2:25 PM
310 Jacaranda Science Quest 10 Australian Curriculum
7.5.6 BiodiversityHabitats in mangrove swamps, coastal wetlands, coral reefs and other coastal areas may be reduced or lost because of rising sea levels and changed weather patterns. Plants, animals and other organisms adapted to low temperatures and high or low rainfall will have to migrate to other regions. In some cases, where migration is not possible or fails, species could become extinct.
Extinctions due to climate change are likely to add significantly to the loss of biodiversity already caused by loss of habitats due to deforestation and other human activities.
7.5 Exercises: Understanding and inquiringTo answer questions online and to receive immediate feedback and sample responses for every question, go to your learnON title at www.jacplus.com.au. Note: Question numbers may vary slightly.
Remember1. State what every living thing is dependent on.2. State the core body temperature that humans need to maintain.3. Suggest what happens if the core body temperature of a human rises above 42 °C.4. Suggest strategies that people living in areas affected by extreme heat and humidity use to survive.5. What is meant by the term climate sensitivity?6. Outline some possible effects of extreme heat and humidity on:
(a) humans(b) life in the ocean(c) biodiversity.
Think, investigate and discuss7. Find out more about palaeoclimates and related types of research that scientists are currently involved in.8. While the yields of some types of crops, such as wheat and rice, may increase in conditions where
there are higher carbon dioxide concentrations, increases in temperatures may be detrimental to other types of crops. Research and report on the effects of global warming on at least three different types of crops.
9. Research suggests that the human brain is still evolving. Scientists have identified two genes involved in regulating brain size that have been subject to recent natural selection. Research and report on recent relevant studies.
10. A warm period of time from Earth’s past was the Palaeocene-Eocene Thermal Maximum (PETM) 55 million years ago. Investigate the PETM and report on the types of life forms living at that time and how they coped with warm temperatures.
11. Some palaeontologists suggest that mammals get smaller as the climate gets warmer. Investigate this hypothesis and record your evidence for or against it with current examples.
12. The advice of some scientists is that, as evolution is a slow process, it is unlikely that any adaptation would save us from global warming in time to escape it. They suggest that the answer to surviving climate change is in our skulls. Research and report on the following.(a) Did global cooling allow humans to evolve their big brains?(b) Can we use an Earth-systems computer to investigate the hypothesis in part (a)?
13. Use the Thermageddon weblink in your Resources section to watch a video discussing the effect of increasing temperature on the human body.
14. Use the Global warming mind map weblink in your Resources section and scroll down to find the mind maps related to global warming. Then create your own mind map on the basis of what you have learned in this chapter.
Explore more with this weblink: Thermageddon
Explore more with this weblink: Global warming mind map
RESOURCES — ONLINE ONLY
UNCORRECTED PAGE P
ROOFS
diacriTech
Highlight
c07GlobalSystems Page 311 16/07/17 2:25 PM
TOPIC 7 Global systems 311
7.6 Some cool solutions7.6.1 Finding solutionsOkay, so there might be a climate change problem. What can we do to fix it?
No-one can be certain about the actual consequences of global warming. There are so many var-iables that influence climate that computer modelling cannot pro-vide completely accurate predic-tions. However, there is plenty of evidence to indicate that the levels of the greenhouse gases carbon dioxide, methane and nitrous oxide have been increasing over the past 100 years and will con-tinue to increase.
It is clear that global warming must be slowed by reducing the emission of greenhouse gases. This is no easy task and requires: • a significant reduction in our use of fossil fuels. Not only does this require a reduction in our use of elec-
tricity, natural gas and motor fuels, it also requires an increase in our use of alternative energy sources such as wind, solar and wave energy.
• It also requires the development of more energy-efficient devices to ensure that less energy is wasted. a change in our consumption of food to reduce our dependence on livestock that release methane and nitrous oxide into the atmosphere. We may have to eat less meat and more locally grown fruit and vegetables.
• the recycling of products such as glass, paper, metals and plastic that require the burning of fossil fuels for their production and distribution.
7.6.2 GeosequestrationGeosequestration is a process that involves separating carbon dioxide from other flue gases in fossil fuel power stations, compressing it and piping it to a suitable site. There are at least 65 suitable sites (e.g. depleted oil and gas wells) that have been identified in Australia that are capable of taking up to 115 mil-lion tonnes of carbon dioxide each year.
Research on this process dates back to the 1970s. Although there are considerable problems with the technology, there is renewed interest in further developing it. It is hoped that it may be used to remove carbon dioxide from the atmosphere and hence reduce global warming.
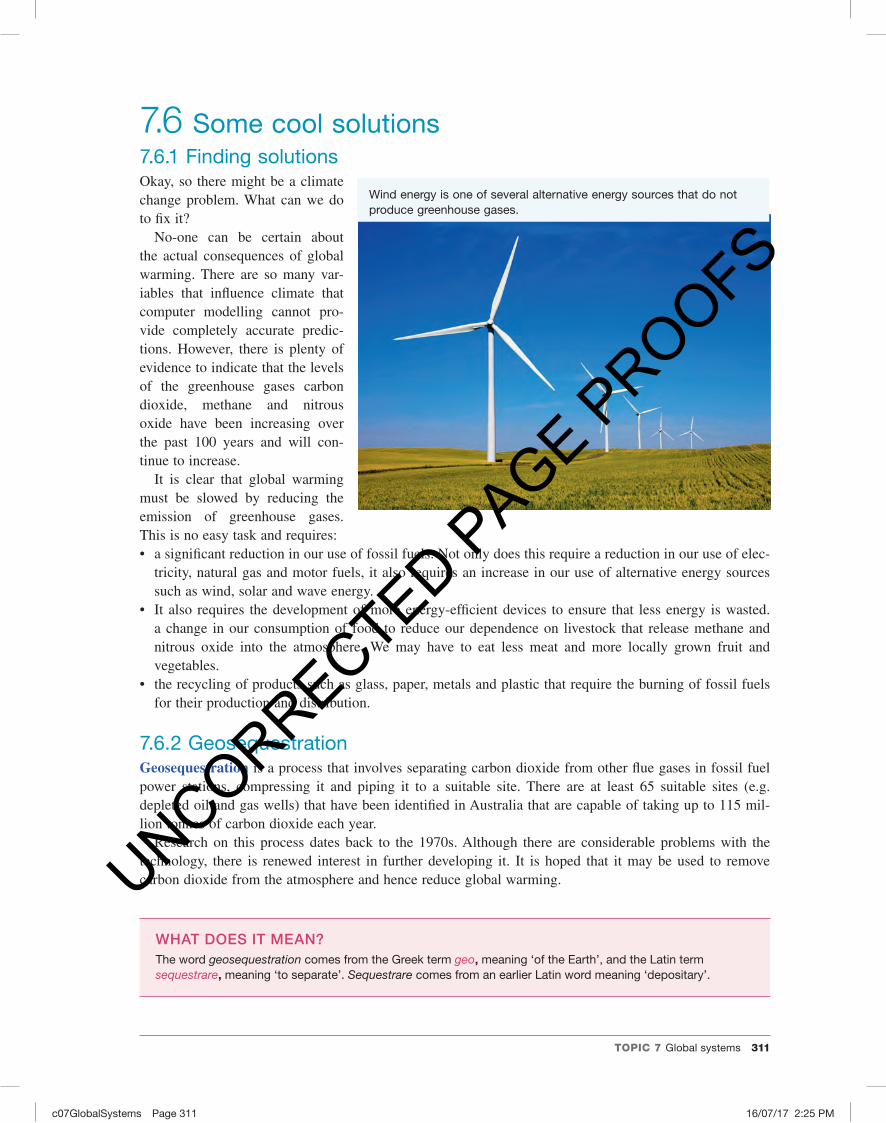
Wind energy is one of several alternative energy sources that do not produce greenhouse gases.
WHAT DOES IT MEAN?The word geosequestration comes from the Greek term geo, meaning ‘of the Earth’, and the Latin term sequestrare, meaning ‘to separate’. Sequestrare comes from an earlier Latin word meaning ‘depositary’.
UNCORRECTED PAGE P
ROOFS
c07GlobalSystems Page 312 16/07/17 2:25 PM
312 Jacaranda Science Quest 10 Australian Curriculum
7.6.3 To chop or not to chop?We live in a consumer society. The things that we want and need often require large amounts of energy to manufacture and consequently result in the emission of carbon dioxide into the atmosphere. Scientists in the forestry and related industries have suggested that one way to reduce carbon dioxide emissions is to produce and use wood products that have been grown under sustainable forest management strategies. Nick Roberts, Forests NSW chief executive, is passionate about the role that sustainably harvested native forests can play in combating climate change. The view that wood products produced under this sustainable management have the potential to maintain or increase forest carbon stocks is also supported by the IPCC.
In 2009, Fabiano Ximenes, a forest research scientist, and his col-leagues from the NSW Department of Primary Industries (DPI) ana-lysed the carbon content of paper and wood products in landfill and found that at least 82 per cent of the carbon originally in the sawn timber remained stored in the wood. This research suggested that wood products could act as a carbon ‘sink’, not only during use, but even after disposal.
7.6.4 Earth’s nine livesIs it time to Think about our relationship with our environment in a new way? Researchers at the Stockholm Environment Institute in Sweden have identified nine planetary life-support systems that pro-vide planetary boundaries that they argue should be adhered to in order to live sustainably. These are: • rate of biodiversity loss • climate change • nitrogen and phosphorus cycles • stratospheric ozone depletion • atmospheric aerosol loading • chemical pollution • ocean acidification • fresh-water use • change in land use.
7.6.5 MetagenomicsAustralian agriculture accounts for about 16 per cent of our national greenhouse emissions. Sixty-seven per cent of this is methane emissions from livestock. CSIRO Livestock Industries (CLI) is excited about its research that aims to characterise the microbiome (assortment of microbes in the foregut) of Australian marsupials such as the Tammar wallaby (Macropus eugenii). One project involves metagenomics, a tech-nology that combines DNA sequencing with molecular and computational biology. This technology is being used by the scientists to study methanogens — bacteria that are involved in breaking down plant fibre in the wallaby’s gut. While these bacteria produce methane, the levels are a lot lower than those produced by cows and sheep. CSIRO’s research may lead to discoveries about why marsupials produce far fewer greenhouse emissions that cows and sheep, and contribute to new biotechnologies that may help us to reduce agricultural greenhouse emissions.
Nick Roberts, CEO, Forests NSW
Fabiano Ximenes, Research Officer— Life Cycle Assessment, DPI
UNCORRECTED PAGE P
ROOFS

c07GlobalSystems Page 313 16/07/17 2:25 PM
TOPIC 7 Global systems 313
7.6.6 The Kyoto ProtocolIn 1997, at a meeting in the city of Kyoto, Japan, most of the world leaders signed a document known as the Kyoto Protocol. The document was a historic agreement to reduce the amount of greenhouse gases produced by industrialised nations. It set targets for reduction of greenhouse gas production up to the year 2012. The targets varied from nation to nation according to a number of factors, including the nation’s stage of industrial development. For example, the target for the United States was a reduction of 7 per cent from 1990 levels. For Japan and Canada it was a reduction of 6 per cent. For the Russian Federation and New Zealand it was 0 per cent.
However, a signature on the Kyoto Protocol was only an agreement in principle and was not legally binding. The agree-ment could not come into force until countries producing more than 55 per cent of the world’s greenhouse gases confirmed their commitment by ratifying the agreement, thus formally agreeing to the targets set. This took until February 2005. Australia did not ratify the Kyoto Protocol until 2007. The United States refused to ratify it.
The signing of the Kyoto Protocol marked the beginning of ongoing cooperation between most of the world’s nations to reduce emissions of carbon dioxide and other greenhouse gases and slow down global warming. Regular conferences are held with the sup-port of the United Nations to monitor progress and review targets.
Tammar wallaby
A sustainable plantation forest of eucalypt trees
7.6.7 HOW ABOUT THAT!Do you use a computer often? Have you ever wondered where all the data you can access through the internet is actually kept? The answer is: on a computer server. Many schools have their own server and most students are allocated a certain amount of storage space on it. The problem is that all these servers need to be kept cool to operate correctly. Servers produce heat and keeping them cool requires a lot of electricity. Much of the electricity needed is produced using fossil fuels, so this contributes to global warming. It has been estimated that, worldwide, computer servers contribute as much as the aviation industry to global warming. One solution is to use less energy in data storage and make efficient use of energy in the IT industry.
7.6 Exercises: Understanding and inquiringTo answer questions online and to receive immediate feedback and sample responses for every question, go to your learnON title at www.jacplus.com.au. Note: Question numbers may vary slightly.
Remember1. Suggest why no-one can be certain about the actual consequences of global warming.2. If we can’t be certain about the consequences of global warming, why bother about it?3. Suggest three things that can be done to reduce the emission of greenhouse gases.4. What is geosequestration and why is it important?5. Suggest how manufacturing and using wooden products that have been produced using sustainable
management may help fight global warming.6. List the nine planetary boundaries that promote sustainable lifestyles that have been suggested by the
Stockholm Environment Institute in Sweden.
UNCORRECTED PAGE P
ROOFS
diacriTech
Highlight
ED: We included head number as per learnon, please check and confirm

c07GlobalSystems Page 314 16/07/17 2:25 PM
314 Jacaranda Science Quest 10 Australian Curriculum
7.7 Global warming — believe it or not?7.7.1 Global warming is a hot topicAs the physicist Niels Bohr reportedly said, ‘Prediction is very difficult, especially of the future.’
While most scientists agree that an increase in the amount of carbon dioxide in the atmosphere is the main cause of global warming, they argue about the details of the cause and about the effects of global warming. The key arguments that scientists are involved in investigating and discussing can be divided into three categories:1. Are humans responsible for global warming?2. What will the effects of global warming be?3. What can be done to stop global warming?
7.7.2 Climate scienceClimate scientists are trying to find evidence against the hypothesis that global warming is caused mainly by humans dumping greenhouse gases into the atmosphere. That is, they are considering that the hypoth-esis may be wrong and are assessing other ways in which this warming may be occurring. Over the last 40 years, however, no evidence against the hypothesis has been found.
A difficulty for climate scientists is not just about predicting how the climate will change, but also in estimating the level of uncertainty within the prediction.
7.7.3 Climate science and policyGlobal warming is a thorny problem. There are also clashes over climate science and policy. While some refer to this as the climate debate, to those deeply immersed in it, it may feel more like an ugly war. It has included frontline battles between science and opinion, politics, media and human psychology. There has been scepticism, outright denial, disrespect and even name-calling!
An Australian newspaper reported that, in one country, scientists trying to present evidence for human involvement in climate change were accused of holding elitist, arrogant views. The media has also reported that even in our own country some leading scientists have felt ignored and excluded from contributing to the development of key climate policies and discussions.
7.7.4 Alternative theoriesAlternative theories about climate change have been developed. Climate change sceptics, for example, believe that humans are not to blame for rising global temperatures and that what is being experienced is merely part of a natural cycle.
7. What is metagenomics?8. Explain why CSIRO scientists are studying Tammar wallabies in their research related to global warming.9. What is the Kyoto Protocol and why is it important?
Investigate, think and discuss10. Explain why it is necessary for the Australian government to create legislation to address the problem of
global warming.11. Use the Planetary boundaries weblink in your Resources section to find out more about Johan Rockstrom’s
contributions to science, including the concept of planetary boundaries.
Explore more with this weblink: Planetary boundaries
RESOURCES — ONLINE ONLY
UNCORRECTED PAGE P
ROOFS
c07GlobalSystems Page 315 16/07/17 2:25 PM
TOPIC 7 Global systems 315
7.7 Exercises: Understanding and inquiring To answer questions online and to receive immediate feedback and sample responses for every question, go to your learnON title at www.jacplus.com.au . Note: Question numbers may vary slightly.
Investigate, think and discuss 1. In 2010, the IPCC concluded that the increase in the Earth’s surface temperature during the second half
of the twentieth century needed to be simulated by models that included anthropogenic forcing as well as natural factors. Find out more about anthropogenic forcing and why the IPCC argues that it should be considered in the climate models. Do you agree with the IPCC? Justify your response.
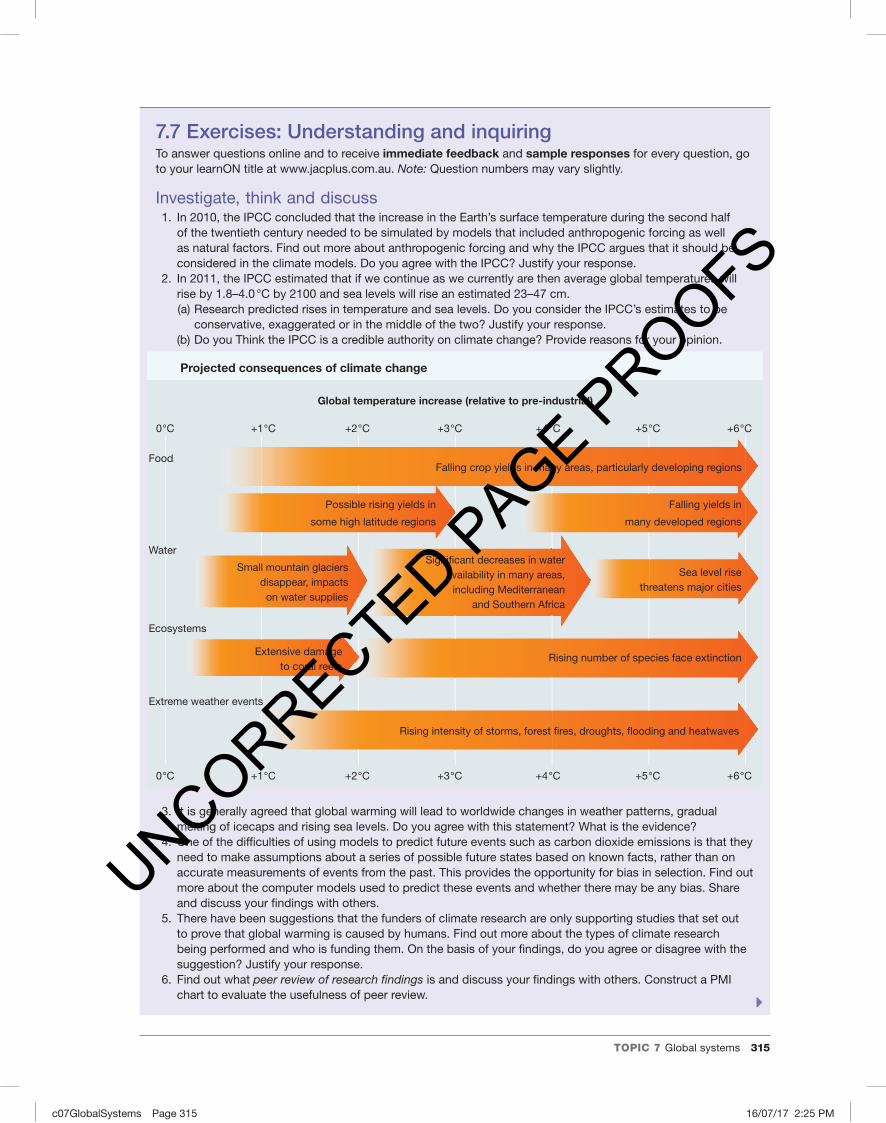
2. In 2011, the IPCC estimated that if we continue as we currently are then average global temperatures will rise by 1.8–4.0 °C by 2100 and sea levels will rise an estimated 23–47 cm. (a) Research predicted rises in temperature and sea levels. Do you consider the IPCC’s estimates to be
conservative, exaggerated or in the middle of the two? Justify your response. (b) Do you Think the IPCC is a credible authority on climate change? Provide reasons for your opinion.
3. It is generally agreed that global warming will lead to worldwide changes in weather patterns, gradual melting of icecaps and rising sea levels. Do you agree with this statement? What is the evidence?
4. One of the diffi culties of using models to predict future events such as carbon dioxide emissions is that they need to make assumptions about a series of possible future states based on known facts, rather than on accurate measurements of events from the past. This provides the opportunity for bias in selection. Find out more about the computer models used to predict these events and whether there may be any bias. Share and discuss your fi ndings with others.
5. There have been suggestions that the funders of climate research are only supporting studies that set out to prove that global warming is caused by humans. Find out more about the types of climate research being performed and who is funding them. On the basis of your fi ndings, do you agree or disagree with the suggestion? Justify your response.
6. Find out what peer review of research fi ndings is and discuss your fi ndings with others. Construct a PMI chart to evaluate the usefulness of peer review.
Global temperature increase (relative to pre-industrial)
0°C
FoodFalling crop yields in many areas, particularly developing regions
Possible rising yields in
some high latitude regions
Falling yields in
many developed regions
Water
Small mountain glaciersdisappear, impacts
on water supplies
Signi�cant decreases in wateravailability in many areas,
including Mediterraneanand Southern Africa
Sea level risethreatens major cities
Ecosystems
Rising number of species face extinctionExtensive damage
to coral reefs
Extreme weather events
Rising intensity of storms, forest �res, droughts, �ooding and heatwaves
+1°C +2°C +3°C +4°C +5°C +6°C
0°C +1°C +2°C +3°C +4°C +5°C +6°C
Projected consequences of climate change
UNCORRECTED PAGE P
ROOFS

c07GlobalSystems Page 316 16/07/17 2:25 PM
316 Jacaranda Science Quest 10 Australian Curriculum
7. Find out more about these court cases for and against a greener world.• Kivalina vs ExxonMobil• Comer vs Murphy Oil• Texas vs Environmental Protection Agency (EPA)• Connecticut vs American Electric Power (AEP)
8. Distinguish between environmentalist and environmental scientist. Make a list of the types of comments that each may have about global warming or climate change.
9. There have been suggestions that belief is frequently obscuring fact in regard to the climate change issues.(a) Discuss with others the difference
between belief and fact.(b) Suggest criteria that could be used for
each of these terms that would enable them to be identified in articles written about climate change.
(c) Using your criteria for these terms and internet research, find examples of beliefs and facts in climate change articles.
(d) Share your examples with others in the class.
(e) As a class, decide on a specific statement or issue that could be used in a class debate.(f) Write a presentation that could be used in a debate on climate change. Include a variety of beliefs and
facts in your arguments.(g) Conduct a class debate on the topic decided on in part (e). Each member of the class is to have a green
and a red card. During the debate, when a belief statement or argument is made students are to hold up a red card, and when a fact statement or argument is made they are to hold up a green card.
(h) Reflect on your experiences regarding the debate and share your reflection with others.
10. Climate change is a natural event and not caused by human activity.(a) Research information related to this statement.(b) Using a table like the one shown below, and criteria
that you have discussed with others and agreed on, evaluate each reference you use for:• authority/reputable source• bias• validity/accuracy.
(c) Organise your material into a PMI chart or SWOT analysis.
(d) Organise a class debate on the statement.
SWOT analysis
Strengths Weaknesses
Opportunities ThreatsHeadingor topic
Minus
••••••
••••••
••••••
Topic/theme/idea
Reference title,
author, date Plus Minus Interesting
Other comments
Reputable? (0 = not
reputable, 3 = very
reputable)
Bias? (0 = very biased,
3 = no bias)
Accuracy/validity? (0 = not accurate or valid, 3 = very accurate
and valid)
0 1 2 3 0 1 2 3 0 1 2 3
UNCORRECTED PAGE P
ROOFS

c07GlobalSystems Page 317 16/07/17 2:25 PM
TOPIC 7 Global systems 317
7.8 Ozone alert! 7.8.1 What’s the problem? What’s the problem with a hole in the sky?
About 90 per cent of the ozone in the atmos-phere lies in the stratosphere, which extends from about 10 kilometres to 50 kilometres above the Earth’s surface, where it blocks out more than 95 per cent of the ultraviolet (UV) rays entering the atmosphere.
During the 1980s it was discovered that the amount of ozone (O 3 ) in the upper atmosphere was decreasing rapidly. Any decrease in the amount of ozone in the ozone layer is damaging to all living things as they are adapted to being protected from ultraviolet radiation by ozone. For humans, the damage is in the form of sun-burn and skin cancer.
7.8.2 What’s the cause? The main cause of the rapid depletion of ozone in the stratosphere is the emission of chlorine and bromine compounds, particularly chloro-fl uorocarbons (CFCs), which were once used widely in aerosol spray cans, refrigerators and air conditioners.
In the stratosphere, bonds in CFC molecules are broken and free chlorine atoms are released. These chlo-rine atoms are involved in reactions that destroy ozone. They are then released back into the atmosphere where they continue to be involved in ozone destruction.
11. Professor Michael Raupach is an atmospheric scientist who is co-chairman of the Australian Academy of Science’s climate change working group. In 2011, he made the comment: ‘There is an enormous difference between a scientifi c proposition, for which truth is decided on the basis of empirical evidence, and a political proposition, which is adopted or fails depending on the strength of people’s convictions. Both of these forms of truth are important in our society, but we’re in a lot of trouble if we mix them up — unlike human law, the laws of nature can be read, but not redrafted.’ (a) Find out what each of the following terms mean and give an example that could be used to demonstrate
it: scientifi c proposition, political proposition, empirical evidence, conviction (not in the criminal sense), truth, human law, law of nature, redrafted.
(b) In a group, re-read Raupach’s statement and discuss its meaning and how it could be rephrased into the language of a Year 10 student.
(c) Share your rephrased statement with others. (d) Do you agree with Raupach’s statement? Justify your response.
Complete this digital doc: Worksheet 7.4: Global warmingSearchlight ID: doc-19474
RESOURCES — ONLINE ONLY
0 100 200 300 400 500 600 700
Total ozone (Dobson units)
This image shows how large the hole in the ozone layer can be.
UNCORRECTED PAGE P
ROOFS
c07GlobalSystems Page 318 16/07/17 2:25 PM
318 Jacaranda Science Quest 10 Australian Curriculum
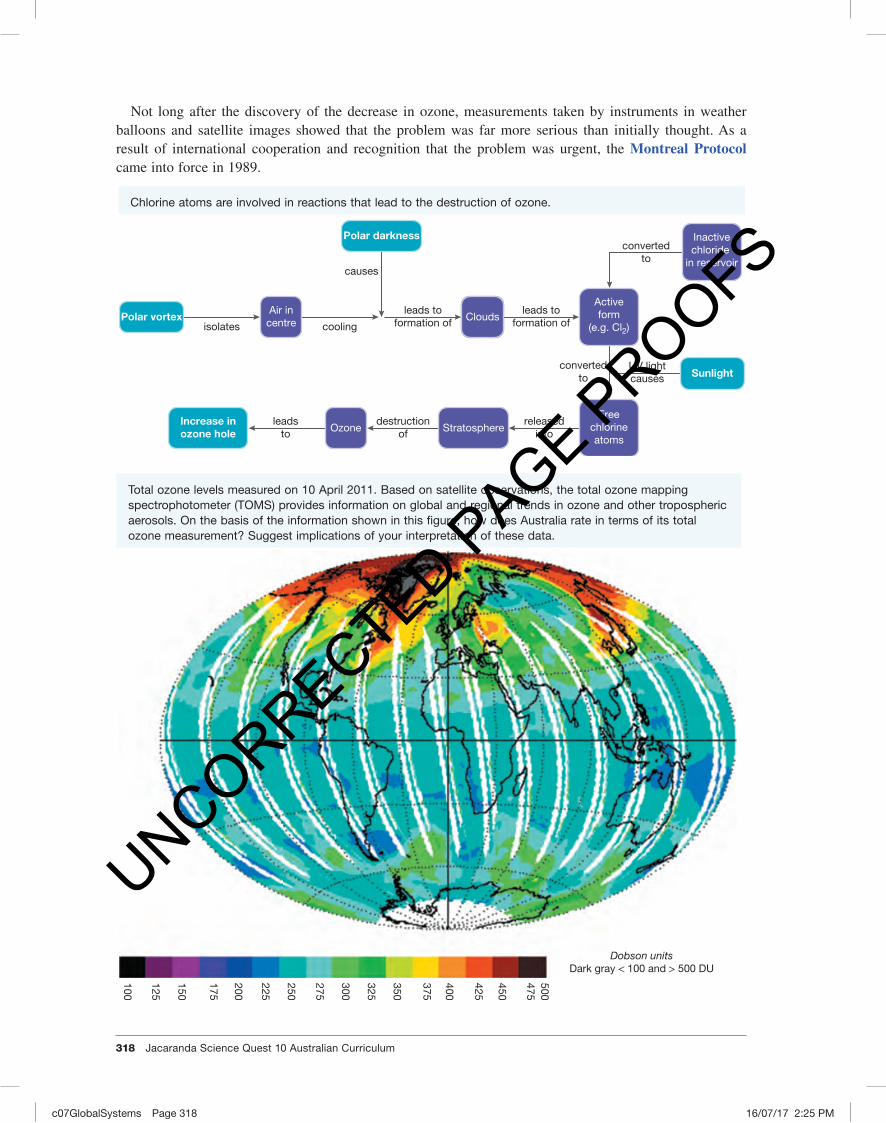
Not long after the discovery of the decrease in ozone, measurements taken by instruments in weather balloons and satellite images showed that the problem was far more serious than initially thought. As a result of international cooperation and recognition that the problem was urgent, the Montreal Protocol came into force in 1989.
isolates cooling
causes
leads toformation of
leads toformation of
destructionof
leadsto
releasedinto
UV lightcauses
convertedto
convertedto
Increase inozone hole
Polar vortex
Polar darkness
Activeform
(e.g. Cl2)
Freechlorineatoms
Air incentre Clouds
Ozone Stratosphere
Sunlight
Inactivechloride
in reservoir
Chlorine atoms are involved in reactions that lead to the destruction of ozone.
Dobson unitsDark gray < 100 and > 500 DU
500475
450
425
400
375
350
325
300
275
250
225
200
175
150
125
100
Total ozone levels measured on 10 April 2011. Based on satellite observations, the total ozone mapping spectrophotometer (TOMS) provides information on global and regional trends in ozone and other tropospheric aerosols. On the basis of the information shown in this figure, how does Australia rate in terms of its total ozone measurement? Suggest implications of your interpretation of these data.
UNCORRECTED PAGE P
ROOFS

c07GlobalSystems Page 319 16/07/17 2:25 PM
TOPIC 7 Global systems 319
7.8.3 Ozone friendlyThroughout most of the world CFCs have been phased out and replaced in many cases with hydrochlorofluorocarbons (HCFCs), which deplete ozone to a lesser extent than CFCs but which are also greenhouse gases. These in turn are now being replaced by less harmful chemicals and new technology. The depletion of the ozone layer has already slowed, and if governments throughout the world continue to honour their agreements to phase out the use of chemicals that threaten the ozone layer, life on Earth will continue to be ade-quately protected from ultraviolet radiation.
The figure at right shows an image from the Total Ozone Mapping Spectrometer (TOMS). These data are based on satellite observations that monitor global and regional trends in ozone and other tropospheric aerosols. The Dobson unit (DU) is a measure of total ozone. In the figure the darker reddish colours indicate a higher ozone concentra-tion than the blue and purple colours.
Tota
l mea
n o
zone
leve
ls (D
U)*
100
150
200
250
300
350
1950 1960 1970 1980 1990 2000 2010
Year
*Dobson units over Halley Bay, Antarctica October.
Trend line
The ozone layer has been significantly depleted since the 1970s.
Colour-coded image of the sea surface temperature as revealed by an AVHRR (Advanced Very High Resolution Radiometer) carried on a satellite. Red represents the hottest and purple the coolest sea surface temperature.
UNCORRECTED PAGE P
ROOFS

c07GlobalSystems Page 320 16/07/17 2:25 PM
320 Jacaranda Science Quest 10 Australian Curriculum
7.8.4 Eyes in spaceThere are a number of other satellites that are gath-ering data on Earth’s biosphere from a distance. This type of data collection is called remote sensing. The satellite Terra, for example, has a number of different instruments that gather different types of data on how Earth is changing in response to both natural changes and those caused by humans. Scientists from different fields are also working together on collaborative pro-jects that use data from remote-sensing observations to improve forecasting systems such as those that warn of future floods.
Terra, the flagship satellite of the Earth Observing System. Specialised instruments carried by Terra collect data on the land, oceans and atmosphere of our planet that will provide a record of changes over time.
7.8 Exercises: Understanding and inquiringTo answer questions online and to receive immediate feedback and sample responses for every question, go to your learnON title at www.jacplus.com.au. Note: Question numbers may vary slightly.
Remember1. In which part of the biosphere would you find the most ozone?2. Outline why the ozone layer is important to life on Earth.3. (a) Which types of chemicals are likely to cause a depletion in the ozone layer?
(b) Construct a flowchart to show how these chemicals are involved in ozone destruction.4. Suggest why the depletion of the ozone layer has slowed.
Analyse, think and discuss5. (a) What does TOMS stand for? (b) How does TOMS get its data? (c) What is a Dobson unit? (d) Carefully observe the NASA TOMS figure and:
(i) describe patterns of ozone coverage(ii) interpret the patterns of ozone coverage(iii) state the Dobson unit range for Australia(iv) interpret Australia’s ozone pattern in terms
of how effectively we may be protected against harmful UV rays.
6. The figure at right shows variations in the annual record of the hole in the ozone layer since 1979. In a group, carefully observe any patterns and discuss possible interpretations.
7. Use the graphs on next page to answer the following.(a) Describe the patterns observed in the graphs.(b) Interpret the information in the graphs.(c) In which part of the biosphere is the ozone
layer located?
1979: 0
2010: 192006: 26
Average (7 Sep – 13 Oct) ozone hole area (millions of km2)
1979: 225
2010: 127
1980 1990 2000 2010
1994: 92
Average (21 Sep – 16 Oct) minimum ozone (Dobson units)
Note: No data were acquired during the 1995 season.
UNCORRECTED PAGE P
ROOFS

c07GlobalSystems Page 321 16/07/17 2:25 PM
TOPIC 7 Global systems 321
7.9 Biodiversity and climate change7.9.1 Natural climate changeWhen the first traces of life appeared on Earth about 3500 million years ago, the climate was hostile. Lightning bolts blasted through a warm atmosphere of hydrogen, methane, ammonia, water vapour and carbon dioxide. There was no oxygen until the first living organisms produced it through photosynthesis. Since then, the composition of gases in the Earth’s atmosphere and its temperature have been constantly changing.
7.9.2 BiodiversityThe evolution of life forms on Earth has occurred because some organisms are better suited to a particular environment than others. For some to be better suited than others, there needs to be variation or diversity.
8. (a) Explain why there is concern about the thinning of the ozone layer.
(b) List examples of three sources of CFCs.(c) Outline how CFCs contribute to the development
of the ozone hole.(d) Explain why temperature and the amount of
sunlight influences the depth and size of the ozone hole.
Investigate, think, discuss and report9. Use the Sustainable Cities Index weblink in your
Resources section to view the index developed by the Australian Conservation Foundation (ACF). This index is based on a range of environmental, social and economic issues. It provides a snapshot of the performance of 20 of our largest cities and ranks them on their sustainability.(a) Select the city closest to where you live. How did
it rate in this index? Do you agree with the ACF’s findings? Justify your response. Suggest ways in which your city’s score could be improved.
(b) Select one of the criteria used and find out more about the method used to collect the data.(c) Which of the 20 Australian cities scored as our most sustainable city? For which criterion did it score the
highest? Suggest reasons for its high score.(d) Which city scored the lowest? Suggest reasons for its low score and what it could do to increase its
score in the future.10. Various satellites and data collection instruments are used to measure changes in our environment.
Research and report on at least two from each group.(a) OMI, TOMS, GOME, NOAA SBUV/2, MLS, Balloon Sondes(b) MODIS, MISR, MOPITT, CERES, ASTES
25 Sep: 22
1 Oct: 118
20 Jul: 180
1 Jul: 183
1 Jul: 233
1 Jul: 0Ozone hole area (millions of km2)
Minimum ozone (Dobson units)
Minimum stratosphere temperature (K)
31 Dec: 212
31 Dec: 234
31 Dec: 0
July Aug Sep Oct Nov Dec
Watch this eLesson: Global warming in AustraliaLearn why many scientists believe the Earth is getting hotter and how Australia is addressing this global problem.Searchlight ID: else-0057
Explore more with this weblink: Sustainable Cities Index
RESOURCES — ONLINE ONLY
UNCORRECTED PAGE P
ROOFS

c07GlobalSystems Page 322 16/07/17 2:25 PM
322 Jacaranda Science Quest 10 Australian Curriculum
In a global sense, biodiversity refers to the total variety of living things on Earth, their genes and the ecosystems in which they live. Biodiver-sity (or biological diversity) exists at the gene, species and ecosystem level.
7.9.3 Genetic diversityGenetic diversity can be considered in terms of variation within the genes (alleles), which are made up of DNA. Genetic variation is impor-tant for the long-term survival of a species as it increases the chance that at least one of the variations will enable some of the population to survive to reproduce the next generation.
7.9.4 Diversity in DNAEach individual contains their own combination of genetic material in the form of DNA. This information is organised into coding and non-coding regions. The coding regions, called genes, contain genetic infor-mation for the synthesis of proteins that contribute to the expression of particular features or traits.
7.9.5 Diversity in allelesIndividuals within a species share the same genes that code (with an environmental influence) for a par-ticular feature or characteristic. However, there can be alternative forms of these genes within the individ-uals. Alternative forms of genes are called alleles. For example, an individual within a species may have a gene for beak shape. The alleles for beak shape may code for hooked or straight shape. So, some individ-uals may contain the alleles for hook-shaped beaks, some the alleles for straight-shaped beaks and others the alleles for each type.
The particular combination of alleles for a particular trait (or phenotype) within an individual is called the genotype. For example, if the allele for the hooked beaks is given the symbol H and the allele for the straight beaks is given the symbol h, then an individual could have a genotype of HH or Hh or hh.
7.9.6 Species diversitySpecies diversity can be considered in terms of diversity in populations. While the combination of alleles for a trait within an individual is called a genotype, the combination of all the alleles within a group of individ-uals of the same species living in a particular place at a particular time (population) is called a gene pool.
All environments change over time. It is the diversity (or variation) of the alleles within the gene pool that contributes to the number of possible combinations that could be used to produce the next genera-tion. Increased variety in the expression of these alleles as phenotypes (traits) of the offspring means an increased chance that some of these offspring will be able to survive in the environment in which they are born and will live — even if that environment changes.
If there is little variation in the gene pool, there is less chance of the offspring being able to survive possible changes in their environment such as climate and the availability of habitat, food, mates or other resources. The consequences of this limited diversity within the population may lead to the extinction of the species.
7.9.7 Ecological diversityEcological diversity can be considered in terms of the diversity in ecosystems. The extinction of a par-ticular species within an ecosystem may affect the survival of other species within that ecosystem. The extinct species’ disappearance will have consequences for the food supplies of others within its food web. Unless there are other species that can take its place without having a negative effect on others, the survival of other species may be threatened.
Earth was a hostile place 3500 million years ago. Fossils provide evidence of structures called stromatolites. They existed in warm sea water and consisted of cyanobacteria, one of the earliest forms of life.
UNCORRECTED PAGE P
ROOFS

c07GlobalSystems Page 323 16/07/17 2:25 PM
TOPIC 7 Global systems 323
Increased biodiversity within ecosystems can reduce the consequences of losing a species to which the survival of others is linked. Likewise, reduced biodiversity in these ecosystems can lead to the extinction of other species.
7.9.8 Australia’s biodiversityBiodiversity within Australian ecosystems is influenced by both biotic factors and abiotic factors. Abiotic factors, including those that contribute to climate, such as temperature and annual rainfall, can affect the abundance, distribution and types of species within a particular ecosystem. Organisms have particular tol-erance ranges for abiotic factors, outside of which they cannot survive.
If global warming results in the development of climatic conditions that are outside a species’ tolerance range, and if they are unable to migrate or adapt to the new conditions, then there is a threat that the spe-cies may become extinct. Species that are most at risk are those that have low genetic variability, long life cycles and low fertility, a narrow range of physiological tolerance and geographic range, and specialist resource requirements.
7.9.9 Global warming and Australia’s biodiversityChanges in Australia’s biodiversity that may be due to climate change include changes in species’ ranges and migration patterns, shifts in genetic composition of some species that have short life cycles, and changes in lifestyle and reproduction rates.
Many plants and their pollinators have coevolved. Studies have suggested that climate change has upset the life cycles of pollinators (such as bees). Other studies suggest that climate change is causing the flow-ering times of some plants to be out of synchronisation with their pollinators. With fewer plants being pol-linated, fewer are bearing fruit containing seeds essential to produce the next generation of plants.
7.9.10 Preparing to adapt to unavoidable climate changeThe National Climate Change Adaptation Research Facility (NCCARF) has identified eight priority areas for adaptation research. These are terrestrial biodiversity; primary industries; water resources and fresh-water biodiversity; marine biodiversity and resources; human health; cities and infrastructure; emergency management; and social and economic issues.
7.9.11 Mass extinctionsMany scientists believe that we are currently experiencing the sixth mass extinction. Five other mass extinctions have occurred as a result of global climate change. Some argue that humans are responsible for the current mass extinc-tion. The International Union for Conservation of Nature has reported that species are dying out 1000 to 10 000 times faster than they would without human intervention.
Those with the view that humans are to blame divide this sixth extinction into two phases. The first phase began about 100 000 years ago when the first modern humans began to spread throughout the world. The second phase began when humans started to use agriculture around 10 000 years ago.
20 LateOrdovician
LateDevonian
Palaeozoic Mesozoic
Permian–Triassic
LateTriassic
Cretaceous–Tertiary
15
10
5
0Ext
inct
ion
rate
(fam
ilies
per
mill
ion
year
s)
There have been five mass extinctions in the past — are we currently experiencing a sixth and, if so, is it caused by humans?
UNCORRECTED PAGE P
ROOFS
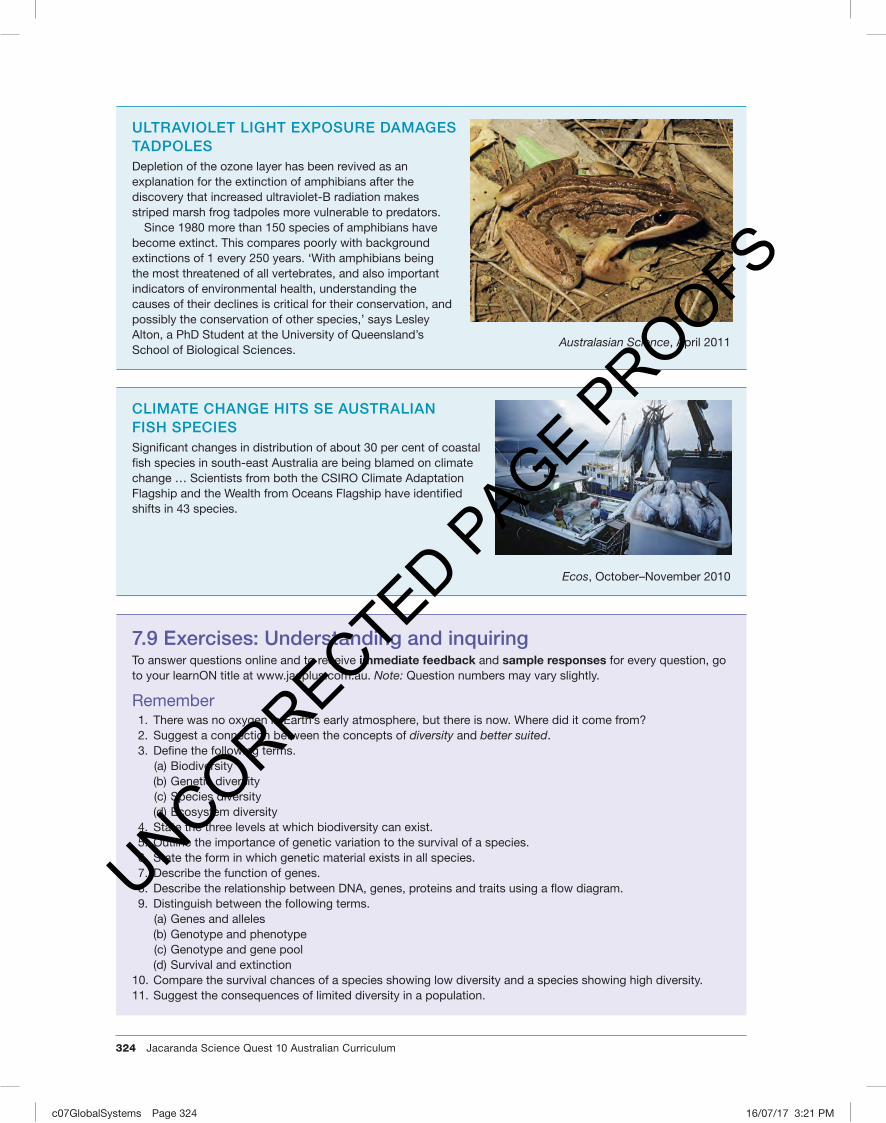
c07GlobalSystems Page 324 16/07/17 3:21 PM
324 Jacaranda Science Quest 10 Australian Curriculum
ULTRAVIOLET LIGHT EXPOSURE DAMAGES TADPOLESDepletion of the ozone layer has been revived as an explanation for the extinction of amphibians after the discovery that increased ultraviolet-B radiation makes striped marsh frog tadpoles more vulnerable to predators.
Since 1980 more than 150 species of amphibians have become extinct. This compares poorly with background extinctions of 1 every 250 years. ‘With amphibians being the most threatened of all vertebrates, and also important indicators of environmental health, understanding the causes of their declines is critical for their conservation, and possibly the conservation of other species,’ says Lesley Alton, a PhD Student at the University of Queensland’sSchool of Biological Sciences.
CLIMATE CHANGE HITS SE AUSTRALIAN FISH SPECIESSignificant changes in distribution of about 30 per cent of coastal fish species in south-east Australia are being blamed on climate change … Scientists from both the CSIRO Climate Adaptation Flagship and the Wealth from Oceans Flagship have identified shifts in 43 species.
Ecos, October–November 2010
7.9 Exercises: Understanding and inquiringTo answer questions online and to receive immediate feedback and sample responses for every question, go to your learnON title at www.jacplus.com.au. Note: Question numbers may vary slightly.
Remember1. There was no oxygen in Earth’s early atmosphere, but there is now. Where did it come from?2. Suggest a connection between the concepts of diversity and better suited.3. Define the following terms.
(a) Biodiversity(b) Genetic diversity(c) Species diversity(d) Ecosystem diversity
4. State the three levels at which biodiversity can exist.5. Outline the importance of genetic variation to the survival of a species.6. State the form in which genetic material exists in all species.7. Describe the function of genes.8. Describe the relationship between DNA, genes, proteins and traits using a flow diagram.9. Distinguish between the following terms.
(a) Genes and alleles(b) Genotype and phenotype(c) Genotype and gene pool(d) Survival and extinction
10. Compare the survival chances of a species showing low diversity and a species showing high diversity.11. Suggest the consequences of limited diversity in a population.
Australasian Science, April 2011
UNCORRECTED PAGE P
ROOFS
c07GlobalSystems Page 325 16/07/17 2:25 PM
TOPIC 7 Global systems 325
12. Suggest how diversity within an ecosystem may increase the survival chances of species within it.13. State examples of abiotic factors that can affect the survival of an organism.14. Define the term tolerance range and suggest an example.15. Suggest a connection between global warming and changed abiotic factors within ecosystems.16. State the features of species that would be most at risk of extinction in changing climatic conditions such
as global warming.17. Suggest changes in Australia’s biodiversity that may be due to climate change.18. Suggest a connection between reduced pollination of some types of plants and climate change.19. List the eight priority areas identified by NCCARF for adaptation research.20. Outline the two phases of human contribution to the sixth mass extinction.
Investigate, think and discuss21. Are you concerned about the arrival of the Earth’s sixth mass extinction? One survey asked people to
respond to this question by choosing ‘Yes’, ‘No’ or ‘Sort of but I won’t see the effects in my lifetime’. How would you have responded? Justify your response.
22. Do living organisms always have a negative effect on their environment? Justify your response and include a supporting example.
23. Suggest ways in which organisms could be better suited to survive in a particular enviroment than others.24. Research and report on coevolution and the possible effect that global warming may have on organisms
that are linked by this type of evolution.25. Research and report on examples of life forms that are able to survive in an oxygen-free environment, both
throughout Earth’s history and today.26. Identify sources of variation for (a) asexually reproducing and (b) sexually reproducing organisms.27. Select and research the topic of one of the article extracts.28. (a) Find out more about:
(i) coevolution(ii) pollination(iii) flowering plant life cycles(iv) bee life cycles(v) extinction(vi) climate change(vii) pollinator decline.
(b) Link the terms in part (a) using a mind map or fishbone diagram. (c) Research possible implications of pollinator decline for:
(i) farming and food supplies(ii) plant biodiversity on Earth(iii) humans.
29. Research and report on the role that museums play in the identification and preservation of species and how this contributes to Australia’s biodiversity.
30. The biggest problem connected to the effects of climate in Kakadu’s coastal floodplain is the rise in sea level. Salt water has already intruded in various parts of the park and has affected the local populations of Melaleuca (paperbark) trees and magpie geese. Research and report on the current and possible effects of rising sea levels in Kakadu.
31. Research and report on two of Australia’s top 15 national biodiversity hotspots using information from the National biodiversity weblink in your Resources section.
Try out this interactivity: Threats to EarthSpot ten differences in and environment before and after human contact.Searchlight ID: int-0218
Explore more with this weblink: National biodiversity
RESOURCES — ONLINE ONLYUNCORRECTED PAGE P
ROOFS
diacriTech
Highlight

c07GlobalSystems Page 326 16/07/17 2:25 PM
326 Jacaranda Science Quest 10 Australian Curriculum
7.10 Biosphere 27.10.1 BiosphericsHumans living in biospheric systems such as small spacecraft and submarines use physical and chemical techniques to recycle clean air and fresh water and remove accumulating wastes. As biospheric systems increase in size, however, the basic concepts of cycling of elements and the importance of biodiversity have direct implications on a number of different issues. These include global warming, the protection of endan-gered species, sufficient food supplies, effective waste removal and clean water requirements.
Biospherics is an exciting and essential new science. It was first envisioned by Vladimir Vernadsky in Russia in the 1920s. The biosphere project was inspired by John Allen, an American football player turned Beat poet (Johnny Dolphin), who had worked on a number of projects related to the synthesis of ecology and technology. In the early 1980s, along with several colleagues, he formed Space Biospheres Ventures. John Allen and his team designed and built an artificial world — Biosphere 2 — to develop a closed ecological system for research and education. Perhaps eventually this information will be used to sustain human life on other planets, such as Mars.
Gra
pes
Livingquarters
Orchards
Savanna
Sugarcane
Small crops
Rainforest
Beach
Atoll
Ocean
Saltmarsh
Desert
Wheat
Plan of Biosphere 2. The glass and structure components acted as a filter for incoming solar radiation so that almost all UV radiation was absorbed.
UNCORRECTED PAGE P
ROOFS

c07GlobalSystems Page 327 16/07/17 2:25 PM
TOPIC 7 Global systems 327
7.10.2 What does it look like?Biosphere 2 covers 13 000 square metres and contains living quarters and greenhouses con-taining food crops. Five different artificial environments are enclosed within the struc-ture: a desert, a salt marsh, a tropical savanna, an ocean and a rainforest.
7.10.3 What is it for?Earth is a natural biosphere. The Earth’s bio-sphere (Biosphere 1) has existed for at least 3.8 billion years. Some have called Biosphere 2 a type of cyber-Earth. Biosphere 2 is an artificially made structural biosphere located at an elevation of 1200 metres above sea level in a temperate desert region in southern Arizona, United States of America. Biosphere 2 was designed as an eco-technological model for space exploration and colonisation. This bioengineered facility was intended to grow food, cleanse the air, and recirculate and purify water for its inhabitants. This was to be achieved without exchange of materials (including atmospheric gases) with the outside world. The purpose of this cyber-Earth was for scientists to gather information to assist in the development of strategies to solve some of Earth’s environmental problems and the hurdles of developing human colonies in space.
7.10.4 Closed systemsBiosphere 2 and Earth are similar because they are both closed systems. The space frame of Biosphere 2 has the same job as the Earth’s atmosphere, which acts as a giant hollow globe that keeps the Earth a closed system. No event in a closed system (such as Earth’s atmosphere or Biosphere 2’s special frame) is isolated. If 40 people were to enter the desert biome of Biosphere 2, the sensors would quickly record a decrease in the oxygen levels and an increase in carbon dioxide levels throughout all of the biomes in Biosphere 2. This is because the people would breathe faster than the plants could take up the excess carbon dioxide. Could a similar thing happen outside Biosphere 2?
7.10.5 What happened?Shortly after sunrise on 26 September 1991, eight people and 3800 species of plants and animals were locked inside this artificial world for two years. World-wide, millions of television viewers watched. The crew had been prepared by years of training and working on devel-oping systems for Biosphere 2. They had also had nine preliminary one-week semiclosed experiments over the pre-vious five months.
Abigail Alling stopped her graduate work at Yale University on blue whales to enter Biosphere 2 as the manager of oceans and marshes. She created and operated the world’s largest artificial ecological marine system, a mangrove marsh and ocean coral reef, for the Biosphere 2 project. She was one of the original eight people to live inside Biosphere 2 — the artificial cyber-Earth system.
Biosphere 2, southern Arizona
UNCORRECTED PAGE P
ROOFS

c07GlobalSystems Page 328 16/07/17 2:25 PM
328 Jacaranda Science Quest 10 Australian Curriculum
7.10.6 Gasping for oxygenBy the end of the first year of their mission, the Biospherians reported deteriorating air and water quality. Oxygen concentrations in the air had fallen from 21 per cent to 14 per cent. This oxygen level was barely enough to keep them alive and functioning. At the same time, carbon dioxide concentrations were under-going large daily and seasonal variations and nitrous oxide in the air had reached mind-numbing levels. In January 1993, fresh air was pumped in to replenish the dome’s atmosphere and rescue the inhabitants. Investigations indicated that the missing oxygen was being consumed by microbes in the excessively rich food crop soil.
It was very fortunate that the fresh concrete used in the structure’s construction absorbed carbon dioxide released by microbial metabolism. If this carbon dioxide sink hadn’t been available, the air would have become unbreatheable much earlier.
7.10.7 More carbon cyclingDue to a forceful El Niño current, one of Arizona’s cloudiest seasons on record was experienced between October 1991 and February 1992. The carbon dioxide concentration inside Biosphere 2 rose to about 3400 ppm (parts per million). The combination of this effect and an unusually dark cloudy period in the last week of December greatly reduced photosynthesis. During this period, the rise in carbon dioxide was kept below 4000 ppm by the operation of a recycler, which captured carbon dioxide and precipi-tated it into calcium carbonate (limestone). The calcium carbonate could later be released into the air by heating the limestone. This experience provided an insight into how to maximise photosynthesis and minimise soil respiration. Hence, Biosphere 2’s goal to maintain its atmosphere was achieved despite the low light conditions.
7.10.8 Getting hungryIdeally, the chemical-free agriculture system inside Biosphere 2 recycled all human and domestic animal waste products. It also initially included dozens of crop varieties to provide nutritional bal-ance and allow for crop rotation. Biosphere 2, however, encountered considerable food production problems.
One article written about the Biosphere 2 project stated: ‘Seal a group of scientists inside Biosphere 2, the futuristic glass-and-dome experiment, for two years and what do you get? Fights over food.’ Comments from the Biosphere 2 botanist suggested that personality differences and crop failures made life difficult and that ‘food distribution became a very tense issue … I Think that made us all a little cranky, always being hungry’.
Due to unexpected crop failures, far less food was produced than had been projected. Only 60 per cent of the sunlight made it through the glass pane of Biosphere 2’s space frame. Cloudy days also reduced the light available to plants for photosynthesis. A combination of unprecedented cloudy weather for the second straight year (20 per cent below the low rate of sunshine of 1992) and increased insect pest problems con-tributed to reduced food production.
An interview with one of the Biospherians in February 1992 described their surprise at their initial weight loss and desire for more food than they were supposed to have. They dipped into their stored food, believing that a better summer harvest would allow them to replenish it later. Unfortunately, the harvest did not improve. A lock was placed on the refrigerator to keep them from sneaking food. When the mission ended, the average weight loss per person was around 13 kg.
7.10.9 SurvivorsEighteen of the 25 introduced vertebrate species became extinct. All of the insect pollinators died, which prevented most plants from producing seeds. This led to food supplies falling to dangerous levels.
UNCORRECTED PAGE P
ROOFS

c07GlobalSystems Page 329 16/07/17 2:25 PM
TOPIC 7 Global systems 329
Weedy vines flourished in the carbon-rich atmosphere and threatened to choke out more desirable plants. Although the majority of insects disappeared, ants and cockroaches thrived and overran everything, including workers.
7.10.10 The futureMore recent plans for Biosphere 2 include flushing it with carbon dioxide and using it to predict the Earth’s future.
As carbon dioxide is a fundamental requirement for photosynthesis, scientists have long suspected that higher carbon dioxide levels will fuel extra plant growth. Some of them have even suggested that rising carbon dioxide levels may boost global harvests. Other scientists have suggested that trees and shrubs around the world will help alleviate the problems of global warming by soaking up some of the additional carbon dioxide. This brings some thought-provoking questions to mind. • If extra plant growth does appear, will all crop plants be affected in the same way; if not, what are the
implications? • If extra carbon is taken up by the natural biosphere, how long will it stay there? • What would happen if the carbon dioxide quickly went into the soil and was then returned to the
atmosphere?
West lung
Agro-forestry
South lungAir exhaust
RainforestSavanna
Desert
Freshwater marsh
Thornscrub
CO2 supply tank
MarshOcean
N
S
WE
Orc
hard
Humanhabitat
Air intake
Lower savanna
CO2 injection locations
Air flow
CH4 and N2O sample locations
PVC isolation curtains
10 000 CFM TESCO fans
Gas chromatographcontinuous monitoring system
Air flow and carbon dioxide movement through Biosphere 2
UNCORRECTED PAGE P
ROOFS

c07GlobalSystems Page 330 16/07/17 2:25 PM
330 Jacaranda Science Quest 10 Australian Curriculum
• Will the carbon dioxide be safely locked up in the forests? • Are there carbon dioxide levels that may kill off trees and shrubs, resulting in release of their accumu-
lated carbon in one catastrophic burst? • How long (and with what effects) can a group of people live in an artifi cial closed system? • Does the experience of Biosphere 2 bring us any closer to living on Mars?
7.10.11 Water cycle
Will extra CO 2 cause faster growth for crops such as this sugarcane?
Air handlersAir handlersHumidity Condensate
Mist systems
Condensatetanks
R/O watertank
Reverseosmosis R/O
Primary waterstorage tank
Sub-soil waterstorage tank
Surface waterrecycles
Sub-soildrainage
Root uptake
Water inbiotic tissues
Rain systems
Evaporation
Transpiration
Soil
Water was conserved inside the Biosphere 2 wilderness environments. Condensation, artifi cial rain or irrigation (by sprinkler systems), evapotranspiration and sub-soil drainage were the major internal water cycling components. Water systems, however, became polluted with excess nutrients. This led to degraded aquatic habitats and contaminated drinking water supplies.
UNCORRECTED PAGE P
ROOFS
diacriTech
Highlight
ED: We included this head here per mss, please confirm

c07GlobalSystems Page 331 16/07/17 2:25 PM
TOPIC 7 Global systems 331
7.10 Exercises: Understanding and inquiringTo answer questions online and to receive immediate feedback and sample responses for every question, go to your learnON title at www.jacplus.com.au. Note: Question numbers may vary slightly.
Remember1. Why was Biosphere 2 not called Biosphere 1?2. List the five different artificial environments enclosed within Biosphere 2.3. What was the purpose of Biosphere 2?4. State one way in which Biosphere 2 is similar to Earth.5. Why would you expect an increase in carbon dioxide levels and a decrease in oxygen levels if a large
number of people entered Biosphere 2?6. Why was fresh air pumped into Biosphere 2 in 1993?7. How did microbes affect the carbon dioxide levels?8. Why was it fortunate that the fresh concrete in the structure absorbed carbon dioxide?9. How did clouds affect food production?
10. How was water cycled through Biosphere 2?11. Suggest ways in which the experience and findings of the Biosphere 2 project can be useful.
Think and discuss12. Due to the moist, artificially generated climate, shrubs and grasses, rather than desert plants, overran the
desert area.(a) Suggest why this occurred.(b) If you were the scientist assigned to solve this problem, suggest how you could increase the number of
desert plants.13. The rainforest in the Biosphere 2 prospered, doubling in size. Job’s tears, a grass that normally grows about
60 centimetres tall in the tropics, became a giant of around 4 metres.(a) Suggest how this outcome could be advantageous to Biosphere 2.(b) Suggest how this outcome could be disadvantageous.
Imagine and create14. Make a biosphere using a plastic soft drink container.15. Imagine that you were one of the Biospherians. Write a diary about your two years in Biosphere 2.16. Imagine you are one member of the first colony to live on Mars in 2050. Write a letter back to your family or
friends about your new life.17. Imagine that a meteor will hit Earth in two years’ time and that all of human life needs to be moved off the
planet by this time.(a) Make a list of all of the things that would be required to support human life.(b) Design a spacecraft that can meet these needs and keep you and your fellow travellers alive until you
find (or can modify) a planet or environment that is habitable.18. Imagine that the combination of the greenhouse effect and the hole in the ozone layer have made Earth
uninhabitable. You need to design an artificial world that will meet your needs. What would it look like and how would it work?
Try out this interactivity: The survival game Play the game to test your knowledge of how to save the environmentSearchlight ID: int-0217
Complete this digital doc: Worksheet 7.5: Slowing global warming — alternativesSearchlight ID: doc-19476
Complete this digital doc: Worksheet 7.6: A dome away from homeSearchlight ID: doc-19477
RESOURCES — ONLINE ONLY
UNCORRECTED PAGE P
ROOFS
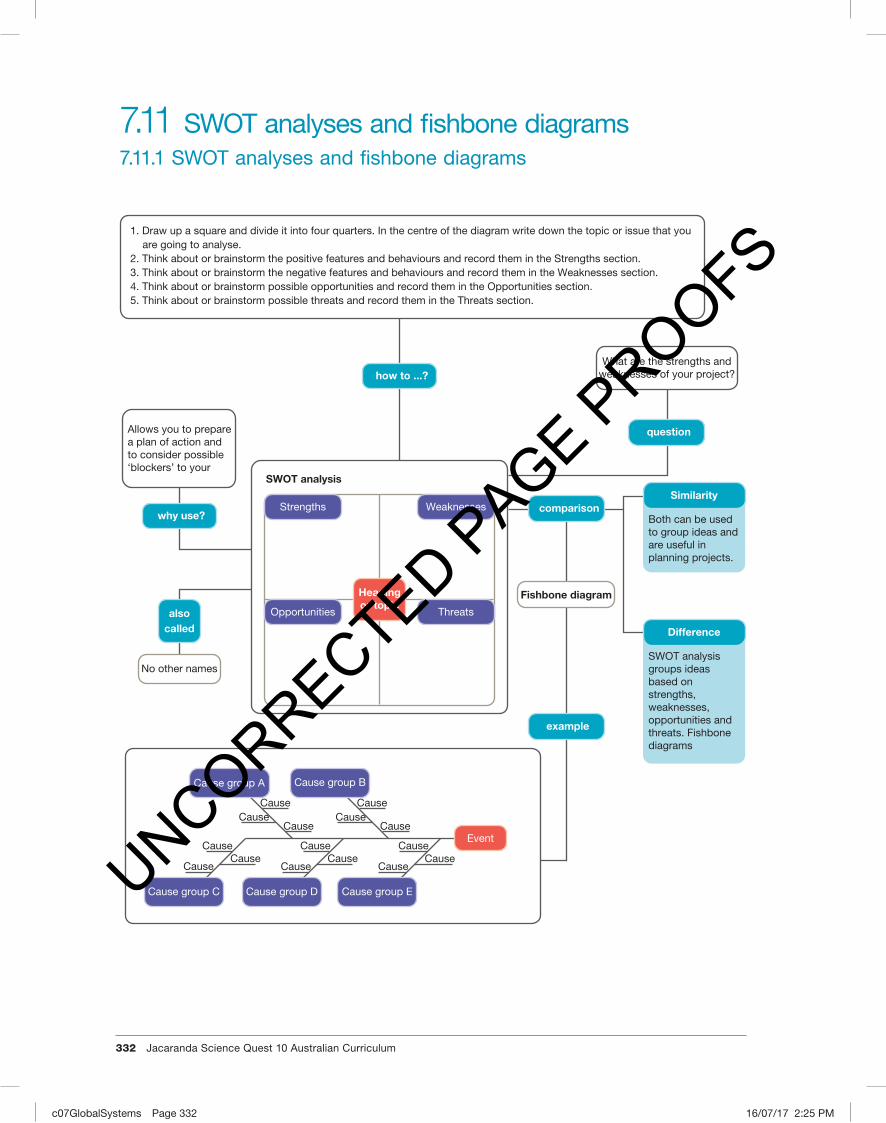
c07GlobalSystems Page 332 16/07/17 2:25 PM
332 Jacaranda Science Quest 10 Australian Curriculum
7.11 SWOT analyses and fishbone diagrams7.11.1 SWOT analyses and fishbone diagrams
also called
Fishbone diagram
SWOT analysis
Both can be used to group ideas and are useful in planning projects.
Similarity
SWOT analysis groups ideas based on strengths, weaknesses, opportunities and threats. Fishbone diagrams
Difference
example
What are the strengths andweaknesses of your project?
comparison
alsocalled
how to ...?
why use?
question
Headingor topic
No other names
Cause
CauseCause
Cause
CauseCause
CauseCause
Cause
CauseCause
Cause
CauseCause
Cause
Event
Cause group A Cause group B
Cause group C Cause group D Cause group E
1. Draw up a square and divide it into four quarters. In the centre of the diagram write down the topic or issue that you are going to analyse.2. Think about or brainstorm the positive features and behaviours and record them in the Strengths section.3. Think about or brainstorm the negative features and behaviours and record them in the Weaknesses section.4. Think about or brainstorm possible opportunities and record them in the Opportunities section.5. Think about or brainstorm possible threats and record them in the Threats section.
WeaknessesStrengths
ThreatsOpportunities
Allows you to preparea plan of action andto consider possible‘blockers’ to your
UNCORRECTED PAGE P
ROOFS

c07GlobalSystems Page 333 16/07/17 2:25 PM
TOPIC 7 Global systems 333
7.11 Exercises: Understanding and inquiringTo answer questions online and to receive immediate feedback and sample responses for every question, go to your learnON title at www.jacplus.com.au. Note: Question numbers may vary slightly.
Read, think, discuss and create1. Read the article Wash clothes with thin air and use a 321 tool to summarise three interesting points, two
important points and one personal point.
2. In a team of four, use the ‘learning placemat’ on the right to:(a) write down key points of each individual’s summary from
question 1(b) verbally share your key points with other team members(c) agree on a team summary and place it in the middle of
your team placemat(d) share and discuss your team mat with another team.
3. (a) Construct your own individual SWOT analysis on the Airwash machine.
(b) Discuss and compare your SWOT analysis with members from two other groups.
(c) Report back to your team on what you have found out.(d) Construct a team SWOT analysis.
4. In your team, brainstorm other inventions that may result in reduced household water usage.
5. In many states in Australia there are water restrictions to try to conserve the very limited water supply available to us.
Ind
ivid
ual
Ind
ivid
ualInd
ividual
Individ
ual
Group
Group
WASH CLOTHES WITH THIN AIRIt could be a godsend for drought-stricken communities — a washing machine that needs no water or powder yet cleans clothes in a jiffy.
Scientists in Singapore have invented a revolutionary appliance called the Airwash and it has already caught the eye of one major manufacturer.
The machine works by blasting dirty clothes with jets of air primed with negative ions, which have the effect of clumping dust together, deactivating bacteria and neutralising odours.
The result, the inventors claim, is clean, fresh-smelling clothes that come out of the machine completely dry — meaning an end to clothes lines and perhaps even a death knell for the tumble dryer.
And since no water is involved, fabrics unsuitable for conventional machines — such as leather and suede — can be washed at home instead of having to be dry cleaned.
Negative ions are molecules that have gained an electric charge. Odourless, tasteless and invisible, they are created when molecules in the atmosphere break apart due to fast-moving air and sunlight. In nature, they are found in invigorating environments such as pine forests and where breaking waves pound the seashore.
The Airwash is inspired by the way clothes used to be beaten against river rocks near waterfalls, which are another of nature’s negative-ion generators. A prototype has been built by Gabriel Tan and Wendy Chua of the National University of Singapore and Electrolux is watching closely.
The average householder spends nine months in a lifetime doing the washing and the Airwash designers believe any machine that makes the chore easier will be welcomed.
Mr Tan said: ‘But as well as being boring, laundry uses up scarce water supplies and pollutes with chemical detergents.’
The Airwash appliance
UNCORRECTED PAGE P
ROOFS
diacriTech
Highlight
diacriTech
Highlight

c07GlobalSystems Page 334 16/07/17 2:25 PM
334 Jacaranda Science Quest 10 Australian Curriculum
7.12 Project: The fifty years after...7.12.1 Scenario • 260 million years BCE: A massive volcano in what is presently China erupts, causing atmospheric and
oceanic changes leading to the extinction of 95 per cent of life in the oceans and 70 per cent of land-based life.
• 95 million years BCE: Undersea volcanic activity triggers a mass extinction of marine life and buries a thick mat of organic matter on the sea floor.
• 72 000 BCE: The Lake Toba volcano in Indonesia ejects nearly 3000 cubic kilometres of material into the atmosphere, cutting off much of the sun’s light to the Earth’s surface for so long that 50 per cent of humanity dies out.
• 2000 CE: The UK science program Horizon uses the term supervol-cano to describe volcanoes capable of massive eruptions covering huge areas with lava and ash and causing long-term weather effects and mass extinctions.
• 2030 CE: The supervolcano under Yellowstone National Park erupts cataclysmically, destroying half of the US and changing the Earth’s atmosphere and surface conditions for centuries to come.
• The year is now 2080. Fifty years after the eruption, the gases and ash that the eruption produced, as well as the destruction of large sec-tions of land, have affected the critical environmental cycles of the Earth’s environments; human civilisa-tion has had to change its ways in order to survive. Some things remain the same though — we still have radio and television of a sort. Not surprisingly, with the fiftieth anniversary of the Yellowstone eruption (or ‘Y-day’, as it is known) coming up, lots of TV programs will be focusing on the critical event that changed our world forever.
7.12.2 Your taskAs part of a small documentary film company, you will produce a 5-minute segment for a special edition of a TV science show that will be aired on the fiftieth anniversary of Y-day. In this segment, a science journalist will interview a variety of experts in a retrospective of what happened on Y-day, how the environment has changed over the 50 years since the eruption, and what humanity can expect to happen in the next 50 years.
ProcessOpen the ProjectsPLUS application for this chapter located in your Resources section. Watch the introduc-tory video lesson and then click the ‘Start Project’ button to set up your project group.
Grand Prismatic Spring in Yellowstone National Park
(a) Brainstorm some possible reasons that we have such a limited supply of water.(b) In pairs or teams of four, use an affinity diagram to organise your list of reasons into groups.(c) Construct a fishbone diagram by putting your title in the head of the fish, labels of the groups of reasons
on each of your main side fishbones and the reasons on smaller fishbones off the main bones.
UNCORRECTED PAGE P
ROOFS

c07GlobalSystems Page 335 16/07/17 2:25 PM
TOPIC 7 Global systems 335
7.13 ReviewGlobal systems • provide examples of ways in which human activity has affected global systems • describe the phosphorus and nitrogen cycles • outline the processes involved in the carbon cycle • show the interactions of the carbon, water, phosphorus and nitrogen cycles within the biosphere • explain the causes and effects of the greenhouse effect • distinguish between the greenhouse effect and the enhanced greenhouse effect
Biodiversity • define the term ‘biodiversity’ • distinguish between genetic diversity, species diversity and ecological diversity • outline some sources or causes of genetic diversity • suggest why species diversity is important to the survival of the species • suggest why biodiversity is important to the survival of a species • suggest a link between biodiversity and evolution • consider the long-term effects of loss of biodiversity • explain the factors that drive the ocean currents, their role in regulating global climate and their effects
on marine life • outline the effect of climate change on sea levels and biodiversity • comment on changes to permafrost and sea ice and the impacts of these changes • suggest how genetic characteristics may have an impact on survival and reproduction • describe the process of natural selection using examples • explain the importance of variations in evolution
Global systems and human impacts • explain the causes and effects of the enhanced greenhouse effect • suggest a link between the enhanced greenhouse effect and global warming • outline some human activities that are contributing to global warming • outline some key issues of the climate change debate • describe examples of ways in which human activity has affected biodiversity
Science as a human endeavour • evaluate some strategies for addressing global warming • comment on the role of science in identifying and explaining the causes of climate change
Individual pathways
ACTIVITY 7.1Revising global systemsdoc-8479
ACTIVITY 7.2Investigating global systemsdoc-8480
ACTIVITY 7.3Investigating global systems furtherdoc-8481
ONLINE ONLY
UNCORRECTED PAGE P
ROOFS

c07GlobalSystems Page 336 16/07/17 2:25 PM
336 Jacaranda Science Quest 10 Australian Curriculum
7.13 Review 1: Looking back To answer questions online and to receive immediate feedback and sample responses for every question, go to your learnON title at www.jacplus.com.au . Note: Question numbers may vary slightly.
1. Global warming is a current issue that is not going away. (a) Outline the most accepted view within the scientifi c community of the cause of global warming. (b) Describe examples of effects or consequences of global warming that have been suggested by scientists. (c) State your opinion about the possible (i) cause, (ii) effects and (iii) solutions for global warming. (d) View the top ten arguments about global warming that are used by sceptics. Rank these statements in
order of most like your opinion to least like your opinion. Justify your ranking. (e) State the difference between an opinion, a theory and a fact. (f) Can scientists have opinions? If you agree, when, how and why should these be shared? If you do not
agree, why not? (g) Should science play a part in the making of climate policy? Justify your response. (h) Suggest possible reasons for the climate debate.
2. Demonstrate your understanding of the following groups of terms by using a visual Thinking tool to show the links between them. (a) Species, biodiversity, biodiversity loss, threatened, endangered,
extinct, mass extinction (b) Biosphere, lithosphere, hydrosphere, biota, atmosphere,
troposphere, stratosphere (c) Atoms, molecules, organelles, cells, multicellular organisms,
species, population, ecosystem, biosphere (d) Stratosphere, climate change, greenhouse gas, fossil fuels, global
warming, carbon dioxide, methane, nitrous oxide, biodiversity loss, enhanced greenhouse effect, cellular respiration, lithosphere
(e) Carbon cycle, photosynthesis, cellular respiration, carbon dioxide (f) Water cycle, precipitation, transpiration, evaporation, hydrosphere (g) Ozone layer, ozone hole, CFCs, stratosphere (h) Abiotic factor, biotic factor, temperature, rainfall, climate, multicellular organism, ecosystem, biome (i) Greenhouse effect, enhanced greenhouse effect, global warming
3. Constantly changing physical, chemical and biological cycles have contributed to the survival of various forms of life on Earth. Our life-support systems are not in good shape. Using knowledge that you have gained from this chapter, comment on the statements above.
4. What is meant by biodiversity and why is loss of biodiversity a concern? 5. (a) The mountain pygmy possum is restricted
to an area of 6 km 2 in the Australian Alps. Suggest how such a restricted habitat may infl uence its chances of survival.
(b) Suggest abiotic and biotic factors that may affect this possum.
(c) Suggest how warmer temperatures and reduced snow may affect its lifestyle. Be specifi c in your response by including examples of different scenarios.
(d) What is meant by the term extinction ? (e) If this species was to become extinct,
suggest implications for other organisms within its ecosystem.
6. Copy the fi gure at right into your workbook and then use the following terms to complete the links: nitrifying bacteria, uptake by roots, denitrifi cation, decomposition, feeding, nitrogen-fi xing bacteria.
Nitrogen inthe air
Lightning
Nitrates inthe soil
Nitrites inthe soil
Ammoniain the soil
Animal proteins
Dead animalsand plants
Plantproteins
Denitrifyingbacteria
Nitrifyingbacteria
UNCORRECTED PAGE P
ROOFS
diacriTech
Highlight

c07GlobalSystems Page 337 16/07/17 2:25 PM
TOPIC 7 Global systems 337
7. Rising sea levels and saltwater intrusion associated with climate change are threats that Kakadu National Park is experiencing. (a) Suggest why these threats are associated with climate change. (b) Suggest effects that these new threats may have on the (i) biotic and (ii) abiotic parts of this ecosystem. (c) Suggest actions that could be taken to reduce the loss of biodiversity within Kakadu National Park.
8. Complete the crossword below.
9. Agriculture has had (and continues to have) a devastating effect on a number of marine ecosystems. Hypoxia in coastal zones from nitrogen and phosphorus outputs of agricultural and livestock industries is one such example. (a) Using your knowledge of the nitrogen and phosphorus cycles, explain how these outputs may damage
marine ecosystems. (b) Suggest strategies that may reduce the negative impact that agriculture has on our ecosystems.
Link to assessON for questions to test your readiness FOR learning, your progress AS you learn and your levels OF achievement.
www.assesson.com.au
1 2
3 4
5 6 78
9 10
11 12
1314
15
16
17 18 19
20
DOWN 1. A group of organisms of the same species in the same area 2. Includes water and dissolved carbon dioxide 3. A layer of this gas helps block out more than 95 per cent of ultraviolet
rays entering the atmosphere. 4. The life-support system of our planet 6. Organisms are composed of these. 7. Global warming will lead to a rise in this factor. 10. The loss of a species from Earth 11. Includes rocks, coal and oil deposits, and humus in soil 13. This human activity can result in increased carbon dioxide levels in
the atmosphere. 14. Abbreviation of deoxyribonucleic acid 19. Abbreviation of total ozone mapping spectrometer
ACROSS 5. Abbreviation of chlorofl uorocarbon 8. Dynamic system of organisms interacting
with each other and their environment 9. Planting these may help reduce the effect of
global warming. 12. The ozone layer is located in this part of the
Earth’s atmosphere. 15. These bacteria convert nitrates in soil and
water into nitrogen in the air. 16. Plants use this process to make glucose
and oxygen. 17. An example of a greenhouse gas 18. Photosynthesis, respiration, death and
decomposition are all processes within this cycle.
20. This term relates to the total variety of living things on Earth.
UNCORRECTED PAGE P
ROOFS
diacriTech
Highlight