Topic 2: Portraying Earth: Using Maps, Remote Sensing and GIS Introduction to Maps: - What is a Map?...
128
Topic 2: Portraying Earth: Topic 2: Portraying Earth: Using Maps, Remote Sensing and Using Maps, Remote Sensing and GIS GIS Introduction to Maps: - What is a Map? - Benefits of Maps - Marginal information on Maps - Map Scale - Map Projections: - Cylindrical Projections - Plane Projection - Conic Projection Incoming Solar Radiation: - Electromagnetic Spectrum - Insolation - Daily Insolation Pattern
-
Upload
matthew-clarke -
Category
Documents
-
view
232 -
download
2
Transcript of Topic 2: Portraying Earth: Using Maps, Remote Sensing and GIS Introduction to Maps: - What is a Map?...
Topic 2: Portraying Earth: Using Topic 2: Portraying Earth: Using Maps, Remote Sensing and GISMaps, Remote Sensing and GIS
Introduction to Maps:- What is a Map?- Benefits of Maps- Marginal information on Maps- Map Scale- Map Projections:
- Cylindrical Projections- Plane Projection- Conic Projection
Incoming Solar Radiation:- Electromagnetic Spectrum- Insolation- Daily Insolation Pattern
Topic 2: Portraying Earth: Using Topic 2: Portraying Earth: Using Maps, Remote Sensing and GISMaps, Remote Sensing and GIS
- Map Projections:- Equivalent Projection- Conformal Projection
Remote Sensing:- Aerial Photographs- Orthophoto Maps- Visible light & Infrared Sensing- Thermal Infrared Sensing- Microwave Sensing

Topic 2: Portraying Earth: Using Topic 2: Portraying Earth: Using Maps, Remote Sensing and GISMaps, Remote Sensing and GIS
Remote Sensing:- Microwave Sensing- Multispectral Remote Sensing
Geographic Information Systems (GIS)- What is GIS- GIS Automation Tools
Isolines and Applications
Introduction to Maps: What is a Map?Introduction to Maps: What is a Map?
Geographic information describing earth’s surface features are often displayed by geographers on: - maps: examples include road map, topographic map, surveyor’s map, etc)- aerial photographs - satellite imageries - GIS, etc
Introduction to Maps: Benefits of Maps?Introduction to Maps: Benefits of Maps?
A map is a two-dimensional representation of the spatial distributions of features of interest in a place or region
Maps show spatial relationships between features, especially:- direction- distance- size and shape

Introduction to Maps: What is a Maps?Introduction to Maps: What is a Maps?
May provide clue why things are located where they are
The main purpose of maps is to show the spatial distribution of one or more features of interest
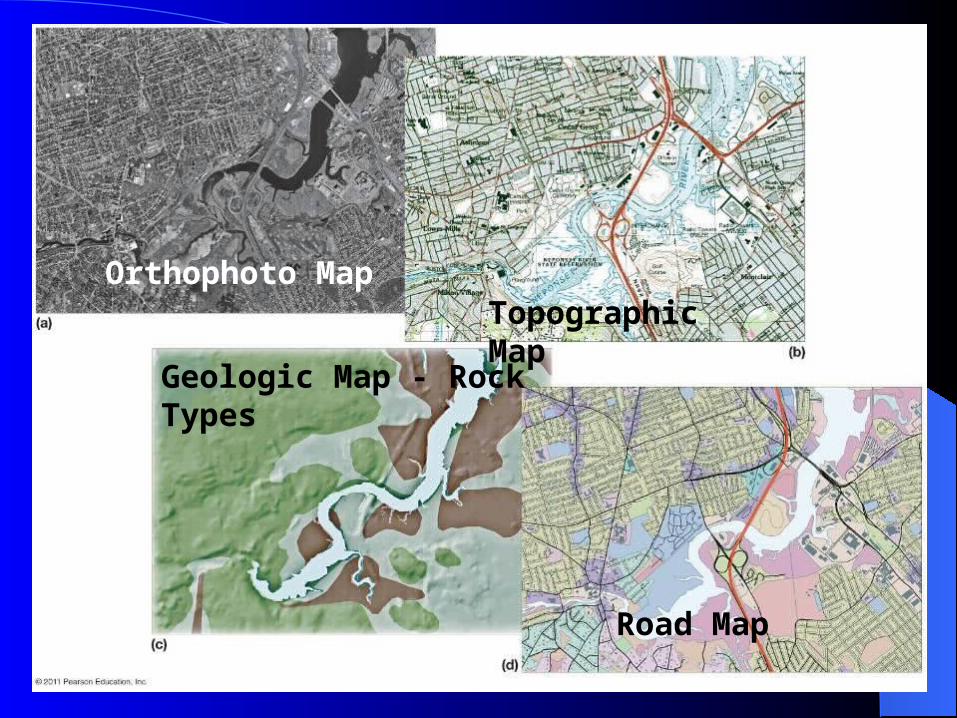
Orthophoto MapTopographic Map
Road Map
Geologic Map - Rock Types


Orthophoto Map from Aerial Photograph

USGS Topographic Map Quadrangle

Introduction to Maps: Benefits of Maps?Introduction to Maps: Benefits of Maps?
Benefits of Maps:- Map is the geographer’s most important
tool - Represents earth’s features on a flat
paper - it shows spatial relationships with great
efficiency- It can show true courses for navigation
and true shapes of earth’s features

Introduction to Maps: Benefits of Maps?Introduction to Maps: Benefits of Maps?
Benefits of Maps:- It can be used to measure areas and distances- It can be reproduced easily and inexpensively- It is easier to handle and transport - It is often smaller than the areas they
represent and contains less details
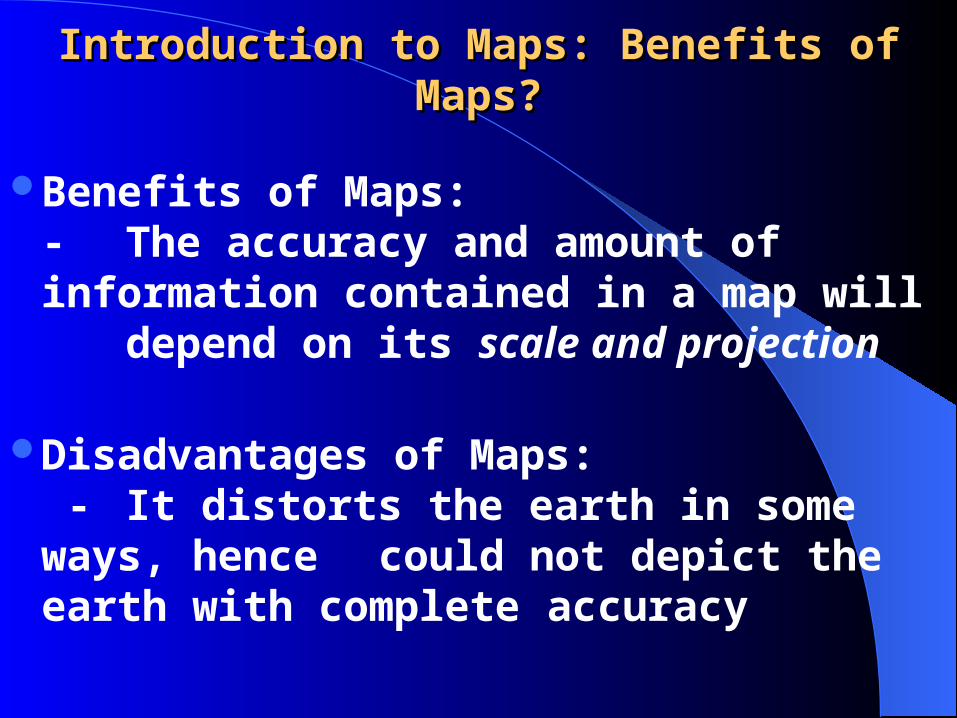
Introduction to Maps: Benefits of Maps?Introduction to Maps: Benefits of Maps?
Benefits of Maps:- The accuracy and amount of information contained in a map will depend on its scale and projection
Disadvantages of Maps: - It distorts the earth in some ways, hence
could not depict the earth with complete accuracy

Introduction to Maps: Benefits of Maps?Introduction to Maps: Benefits of Maps?
Disadvantages of Maps: - Map distortions become progressively
pronounced as the part of the globe depicted gets larger

Introduction to Maps – Map ScaleIntroduction to Maps – Map Scale
Map Scale:
Scale is a mathematical expression or statement of a relationship between distances or sizes on map and their actual measurements on the ground
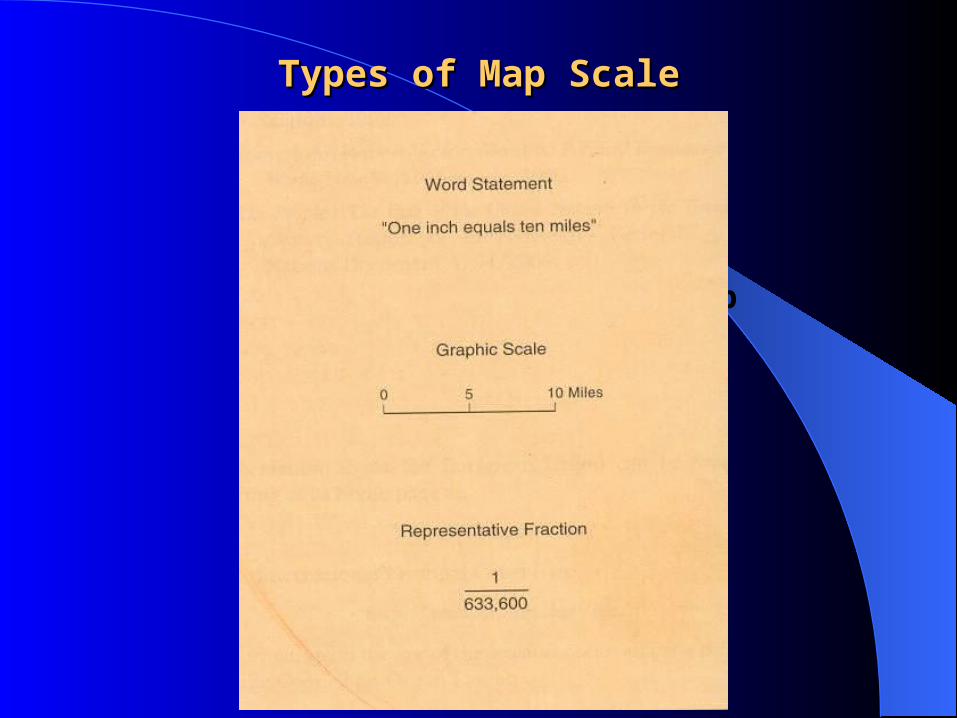
Types of scale: 1. Statement Scale or Verbal or Word Scale 2. Fractional Scale and
3. Graphical Scale
Types of Map ScaleTypes of Map Scale
Three Types of Map Scale

Three Types of Map Scale

Introduction to Maps – Map ScaleIntroduction to Maps – Map Scale
Map Scale: Statement Scale or Verbal or Word Scale
A scale stating in words the distance on map compared to the actual distance on the ground
Example: one inch on the map represents one mile on the ground or 1 inch = 1 mile)
Representative Fraction or Ratio Scale A scale in which map distance is represented as a proportional number of its actual distance on the ground

Introduction to Maps – Map ScaleIntroduction to Maps – Map Scale
Example: 1:63360 or 1/63360, meaning a unit length on the map equals 63360 units on the ground
- Common Ratio Scales used on maps: a. world map (1:264,000,000) b. road map of a state (1:1,000,000
to 1:2,000,000) c. street map of a city (1:10,000) d. residential lot (1:100)
Introduction to Maps – Map ScaleIntroduction to Maps – Map Scale
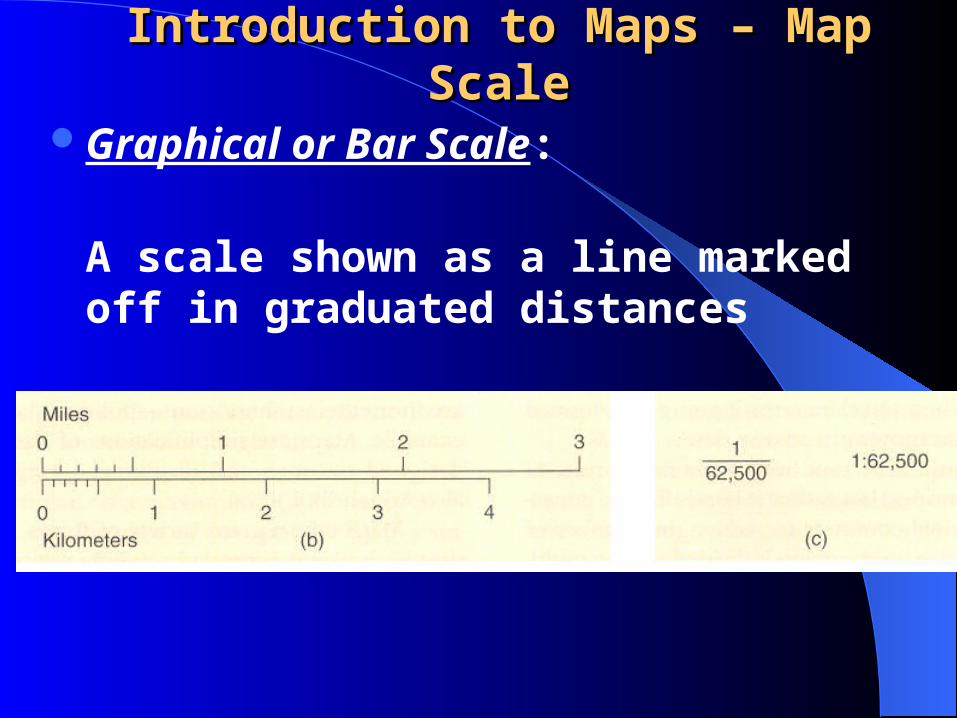
Graphical or Bar Scale:
A scale shown as a line marked off in graduated distances
Introduction to Maps – Map ScaleIntroduction to Maps – Map Scale
Graphical or Bar Scale:
A major advantage is that it remains valid when map is reduced into another size (through photocopying) because the graphical scale line and map size change in same dimension

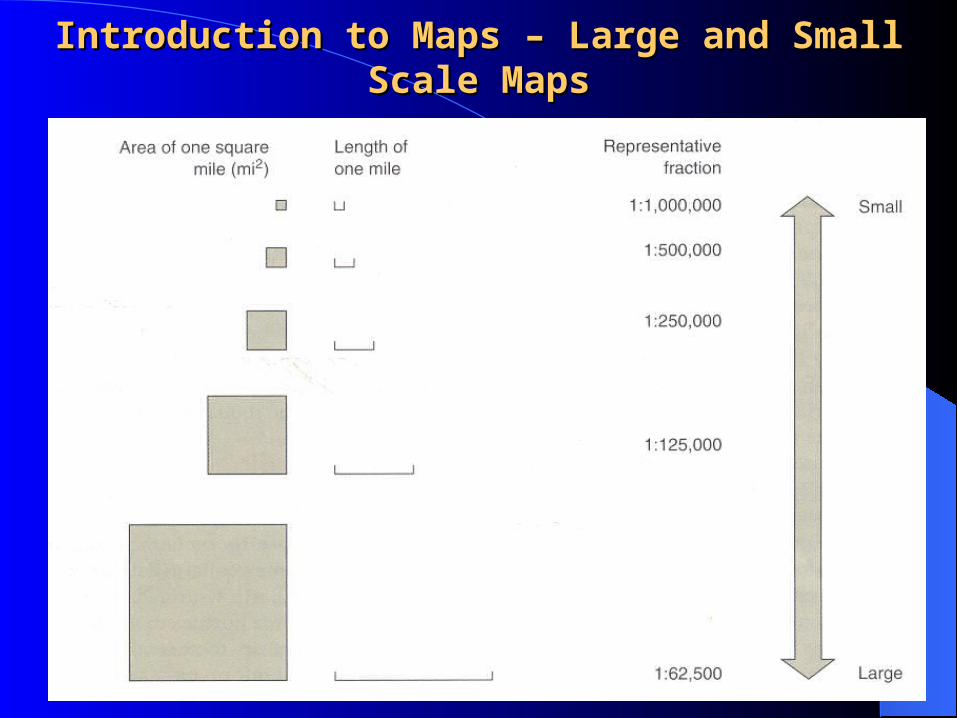
Introduction to Maps – Large and Small Introduction to Maps – Large and Small Scale MapsScale Maps
Two types of maps based on map scale are:- Small-Scale Maps- Large-Scale Maps
Small-scale maps show large portions of the earth cramped into a small paper
It is indicated by a map scale with a large denominator (1/1,000,000)
Examples of small-scale maps: World map, US Map
Introduction to Maps – Large and Small Scale MapsIntroduction to Maps – Large and Small Scale Maps

Introduction to Maps – Large and Small Scale MapsIntroduction to Maps – Large and Small Scale Maps

Introduction to Maps – Large and Small Introduction to Maps – Large and Small Scale MapsScale Maps
Large-scale maps show a very small area of the earth in a large space
It is indicated by a map scale with a small denominator (1/100)
Examples of large-scale maps: - a house plan - a school map
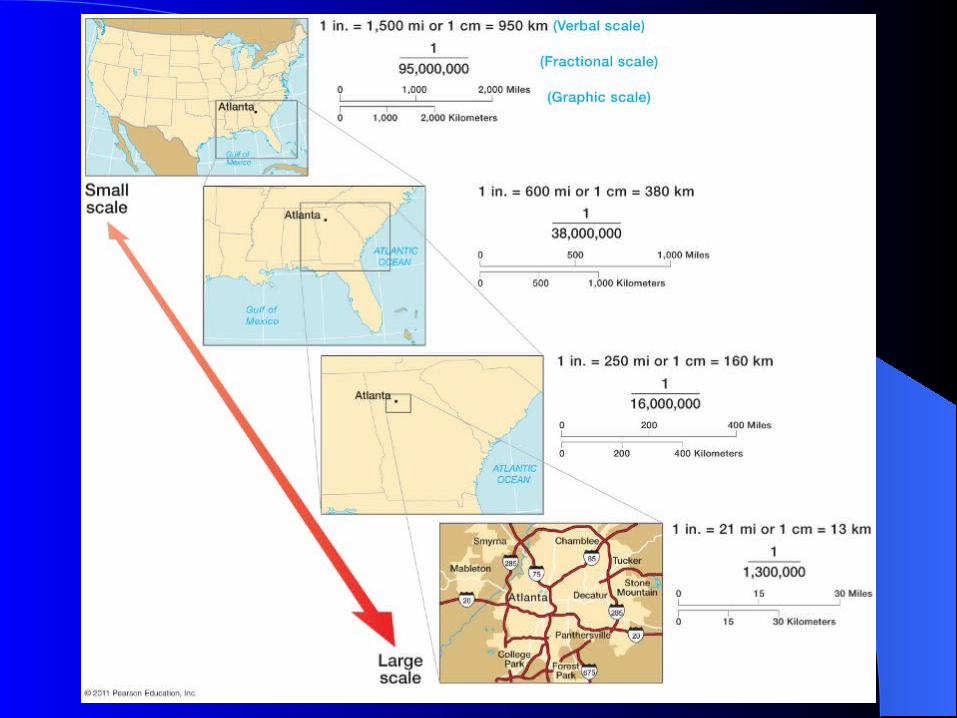

Different Scales: From Small To Large Scale MapsDifferent Scales: From Small To Large Scale Maps
Small Scale
Large Scale Map
Introduction to Maps – Large and Small Introduction to Maps – Large and Small Scale MapsScale Maps
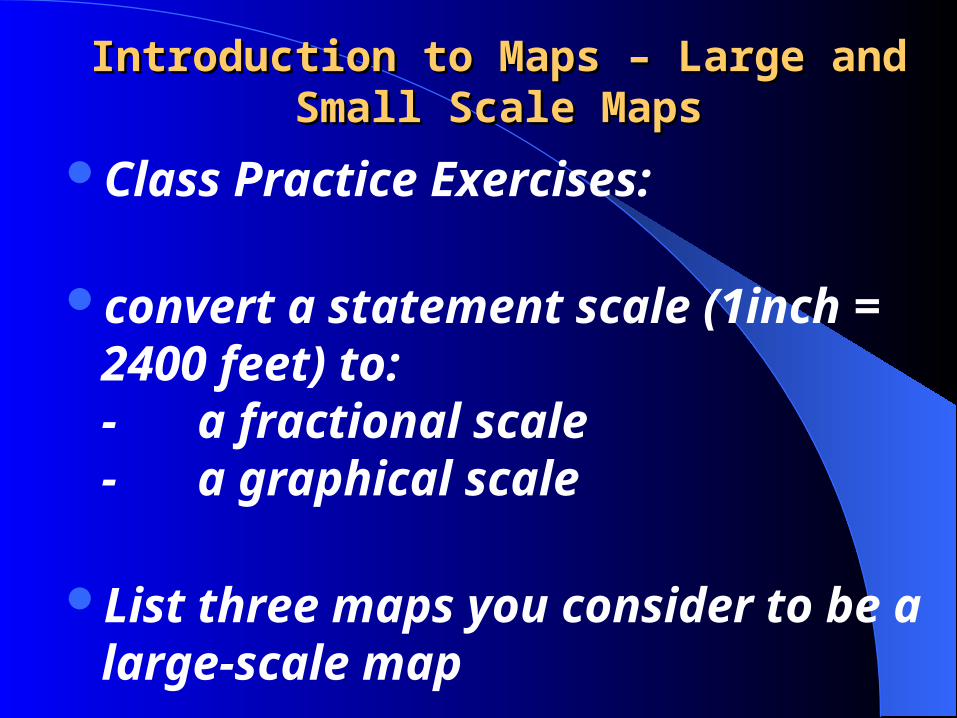
Class Practice Exercises:
convert a statement scale (1inch = 2400 feet) to:- a fractional scale - a graphical scale
List three maps you consider to be a large-scale map

Introduction to Maps: Marginal Introduction to Maps: Marginal Information on MapsInformation on Maps
Maps are drawn for different purposes:- general purpose maps (e.g. world map)- thematic maps showing distribution of a specific phenomenon(population density)
- In general, maps contain useful information to help in map interpretation
- Most of such useful information are often shown on the margins of the map

Introduction to Maps: Marginal Introduction to Maps: Marginal Information on MapsInformation on Maps
Maps are drawn for different purposes:- general purpose maps (e.g. world map)- thematic maps showing distribution of a specific phenomenon(population density)
In general, maps contain useful information to facilitate their use and interpretation
Most of such useful information are often shown on the margins of the map
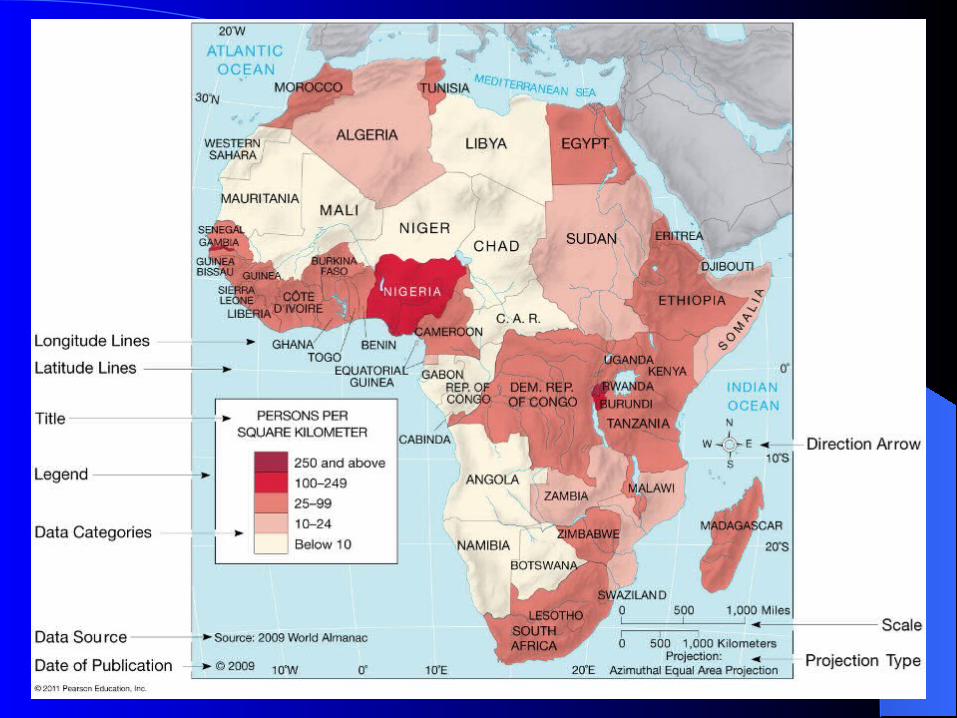
Introduction to Maps: Marginal Introduction to Maps: Marginal Information on MapsInformation on Maps
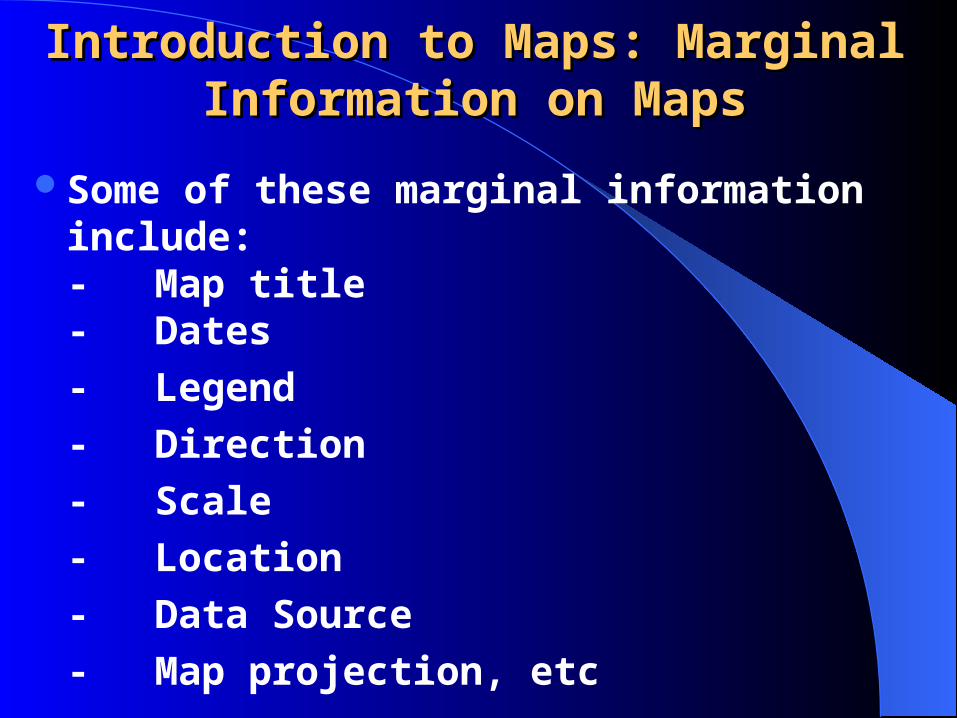
Some of these marginal information include:- Map title- Dates
- Legend
- Direction
- Scale
- Location
- Data Source
- Map projection, etc

Introduction to Maps: Marginal Introduction to Maps: Marginal Information on MapsInformation on Maps
Map Title:- It usually should reflect map content or purpose and identifies the area covered (e.g. Road Map of St. Louis)
Date:- Date of data collection and publication gives clear indication of how current or out-of- date the information on the map is

Introduction to Maps: Marginal Introduction to Maps: Marginal Information on MapsInformation on Maps
Legend:- Often shown as a box explaining symbols used on the map
- Symbols, colors, shadings used in representing features on the map explained
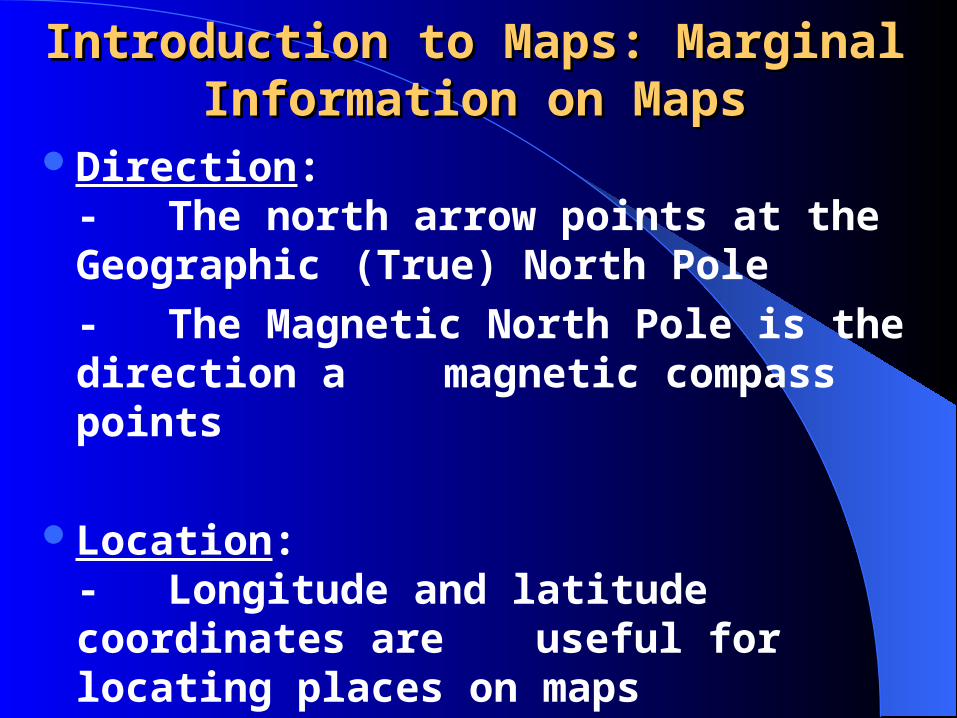
Direction:- Directions are indicated using geographic
grids (e.g. latitude and longitude) and north pointing arrow
Introduction to Maps: Marginal Introduction to Maps: Marginal Information on MapsInformation on Maps
Direction:- The north arrow points at the Geographic
(True) North Pole
- The Magnetic North Pole is the direction a magnetic compass points
Location:- Longitude and latitude coordinates are useful for locating places on maps

Introduction to Maps: Marginal Introduction to Maps: Marginal Information on MapsInformation on Maps
Map Scale:- Gives the relationship between length measures on the map and the corresponding distance on the ground
- Map scale helpful when measuring distances between points or calculating the area occupied by any geographic feature on map

Introduction to Maps: Marginal Introduction to Maps: Marginal Information on MapsInformation on Maps
Data Source:- Information on data source is important in establishing credibility of the final map
- It indicates the level of data quality and accuracy

Introduction to Maps: Map ProjectionIntroduction to Maps: Map Projection
The Earth is spherical in shape as represented by the globe
Introduction to Maps: Map ProjectionIntroduction to Maps: Map Projection
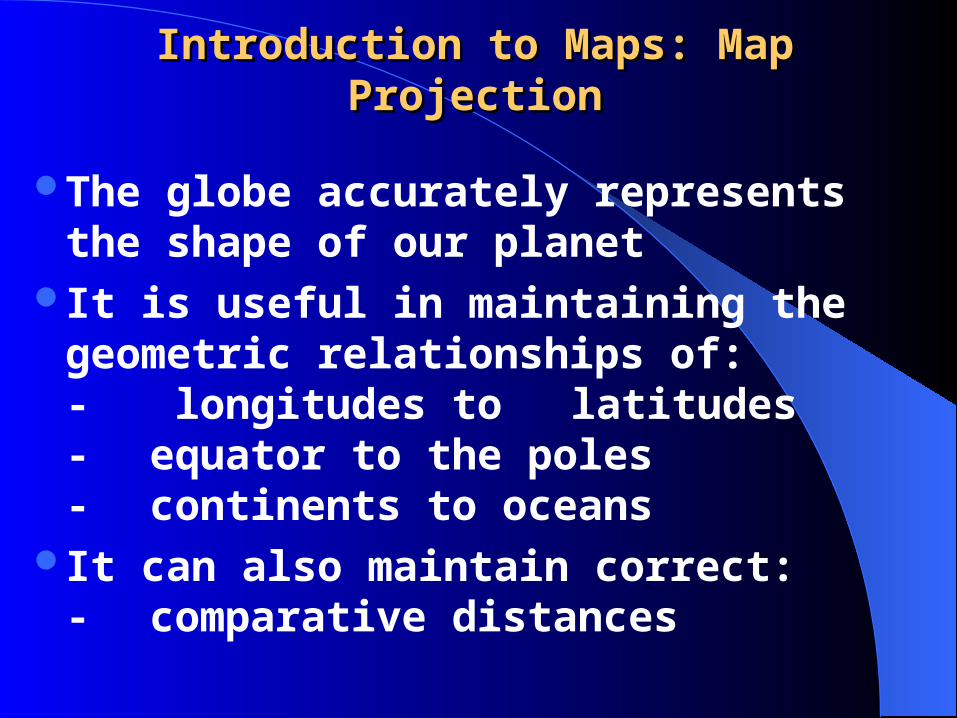
The globe accurately represents the shape of our planet
It is useful in maintaining the geometric relationships of:- longitudes to latitudes- equator to the poles- continents to oceans
It can also maintain correct:- comparative distances

Introduction to Maps: Map ProjectionIntroduction to Maps: Map Projection
Without distortion, the globe can also maintain correct: - comparative sizes and- directions
But the globe has its own problems:- only half of the globe can be viewed at
a time- only very little details can be displayed
on a globe

Introduction to Maps: Map ProjectionIntroduction to Maps: Map Projection
But the globe has its own problems:- globes are cumbersome to use and difficult to handle or carry around
- computations on globe surfaces require complex and difficult equipment and techniques
- globe construction is labor-intensive and costly

Introduction to Maps: Map ProjectionIntroduction to Maps: Map Projection
In order to overcome some of the problems of working with the globe, flat maps are preferred because:- flat maps are portable- less expensive to reproduce- easy to work with
But this comes with some costs and disadvantages that include:- it may lead to geometric distortions

Introduction to Maps: Map ProjectionIntroduction to Maps: Map Projection
But this comes with some costs and disadvantages that include:- violation of the continuity of the earth surface
- distortion of reality
- no true solutions to these problems hence all maps are not perfect
Introduction to Maps: Map ProjectionIntroduction to Maps: Map Projection
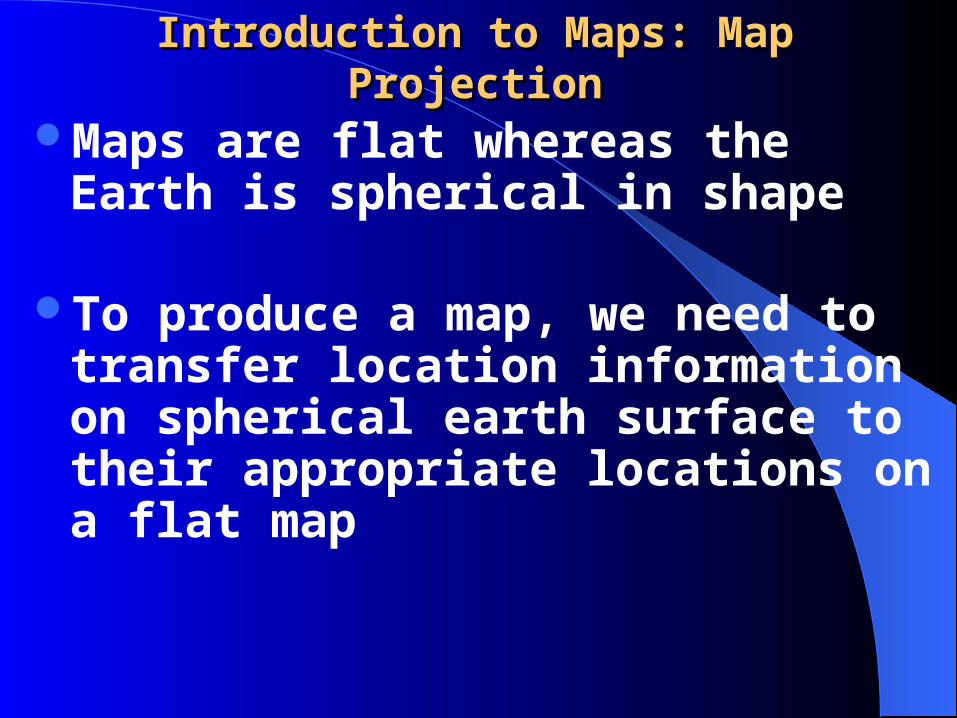
Maps are flat whereas the Earth is spherical in shape
To produce a map, we need to transfer location information on spherical earth surface to their appropriate locations on a flat map

Introduction to Maps: Map ProjectionIntroduction to Maps: Map Projection
The map projection process results in the distortion of four attributes of places on the globe:
- distance between points- place orientation or direction- actual shape - actual size (i.e. area)

Introduction to Maps: Map ProjectionIntroduction to Maps: Map Projection
The distortion problem progressively increases with the size of the globe being represented on a flat map
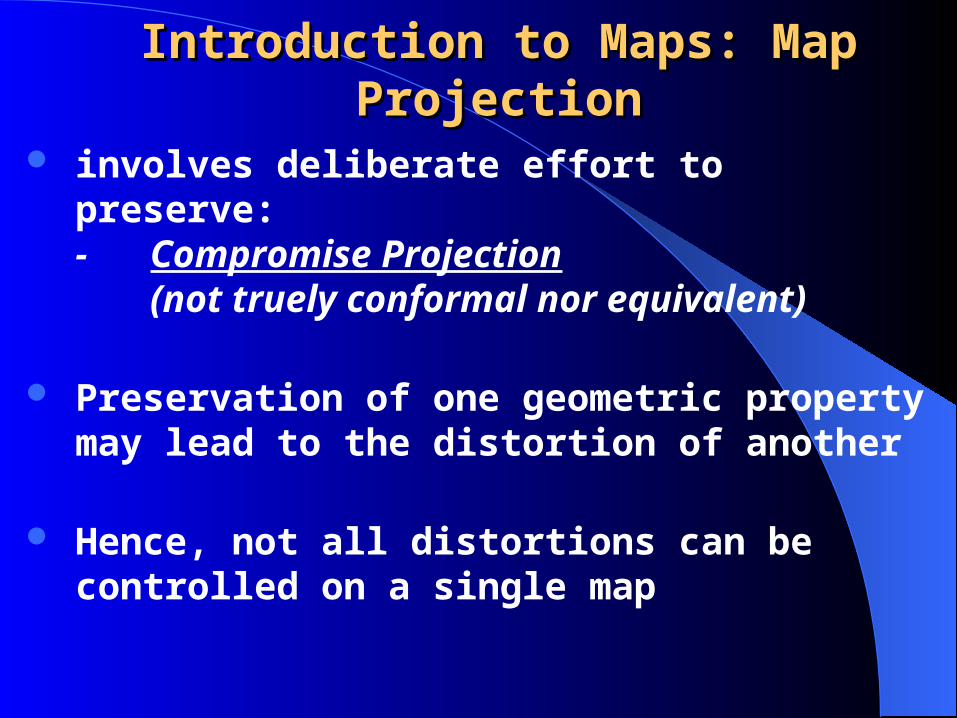
Common methods of map projections involves deliberate effort to preserve:
- Conformal Projection (shape & direction preservation)
- Equal-area or Equivalent Projection(size or area preservation)
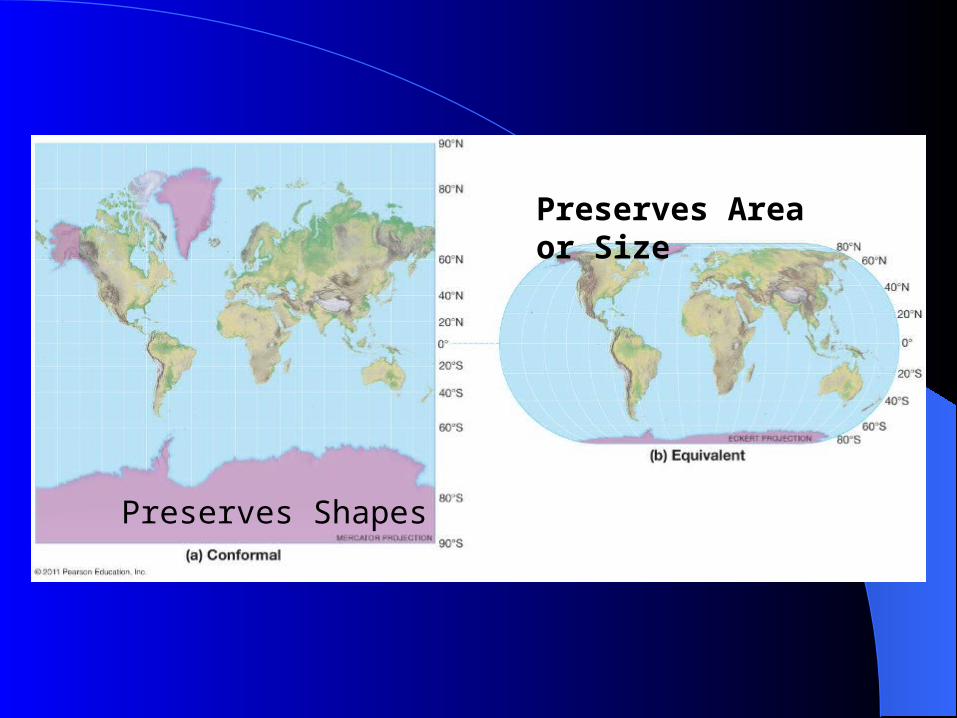
Preserves Area or Size
Preserves Shapes
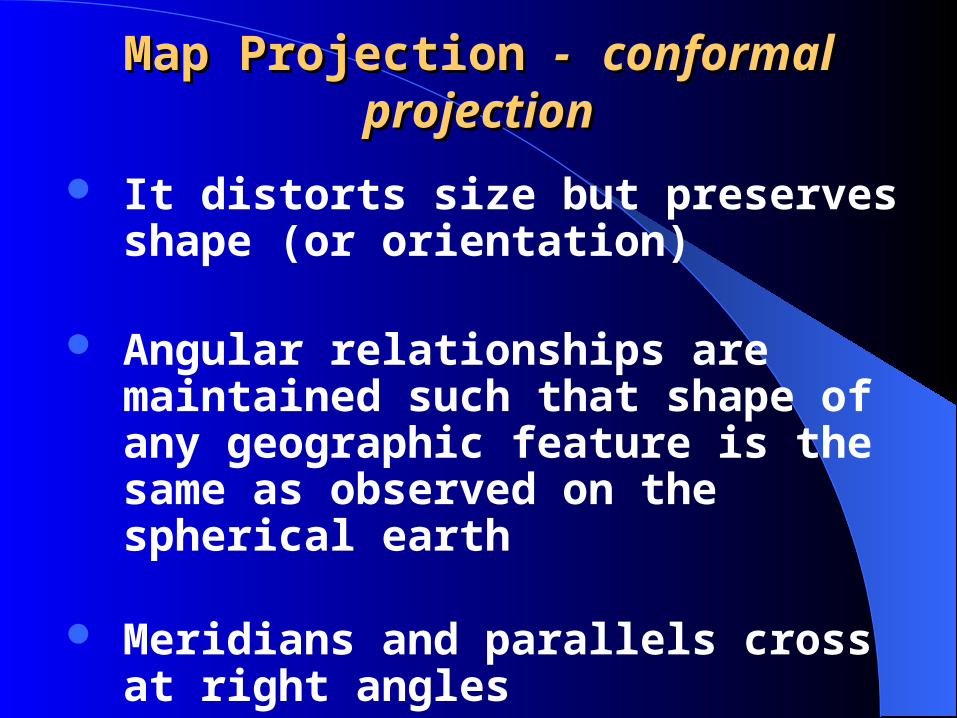
Map Projection Map Projection -- conformal projectionconformal projection
It distorts size but preserves shape (or orientation)
Angular relationships are maintained such that shape of any geographic feature is the same as observed on the spherical earth
Meridians and parallels cross at right angles
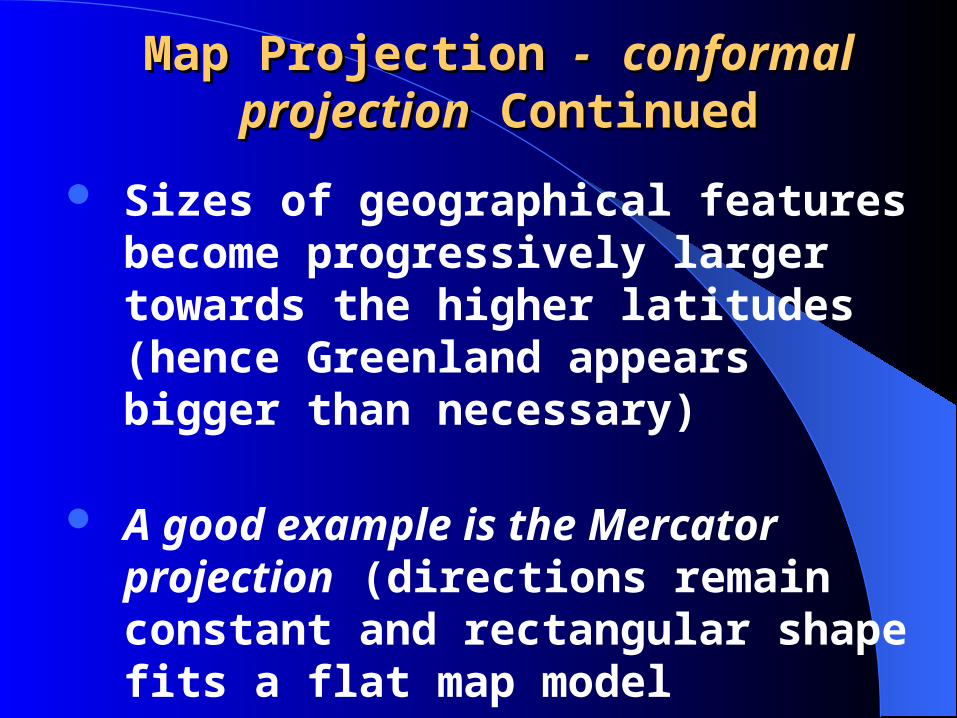
Map Projection Map Projection -- conformal conformal projectionprojection Continued Continued
Sizes of geographical features become progressively larger towards the higher latitudes (hence Greenland appears bigger than necessary)
A good example is the Mercator projection (directions remain constant and rectangular shape fits a flat map model

Map Projection Map Projection -- conformal & Equal conformal & Equal Area projectionsArea projections

Map Projection Map Projection -- Equal-area Equal-area projectionprojection
It preserves size but distorts shape and avoids misleading impressions of size
Great for showing distributions of geographic features
Shapes are sacrificed in order to maintain proper area relationships
Example: Lambert’s equal-area projection

Map Projection Map Projection -- Compromise Compromise ProjectionsProjections
Not purely conformal nor purely equivalent
Robinson’s Projection is in this category and ensures accurate shape and scale (size) representation
Introduction to Maps: Map ProjectionIntroduction to Maps: Map Projection
involves deliberate effort to preserve: - Compromise Projection
(not truely conformal nor equivalent)
Preservation of one geometric property may lead to the distortion of another
Hence, not all distortions can be controlled on a single map

Compromise Projection Between Conformal and Equivalence

Map Projections: Map Projections:
Types of Map Projections:- Cylindrical Projections- Plane Projection- Conic Projection- Pseudocylindrical Projection
Projection type based on main source of light:- gnomonic projection (center light source)- orthographic projection (outside the earth)- stereographic projection (earth surface light)
Map Projections: Cylindrical Projection Map Projections: Cylindrical Projection
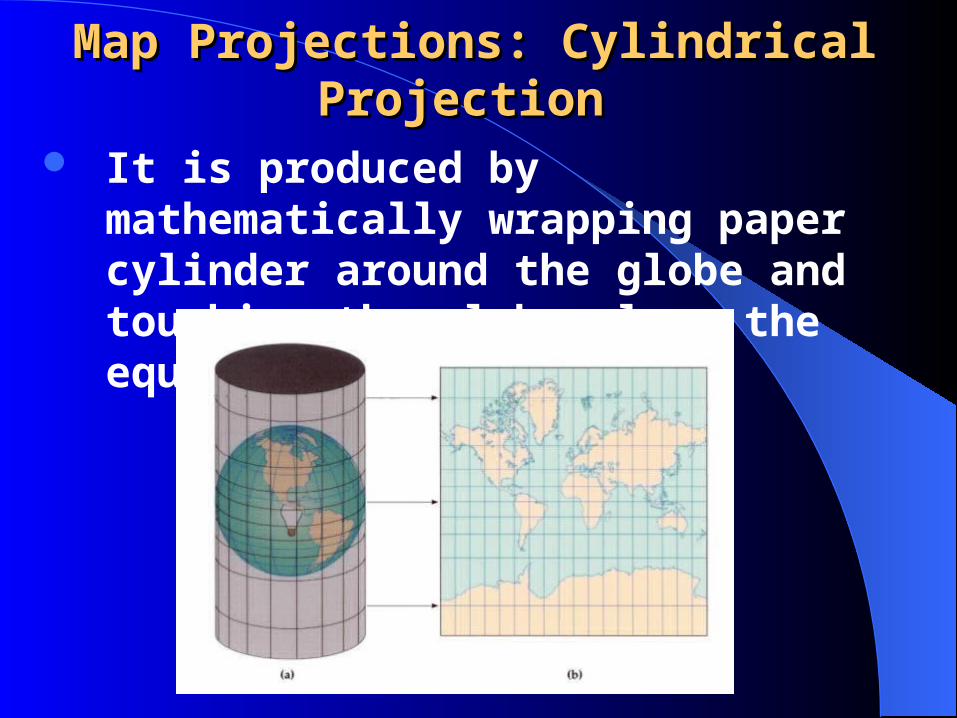
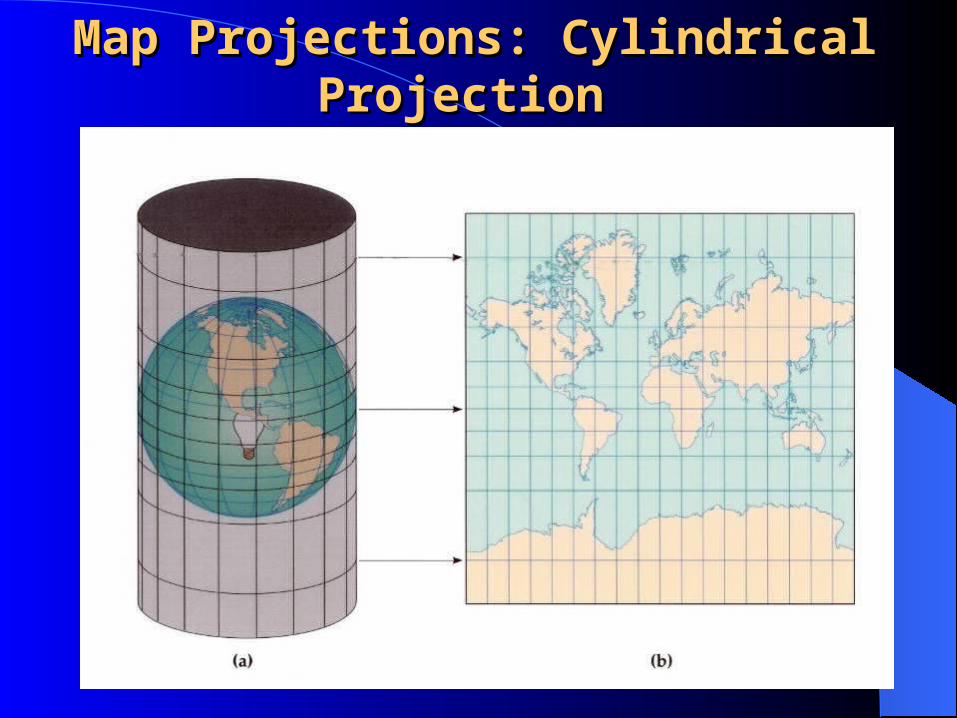
It is produced by mathematically wrapping paper cylinder around the globe and touching the globe along the equator
Map Projections: Cylindrical Projection Map Projections: Cylindrical Projection
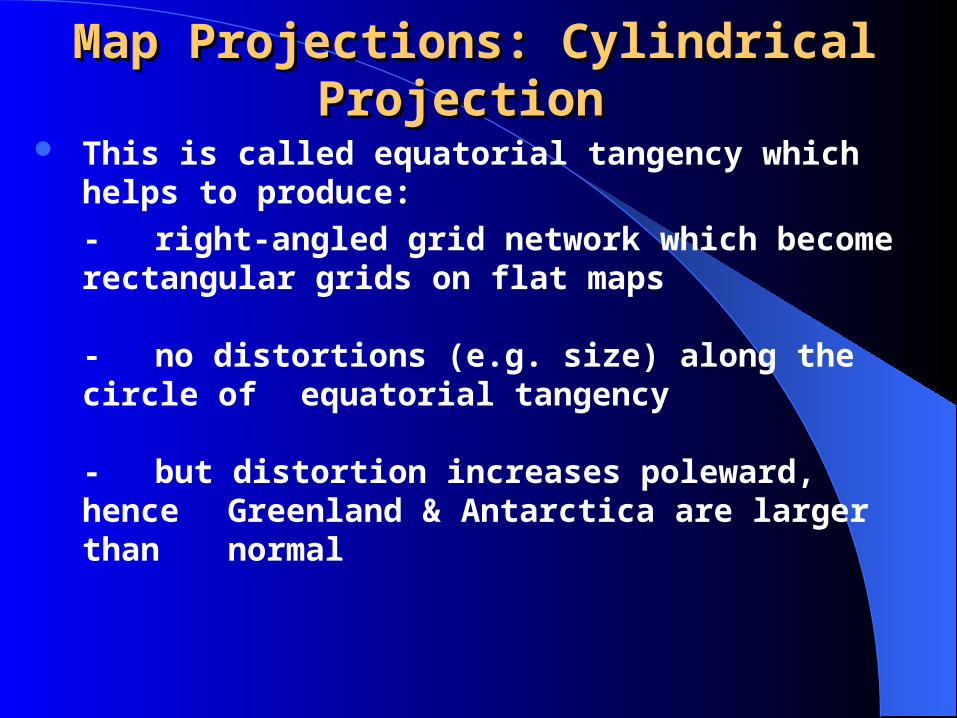
This is called equatorial tangency which helps to produce:
- right-angled grid network which become rectangular grids on flat maps
- no distortions (e.g. size) along the circle of equatorial tangency
- but distortion increases poleward, hence Greenland & Antarctica are larger than normal
Map Projections: Cylindrical Projection Map Projections: Cylindrical Projection

Map Projections: Cylindrical Projection Map Projections: Cylindrical Projection
Circle of tangency outside the equator are also used
Mercator projection is a good example of a cylindrical projection
Other examples of cylindrical projections: - Gall’s stereographic cylindrical projection - Lambert’s cylindrical Equal area Projection

Map Projections: Cylindrical Projection Map Projections: Cylindrical Projection
Could show the map of the whole world but often cut off in the higher latitudes because of distortion issues
Map Projections: Cylindrical Projection Map Projections: Cylindrical Projection
It preserves shapes (conformal) but distorts sizes on maps

Map Projections: Mercator Projection Map Projections: Mercator Projection
Developed in 1569 and remains the most famous of all projections
Originally designed to facilitate navigation by sailors
It is a conformal projection, hence:- preserves shapes- size distortion increases rapidly poleward

Map Projections: Mercator Projection Map Projections: Mercator Projection
It keeps the meridians parallel to one another instead of converging at the poles
This causes east-west stretching such that area or size is exaggerated by four times at lat. 60o and thirty-six times at lat. 80o
To maintain conformity, latitudes were spaced increasingly using mathematical formula to keep north-south stretching uniform


Map Projections: Mercator Projection Map Projections: Mercator Projection
It shows loxodrome or rhump line as straight line
A loxodrome is a straight line anywhere on a map and in any direction oblique to the grid lines and maintain a constant compass direction
Light source at the globe centre

Map Projections: Mercator Projection Map Projections: Mercator Projection
Great Circle route on a spherical Earth surface

Map Projections: Mercator Projection Map Projections: Mercator Projection
On Mercator Projection, the curved Great Circle approximated with four loxodromes

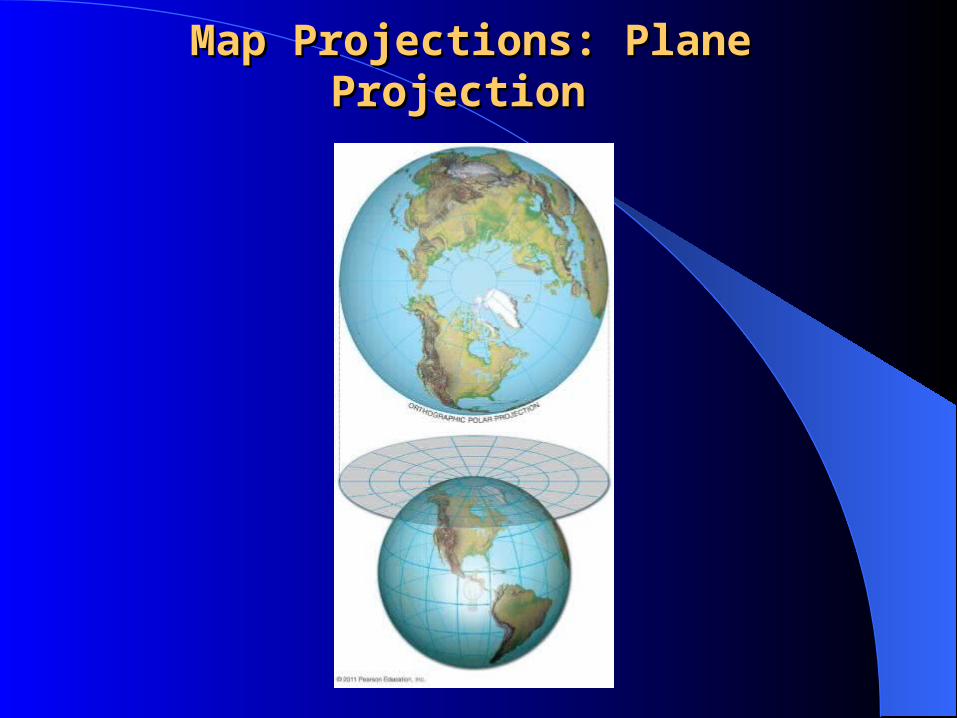
Map Projections: Plane Projection Map Projections: Plane Projection
It is also called azimuthal projection or zenith projection
It is a projection of the Earth on a flat paper placed on any point of the globe though polar tangency is common
Distortion increases away from point of tangency
No more than half of the globe can ne displayed
Map Projections: Plane Projection Map Projections: Plane Projection
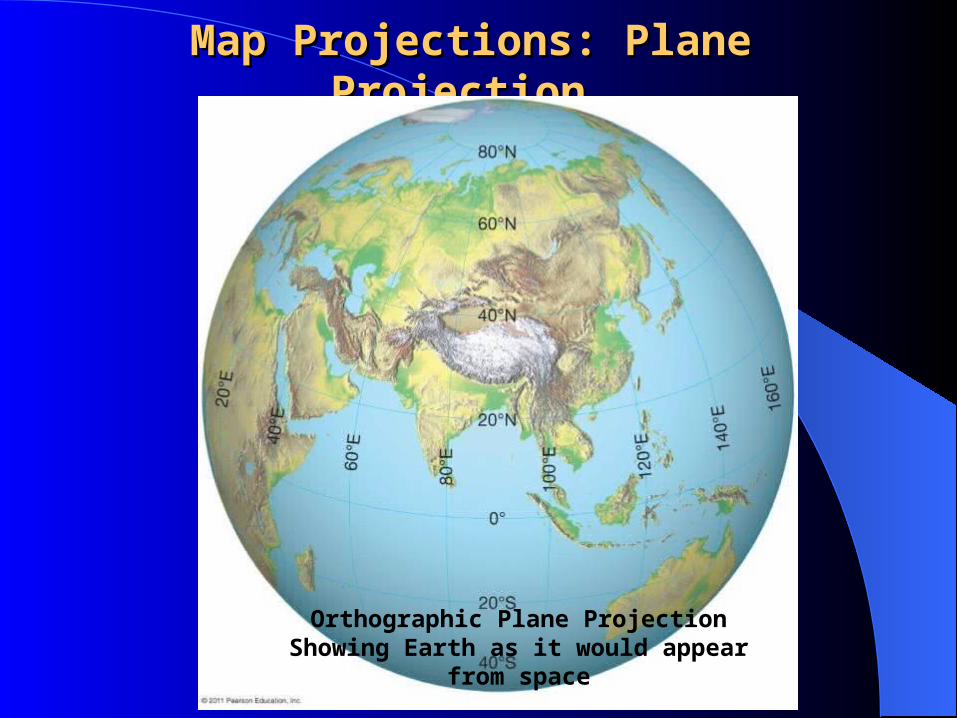
Map Projections: Plane Projection Map Projections: Plane Projection
Orthographic Plane Projection Showing Earth as it would appear from space

Map Projection – Conic ProjectionMap Projection – Conic Projection
It is a projection onto a cone surface with its apex placed above the pole

Map Projection – Conic ProjectionMap Projection – Conic Projection
Latitudes are projected as concentric arcs of circles
Meridians are projected as straight lines radiating from the apex of the cone
Map Projection – Conic ProjectionMap Projection – Conic Projection
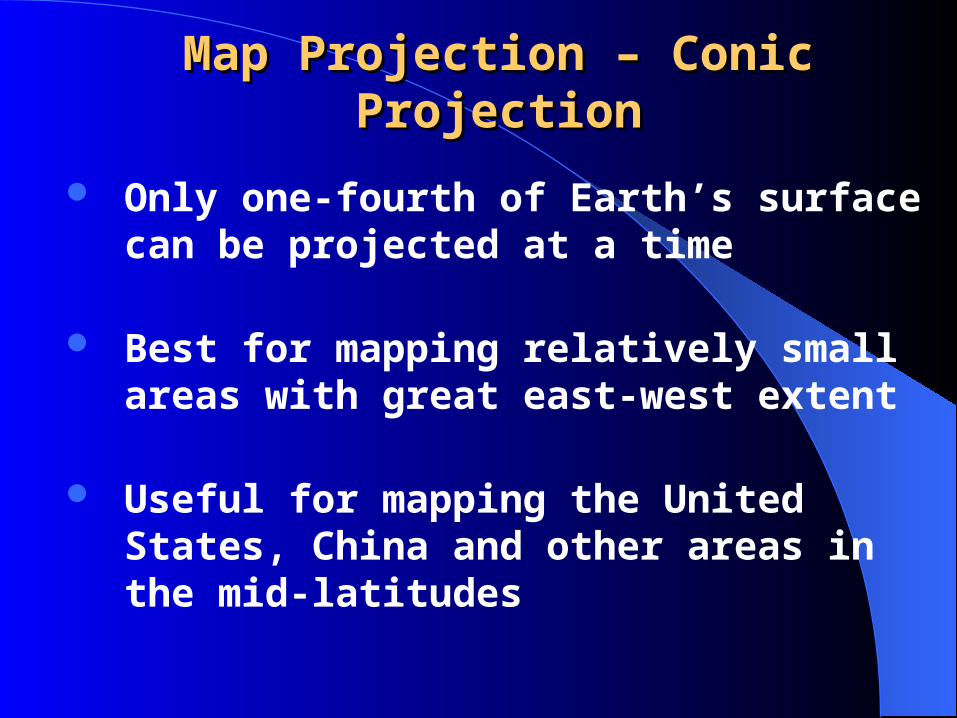
Only one-fourth of Earth’s surface can be projected at a time
Best for mapping relatively small areas with great east-west extent
Useful for mapping the United States, China and other areas in the mid-latitudes

Map Projection – Conic ProjectionMap Projection – Conic Projection
Map distortion increases away from the apex of the cone
Conic Projector

Map Projection – Pseudocylindrical ProjectionMap Projection – Pseudocylindrical Projection
It is also called:- elliptical projection- oval projection
Used in mapping the entire globe
But smaller areas could be mapped if located at the central parallel meeting the central meridian with the least distortion
Map Projection – Pseudocylindrical ProjectionMap Projection – Pseudocylindrical Projection
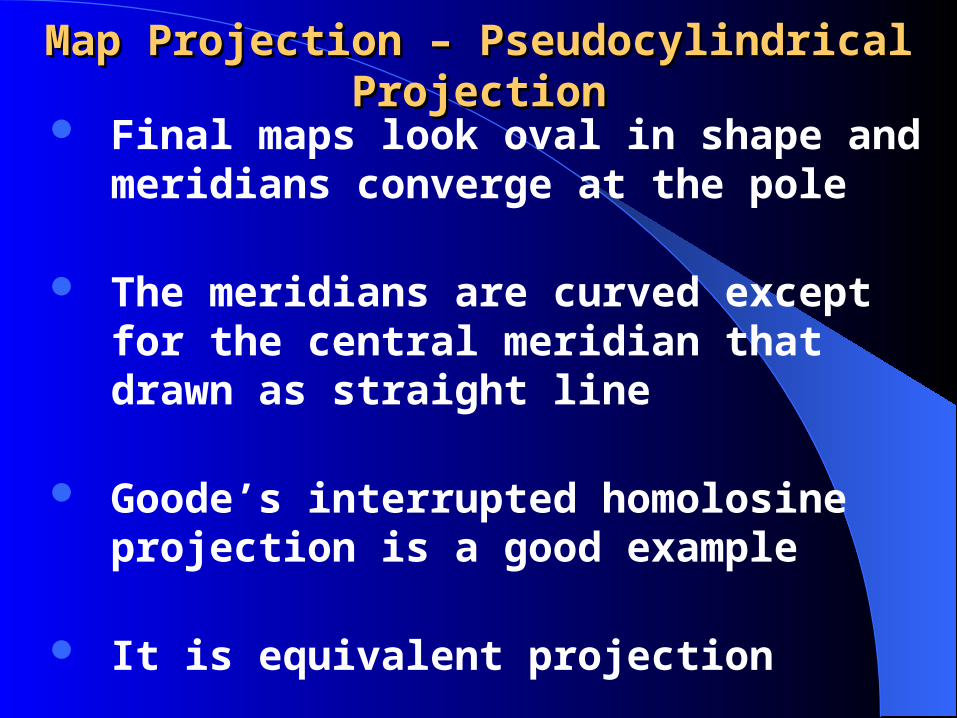
Final maps look oval in shape and meridians converge at the pole
The meridians are curved except for the central meridian that drawn as straight line
Goode’s interrupted homolosine projection is a good example
It is equivalent projection
Map Projection – Pseudocylindrical ProjectionMap Projection – Pseudocylindrical Projection
But also maintains the shapes of continental coastlines
Projection is interrupted in the oceans to greatly reduce shape and size distortions
It distorts shapes of areas in the high latitudes
Hence, Goode splits his map in the southern oceans at selected meridians


IsolinesIsolinesIsolines are lines joining places of equal valuesThere are many types of Isolines:
- Isobar: Line joining places with the same pressure value or line of constant pressure
- Isotherm: Line joining places with the same temperature value or line of constant
temperature- Isoamplitude: Line joining places with the
same wave amplitude or line of constant wave amplitude

IsolinesIsolines
- Isohyet: Line joining places with the same rain fall value or line of rain

IsolinesIsolines

IsolinesIsolines

IsolinesIsolines
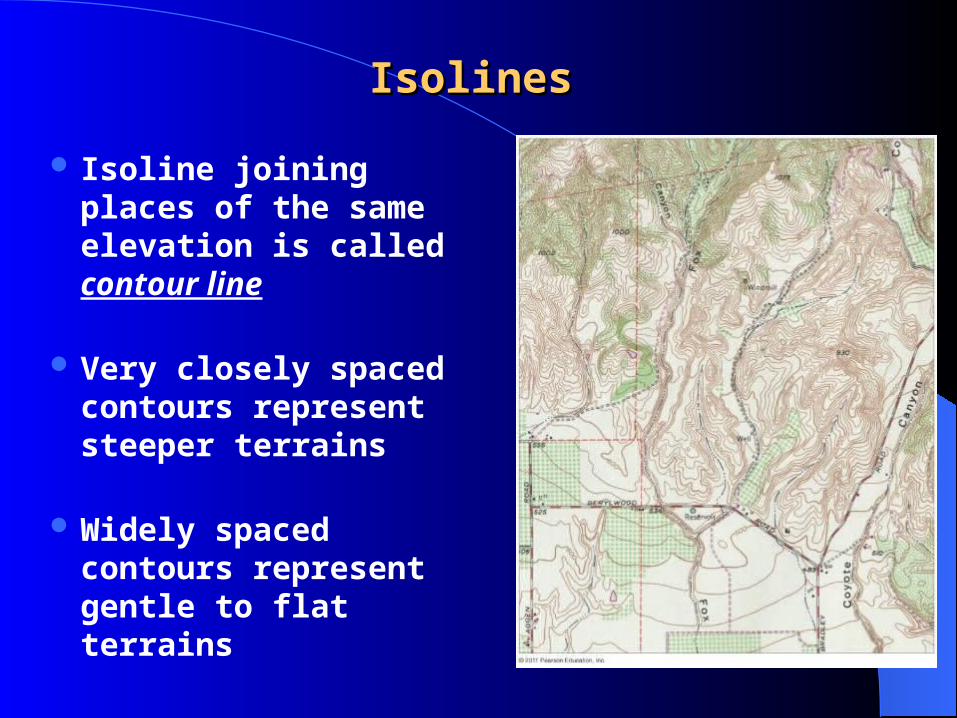
Isoline joining places of the same elevation is called contour line
Very closely spaced contours represent steeper terrains
Widely spaced contours represent gentle to flat terrains

GPS: Global Positioning SystemGPS: Global Positioning System
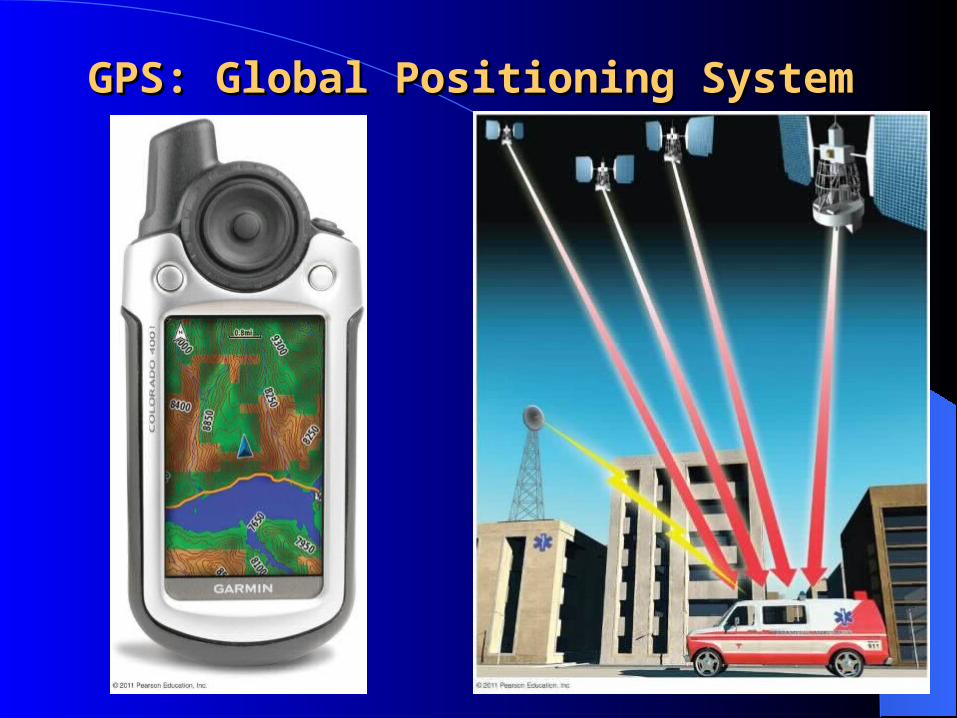
GPS is global navigational satellite system for determining the location of a place
Developed in the 1970s and 1980s by the US DOD and once called NAVSTAR GPS (Navigation Signal Timing and Ranging GPS)
It consists of at least 24 high-altitude satellites with a minimum of four to six in view at any location
GPS: Global Positioning SystemGPS: Global Positioning System

GPS: Global Positioning SystemGPS: Global Positioning System
GPS accuracy may fall within ±15 metersWide Area Augmentation System (WAAS) has
significantly improved GPS accuracy to ±3 meters
WAAS ground-based stations monitor satellite signals & generate correction signal to GPS units.
NOAA Continuously Operating GPS Reference Stations (CORS) detect location changes of <1cm

GPS: Global Positioning SystemGPS: Global Positioning System
GPS applications include:
- earthquake forecasting- ocean floor mapping and mapping in general- volcanic monitoring- data collection and damage assessment- navigation GPS in vehicles- military uses, etc
Remote Sensing: IntroductionRemote Sensing: Introduction
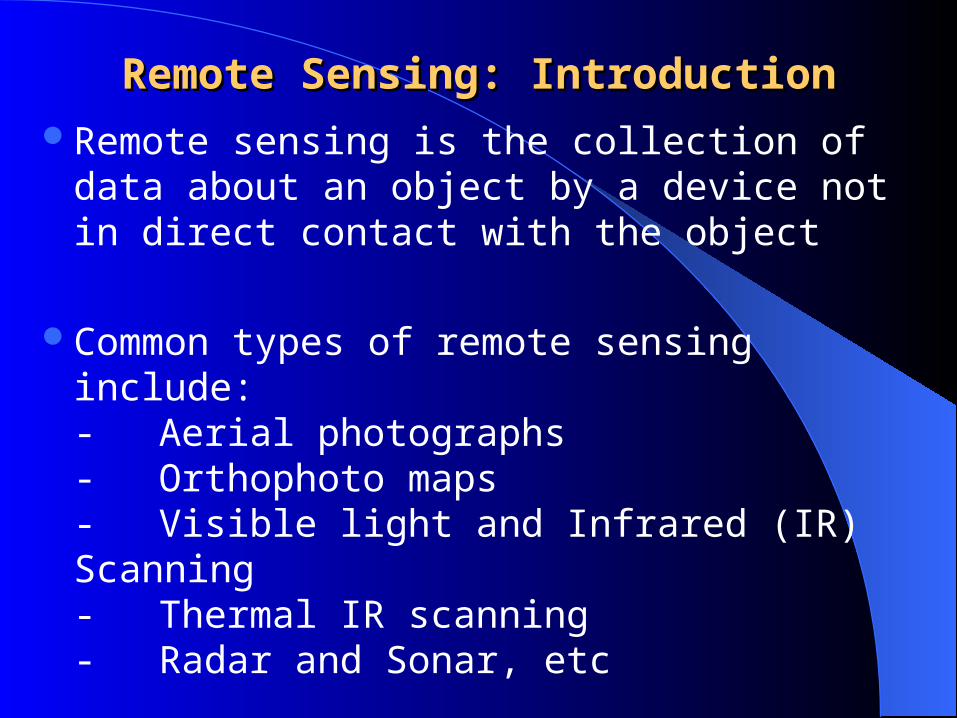
Remote sensing is the collection of data about an object by a device not in direct contact with the object
Common types of remote sensing include:- Aerial photographs- Orthophoto maps- Visible light and Infrared (IR) Scanning- Thermal IR scanning- Radar and Sonar, etc

Remote Sensing: IntroductionRemote Sensing: Introduction
Remote sensing originally involved the use of airplanes but today 100s of satellites are used
Satellites in low orbits of less than 20,000km orbit the earth taking photographs
Satellites on geosynchronous orbit (36,000km) remain in one spot to gather data

Remote Sensing: Aerial PhotographyRemote Sensing: Aerial Photography
Aerial photograph taken for some height above the ground using:- balloons (France 1858 & USA 1860)- airplane (as from WW1 1914-1918)- rockets
Based on camera angle, aerial photographs are classified as:- vertical (great for precise measurement)- oblique (measurement is more difficult)
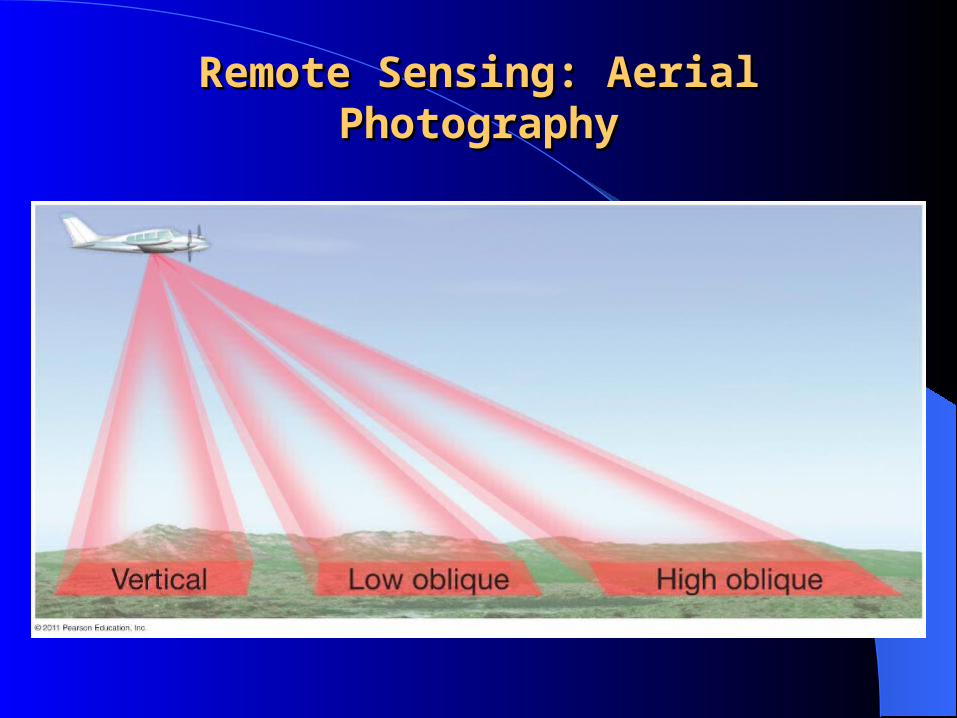
Remote Sensing: Aerial PhotographyRemote Sensing: Aerial Photography

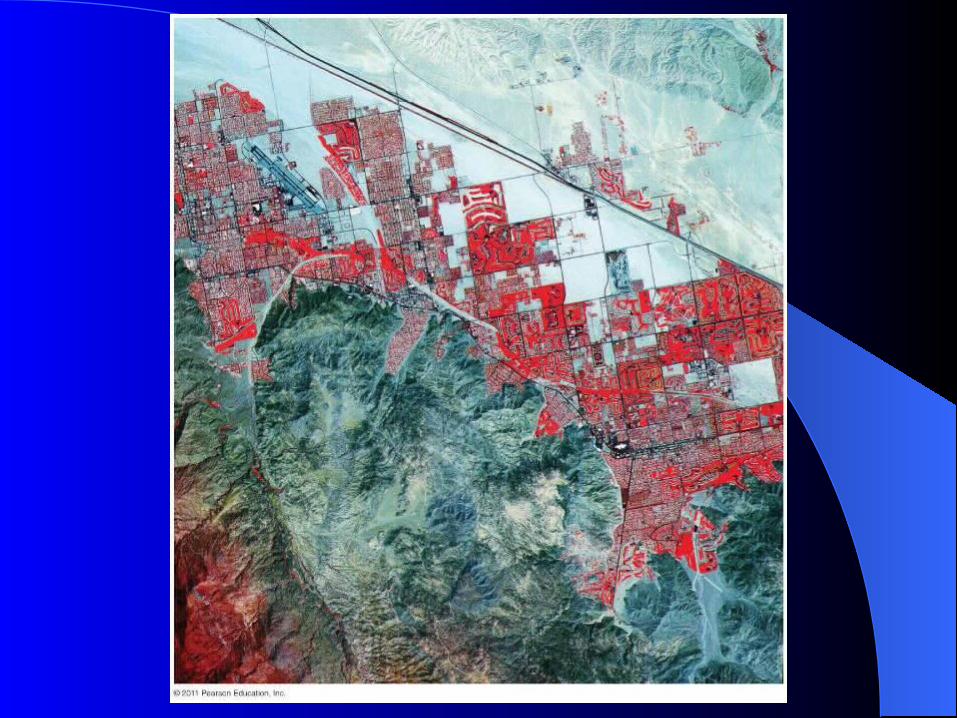
Remote Sensing: Orthophoto MapsRemote Sensing: Orthophoto Maps
Orthophoto maps are derived from aerial photographs and images
Distortions caused by camera tilt and difference in ground elevation are removed
Shows landscapes in greater details, multicolored; and great for showing low-lying areas
Georeferenced; distance measurement is possible

ORTHOPHOTO MAP

Remote Sensing: Visible Light & InfraredRemote Sensing: Visible Light & InfraredUses cameras with films sensitive to the
visible light or Infrared portions of the electromagnetic spectrum


Remote Sensing: Visible Light and Remote Sensing: Visible Light and Infrared SensingInfrared Sensing
Conventional photographic films were only sensitive to visible light but other wavelengths could produce more information omitted by visible light
During WWII Infrared sensing using electronic sensors or films sensitive to near infrared wavelength was introduced

Remote Sensing: Visible Light and Remote Sensing: Visible Light and Infrared SensingInfrared Sensing
IR imagery produces false-color images such that:- healthy vegetation is red - bare ground is gray-blue
IR imagery is useful for the identification and evaluation of vegetation
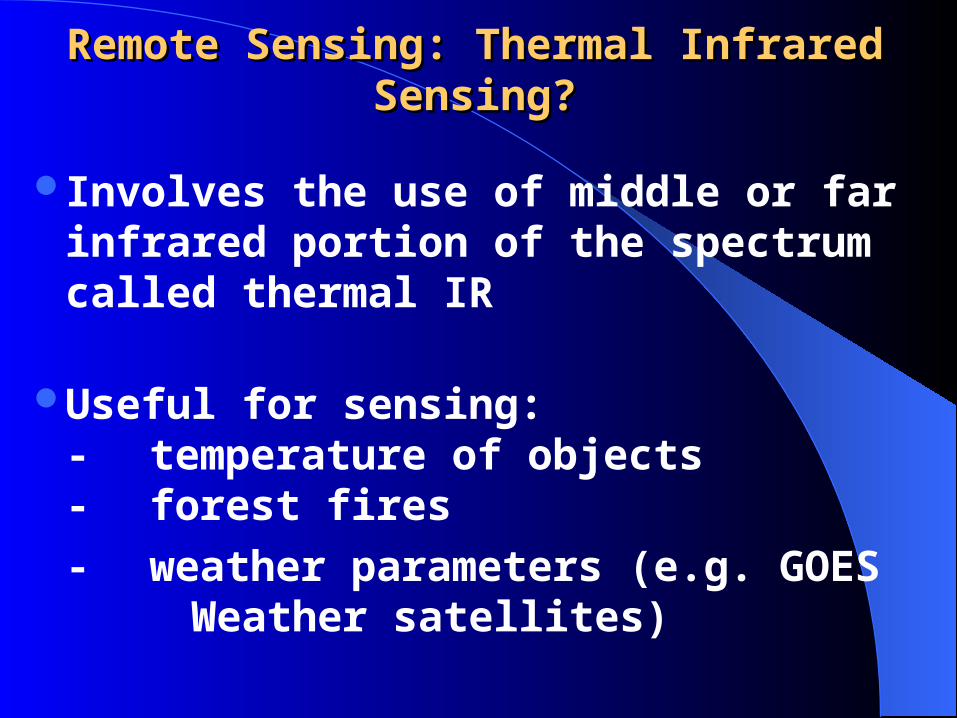
Remote Sensing: Thermal Infrared Remote Sensing: Thermal Infrared Sensing?Sensing?
Involves the use of middle or far infrared portion of the spectrum called thermal IR
Useful for sensing:- temperature of objects- forest fires
- weather parameters (e.g. GOES Weather satellites)

Remote Sensing: Multispectral Remote Remote Sensing: Multispectral Remote SensingSensing
Involves multiband sensing
Satellites equipped with instruments imaging at several regions of the electromagnetic spectrum simultaneously

Remote Sensing: Multispectral Remote Remote Sensing: Multispectral Remote SensingSensing
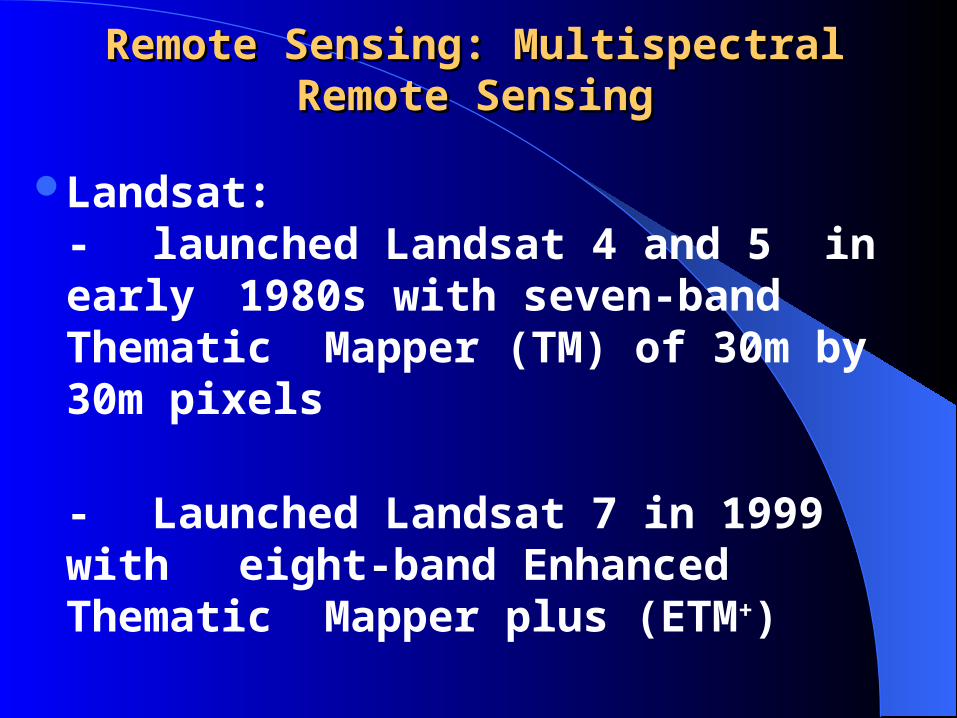
Examples of multispectral Sensing systems:- Landsat- SPOT- IRIS
Landsat:- launched a four-band multispectral Scanning System (MSS) with a scene of 115 by 106 miles
Remote Sensing: Multispectral Remote Remote Sensing: Multispectral Remote SensingSensing
Landsat:- launched Landsat 4 and 5 in early 1980s with seven-band Thematic Mapper (TM) of 30m by 30m pixels
- Launched Landsat 7 in 1999 with eight-band Enhanced Thematic Mapper plus (ETM+)

Remote Sensing: Multispectral Remote Remote Sensing: Multispectral Remote SensingSensing
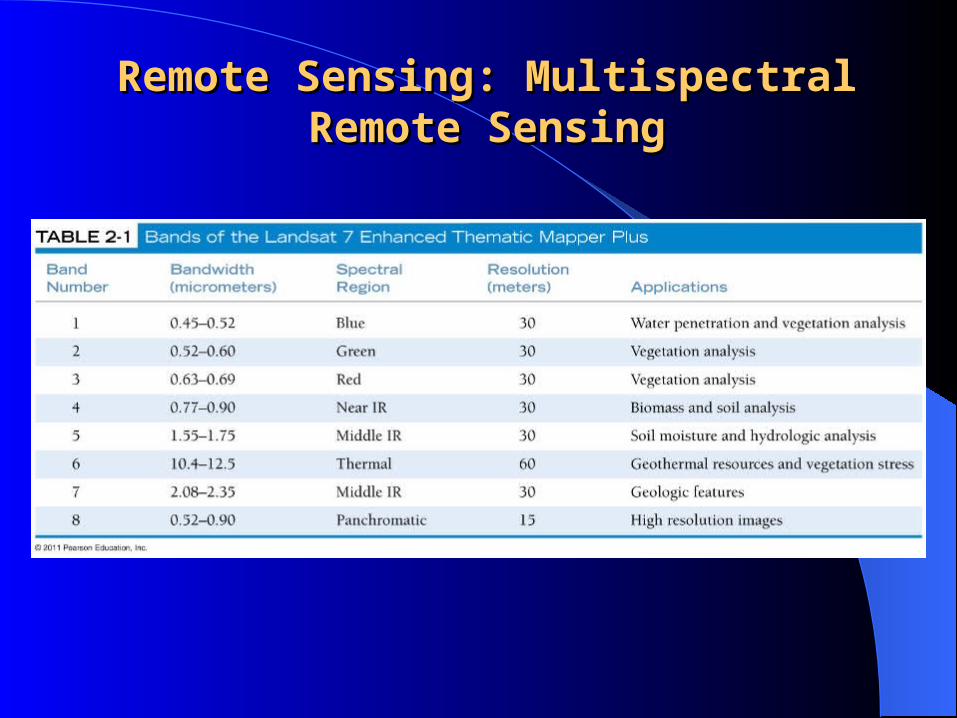
Remote Sensing: Multispectral Remote Remote Sensing: Multispectral Remote SensingSensing

Geographical Information System (GIS)Geographical Information System (GIS)
It is a database management system that facilitates the collection, analysis and display of geographic data
Owes its origin to a group of new computer-based technologies developed in surveying, photogrammetry, cartography, spatial statistics, and remote sensing
It has the ability to accept digital satellite imageries and other data sources

Geographical Information System (GIS)Geographical Information System (GIS)
It stores the geo-referenced data and integrates multi-layers of attributes of a place into a single usable map
GIS accepts both raster-based (rectangular grid cells) and vector-based (points, lines or polygon) data
It could be used to analyze both environmental and social processes

REVIEW QUESTIONS FOR TOPIC 2REVIEW QUESTIONS FOR TOPIC 2
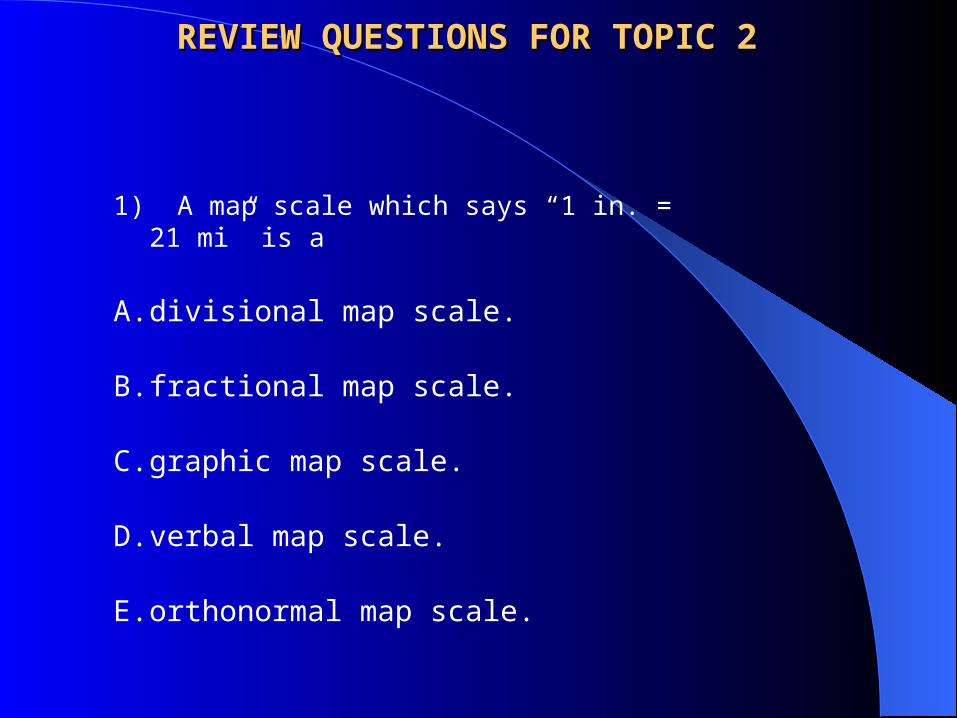
1) A map scale which says “1 in. = 21 mi” is a
A. divisional map scale.
B. fractional map scale.
C. graphic map scale.
D. verbal map scale.
E. orthonormal map scale.

1) A map scale which says “1 in. = 21 mi” is a1) A map scale which says “1 in. = 21 mi” is a
A. divisional map scale.
B. fractional map scale.
C. graphic map scale.
D. verbal map scale.
E. orthonormal map scale.
Explanation: A verbal map scale tells you, with words, what the relationshipbetween area on the map and area on Earth is.
Figure 2-4

A. Cartography
B. Geographic Information systems
C. Remote Sensing
D. Global positioning systems
E. Geomatic engineering
Figure 2-29
2) _____________ are automated systems for the 2) _____________ are automated systems for the capture, storage, retrieval, analysis, and displaycapture, storage, retrieval, analysis, and displayof spatially referenced data.of spatially referenced data.

A. Cartography
B. Geographic Information systems
C. Remote Sensing
D. Global positioning systems
E. Geomatic engineering
2) _____________ are automated systems for the 2) _____________ are automated systems for the capture, storage, retrieval, analysis, and displaycapture, storage, retrieval, analysis, and displayof spatially referenced data.of spatially referenced data.
Explanation: By definition, geographic information systems are computer-basedsystems which store, retrieve, analyze, and display spatial data.
Figure 2-29

A. Microwaves
B. X-rays
C. Visible waves
D. Infrared waves
E. Radio waves are the longest waves
3) Radar systems use radio waves as a means for 3) Radar systems use radio waves as a means for remote sensing. Radio waves are shorter than remote sensing. Radio waves are shorter than which of these waves in the electromagnetic which of these waves in the electromagnetic spectrum?spectrum?
Explanation: On the electromagnetic spectrum (Figure 2-22), radio waves have the longest wavelengths of all types of electromagnetic radiation.
Figure 2-22

A. isotherms.
B. isobars.
C. isohyets.
D. contour lines.
E. isogonic lines.
4) 4) IsolineIsoline is a generic term that refers to lines joining is a generic term that refers to lines joiningplaces of equal value or something. places of equal value or something. IsolinesIsolines joining places of equal elevation are known asjoining places of equal elevation are known as
Figure 2-15
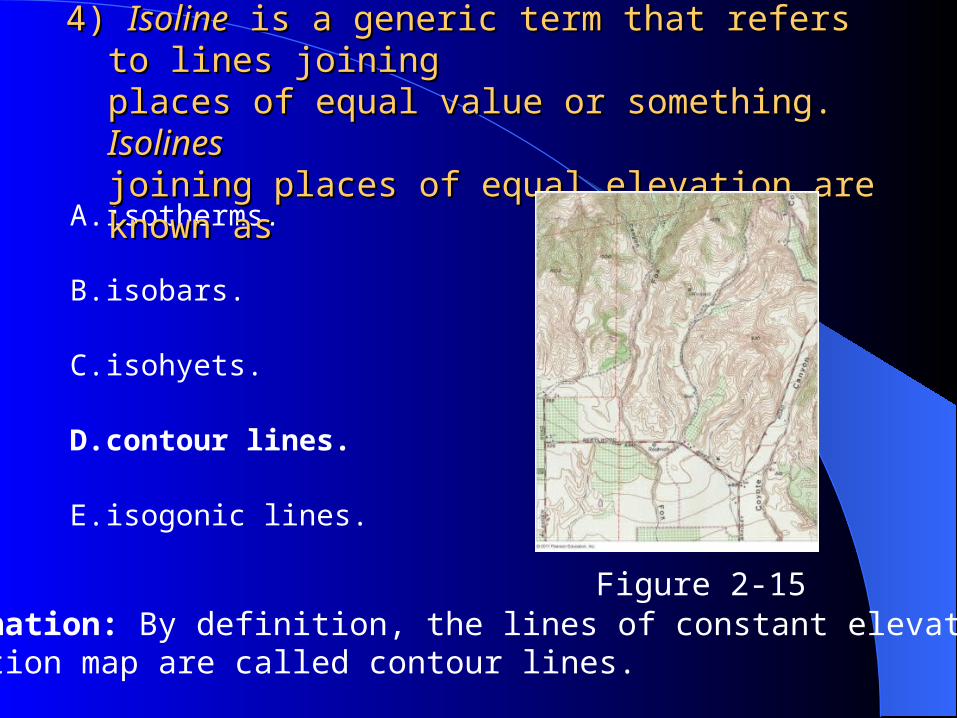
A. isotherms.
B. isobars.
C. isohyets.
D. contour lines.
E. isogonic lines.
4) 4) IsolineIsoline is a generic term that refers to lines joining is a generic term that refers to lines joiningplaces of equal value or something. places of equal value or something. IsolinesIsolines joining places of equal elevation are known asjoining places of equal elevation are known as
Explanation: By definition, the lines of constant elevation on aelevation map are called contour lines.
Figure 2-15

A. conformal.
B. equivalent.
C. cylindrical.
D. Mercator.
E. isotropic.
5) Map projections that preserve the correct shapes 5) Map projections that preserve the correct shapes of places and compromise area are known asof places and compromise area are known as
Figure 2-7
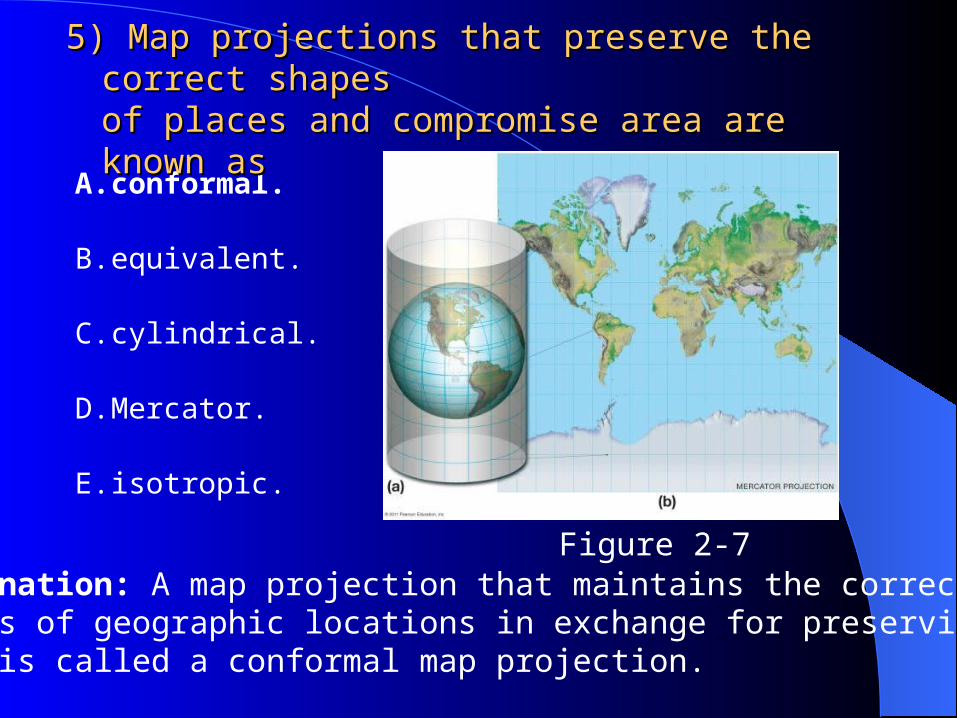
A. conformal.
B. equivalent.
C. cylindrical.
D. Mercator.
E. isotropic.
5) Map projections that preserve the correct shapes 5) Map projections that preserve the correct shapes of places and compromise area are known asof places and compromise area are known as
Explanation: A map projection that maintains the correctshapes of geographic locations in exchange for preserving their size is called a conformal map projection.
Figure 2-7

A. are illegible compared to maps.
B. are hard to read.
C. are cumbersome.
D. do not maintain the correct geometric relationship between locations.
E. are inaccurate when compared to maps.
6) Globes are less frequently used than maps 6) Globes are less frequently used than maps except for classroom purposes. This is because except for classroom purposes. This is because globesglobes
Figure 2-6

A. are illegible compared to maps.
B. are hard to read.
C. are cumbersome.
D. do not maintain the correct geometric relationship between locations.
E. are inaccurate when compared to maps.
6) Globes are less frequently used than maps 6) Globes are less frequently used than maps except for classroom purposes. This is because except for classroom purposes. This is because globesglobes
Explanation: Globes have many advantages and disadvantages. They maintain the correct geometric locations of places on Earth, but are large and bulky, making them inconvenient for settings outside of a classroom.
Figure 2-6
A. Satellites
B. Radar
C. Global positioning system
D. Aerial photography
E. Lambert-conformal maps
7) Which of the following is not an example of a 7) Which of the following is not an example of a remote sensing system?remote sensing system?

A. Satellites
B. Radar
C. Global positioning system
D. Aerial photography
E. Lambert-conformal maps
7) Which of the following is not an example of a 7) Which of the following is not an example of a remote sensing system?remote sensing system?
Explanation: Lambert-conformal maps are a special type of conformal map projection. As a result, they are not a type of remote sensing system.

A. the history of the map.
B. what direction is north.
C. the map projection.
D. how to interpret the map.
E. latitude and longitude.
8) The map legend tells you8) The map legend tells you
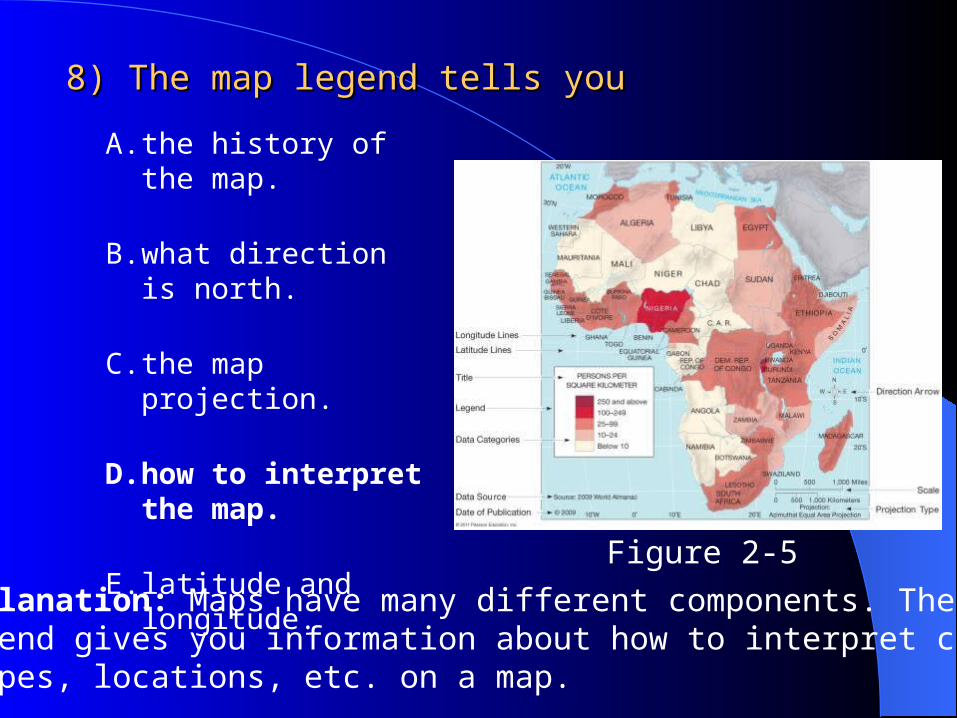
A. the history of the map.
B. what direction is north.
C. the map projection.
D. how to interpret the map.
E. latitude and longitude.
8) The map legend tells you8) The map legend tells you
Explanation: Maps have many different components. The map legend gives you information about how to interpret colors, shapes, locations, etc. on a map.
Figure 2-5

A. show the exact size and height of physical features.
B. represent an enlargement of a section of Earth.
C. resolve misunderstandings regarding positional relationships on Earth’s surface.
D. show as much spatial information as the paper can possibly hold.
E. show the distribution of selected phenomena.
9) 9) Maps nearly always have a special purpose. Maps nearly always have a special purpose. This purpose is toThis purpose is to
Figure 2-2b

A. show the exact size and height of physical features.
B. represent an enlargement of a section of Earth.
C. resolve misunderstandings regarding positional relationships on Earth’s surface.
D. show as much spatial information as the paper can possibly hold.
E. show the distribution of selected phenomena.
9) 9) Maps nearly always have a special purpose. Maps nearly always have a special purpose. This purpose is toThis purpose is to
Explanation: A map’s purpose is to provide a spatial distribution of desired phenomena.
Figure 2-2b

A. uses satellite measurements to provide navigation on Earth’s surface.
B. is based off of radar.
C. only works in urban areas.
D. provides location based on miles from a major city.
E. allows for the layering of maps on each other.
10) 10) The global positioning system (GPS)The global positioning system (GPS)
Explanation: The GPS system is a remote sensing system that is used to identify locations on Earth based on latitude and longitude.
Figure 2-19