
Why do educational research? Merrilyn Goos The University of Queensland.
Upload
jonathan-washingtonCategory
view
220download
0
TOPAZ the Arctic TEP
and the Arctic GOOS
L. Bertino, G. Evensen, K.A. Lisæter, I. Keghouche
Arctic GOOS opening, Bergen, 12th Sept. 2006

Analysis 1st Sept. 2006
Earth

TOPAZ
System DescriptionModel componentsAssimilation method
Upgrades

Motivation
Objective: Provide short-term forecasts of physical and biogeochemical
parameters targeted to users needs (primarily the offshore oil and gas industry)
Strategy Focus on advanced data assimilation techniques Gradual increase of resolution Nesting on regions of higher interest
Support TOPAZ is the Arctic component of MERSEA IP ESA, Industry, private donation (Frank Mohn AS, Bergen)

The TOPAZ model system
TOPAZ: Atlantic and Arctic 18-35 km resolution 22 vertical layers
Assimilates SLA (4 satellite altimeters), SST (from AVHRR), ice concentrations (SSM/I)
Run weekly, ECMWF forcing Provides nesting conditions to
high-res. models

Ice concentration data
Passive MW (NSIDC) Real-time data set (2-3 days
delay) NORSEX algorithm
(Svendsen et al 1983) 37GHz, 19GHz ~25 km resolution

Ice extent and ice volume
Solid black line - ensemble meanDashed black line - free runGrey - individual ensemble members

Barents Sea
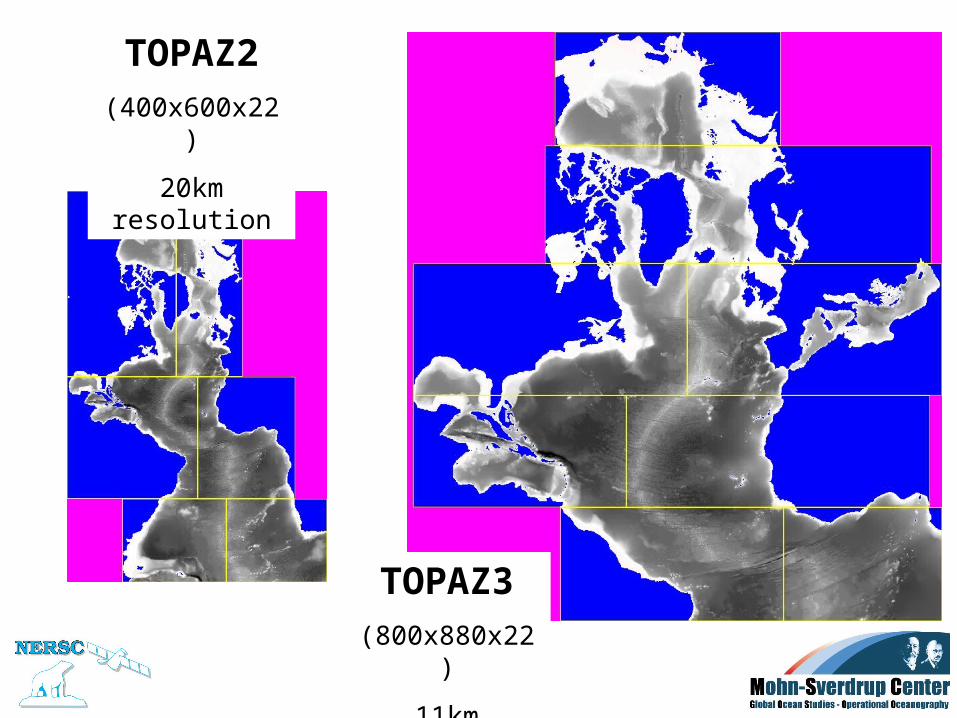
TOPAZ2(400x600x22)
20km resolution
TOPAZ3(800x880x22)
11km resolution

TOPAZ UpgradeStronger W. Spitzberg Current
TOPAZ3TOPAZ2

CERSAT - IFREMER

The Arctic TEP Thematic Portal
Common ViewingDownloadingDownscaling
ValidationPlan
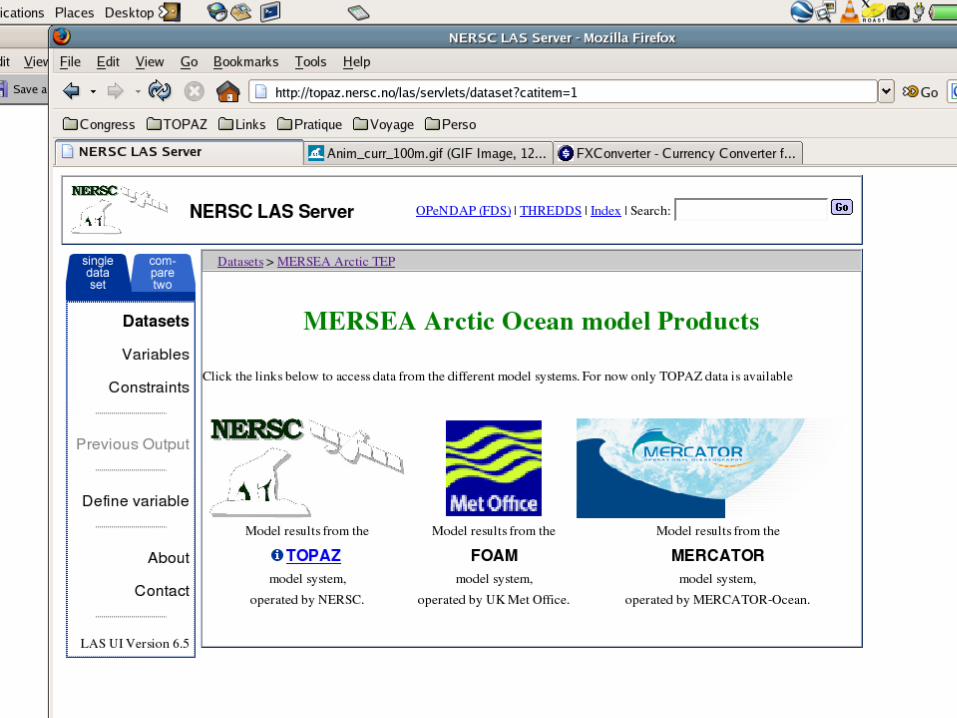
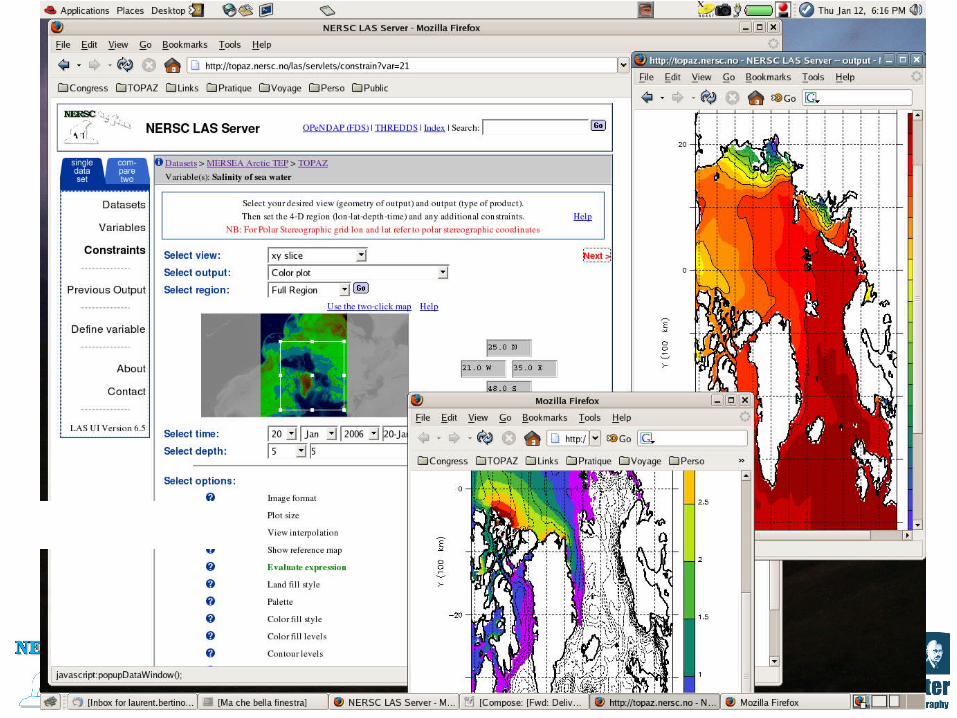
Live Access Server

The MERSEA metrics

The MERSEA metrics
Class1: 3D daily averages
Class2: Sections and moorings
Class3: derived quantities (fluxes)
Class4: validation to observations

Top 3 m layer

100 m depths

Validation proceduresagainst in-situ measurements and
climatology
Station at the North Pole
TOPAZ profiles
In-situ data from CORIOLIS
(Argo, XBT, …)

Status / Plan
TOPAZ: next upgrade (TOPAZ3) Apr. 2007 Ice drift data assimilation
Arctic TEP Started during the TOP1 period (Oct. 2005)
Barents Sea model Downscaling from TOPAZ. Real-time since Sept. 2006.
MERSEA TOP2 period (Apr. – Sept. 07) Contributions from all Mersea V2 systems More validation metrics

Thank You

The ingredients Models
HYCOM (U. Miami, USA) Ice model Biogeoch. model (AWI, D)
Observations Altimetry, SST (CLS, F) Sea Ice (NSIDC, USA) Sea Ice drift (Cersat, F) In-situ (CORIOLIS, F)
Data assimilation Ensemble Kalman Filter [Evensen 1994, 2006]
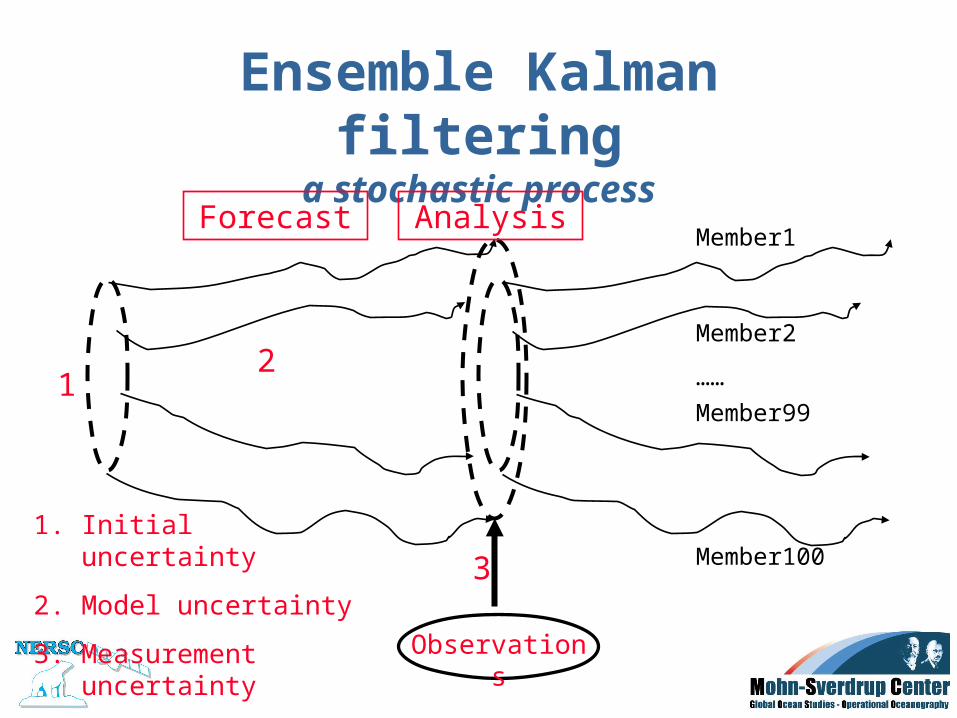
Ensemble Kalman filtering
a stochastic processForecast Analysis
Observations
1. Initial uncertainty
2. Model uncertainty
3. Measurement uncertainty
12
3
Member1
Member2
……
Member99
Member100
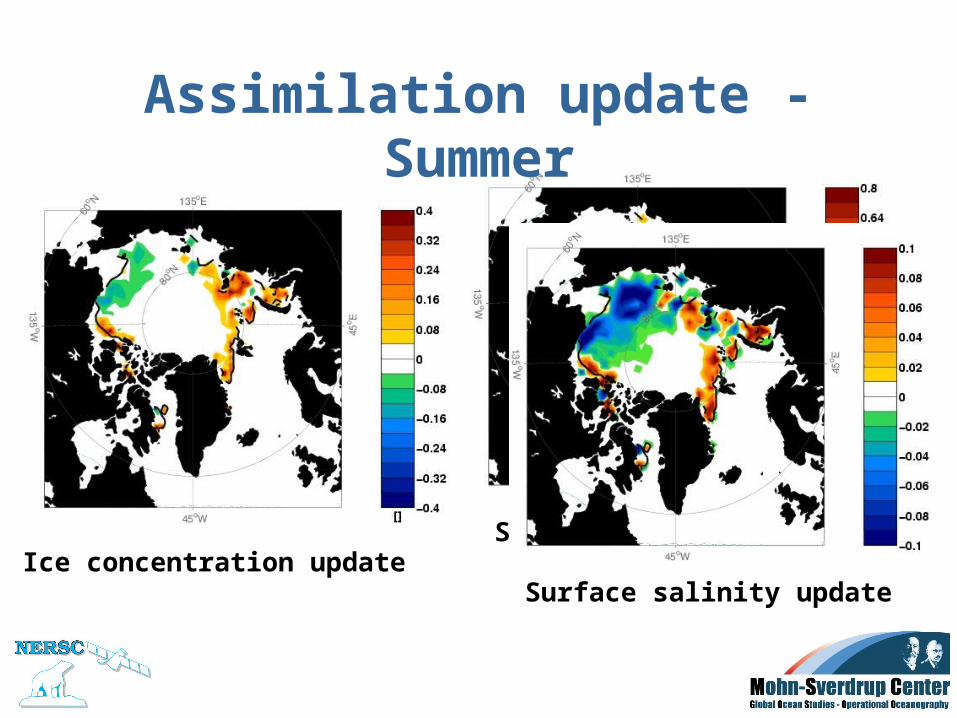
Surface temperature update
Assimilation update - Summer
Ice concentration updateSurface salinity update

Results from TOPAZ and nested models

Validation Salinity

Validation Temperature

Results from a nested model
VOLUME TRANSPORTS
How good are the boundary conditions ?
BIC
AW
NCC

Norway-Bear Island
Net transport AW: 1.5 Sv/year (1.7 Sv in winter and 1.3 Sv in Summer)
[Ingvaldsen et al., 2004]
Net transport NCC: 0.5 Sv/year [Blindheim, 1989]
Net transport BIC: -???

Bear Island - Svalbard
Recirculation within the Bear Island Trough is relatively stable at ~ 1.0 Sv
[Ingvaldsen et al., 2002]

Svalbard – Franz Josef
Land
In => 0.4 Sv
Out => 0.1 Sv
[Loeng et al., 1997]
(used Russian literature)

Frans Josef Land – Novaya
Zemlja
In = 0 to 0.3 Sv in Summer
Out = 1.5 Sv (between 0.6 Sv in Summer and 2.6 Sv in Winter)
[Schauer et al., 2002]

Kara Gate
In = 0.1 Sv
Out = 0.05 to 0.7 Sv
[Loeng et al., 1997]
(used Russian literature)

Planned upgrade -TOPAZ3

Expected improvements
Improved dynamics Better resolution of shelf
currents (esp. in the Nordic Seas)
Better fluxes in/out of the Arctic Ocean
More efficient assimilation of altimetry and hydrographic profiles.
NorwaySpitzberg Barents Sea opening
TOPAZ2
TOPAZ3

Future Perspectives Geographical extension
Indian ocean (under development) Pacific Ocean / South China Sea (Nansen-Zhu, Beijing)
Exhaustive model validation In collaboration with the MERSEA gang
Real-time assimilation of more observations Temperature and salinity profiles (Argo program) Ice thicknesses (CRYOSAT) Sea surface salinity (SMOS / Aqua) New geoid and Mean Dynamic Topography (GOCE)
Progresses in data assimilation Biases, non-linearity, parameter estimation
Coupling to a global system Mercator

The end

System Applications
Nested systems in1. North Sea (N. Winther/C. Hansen)2. Gulf of Mexico (F. Counillon)3. Barents Sea (I. Keghouche)

Illustr.
I. Kerghouche