TOOLS FOR THE SIMULATION OF INTERNAL ARC EFFECTS … · TOOLS FOR THE SIMULATION OF INTERNAL ARC...
63
TOOLS FOR THE SIMULATION OF INTERNAL ARC EFFECTS IN MV AND HV SWITCHGEAR Nenad Uzelac, CIGRE A3.24 working group convener IEEE Switchgear standard meeting, September 2014
Transcript of TOOLS FOR THE SIMULATION OF INTERNAL ARC EFFECTS … · TOOLS FOR THE SIMULATION OF INTERNAL ARC...

1/62
TOOLS FOR THE SIMULATION OF INTERNAL ARC EFFECTS IN MV AND HV SWITCHGEAR
Nenad Uzelac, CIGRE A3.24 working group convener
IEEE Switchgear standard meeting, September 2014
2/62
Agenda
1. What is an Internal Arc?
2. CIGRE Working Group Intro
3. Effects of Internal Arc
4. Air vs SF6 comparison
5. Design Reviews
6. Conclusion

3/62
1) Internal Arc
An arc fault - a high power discharge of
electricity between two or more conductors

4/62
INTERNAL ARC
EFFECT OF THE ARC
12.5kA, 0.5s
5/62
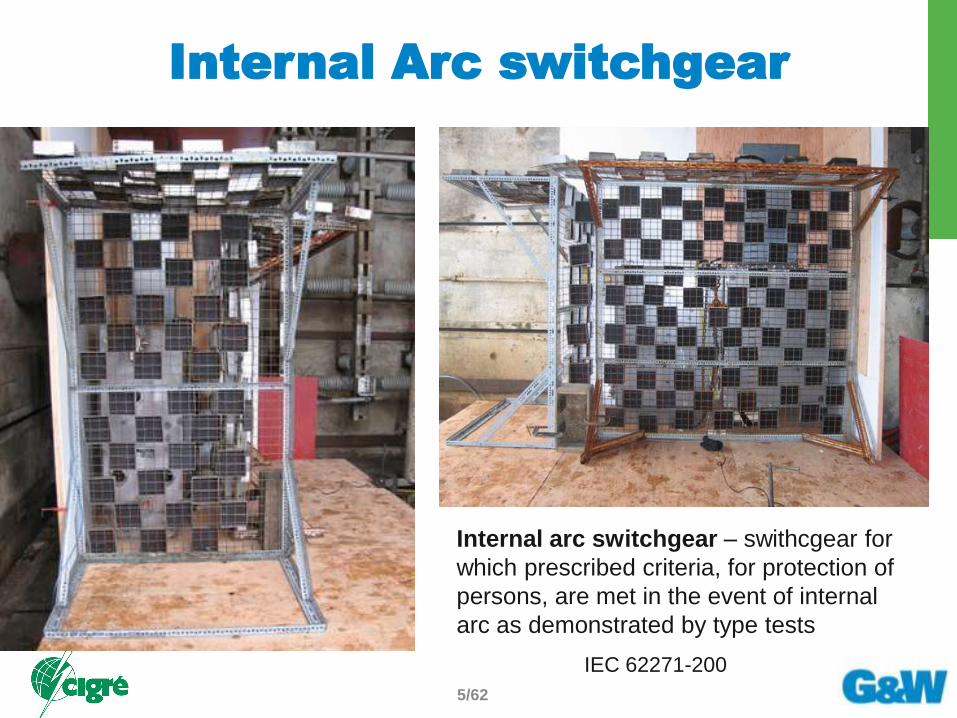
Internal Arc switchgear
Internal arc switchgear – swithcgear for
which prescribed criteria, for protection of
persons, are met in the event of internal
arc as demonstrated by type tests
IEC 62271-200

6/62
Internal Arc Test

7/62
2)

8/62
CIGRE
• Founded in 1921
• Council on Large Electric
Systems
• Promotes collaboration
with experts from all
around the world to
improve electric power
systems
• Key role: provides the
pre-standardization input
to IEC

9/62

10/62

11/62
CIGRE TC

12/62
CIGRE A3.24 working group
TOOLS FOR THE SIMULATION OF INTERNAL ARC EFFECTS IN MV AND HV SWITCHGEAR

13/62
Background
• Working group started in 2009
• 11 2-day working group meetings
• Last Working group meeting held in June 2013
• Deliverable: Technical Brochure 2014
• 20 members coming from 12 countries on four
continents
• International experts in Internal Arc testing and
computational modeling from HV and MV
Switchgear manufacturers, users, labs and
universities.
14/62
Motivation of Work
• To provide methods for pressure rise calculations, allow benchmarking
• To verify design modifications by simulations
• To provide guidance to perform reviews of the simulations provided by the manufacturer
• To reduce internal arc tests for environmental reasons by improving the hit rate of the design
• To replace SF6 in GIS for testing by air with proper consideration of the differences

15/62
Working group members
Name Country Company Interest
Lopez-Roldan Australia Powerlink Utility
Feitoza Costa Brazil Cognitor Consulting
Pater Canada Hydro-Québec Utility
Douchin France Schneider Manuf. MV Switchgear
Vinson France Alstom Manuf. HV Switchgear
Pietsch Germany RWTH Aachen University
Dullni Germany ABB Manuf. MV Switchgear
Singh Germany Schneider Manuf. MV Switchgear
Reiher Germany Siemens Manuf. MV Switchgear
Yoshida Japan Mitsubishi Electric Manuf. HV Switchgear
Uchii Japan Toshiba Manuf. HV Switchgear
Kim Korea KERI Test Laboratory
Smeets Netherlands KEMA Test Laboratory
Schoonenberg Netherlands Eaton Manuf. MV Switchgear
Van der Sluis Netherlands TU Delft University
Fjeld Norway Telemark University University
del Rio Spain Ormazabal Manuf. MV Switchgear
Kriegel Switzerland ABB Manuf. HV Switchgear
Glinkowski (Secretary) USA ABB Manuf. MV Switchgear
Uzelac (Convenor) USA G&W Manuf. MV Switchgear
1

16/62
Working group

17/62
Work methodology
• Research:
– Reviewed 100+ white papers and standards
– Collected test data from 80 internal fault tests
– Performed testing on SF6 vs Air
• Development:
– Developed mathematical models
– Developed testing guidance
• Validation:
– Validated software simulations with test data

18/62
Analyzed 80+ cases
dummy
indicator
room simulation
• AIR, SF6, N2
• 5 ltr – 1200 ltr
• 12kA – 63kA
• 10ms – 1.2s

19/62
Internal Arc
• Energy of 25kA, 0.25s = Energy of 2kg TNT
• Temperature > 1000°C
• Pressure rise ~ 10bars (25kA,4 cycles,200l)
• Force on walls ~ several tons

20/62
Power of Internal Arc

21/62
3) Effects of Internal Arc fault:
1. Pressure rise inside
switch
2. Arc Burn-through
3. Mechanical Stress on
switch enclosure
4. Mechanical stress on
the installation room

22/62
1. Pressure rise effect
Before Internal Arc Test After Internal Arc Test
23/62
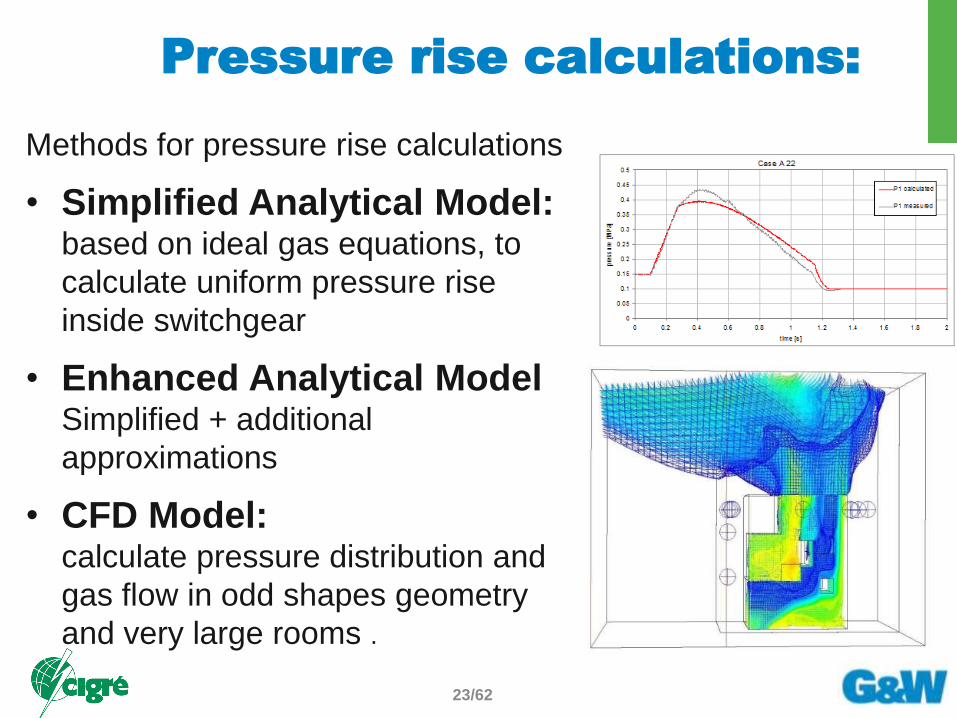
Pressure rise calculations:
Methods for pressure rise calculations
• Simplified Analytical Model: based on ideal gas equations, to
calculate uniform pressure rise
inside switchgear
• Enhanced Analytical Model Simplified + additional
approximations
• CFD Model:
calculate pressure distribution and
gas flow in odd shapes geometry
and very large rooms .

24/62
Pressure Rise curve
case25.AIR
0
0.05
0.1
0.15
0.2
0.25
0.3
0.35
0.4
0.45
0 0.2 0.4 0.6 0.8 1 1.2 1.4
[s]
[MP
a]
Arc
Exhaust
Arc Volume
Burst
End of Arc
Maximal
Pressure Arc
t burst
t max
t decay
Maximal pressure
Exhaust
Overshoot
k burst
Characteristic values determined from calculated or measured
pressure course.

25/62
Internal Arc Energy balance in gas
T.R. Bjortuft et al., “Internal arc fault testing of gas insulated
metal enclosed MV switchgear” CIRED, June 2005
ARC
Pressure

26/62
A) Simplified analytical model
Arc
compartment
Exhaust
compartment
Installation
room

27/62
Simplified analytical model
• Outlined in detail in Technical Brochure.
• Used to quickly calculate uniform ΔP using ideal
gas equation in V1, V2 and V3
• Some limitations exist.
– Both analytical models don’t calculate spatial
differences in pressure inside the volumes
– Applicable for simple geometries where uniform
pressure can be assumed
– Applicable for smaller volumes (approx <50 m3)
where pressure waves are negligible.
28/62
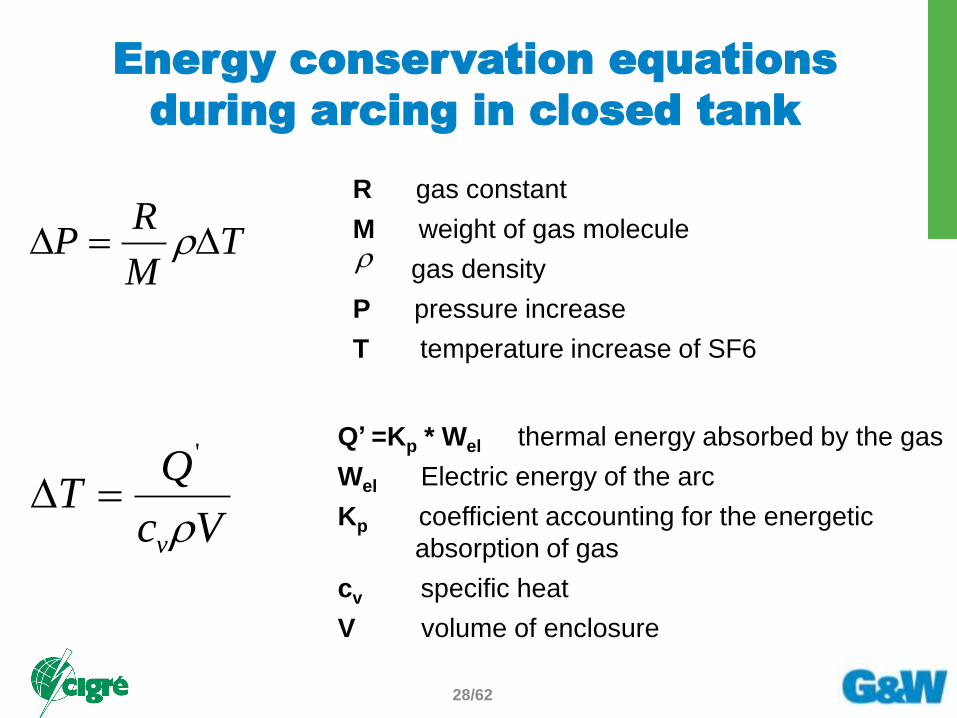
Energy conservation equations
during arcing in closed tank
TM
RP
Vc
QT
v
'
R gas constant
M weight of gas molecule
gas density
P pressure increase
T temperature increase of SF6
Q’ =Kp * Wel thermal energy absorbed by the gas
Wel Electric energy of the arc
Kp coefficient accounting for the energetic
absorption of gas
cv specific heat
V volume of enclosure

29/62
Net Energy conservation equation
during arcing in open tank
Vpmu
TpTmCW atmv
2
),(2
p,T,ρ
Patm
Increase of internal energy of the gas inside the tank +
Change of kinetic energy of the gas at the exit +
Work performed by the gas at the exit
Net change of heat =

30/62
Rupture Disc
In order to minimise the risk of bursting, enclosures may
be equipped with a bursting disc that activates once a
certain pressure is reached.

31/62
a) Simplify geometry

32/62
b) Calculate pressure rise for
each case
For better calculation
prediction, Kp-factor
and arc voltages need
to be taken from the
similar test
33/62
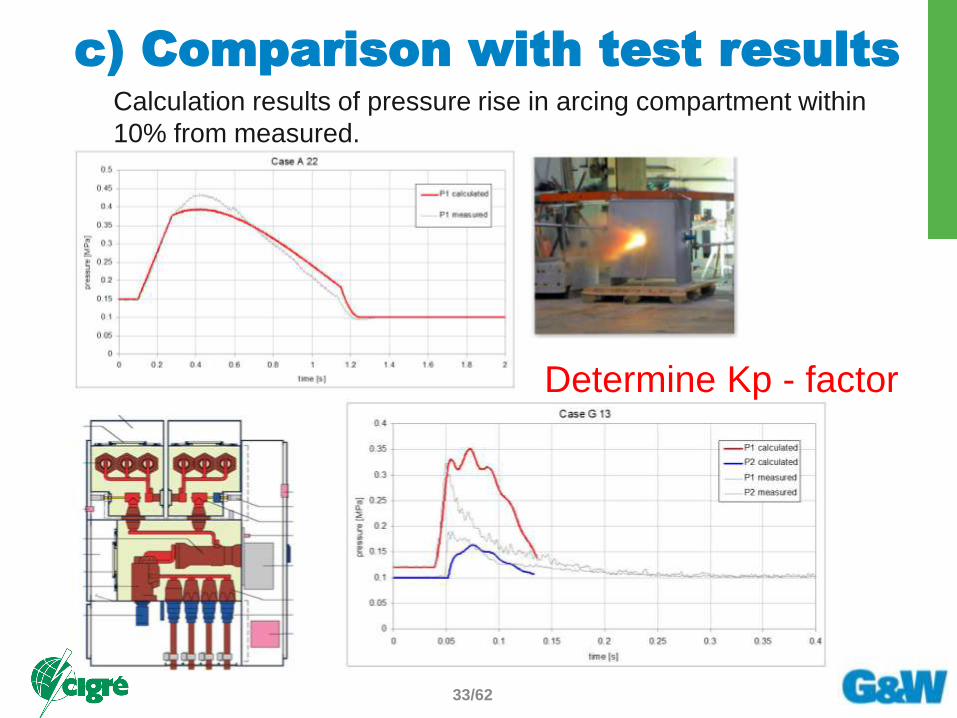
c) Comparison with test results
Calculation results of pressure rise in arcing compartment within
10% from measured.
Determine Kp - factor
34/62
d) Use software tools to predict
results
Must test similar object to determine Kp-factor
1. Different switch / compartment size
2. Different fault currents
3. Different rupture disc openings
4. Different gas
35/62
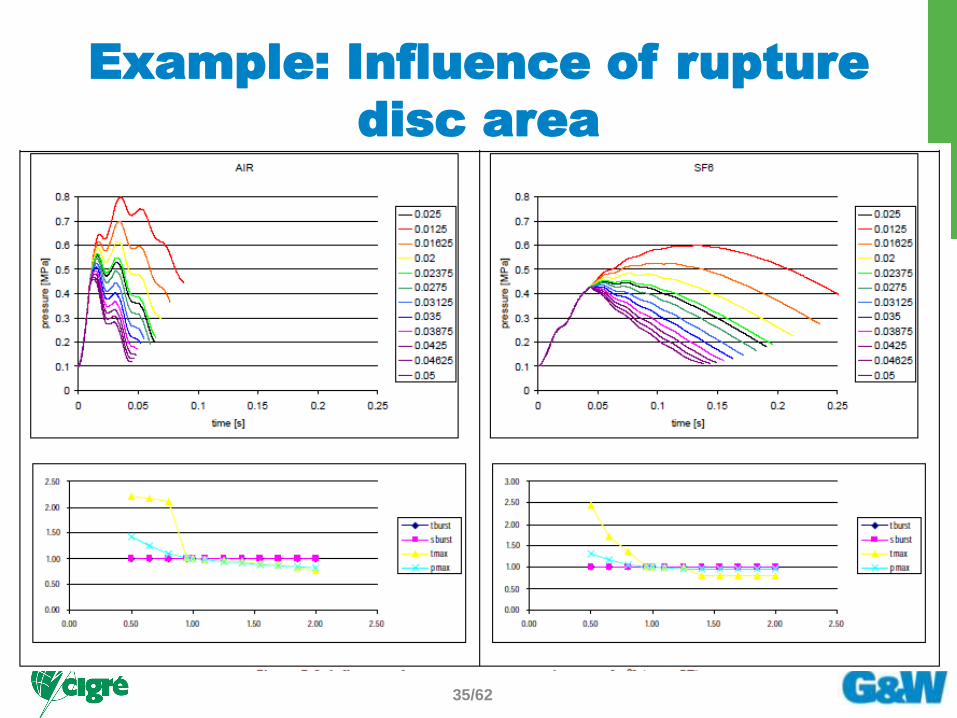
Example: Influence of rupture
disc area
36/62
B) Enhanced Analytical Model
• Used to calculate uniform ΔP inside volumes, with some
added approximations to improve the simplified model.
– density dependent 𝑘𝑝-factor
– exothermic reaction energy
– pressure dependent arc voltage
– mixing of gas in compartments
– metal evaporation and ablation of insulators
– arc absorbers in the exhaust flow
– speed of relief opening device
– temperature dependent gas data

37/62
C) CFD Model
• Used with complex geometry
• Spatial resolution of the results
• Pressure waves are included
• Can model arc absorbers

38/62
CFD model example:

39/62
Pressure Rise Summary
• Proposed 3 models for calculating the
pressure rise.
• Pressure rise depends on:
– Larger the arc voltage or arc current, the
larger the maximum pressure
– Larger the volume, the longer the time it takes
for the pressure to increase & decrease
– Larger the diameter of pressure relief valve,
the smaller the maximum pressure

40/62
(1),(2),(3)
(6)(7)
(4)(5)
(1),(2),(3)
(6)(7)
(4)(5)
2. Arc Burn-through: GIS Single-
phase Busbar

41/62
H. Strasser, K.D. Schmidt, and P. Hogg, “Effects of arcs in enclosures filled with SF6 and steps taken to restrict them in SF6
switchgear,” IEEE, November 1973
Example of Single-Phase
Busbar after internal arcing

42/62
Evaluation of the burn-through
time
• The time to burn-through (t) can be estimated as
I
hkt
2
k depends on the material
h is the enclosure thickness
I is the arc current
• The time to burn-through increases with the increase of
the enclosure thickness and the decrease of the arc
current .
• It will be 4 times larger for steel than aluminum.
43/62
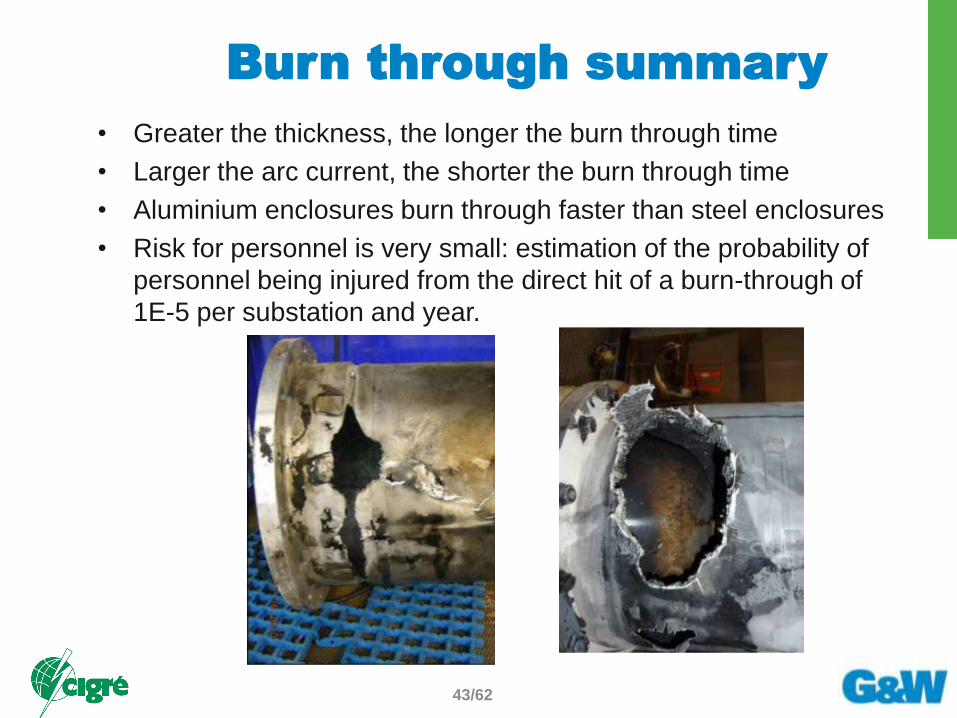
Burn through summary
• Greater the thickness, the longer the burn through time
• Larger the arc current, the shorter the burn through time
• Aluminium enclosures burn through faster than steel enclosures
• Risk for personnel is very small: estimation of the probability of
personnel being injured from the direct hit of a burn-through of
1E-5 per substation and year.

44/62
3) Mechanical stress on the switch
• First calculate the expected
pressure rise inside the
switch
• Then use existing FEA to
evaluate the mechanical
stress on the enclosure
• Calculation of deformation
of enclosure by FEA stress
analysis can be done both
for welded and bolted
enclosures
45/62
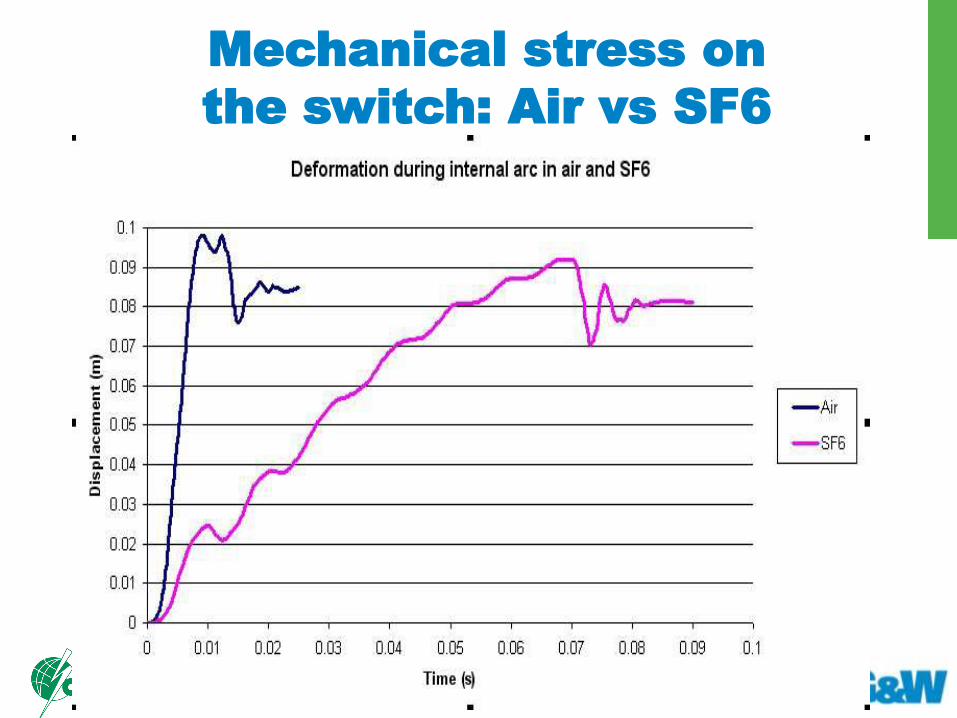
Mechanical stress on
the switch: Air vs SF6

46/62
4) Mechanical stress on the
installation room

47/62
48/62
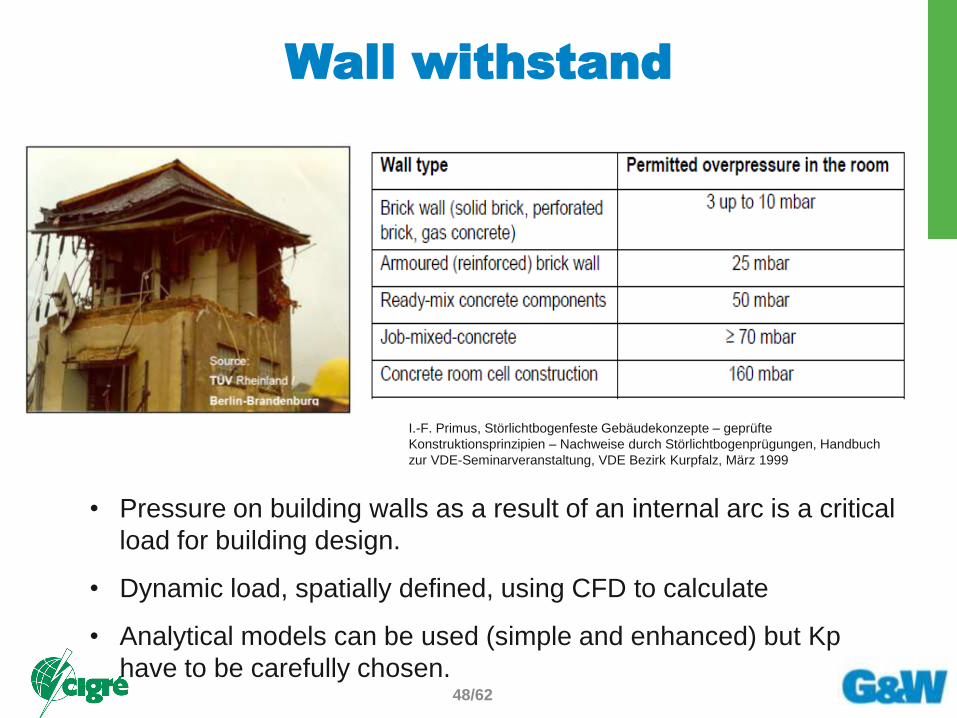
Wall withstand
I.-F. Primus, Störlichtbogenfeste Gebäudekonzepte – geprüfte
Konstruktionsprinzipien – Nachweise durch Störlichtbogenprügungen, Handbuch
zur VDE-Seminarveranstaltung, VDE Bezirk Kurpfalz, März 1999
• Pressure on building walls as a result of an internal arc is a critical
load for building design.
• Dynamic load, spatially defined, using CFD to calculate
• Analytical models can be used (simple and enhanced) but Kp
have to be carefully chosen.
49/62
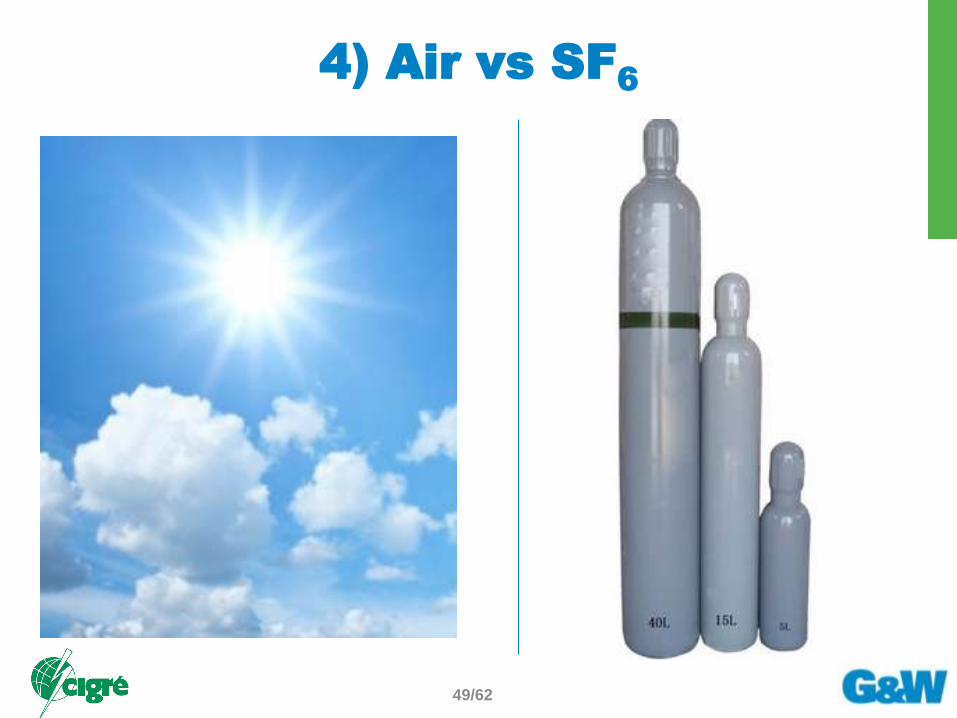
4) Air vs SF6
50/62
• Environmental reasons to replace SF6
by Air during internal arc testing of SF6
insulated switchgear.
• Solid (metal-sulphides and -fluorides) as
well as gaseous SF6 decomposition
products very poisonous.
• Test labs wish to minimize their
emission of clean SF6, a greenhouse gas,
and certainly polluted SF6.

51/62
Air vs SF6
(cont)
SF6 Air
SF6 air
52/62
• Arc compartment:
The mechanical stress of the fault arc compartment is
higher when filled with air instead of SF6 due to the
faster and higher pressure rise in air.
• Exhaust compartment:
With air, the exhaust gas gives a lower peak pressure
in the adjacent compartment than with SF6; hence the
mechanical stress is also smaller.
Air vs SF6: pressure rise in
arcing and exhaust volume

53/62
0 500 1000 15000
1
2
3
4
time (ms)
pre
ssure
ris
e (
bar)
arcing volume
exhaust volume
Pressure rise in arcing- and exhaust volume for air-filled (blue)
and SF6 filled (red) arcing volume (1 s arc duration). Vertical
markers: pressure relief action (diaphragm burst).
Air vs SF6: pressure rise in
arcing and exhaust volume
54/62
Air vs SF6
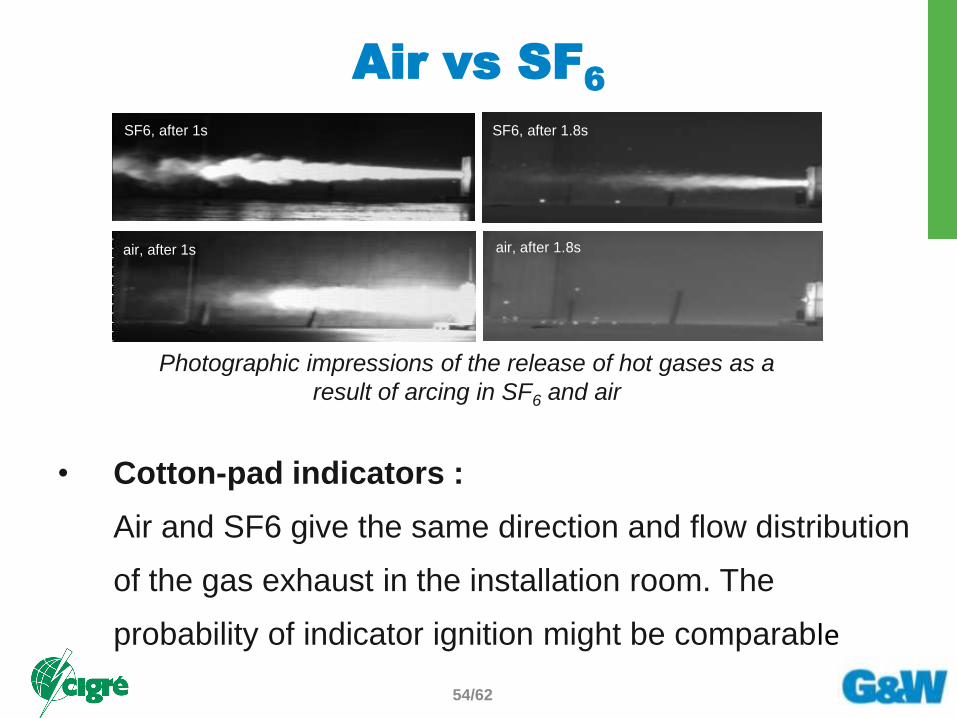
• Cotton-pad indicators :
Air and SF6 give the same direction and flow distribution
of the gas exhaust in the installation room. The
probability of indicator ignition might be comparable
SF6, after 1s
air, after 1s air, after 1.8s
SF6, after 1.8s
Photographic impressions of the release of hot gases as a
result of arcing in SF6 and air
55/62
Air vs SF6: Burn through
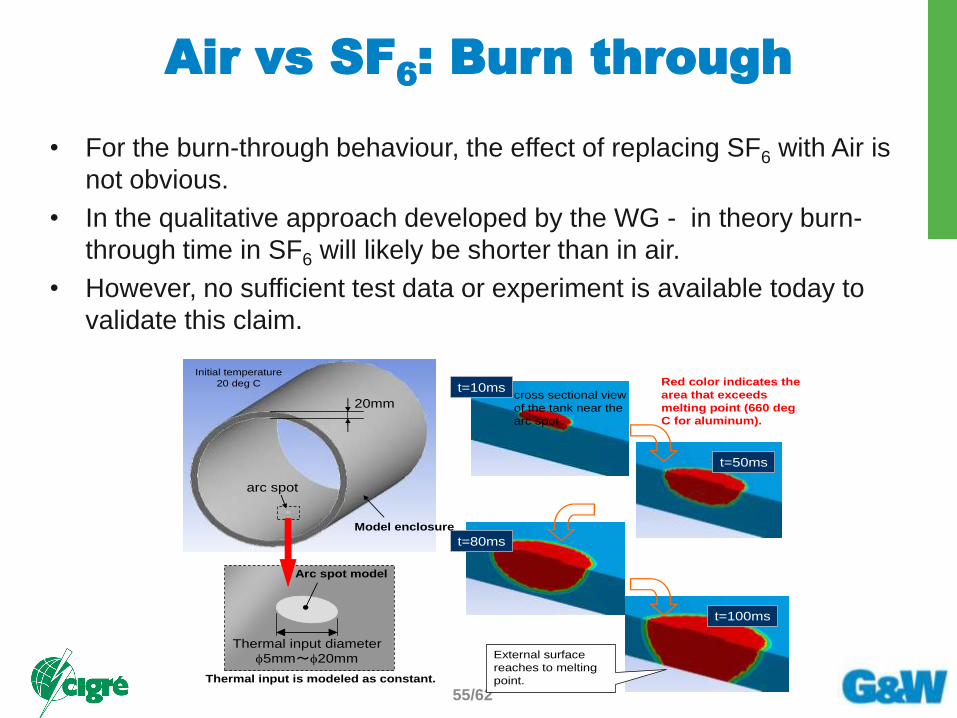
• For the burn-through behaviour, the effect of replacing SF6 with Air is
not obvious.
• In the qualitative approach developed by the WG - in theory burn-
through time in SF6 will likely be shorter than in air.
• However, no sufficient test data or experiment is available today to
validate this claim.
Thermal input diameter
5mm~20mm
arc spot
20mm
Initial temperature
20 deg C t=10ms
t=50ms
t=80ms
t=100ms
External surface
reaches to melting
point.
cross sectional view
of the tank near the
arc spot
Model enclosure
Arc spot model
Red color indicates the
area that exceeds
melting point (660 deg
C for aluminum).
Thermal input is modeled as constant.
56/62
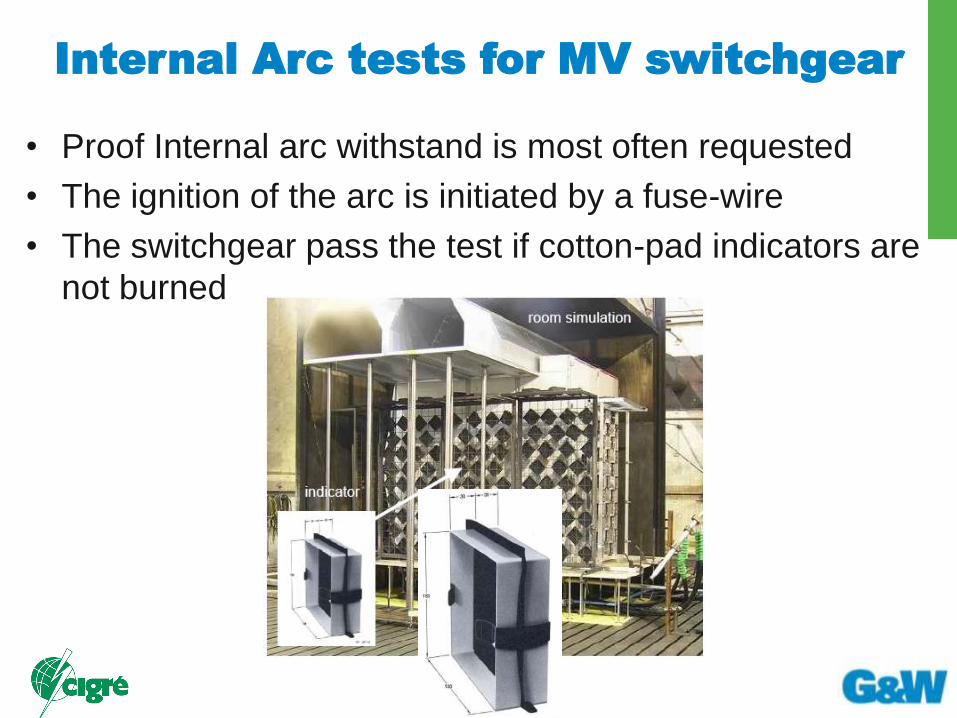
Internal Arc tests for MV switchgear
• Proof Internal arc withstand is most often requested
• The ignition of the arc is initiated by a fuse-wire
• The switchgear pass the test if cotton-pad indicators are
not burned
57/62
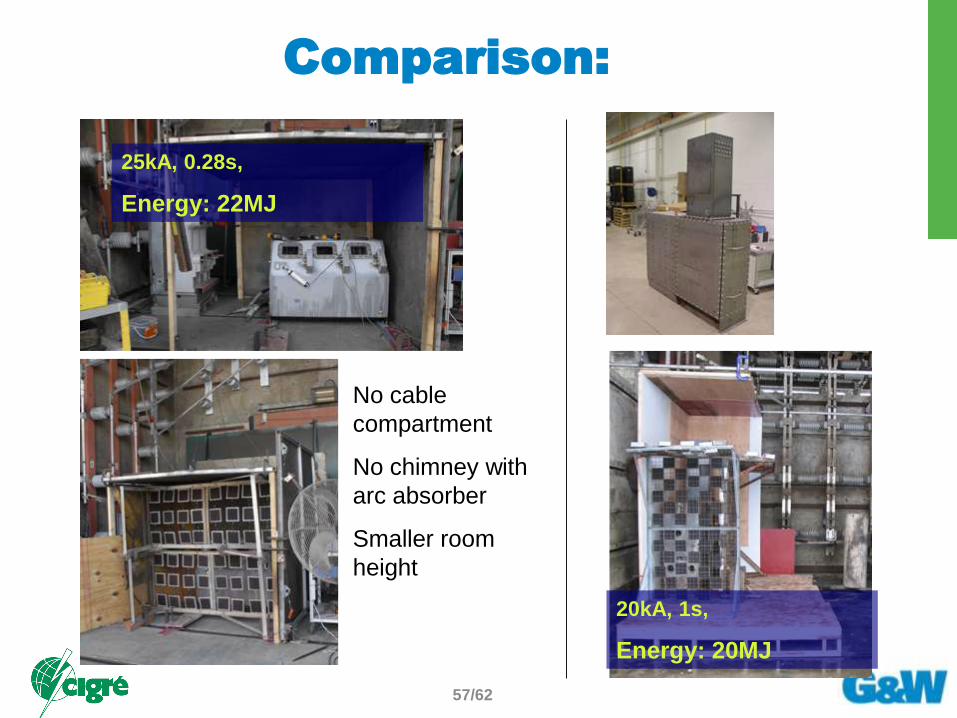
Comparison:
20kA, 1s,
Energy: 20MJ
25kA, 0.28s,
Energy: 22MJ
No cable
compartment
No chimney with
arc absorber
Smaller room
height
58/62
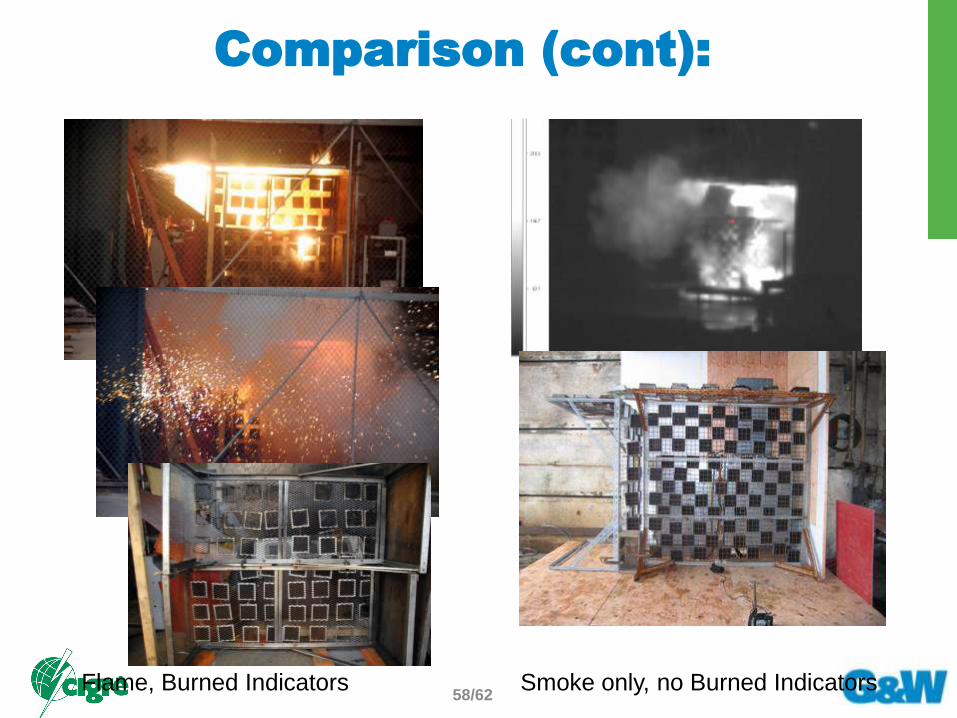
Comparison (cont):
Flame, Burned Indicators Smoke only, no Burned Indicators

59/62
Tests for HV metal-enclosed
switchgear
• The IEC 62271-203 for HV metal-enclosed switchgear allows for the extrapolation of internal arc tests by calculation for other enclosures and currents
• This extrapolation would be based on original test results by the manufacturer
• Tests are more difficult to perform than in MV
switchgear and there are generally not
requested.
• Manufacturers use “design rules” and calculation
programs based on previous internal arc tests
60/62
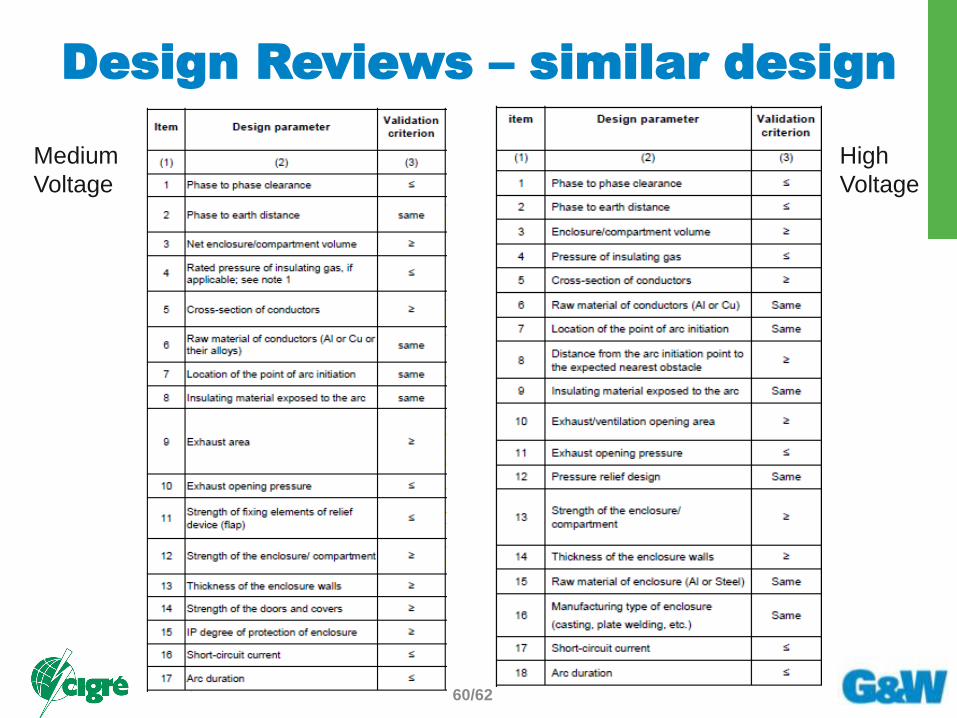
Design Reviews – similar design
Medium
Voltage
High
Voltage

61/62
Conclusion
• A3.24 WG findings suggest that simulations can’t
replace type tests, but they could be used for
interpolation between the known tests
• Internal arc test must be done on a similar design
to get the correct energy input data. It is very
important to measure the pressure rise during the
tests
• WG provides calculation tools to predict Pressure
rise and mechanical stresses.
• WG gives guidance to perform an internal arc
simulation review between the switchgear
manufacturer and the user.

62/62
Conclusion
• Based on the results, WG conclude that relevant
differences exist in the behaviour of fault arcs in SF6 and
in air
• Replacing SF6 by air in internal arc testing leads to
comparable or higher pressure rise in the arcing
compartment.
• Pressure rise in exhaust compartment or switchgear
room may be higher in tests with SF6 -filled then with air
• No conclusions exist on other criteria to pass internal arc
test such as the ignition of the cotton indicators and
enclosure burn through. Needs further detailed
investigation.
• Replacement of SF6 with air provides mixed results.
Each case must be evaluated separately.