Tool Wear Monitoring for Ultrasonic Metal Welding of Lithium-Ion ...
8
Chenhui Shao 1 Department of Mechanical Engineering, University of Michigan, Ann Arbor, MI 48109 e-mail: [email protected] Tae Hyung Kim Department of Mechanical Engineering, University of Michigan, Ann Arbor, MI 48109 S. Jack Hu Department of Mechanical Engineering, University of Michigan, Ann Arbor, MI 48109 Jionghua (Judy) Jin Department of Industrial and Operations Engineering, University of Michigan, Ann Arbor, MI 48109 Jeffrey A. Abell Manufacturing Systems Research Laboratory, General Motors Technical Center, Warren, MI 48090 J. Patrick Spicer Manufacturing Systems Research Laboratory, General Motors Technical Center, Warren, MI 48090 Tool Wear Monitoring for Ultrasonic Metal Welding of Lithium-Ion Batteries This paper presents a tool wear monitoring framework for ultrasonic metal welding which has been used for lithium-ion battery manufacturing. Tool wear has a significant impact on joining quality. In addition, tool replacement, including horns and anvils, con- stitutes an important part of production costs. Therefore, a tool condition monitoring (TCM) system is highly desirable for ultrasonic metal welding. However, it is very chal- lenging to develop a TCM system due to the complexity of tool surface geometry and a lack of thorough understanding on the wear mechanism. Here, we first characterize tool wear progression by comparing surface measurements obtained at different stages of tool wear, and then develop a monitoring algorithm using a quadratic classifier and features that are extracted from space and frequency domains of cross-sectional profiles on tool surfaces. The developed algorithm is validated using tool measurement data from a battery plant. [DOI: 10.1115/1.4031677] Keywords: tool wear monitoring, ultrasonic metal welding, lithium-ion batteries, electric vehicles 1 Introduction In manufacturing lithium-ion batteries for electrical vehicles such as the Chevrolet Volt, it is critical to create reliable intercon- nections among battery cells, from module to module, and from module to control unit. Ultrasonic metal welding is advantageous in joining multilayer dissimilar, thin and conductive materials [1,2]. It is a solid-state joining process which uses ultrasonic vibration to generate oscillating shears between metal sheets clamped under pressure [3–5]. A typical ultrasonic metal welding system is shown in Fig. 1. The surfaces of the weld tools, i.e., horn and anvil, consist of a large number of pyramid-shape knurls as displayed in Fig. 2. The horn and anvil wear out quickly in pro- duction and are expensive to replace. As a result, monitoring of the horn and anvil wear is critically needed to ensure battery join- ing quality and reduce production cost. The ultrasonic metal welding process is illustrated in Fig. 3. Workpieces are placed between the horn and anvil, and a clamp- ing force is applied to hold the workpieces tightly. During weld- ing, the horn vibrates at a frequency of around 20 kHz, while the anvil is stationary. It is reported in Refs. [5,6] that relative move- ments exist between the top metal sheet and the horn, as well as between the bottom sheet and the anvil, and these relative move- ments are believed to be a major cause of tool wear. In an automotive lithium-ion battery manufacturing, horn and anvil are reported to be a major production cost. Specifically, pro- duction costs as a result of tool wear can be divided into two major categories [6]: (1) costs due to machine down time as caused by tool wear induced quality problems or time needed for tool replacement and (2) costs for fabricating, reworking, or refur- bishing the replaced tools. Vehicle battery manufacturing has a strict quality requirement for battery tab joining because any low- quality joints may result in the failure of an entire battery pack, causing high production loss [2]. Consequently, when a TCM Fig. 1 A typical ultrasonic metal welding system [2] Fig. 2 Pyramid-shape knurls on the horn and anvil: (a) Horn knurl and (b) anvil knurl 1 Corresponding author. Contributed by the Manufacturing Engineering Division of ASME for publication in the JOURNAL OF MANUFACTURING SCIENCE AND ENGINEERING. Manuscript received February 17, 2015; final manuscript received July 28, 2015; published online November 18, 2015. Assoc. Editor: Robert Gao. Journal of Manufacturing Science and Engineering MAY 2016, Vol. 138 / 051005-1 Copyright V C 2016 by ASME Downloaded From: http://manufacturingscience.asmedigitalcollection.asme.org/ on 11/24/2015 Terms of Use: http://www.asme.org/about-asme/terms-of-use
Transcript of Tool Wear Monitoring for Ultrasonic Metal Welding of Lithium-Ion ...

Chenhui Shao1
Department of Mechanical Engineering,
University of Michigan,
Ann Arbor, MI 48109
e-mail: [email protected]
Tae Hyung KimDepartment of Mechanical Engineering,
University of Michigan,
Ann Arbor, MI 48109
S. Jack HuDepartment of Mechanical Engineering,
University of Michigan,
Ann Arbor, MI 48109
Jionghua (Judy) JinDepartment of Industrial and
Operations Engineering,
University of Michigan,
Ann Arbor, MI 48109
Jeffrey A. AbellManufacturing Systems Research Laboratory,
General Motors Technical Center,
Warren, MI 48090
J. Patrick SpicerManufacturing Systems Research Laboratory,
General Motors Technical Center,
Warren, MI 48090
Tool Wear Monitoringfor Ultrasonic Metal Weldingof Lithium-Ion BatteriesThis paper presents a tool wear monitoring framework for ultrasonic metal weldingwhich has been used for lithium-ion battery manufacturing. Tool wear has a significantimpact on joining quality. In addition, tool replacement, including horns and anvils, con-stitutes an important part of production costs. Therefore, a tool condition monitoring(TCM) system is highly desirable for ultrasonic metal welding. However, it is very chal-lenging to develop a TCM system due to the complexity of tool surface geometry and alack of thorough understanding on the wear mechanism. Here, we first characterize toolwear progression by comparing surface measurements obtained at different stages of toolwear, and then develop a monitoring algorithm using a quadratic classifier and featuresthat are extracted from space and frequency domains of cross-sectional profiles on toolsurfaces. The developed algorithm is validated using tool measurement data from abattery plant. [DOI: 10.1115/1.4031677]
Keywords: tool wear monitoring, ultrasonic metal welding, lithium-ion batteries, electricvehicles
1 Introduction
In manufacturing lithium-ion batteries for electrical vehiclessuch as the Chevrolet Volt, it is critical to create reliable intercon-nections among battery cells, from module to module, and frommodule to control unit. Ultrasonic metal welding is advantageousin joining multilayer dissimilar, thin and conductive materials[1,2]. It is a solid-state joining process which uses ultrasonicvibration to generate oscillating shears between metal sheetsclamped under pressure [3–5]. A typical ultrasonic metal weldingsystem is shown in Fig. 1. The surfaces of the weld tools, i.e.,horn and anvil, consist of a large number of pyramid-shape knurlsas displayed in Fig. 2. The horn and anvil wear out quickly in pro-duction and are expensive to replace. As a result, monitoring ofthe horn and anvil wear is critically needed to ensure battery join-ing quality and reduce production cost.
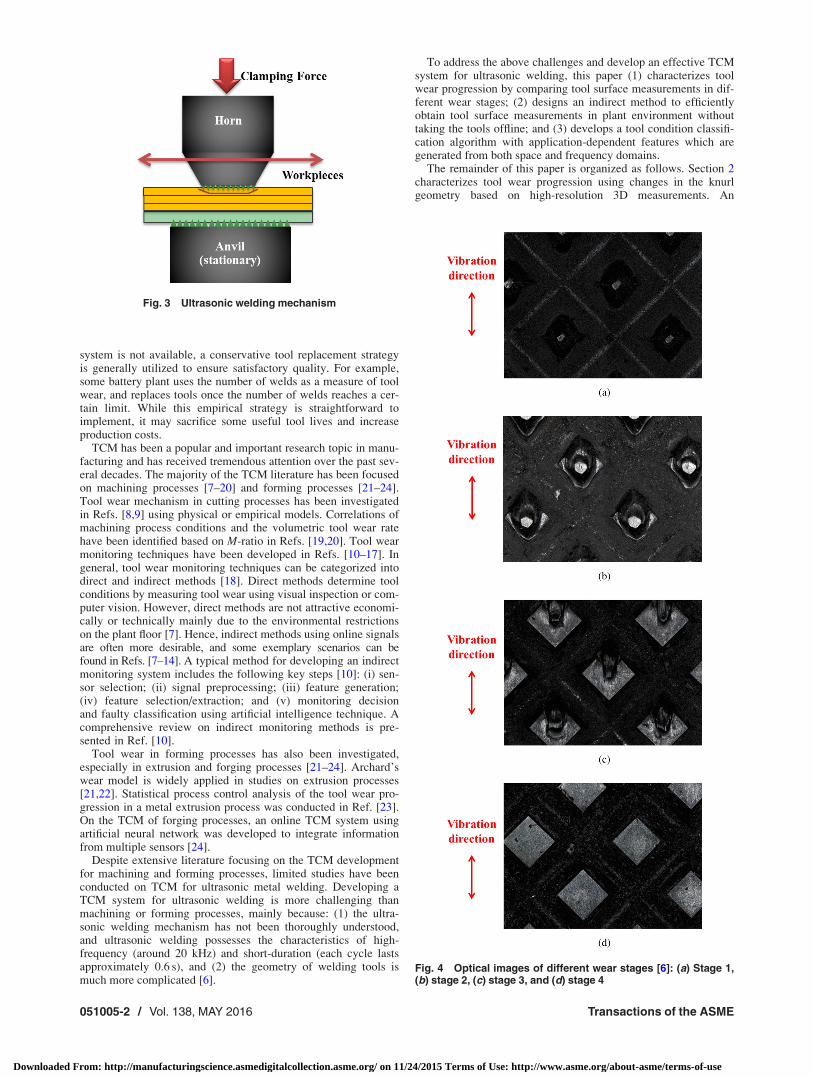
The ultrasonic metal welding process is illustrated in Fig. 3.Workpieces are placed between the horn and anvil, and a clamp-ing force is applied to hold the workpieces tightly. During weld-ing, the horn vibrates at a frequency of around 20 kHz, while theanvil is stationary. It is reported in Refs. [5,6] that relative move-ments exist between the top metal sheet and the horn, as well asbetween the bottom sheet and the anvil, and these relative move-ments are believed to be a major cause of tool wear.
In an automotive lithium-ion battery manufacturing, horn andanvil are reported to be a major production cost. Specifically, pro-duction costs as a result of tool wear can be divided into two
major categories [6]: (1) costs due to machine down time ascaused by tool wear induced quality problems or time needed fortool replacement and (2) costs for fabricating, reworking, or refur-bishing the replaced tools. Vehicle battery manufacturing has astrict quality requirement for battery tab joining because any low-quality joints may result in the failure of an entire battery pack,causing high production loss [2]. Consequently, when a TCM
Fig. 1 A typical ultrasonic metal welding system [2]
Fig. 2 Pyramid-shape knurls on the horn and anvil: (a) Hornknurl and (b) anvil knurl
1Corresponding author.Contributed by the Manufacturing Engineering Division of ASME for publication
in the JOURNAL OF MANUFACTURING SCIENCE AND ENGINEERING. Manuscript receivedFebruary 17, 2015; final manuscript received July 28, 2015; published onlineNovember 18, 2015. Assoc. Editor: Robert Gao.
Journal of Manufacturing Science and Engineering MAY 2016, Vol. 138 / 051005-1Copyright VC 2016 by ASME
Downloaded From: http://manufacturingscience.asmedigitalcollection.asme.org/ on 11/24/2015 Terms of Use: http://www.asme.org/about-asme/terms-of-use
system is not available, a conservative tool replacement strategyis generally utilized to ensure satisfactory quality. For example,some battery plant uses the number of welds as a measure of toolwear, and replaces tools once the number of welds reaches a cer-tain limit. While this empirical strategy is straightforward toimplement, it may sacrifice some useful tool lives and increaseproduction costs.
TCM has been a popular and important research topic in manu-facturing and has received tremendous attention over the past sev-eral decades. The majority of the TCM literature has been focusedon machining processes [7–20] and forming processes [21–24].Tool wear mechanism in cutting processes has been investigatedin Refs. [8,9] using physical or empirical models. Correlations ofmachining process conditions and the volumetric tool wear ratehave been identified based on M-ratio in Refs. [19,20]. Tool wearmonitoring techniques have been developed in Refs. [10–17]. Ingeneral, tool wear monitoring techniques can be categorized intodirect and indirect methods [18]. Direct methods determine toolconditions by measuring tool wear using visual inspection or com-puter vision. However, direct methods are not attractive economi-cally or technically mainly due to the environmental restrictionson the plant floor [7]. Hence, indirect methods using online signalsare often more desirable, and some exemplary scenarios can befound in Refs. [7–14]. A typical method for developing an indirectmonitoring system includes the following key steps [10]: (i) sen-sor selection; (ii) signal preprocessing; (iii) feature generation;(iv) feature selection/extraction; and (v) monitoring decisionand faulty classification using artificial intelligence technique. Acomprehensive review on indirect monitoring methods is pre-sented in Ref. [10].
Tool wear in forming processes has also been investigated,especially in extrusion and forging processes [21–24]. Archard’swear model is widely applied in studies on extrusion processes[21,22]. Statistical process control analysis of the tool wear pro-gression in a metal extrusion process was conducted in Ref. [23].On the TCM of forging processes, an online TCM system usingartificial neural network was developed to integrate informationfrom multiple sensors [24].
Despite extensive literature focusing on the TCM developmentfor machining and forming processes, limited studies have beenconducted on TCM for ultrasonic metal welding. Developing aTCM system for ultrasonic welding is more challenging thanmachining or forming processes, mainly because: (1) the ultra-sonic welding mechanism has not been thoroughly understood,and ultrasonic welding possesses the characteristics of high-frequency (around 20 kHz) and short-duration (each cycle lastsapproximately 0.6 s), and (2) the geometry of welding tools ismuch more complicated [6].
To address the above challenges and develop an effective TCMsystem for ultrasonic welding, this paper (1) characterizes toolwear progression by comparing tool surface measurements in dif-ferent wear stages; (2) designs an indirect method to efficientlyobtain tool surface measurements in plant environment withouttaking the tools offline; and (3) develops a tool condition classifi-cation algorithm with application-dependent features which aregenerated from both space and frequency domains.
The remainder of this paper is organized as follows. Section 2characterizes tool wear progression using changes in the knurlgeometry based on high-resolution 3D measurements. An
Fig. 3 Ultrasonic welding mechanism
Fig. 4 Optical images of different wear stages [6]: (a) Stage 1,(b) stage 2, (c) stage 3, and (d) stage 4
051005-2 / Vol. 138, MAY 2016 Transactions of the ASME
Downloaded From: http://manufacturingscience.asmedigitalcollection.asme.org/ on 11/24/2015 Terms of Use: http://www.asme.org/about-asme/terms-of-use

impression method is presented in Sec. 3 as an indirect tool geom-etry measurement strategy. Section 4 develops a tool conditionclassification algorithm. Finally, Sec. 5 concludes the paper.
2 Tool Wear Characterization
This section characterizes the tool wear progression in an ultra-sonic metal welding based on the comparison of the opticalimages and height profiles at different wear stages. Representativesamples of four different stages were collected from a batteryplant and then measured using a 3D microscope. Specifically,Subsection 2.1 compares the optical images; Subsections 2.2 and2.3 depict the wear progression in the direction perpendicular tovibration and in the vibration direction, respectively. For the sakeof simplicity, we define the direction perpendicular to vibration as“horizontal direction” and the vibration direction as “verticaldirection.”
2.1 Comparison of Optical Images. The optical images ofthe four stages are shown in Fig. 4, and the characteristics of eachstage are summarized as follows [6].
Stage 1: Each knurl possesses a regular pyramid shape.Stage 2: The peak remains at each knurl, but forms a small flattop, and the knurl shape becomes more complex geometricallythan stage 1: more materials have been removed at the left andright sides than the upper and lower sides. In addition, the col-ors of peaks become shining.Stage 3: The left and right sides of each knurl are almost flat,and only a small amount of materials remain in the upper side.Stage 4: All peaks have been removed and the knurls take afrustum shape.
2.2 Tool Wear Progression in the Horizontal Direction. Ineach anvil, typical cross-sectional profiles are extracted in the hor-izontal direction, and the profiles are shown in Fig. 5.
In Fig. 5(a), one can see that the cross sections of all knurls of anew tool have triangle shapes and similar peak height. InFig. 5(b), three types of tool wear patterns can be observed: (1)flank wear, (2) side wear, and (3) breakage. The flank wear is atthe upright direction, which occurs with the removal of peaks
Fig. 5 Cross-sectional profiles in the horizontal direction [6]:(a) Stage 1, (b) stage 2, (c) stage 3, and (d) stage 4
Fig. 6 Anvil knurl wear progression in the horizontal direction[6]
Fig. 7 Cross-sectional profiles in the vertical direction [6]: (a)Stage 1, (b) stage 2, (c) stage 3, and (d) stage 4
Fig. 8 Anvil knurl wear progression in the vertical direction [6]
Journal of Manufacturing Science and Engineering MAY 2016, Vol. 138 / 051005-3
Downloaded From: http://manufacturingscience.asmedigitalcollection.asme.org/ on 11/24/2015 Terms of Use: http://www.asme.org/about-asme/terms-of-use

(height decreases); the side wear represents the wear around thepeaks, where two shoulders form at the left and right sides; thebreakage happens with a removal of the whole knurl peak and isindicated by a depressed shape. In Fig. 5(c), the height reducessignificantly compared with Fig. 5(b), and some of the peaks arealmost removed. Additionally, the width of shoulders increases.In Fig. 5(d), all peaks have disappeared, and the surface becomescompletely flat.
Based on the findings revealed in Fig. 5, the characterization ofeach stage in the horizontal direction is summarized in Fig. 6 anddescribed as follows [6].
Horizontal Direction
Stage 1: The knurl is new and it possesses a triangle shape.Stage 2: Material is removed in both downward and lateraldirections, and shoulders appear on the left and right sides.Stage 3: Height decreases significantly, and the width ofshoulders increases.Stage 4: Material is removed until the peak disappears, and atrapezoid shape forms.
2.3 Tool Wear Progression in the Vertical Direction. Simi-Similar to Subsection 2.2, the cross-sectional profiles in the verti-cal direction are also extracted and compared, and the results areshown in Fig. 7.
As shown in Fig. 7(a), a new anvil has triangle shapes. InFig. 7(b), an asymmetric pattern can be seen in two sides of theknurl in the vertical direction: more materials have been removedin the knurl’s lower side, and a groove forms. A knurl in this stagehas two peaks, i.e., a main peak and a side peak. In Fig. 7(c), onecan see that after more material removal, the side peak in Fig. 7(b)disappears and only a main peak remains. Fig. 7(d) shows the finalwear stage in the vertical direction. The main peak in Fig. 7(c) hasbeen completely removed, and a flat surface forms in the end.
According to the results shown in Fig. 7, the knurl-level wearprogression in the vertical direction is illustrated in Fig. 8. Thecharacteristics of the knurls in each stage are summarized asfollows [6].
Vertical Direction
Stage 1: The knurl possesses a triangle shape.Stage 2: Materials are mainly removed in the lower side, wherea groove and a side peak form. The height of the main peakdecreases compared with stage 1.Stage 3: More materials are removed until the side peak disap-pears. The height of the main peak continually decreases.Stage 4: The main peak is completely removed, and a trapezoidforms.
3 Impression Method
In an ultrasonic welding, tool surface geometry patterns provideessential tool condition information; hence, an efficient tool sur-face measurement method is necessary. Most 3D measurementsystems require the tools to be removed from the welding machineand be placed on a flat and stable fixture. As a result, tool disas-sembly is necessary in order to directly measure the tool surfaces.However, tool disassembly and assembly for ultrasonic weldingmachine are complicated and time-consuming, leading to a signif-icant amount of machine down time, which is not desirable in pro-duction. As a result, an innovative measurement scheme is crucialin real productions.
Fig. 9 Flowchart for impression method
Fig. 10 Comparison between measurements of a tool and acoupon: (a) anvil image, (b) coupon image, (c) comparison ofhorizontal profiles, and (d) comparison of vertical profiles
051005-4 / Vol. 138, MAY 2016 Transactions of the ASME
Downloaded From: http://manufacturingscience.asmedigitalcollection.asme.org/ on 11/24/2015 Terms of Use: http://www.asme.org/about-asme/terms-of-use

To effectively obtain tool surface measurements without intro-ducing significant interruption to production, an “impressionmethod” is developed. Rather than measuring the tool, an impres-sion is made on a weld coupon. The depth of deformation is meas-ured under a microscope and then the inverse of the coupon imageis created as a surrogate of the tool image. The process of obtain-ing the tool image from an “impression” is illustrated in Fig. 9.When a measurement is needed, one coupon will be generatedusing predetermined weld parameters and materials, and then itwill be measured using a 3D metrology system. Finally, data proc-essing, i.e., horizontal flip and height inversion, will be applied,and the original tool surface profiles are finally reconstructed.
The weld parameters and the coupon materials need to be care-fully selected in order to optimize the quality of the reconstructedtool surfaces. In practice, design of experiment [25] can be usedto identify the optimal combination of the weld parameters andthe coupon materials. In general, soft metals are recommended asthey are more efficient in capturing tool surface profiles. In thisstudy, four layers of pure aluminum are adopted, and the thicknessof each layer is 0.2 mm.
To validate this method, several anvils and corresponding cou-pons are measured for comparison, and good agreement isachieved between the original tool surfaces and reconstructedones. For illustrative purposes, only the results from one pair ofanvil and coupon are presented, as shown in Fig. 10.
Figures 10(a) and 10(b) display the images of anvil and coupon,respectively; (c) and (d) compare the cross-sectional profiles fromthe anvil and the coupon in the horizontal and vertical directions.The solid and dashed lines in (a) and (b) indicate the measurementpaths for the cross-sectional profiles. In (c) and (d), the solid linesrepresent the measurement of the anvil, and the dashed lines cor-respond to the coupon measurement. It is indicated in Fig. 10 thatthe coupon impression is able to capture the knurl height profileseffectively. Additionally, the knurl shapes from the impressionmethods are also very similar to these from the direct measure-ment. Thus, the designed impression method is effective in con-structing the tool surface geometry.
The correlation between the directly measured profiles and cou-pon profiles is shown in Table 1. The high correlations and lowroot mean squared errors indicate that the coupon profiles are ableto well capture the tool profiles.
4 Tool Condition Classification
This section presents a tool condition classification algorithm toidentify the state of wear. First, monitoring features are extractedfrom surface data to characterize tool conditions. Then Fisher’sdiscriminant ratio is used to select features which are closely
Table 1 Comparison results for impression method
Correlation coefficient Root mean squared error (lm)
Horizontal 0.9864 18.7Vertical 0.9731 25.9
Fig. 11 Process flowchart for feature extraction
Fig. 12 Shoulder width calculation
Fig. 13 Frequency features for different stages of wear: (a)Profiles in the space domain and (b) frequency-domain features
Journal of Manufacturing Science and Engineering MAY 2016, Vol. 138 / 051005-5
Downloaded From: http://manufacturingscience.asmedigitalcollection.asme.org/ on 11/24/2015 Terms of Use: http://www.asme.org/about-asme/terms-of-use
relevant to tool conditions. Finally, classifiers are developed toclassify tool conditions.
4.1 Monitoring Feature Generation. In this subsection, sev-eral monitoring features are generated from surface data in boththe space and frequency domains for tool condition classification.As indicated in Figs. 6 and 8, cross-sectional profiles in the hori-zontal direction which cut cross through knurl centers can wellcapture the characteristics of different tool life stages. Accord-ingly, features are extracted from the cross-sectional profiles toquantify tool wear. The procedure of extracting features is illus-trated in Fig. 11. First, tool surface is reconstructed by applyingimage processing algorithms, including noise elimination, imagerotation, baseline adjustment, horizontal flip, and height inversion,to the coupon data. Then representative cross-sectional profilesare obtained from tool surfaces. Assume the tool surface height isrepresented by a matrix H, the size of which is nr � nc, where nr
and nc are the numbers of rows and columns, respectively. Theextraction of the horizontal profiles can be conducted based on thefollowing algorithm.
Profile Extraction Algorithm
Step 1: Calculate the sum of each row for H. For the ith row,the sum is calculated using the following equation:
Si ¼Xnc
j¼1
Hij (1)
where i is the row index, i ¼ 1;…; nr , and j is the column index.
Step 2: Treat fSig as a profile, and identify the local maxima.We denote the indices of the local maxima as m1;…;mnp
,where np is the number of knurls along the vertical direction.
Step 3: Obtain the horizontal profiles by extracting the row vec-tors with the indices from step 2. For the kth index, the corre-sponding profile is extracted using the following equation:
lk ¼ Hmk(2)
where lk is the kth profile, k ¼ 1;…; np.Features are extracted from the obtained horizontal profiles in
both space and frequency domains. In the space domain, two fea-tures are used to describe knurl geometry, i.e., average knurlheight variance and average shoulder width. Knurl height varianceis defined as the variance around knurl peaks. As tool wears out,materials are removed from knurl top, and a smaller height var-iance will be present. Shoulder width is defined as the sum of theleft and right shoulders besides knurl peaks, as illustrated inFig. 12. As the tool wear becomes more severe, the shoulder widthwill increase. After calculating the knurl-level variance andshoulder width, tool level features are obtained by averaging themover all knurls.
Frequency-domain features are the amplitudes corresponding tothe dominant frequencies after applying fast Fourier transform(FFT) to the cross-sectional profiles. These features are able tocapture the overall periodic pattern which is closely related to thetool wear level. Figure 13 shows (a) original profiles in four wearstages and (b) FFT profiles. From (b), it is shown that the ampli-tude of the first dominant frequency, 0.7040, which is correspond-ing to the diameter of a knurl, 1.4 mm, has a decreasing trend astool wear gets more severe; however, the amplitude of the seconddominant frequency, 1.43, corresponding to half period, 0.7 mm,has an increasing trend. Thus, the amplitudes of first to fifth domi-nant frequencies are considered as candidate features.
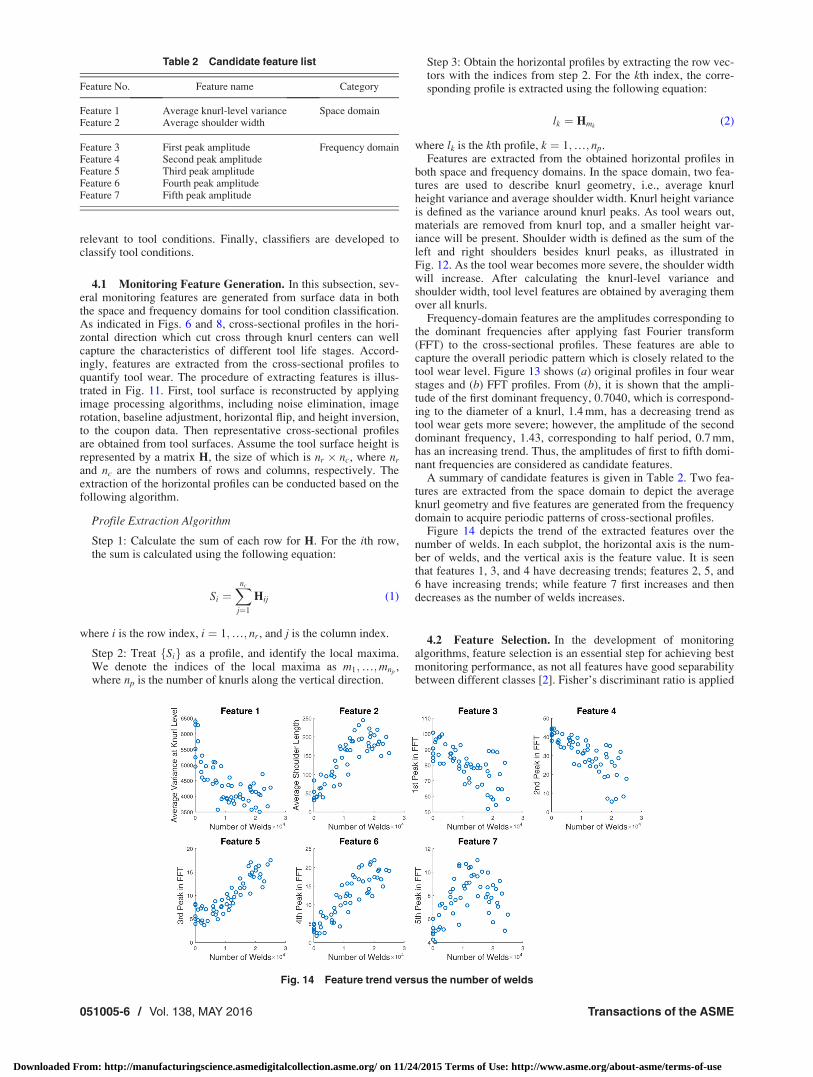
A summary of candidate features is given in Table 2. Two fea-tures are extracted from the space domain to depict the averageknurl geometry and five features are generated from the frequencydomain to acquire periodic patterns of cross-sectional profiles.
Figure 14 depicts the trend of the extracted features over thenumber of welds. In each subplot, the horizontal axis is the num-ber of welds, and the vertical axis is the feature value. It is seenthat features 1, 3, and 4 have decreasing trends; features 2, 5, and6 have increasing trends; while feature 7 first increases and thendecreases as the number of welds increases.
4.2 Feature Selection. In the development of monitoringalgorithms, feature selection is an essential step for achieving bestmonitoring performance, as not all features have good separabilitybetween different classes [2]. Fisher’s discriminant ratio is applied
Table 2 Candidate feature list
Feature No. Feature name Category
Feature 1 Average knurl-level variance Space domainFeature 2 Average shoulder width
Feature 3 First peak amplitude Frequency domainFeature 4 Second peak amplitudeFeature 5 Third peak amplitudeFeature 6 Fourth peak amplitudeFeature 7 Fifth peak amplitude
Fig. 14 Feature trend versus the number of welds
051005-6 / Vol. 138, MAY 2016 Transactions of the ASME
Downloaded From: http://manufacturingscience.asmedigitalcollection.asme.org/ on 11/24/2015 Terms of Use: http://www.asme.org/about-asme/terms-of-use

to perform feature screening in a computationally simple and fastmanner. Fisher’s discriminant ratio was first presented in Ref.[26], and it is a separability measure for feature selection [27]. Alarger Fisher’s ratio indicates more significant difference betweentwo classes. Fisher’s ratio is defined as
J ¼l1 � l2ð Þ2
s21 þ s2
2
(3)
where l1 and l2 are the means of new and worn classes, s21 and s2
2
are respective variances.
Fifty-six coupons have been collected from a battery manufac-turing plant, and expert knowledge is used to classify them as new(class 1) and slightly worn (class 2). Fisher’s ratios are then calcu-lated for all candidate features, the results of which are shown inFig. 15. Features 2, 5, and 6 have higher ratios, indicating thatthey can provide better separability between new and slightlyworn coupons. As a result, features 2, 5, and 6 (average shoulderwidth, third and fourth peak amplitudes in the frequency domain)are chosen for monitoring tool conditions. Scatter plots of thesefeatures are shown in Fig. 16, which indicates good classseparability.
4.3 Classification. In this subsection, classifiers are designedfor tool condition classification, and leave-one-out cross-validation (LOOCV) is applied to evaluate the performance. Can-didate classifiers include linear classifier [26], quadratic classifier[28], and support vector machine (SVM) [29]. When the data sam-ple size is limited, cross-validation is commonly used for evaluat-ing and comparing learning algorithms [2]. LOOCV proposes topartition the data into two sets: one set only includes one observa-tion and is used for model validation, and the remaining observa-tions are used for model training. By repeating this partition forall observations, LOOCV is able to predict and compare the per-formance of different learning algorithms.
In order to ensure satisfactory welding quality, the battery plantapplies a conservative tool replacement strategy, i.e., the tools arealways replaced before the degradation can affect the weld qual-ity. Therefore, it is very difficult to collect coupons that reflecttruly worn tools’ surface profiles from production. To obstaclethis issue, eight coupon surfaces are simulated by truncating theknurl peaks from new or slightly worn surfaces, and examples ofsimulated profiles are shown in Fig. 17.
In this research, 64 coupons, including 38 new coupons (class1), 18 slightly worn coupons (class 2), and 8 simulated completelyworn coupons (class 3) are used for classifier training andLOOCV. The comparison of linear classifier, quadratic classifier,and SVM is shown in Tables 3–6.
From Tables 3–6, it is noticed that the quadratic classifierachieves the best performance, and the corresponding cross-validation misclassification rate is 3.13%. Additionally, all cou-pons in class 3 are classified correctly, and no class 1 or class 2coupons are misclassified as class 3, implying that the quadraticclassifier is able to accurately distinguish class 3 from the othertwo classes. On the other hand, the linear classifier and SVM havesignificantly larger misclassification rates, and neither of them is
Fig. 15 Fisher’s ratio for all features
Fig. 16 Scatter plots of selected features
Fig. 17 Simulated profiles for worn tools
Table 3 Misclassification rates of different classifiers
Linear Quadratic SVM
Training error rate 15.63% 1.56% 15.63%(10/64) (1/64) (10/64)
CV error rate 15.63% 3.13% 18.75%(10/64) (2/64) (12/64)
Journal of Manufacturing Science and Engineering MAY 2016, Vol. 138 / 051005-7
Downloaded From: http://manufacturingscience.asmedigitalcollection.asme.org/ on 11/24/2015 Terms of Use: http://www.asme.org/about-asme/terms-of-use

able to completely distinguish class 3 from the other two classes.Consequently, for this application, the quadratic classifier is ableto achieve satisfactory classification performance.
Note to Practitioners. When applying this tool wear monitoringframework on the plant floor, it is recommended to adopt a moreefficient and cost-effective measurement system to measure thecoupons. As shown by the previous results in this section, cross-sectional profiles along the horizontal direction contain rich infor-mation on the tool degradation level. Therefore, one potentialmeasurement system may be a line scanner with sufficient resolu-tions, the measurement of which is generally completed withinminutes. In this way, the tool condition monitoring can be con-ducted in a more timely manner.
5 Conclusion
Tool wear characterization and monitoring for ultrasonic weld-ing of lithium-ion batteries have been investigated in this paper.By comparing tool surface measurements at different tool lifestages, tool wear is characterized by four stages using changes inthe knurl geometry. A novel impression method is then developedto efficiently and accurately obtain tool surface profiles withoutintroducing significant interruption to plant production. Finally,an effective monitoring algorithm is developed using a quadraticclassifier and features that are extracted from space and frequencydomains of cross-sectional profiles on tool surfaces.
This study enhances our understanding of the tool wear mecha-nism in an ultrasonic metal welding, and the algorithm can be uti-lized to accurately identify tool conditions, leading to decreasedproduction costs while ensuring good joining quality in batterymanufacturing.
Acknowledgment
This material is based upon work supported by the Departmentof Energy under Award No. DE-EE0002217.
References[1] Kim, T., Yum, J., Hu, S., Spicer, J., and Abell, J., 2011, “Process Robustness of
Single Lap Ultrasonic Welding of Thin, Dissimilar Materials,” CIRP Ann.Manuf. Technol., 60(1), pp. 17–20.
[2] Shao, C., Paynabar, K., Kim, T. H., Jin, J. J., Hu, S. J., Spicer, J. P., Wang, H.,and Abell, J. A., 2013, “Feature Selection for Manufacturing Process Monitor-ing Using Cross-Validation,” J. Manuf. Syst., 32(4), pp. 550–555.
[3] Lee, S. S., Shao, C., Kim, T. H., Hu, S. J., Kannatey-Asibu, E., Cai, W. W.,Spicer, J. P., and Abell, J. A., 2014, “Characterization of Ultrasonic MetalWelding by Correlating Online Sensor Signals With Weld Attributes,” ASMEJ. Manuf. Sci. Eng., 136(5), p. 051019.
[4] Lee, S. S., Kim, T. H., Hu, S. J., Cai, W. W., Abell, J. A., and Li, J., 2013,“Characterization of Joint Quality in Ultrasonic Welding of Battery Tabs,”ASME J. Manuf. Sci. Eng., 135(2), p. 021004.
[5] Lee, S. S., Kim, T. H., Hu, S. J., Cai, W. W., and Abell, J. A., 2015, “Analysisof Weld Formation in Multilayer Ultrasonic Metal Welding Using High-SpeedImages,” ASME J. Manuf. Sci. Eng., 137(3), p. 031016.
[6] Shao, C., Guo, W., Kim, T. H., Jin, J. J., Hu, S. J., Spicer, J. P., and Abell, J. A.,2014, “Characterization and Monitoring of Tool Wear in Ultrasonic MetalWelding,” 9th International Workshop on Microfactories, pp. 161–169.
[7] Jantunen, E., 2002, “A Summary of Methods Applied to Tool Condition Moni-toring in Drilling,” Int. J. Mach. Tools Manuf., 42(9), pp. 997–1010.
[8] Cook, N. H., 1973, “Tool Wear and Tool Life,” ASME J. Manuf. Sci. Eng.,95(4), pp. 931–938.
[9] Koren, Y., Ko, T.-R., Ulsoy, A. G., and Danai, K., 1991, “Flank Wear Estima-tion Under Varying Cutting Conditions,” ASME J. Dyn. Syst. Meas. Control,113(2), pp. 300–307.
[10] Abellan-Nebot, J. V., and Subir�on, F. R., 2010, “A Review of Machining Moni-toring Systems Based on Artificial Intelligence Process Models,” Int. J. Adv.Manuf. Technol., 47(1–4), pp. 237–257.
[11] Rehorn, A. G., Jiang, J., and Orban, P. E., 2005, “State-of-the-Art Methods andResults in Tool Condition Monitoring: A Review,” Int. J. Adv. Manuf. Tech-nol., 26(7–8), pp. 693–710.
[12] Zhou, J.-H., Pang, C. K., Zhong, Z.-W., and Lewis, F. L., 2011, “Tool WearMonitoring Using Acoustic Emissions by Dominant-Feature Identification,”IEEE Trans. Instrum. Meas., 60(2), pp. 547–559.
[13] Ertunc, H. M., Loparo, K. A., and Ocak, H., 2001, “Tool Wear Condition Moni-toring in Drilling Operations Using Hidden Markov Models (HMMs),” Int. J.Mach. Tools Manuf., 41(9), pp. 1363–1384.
[14] Dimla, D. E., 2000, “Sensor Signals for Tool-Wear Monitoring in Metal CuttingOperations—A Review of Methods,” Int. J. Mach. Tools Manuf., 40(8),pp. 1073–1098.
[15] Kurada, S., and Bradley, C., 1997, “A Machine Vision System for Tool WearAssessment,” Tribol. Int., 30(4), pp. 295–304.
[16] Kurada, S., and Bradley, C., 1997, “A Review of Machine Vision Sensors forTool Condition Monitoring,” Comput. Ind., 34(1), pp. 55–72.
[17] Lanzetta, M., 2001, “A New Flexible High-Resolution Vision Sensor for ToolCondition Monitoring,” J. Mater. Process. Technol., 119(1), pp. 73–82.
[18] Byrne, G., Dornfeld, D., Inasaki, I., Ketteler, G., K€onig, W., and Teti, R., 1995,“Tool Condition Monitoring (TCM)—The Status of Research and IndustrialApplication,” CIRP Ann. Manuf. Technol., 44(2), pp. 541–567.
[19] Kuttolamadom, M., Mehta, P., Mears, L., and Kurfess, T., 2015, “Correlationof the Volumetric Tool Wear Rate of Carbide Milling Inserts With the MaterialRemoval Rate of ti–6al–4v,” ASME J. Manuf. Sci. Eng., 137(2), p. 021021.
[20] Kuttolamadom, M. A., Mears, M. L., and Kurfess, T. R., 2015, “The Correla-tion of the Volumetric Wear Rate of Turning Tool Inserts With Carbide GrainSizes,” ASME J. Manuf. Sci. Eng., 137(1), p. 011015.
[21] Kang, J., Park, I., Jae, J., and Kang, S., 1999, “A Study on a Die Wear ModelConsidering Thermal Softening: (i) Construction of the Wear Model,” J. Mater.Process. Technol., 96(1), pp. 53–58.
[22] Kang, J., Park, I., Jae, J., and Kang, S., 1999, “A Study on Die Wear ModelConsidering Thermal Softening (ii): Application of the Suggested Wear Mod-el,” J. Mater. Process. Technol., 94(2), pp. 183–188.
[23] Lepadatu, D., Hambli, R., Kobi, A., and Barreau, A., 2006, “Statistical Investi-gation of Die Wear in Metal Extrusion Processes,” Int. J. Adv. Manuf. Technol.,28(3–4), pp. 272–278.
[24] Kong, L. X., and Nahavandi, S., 2002, “On-Line Tool Condition Monitoring and Con-trol System in Forging Processes,” J. Mater. Process. Technol., 125–126, pp. 464–470.
[25] Wu, C. J., and Hamada, M. S., 2011, Experiments: Planning, Analysis, andOptimization, Wiley, New York.
[26] Fisher, R. A., 1936, “The Use of Multiple Measurements in Taxonomic Prob-lems,” Ann. Eugen., 7(2), pp. 179–188.
[27] Duda, R. O., Hart, P. E., and Stork, D. G., 2012, Pattern Classification, Wiley,New York.
[28] Zhang, M., 1997, “Identification of Protein Coding Regions in the HumanGenome by Quadratic Discriminant Analysis,” Proc. Natl. Acad. Sci. U. S. A.,94(2), pp. 565–568.
[29] Suykens, J. A., and Vandewalle, J., 1999, “Least Squares Support VectorMachine Classifiers,” Neural Process. Lett., 9(3), pp. 293–300.
Table 6 Confusion matrices for cross-validation
Class 1 Class 2 Class 3
SVM (predicted class)Class 1 68.42% 5.26% 26.32%
(26/38) (2/38) (10/38)
True class Class 2 0 100% 0(18/18)
Class 3 0 0 100%(8/8)
Table 4 Confusion matrices for cross-validation
Class 1 Class 2 Class 3
Linear classifier (predicted class)Class 1 76.32% 2.63% 21.05%
(29/38) (1/38) (8/38)
True class Class 2 5.56% 94.44% 0(1/18) (17/18)
Class 3 0 0 100%(8/8)
Table 5 Confusion matrices for cross-validation
Class 1 Class 2 Class 3
Quadratic classifier (predicted class)Class 1 97.37% 2.63% 0
(37/38) (1/38)
True class Class 2 5.56% 94.44% 0(1/18) (17/18)
Class 3 0 0 100%(8/8)
051005-8 / Vol. 138, MAY 2016 Transactions of the ASME
Downloaded From: http://manufacturingscience.asmedigitalcollection.asme.org/ on 11/24/2015 Terms of Use: http://www.asme.org/about-asme/terms-of-use