Tonk District Factbook | Rajasthan | Datanetindia … district on the North, by Sawai Madhopur...
32
Transcript of Tonk District Factbook | Rajasthan | Datanetindia … district on the North, by Sawai Madhopur...

RajasthanDistrict Factbook™
Tonk District
(Key Socio-economic Data of Tonk District, Rajasthan)January, 2018
Editor & DirectorDr. R.K. Thukral
Research EditorDr. Shafeeq Rahman
Compiled, Researched and Published byDatanet India Pvt. Ltd.D-100, 1st Floor,Okhla Industrial Area, Phase-I,New Delhi-110020.Ph.: 91-11-43580781, 26810964-65-66Email : [email protected] : www.districtsofindia.com
Online Book Store :www.datanetindia-ebooks.com
Also available at :
Report No.: DFB/RJ-120-0118
ISBN : 978-93-86370-93-8
First Edition : January, 2017
Second Edition : January, 2018
Price : Rs. 7500/- US$ 200
Printed in India
© 2018 Datanet India Pvt. Ltd.All rights reserved. No part of this book may be reproduced, stored in a retrievalsystem or transmitted in any form or by any means, mechanical photocopying,photographing, scanning, recording or otherwise without the prior writtenpermission of the publisher. Please refer to Disclaimer & Terms of Use at page no.232 for the use of this publication.

Tonk District at a Glance
District came into Existence NA
District Headquarter Tonk
Distance from State Capital 106 Kms.
Geographical Area (In Square km.) 7,194 (Ranks 18th in State and 125th in India)Wastelands Area (In Square km.)(2008-2009)
786.63
Total Number of Households 2,67,840
Population 14,21,326 (Persons), 7,28,136 (Males), 6,93,190 (Females) (Ranks 23rd in Stateand 347th in India)
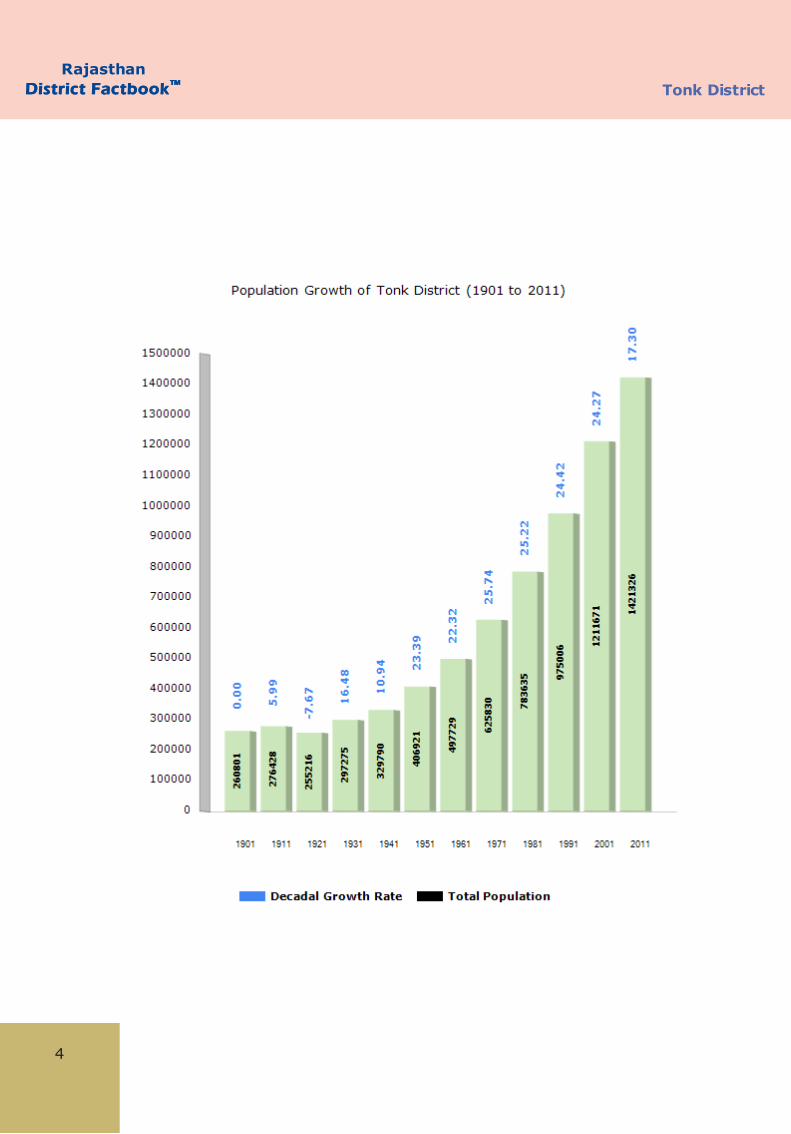
Population Growth Rate (2001-2011)
17.3 (Persons), 16.23 (Males), 18.45 (Females)
Number of SubDistricts/Towns/Villages
Sub-districts (07), Towns (08) and Villages (1,183)
Forest Cover (2015) 2.34% of Total Geographical AreaPercentage of Urban/RuralPopulation
22.35 (Urban), 77.65 (Rural)
Administrative Language Hindi
Principal Languages (2001) Hindi (94.36%), Urdu (5.20%), Sindhi (0.24%), Bengali (0.06%), Punjabi (0.02%),Malayalam (0.02%) and Others (0.03%)
Population Density 198 (Persons per Sq. km.)
Sex Ratio 952 (Females per 1000 Males)
Child Ratio (Age Group 0-6 Year) 892 (Females per 1000 Males)
Number of Live Births (2015) 32,626 (Persons), 17,830 (Males), 14,796 (Females)
Number of Deaths (2015) 10,529 (Persons), 5,711 (Males), 4,818 (Females)
Literacy Rate (In %age) 61.58 (Persons), 77.12 (Males), 45.45 (Females)
Literates 7,49,659 (Persons), 4,78,329 (Males), 2,71,330 (Females)
Illiterates 6,71,667 (Persons), 2,49,807 (Males), 4,21,860 (Females)
Major Religions Hindu (87.49%), Muslim (10.77%), Jain (1.58%), Christian (0.05%), Sikh (0.03%)and Buddhist (0.01%)
Schedule Caste Population 2,87,903 (Persons), 1,48,110 (Males), 1,39,793 (Females), Percentage of SC inTotal Population (2.36)
Major Schedule Caste Population
Bairwa, Berwa (49.84%); Chamar, Bhambhi, Bambhi, Bhambi, Jatia, Jatav,Jatava, Mochi, Raidas, Rohidas, Regar, Raigar, Ramdasia, Asadaru, Asodi,Chamadia, Chambhar, Chamgar, Haralayya, Harali, Khalpa, Machigar, Mochigar,Madar, Madig, Telegu Mochi, Kamati Mochi, Ranigar, Rohit, Samgar (16.57%);Khatik (6.1%); Balai (4.88%); Koli, Kori (4.13%)
Schedule Tribe Population 1,78,207 (Persons), 92,677 (Males), 85,530 (Females), Percentage of ST in TotalPopulation (1.93)
Major Schedule Tribe Population
Mina (91.34%); Bhil, Bhil Garasia, Dholi Bhil, Dungri Bhil, Dungri Garasia, MewasiBhil, Rawal Bhil, Tadvi Bhil, Bhagalia, Bhilala, Pawra, Vasava, Vasave (7.85%);Dhanka, Tadvi, Tetaria, Valvi (0.17%); Naikda, Nayaka, Cholivala Nayaka,Kapadia Nayaka, Mota Nayaka, Nana Nayaka (0.05%); Koli Dhor, Tokre Koli,Kolcha, Kolgha (0.01%)
Number of Total Workers 6,49,161 (Persons), 3,71,848 (Males), 2,77,313 (Females)Labour Force Participation Rate(2011-2012)
37.36% (Rural), 30.64% (Urban)
Major Source of Income AgriculturalGross District Domestic Product(2016-17) (AE) (Rs. in Lakh)
13,28,498 At Current Price / 9,61,543 At Constant (2011-2012) Prices
Net District Domestic Product(2016-17) (AE) (Rs. in Lakh)
12,14,868 At Current Price / 8,73,718 At Constant (2011-2012) Prices
Per Capita Income (NDDP, At FactorCost) (2016-17) (AE) (In Rs.)
78,900 At Current Price / 56,744 At Constant (2011-2012) Prices
Number of Tourists (-) NA
Major Tourist PlacesRajamahal, Jama Masjid, Sunehri Kothi, Nagarfort, Hathi Bhata, Kalpvriksh,Shivaji Garden, Historical Ghanta Ghar, Rasiya Ke Tekri, Mandakala, Toda RaiSingh Town, Jaldevi Mandir, Raja Rai Singh Mahal.
Note: A ll figures for 2011 Census, Otherwise year is mentioned.

No. Particulars Page No.
1 Administrative Setup 1-10
Location Map | District w ith Sub-Districts | Reference Map of District |About District | Administrative Unit | Villages | Towns | Wards |Panchayats
2 Demographics 11-32
Population l Sex Ratio | Density | Child Population | Child Sex Ratio |Decadal Growth | Age Group Population | Age Group Population ofCurrently Married | Economically Active Population | Ageing Population |Dependency Ratio | Single Year Age Population | Scheduled CastePopulation | Scheduled Tribe Population | Religious Population | CD BlockPopulation
3 Economy 33-46
GDP/NDP | Per Capita Income | Households by Income Groups |Disposable Income | Banking | District Central Cooperative Banks | LeadBank | Investment and Debt | APL/BPL/ AAY Families | Fair Price Shops |Revenue Collection from Transport
4 Market Size 47-58
Monthly Per Capita Expenditure | Estimated Annual Expenditure /Average Per Capita Consumer Expenditure on Services and DurableGoods
5 Life Style 59-63
Households having Radio/Transistor, Television | Households havingComputer/Laptop/Internet | Households having Telephone/MobilePhone | Households having Bicycle, Scooter/Motor Cycle/Moped &Car/Jeep/Van | Circulation of Dailies
6 Infrastructure 64-79
Occupied Houses used as Shops/Offices | Amenities | Sanitation |Vehicle Registered | Road Length | Licences Issued | Electrified Villages |Post Office & PIN Code | Major Tourist Places | LPG Distributors
7 Industries 80-87
Establishment and Person Employed by Broad Activities | ManufacturingIndustries Share of GDP | Outstanding Credit of SCBs according toIndustrial Occupation | Micro, Small and Medium Enterprises | OngoingProjects
8 Labour and Workforce 88-96
Total Workers | Main Workers | Marginal Workers | Non-Workers |Average Wages/Earning per Day Received by Usual Principal ActivityStatus | Daily Agricultural Wages | Employment Indicators
9 Agriculture 97-114
Land Utilisation | Production of Major Food Crops | Production ofCommercial Crops | Production of Fruit & Vegetable Crops | Productionof Spices | Consumption of Fertilisers | Veterinary Institutions | Milk, Eggand Wool Production | Livestock Population | Poultry Population |Irrigation | Land Holdings | Farmer

10 Education 115-122
Literacy Rate | Population by Educational Level | Census Houses Usedas School/College etc. | Enrolment | Enrolment by Medium of Instruction| Gross/Net Enrolment Ratio | Drop-Out Rate | Teachers | Gini CoefficientEducation | Population by Mother Tongue
11 Health 123-136
Health Institutions | Live Births Registered | Still Births Registered |Deaths Registered | Infant Deaths Registered | Disabled Population byType of Disability | Houses used for Hospital/Dispensary | Households byMarried Couples per Household and Dwelling Rooms | Maternal and ChildHealth Indicators (HMIS) | Family Welfare Programmes | National FamilyHealth Survey (NFHS)
12 Environment and Pollution 137-140
Geographical Area | Wastelands | Forest Cover | Rainfall | Latitude,Longitude and Altitude | Ground Water
13 Housing 141-152
Households | Houseless Households | Houseless Population | Standardof Living Index | Housing Condition | House and Their Uses | SlumPopulation
14 Crime & Law 153-158
IPC/SLL Crimes | Road Accidents | Police Officer/Officials | Judicial Officers
15 Social and Welfare Schemes 159-163
Mahatma Gandhi National Rural Employment Guarantee Scheme(MGNREGS) | Pradhan Mantri Awaas Yojana (PMAY) | National RuralDrinking Water Programme (NRDWP) | Swachh Bharat Mission (SBM)-Gramin | Self-Help Groups (SHGs) | Aadhaar Card (UIDAI) Enrolments
16 Electoral 164-166
Vote Distribution of Major Parties (Parliamentary Election-2014 andAssembly Election 2013) | Name and Address of MPs/MLAs | Electors
17 Annexure - I to V 167-225
18 Useful Contacts 226
19 Abbreviations & Sources 227
20 Concepts and Definitions 228-231
21 Disclaimer & Terms of Use 232

RajasthanDistrict FactbookDistrict Factbook™™ Tonk District

1
Tonk DistrictRajasthan
District FactbookDistrict Factbook™™
Administrative Setup
Location Map

RajasthanDistrict FactbookDistrict Factbook™™ Tonk District
Administrative Setup
2

3
Tonk DistrictRajasthan
District FactbookDistrict Factbook™™
Administrative Setup
RajasthanDistrict FactbookDistrict Factbook™™ Tonk District
4

5
Tonk DistrictRajasthan
District FactbookDistrict Factbook™™
About Tonk District
Historically, Tonk was founded in 1818 by an Afghan military leader who was grantedland by the ruler of Indore. During the regime of Nawabs, the natives were invited to anIslamic function of Milad-du-nabi without regard to caste, color or creed. It wasorganized by the ruling Nawabs for a period of seven days in the month of Rabi-ul-Awwal. The founding ruler of Tonk was Nawab Mohammed Amir Khan. Tonk was known asSamwad Lakshya in the Mahabharat period. In the Mauryas regime, it was under theMauryas and then it was merged into Malvas. Most of the period was under the kingHarshvardhan. In the regime of the Rajputs, this state was under Chavras, Solankis,Kachvahs, Sisodiyas and Chouhans. Later, it was under the regime of King Holkar andSindhia. In 1806, Amir Khan took it from Balvant Rao Holkar. After that Britishgovernment captured it.
Geographically, the district extends to a geographical area of 7,194 sq km and occupiesrank 18th in the State and 125th in India on basis of this size. As per data recorded inthe year 2015, the forest covers 2.34% of the total geographical area of the district. Itlies at 26°17'N latitude, 75°78'E longitude and 289 m altitude. It is bounded with byJaipur district on the North, by Sawai Madhopur district on the East, by Kota district onthe South-East, by Bundi district on the South, by Bhilwara district on the South-West,and by Ajmer district on the West. It is situated on the National Highway 12. The actualrainfall in the district was 766.1 mm in the year of 2016-17.
Administratively, the district is divided into 7 sub-districts namely Deoli, Malpura, Newai,Todaraisingh, Tonk, Uniara and Peeplu. Moreover, it has 8 towns and 1,183 villages. Hindiis its administrative language. The district of Tonk came into existence in the state ofRajasthan with an allotted district code of 120. Its district Headquarter is at Tonk whichis located at a distance of 106 km from the State Capital. There are 1 parliamentary and4 assembly constituencies in the district.
Demographically, according to 2011 census, the district is home to a total number of2,67,840 households including 14,21,326 with 7,28,136 are males and 6,93,190 arefemales, causing it to rank 23rd in the State and 347th in India. The population growthrate during the period 2001 to 2011 was 17.3 % with 16.23% are males and 18.45% arefemales. The density of population of the district is 198 persons per sq km. The sex ratiois pegged at 952 (females per 1000 males) while the child ratio stands at 892 (femalesper 1000 males). The schedule caste population of the district is recorded as 2,87,903including 1,48,110 are males and 1,39,793 are females. The percentage of ScheduleCaste is 2.36%. The schedule tribe population is 1,78,207 including 92,677 are males and85,530 are females. The percentage of Schedule Tribe is 1.93%. The major religions inthe district are Hindu at 87.49% and Muslim at 10.77% of the total population.
Economically, agriculture is the main source of the income in the region. It is the one ofthe districts which is receiving ‘Backward Region Grant Fund’ (BRGF). The GDDP or GrossDistrict Domestic Product during 2016-17 (AE) was Rs 13,28,498 lakh at Current Priceand Rs 9,61,543 lakh at Constant (20 11-12) Prices. The NDDP, or Net District DomesticProduct during 2016-17 (AE) was Rs 12,14,868 lakh at Current Price and Rs 8,73,718lakh at Constant (20 11-12) Prices. The Per Capita Income or NDDP, at factor costduring 2016-17 (AE) was Rs. 78,900 at Current Price and Rs 56,744 at Constant (20 11-12) Prices.

RajasthanDistrict FactbookDistrict Factbook™™ Tonk District
Educationally, according to 2011 census, according to 2011 census, the literacy rate inthe district is 61.58% including 77.12% are males and 45.45% are females. The totalliterate population of the district is 7,49,659 comprise 4,78,329 are males and 2,71,330are females. There are a number of institutes which are imparting education in thedistrict Such as Government PG College (Tonk), Government College (Malpura),Government College (Deoli) and Dr. K.N.Modi University (Niwai, Tonk).
Prabhu Lal Saini is a key personality in politics of Rajasthan. He was born in village Anwa,which is situated nearly 45 km to district headquarter Tonk. He belongs to BharatiyaJanata Party. He is present cabinet minister (Minister of Agriculture and AnimalHusbandry) in the government of Rajasthan led by Vasundhara Raje. He is elected toRajasthan Legislative Assembly from Tonk district. He was also agriculture Minister ofRajasthan from 2003 - 2008, in last BJP Govt. He won Legislative Assembly electioncontinuously, three times.
The district has various famous historical and religious places which attract tourists fromworldwide. These places are Raja Mahal, Jama Masjid, Sunehri Kothi, Nagar Fort, HathiBhata, Kalp Vriksh, Shivaji Garden, Historical Ghanta Ghar, Rasiya Ke Tekri, Mandakala,Toda Rai Singh Town, Jaldevi Mandir and Raja Rai Singh Mahal etc.
Karpoor Chandra Kulish (1926–2006) is a well known personality from Tonk. He was thefounder of Rajasthan Patrika, a Hindi language newspaper of Rajasthan, India. He wasborn in Soda village in Malpura tehsil in Tonk district. He is a fearless journalist. His mainliterary works are "America Ek Vihangam Drishti", "Mein Dekhta Chala Gaya" and hisbiography "Dharapravah". In 1990, he got the B.D. Goenka Foundation award for"Outstanding Contribution in the Indian Language Newspaper" category for the year1987. In 1991, the Prime Minister of India, Chandra Shekhar, felicitated him for hiscontributions at the golden jubilee of the All India Editors’ Conference. He received theGanesh Shankar Vidyarthi Award (2000) and the highest honor of Prayag ‘SahityaVachaspati’ by The Hindi Sahitya Sammelan. He was also honored by The MaharishiSandipani Rashtriya Ved Vidya Pratisthan, Ujjain. A postal stamp was issued on May 16th,2012 by the Indian Postal Department.
6

7
Tonk DistrictRajasthan
District FactbookDistrict Factbook™™
Administrative Setup Administrative UnitAdministrative Division:- Ajmer
Sub-districts:
1. Deoli
2. Malpura
3. Niwai
4. Peeplu
5. Todaraisingh
6. Tonk
7. Uniara
Towns:
1. Aligarh (CT)
2. Banasthali (CT)
3. Deoli (M)
4. Malpura (M)
5. Niwai (M)
6. Todaraisingh (M)
7. Tonk (M C l)
8. Uniara (M)
Sub-districts, Towns, CD Blocks and Villages(2011)
District Sub-districts Towns CD Blocks Villages
Tonk 7 8 6 1183
Rajasthan 244 297 248 44672
India 5924 7933 6596 640930
Rank of District in State 19 19 22 15
Rank of District in India 316 313 427 212

11
Tonk DistrictRajasthan
District FactbookDistrict Factbook™™
Demographics
Population(2011)
Residence District Persons Male Female
Total Tonk 1421326 728136 693190
Rajasthan 68548437 35550997 32997440
India 1210854977 623270258 587584719
Rank of District in State 23 23 22
Rank of District in India 347 348 344
Rural Tonk 1103603 568045 535558
Rajasthan 51500352 26641747 24858605
India 833748852 427781058 405967794
Rank of District in State 24 24 24
Rank of District in India 311 308 312
Urban Tonk 317723 160091 157632
Rajasthan 17048085 8909250 8138835
India 377106125 195489200 181616925
Rank of District in State 17 17 17
Rank of District in India 288 294 285

37
Tonk DistrictRajasthan
District FactbookDistrict Factbook™™
Economy
Offices, Deposits, Credit and C-D Ratio of Scheduled Commercial Banks (SCBs)Rs. in Million (September, 2017)
Particulars Tonk Rajasthan IndiaRank ofDistrictin State
Rank ofDistrictin India
Number of Offices 149 6957 139045 18 320
Deposits 36042 3199764 109270408 22 406
Credit 33142 2196429 80059974 19 266
Credit-Deposit Ratio (C-D Ratio) 91.95 68.64 73.27 7 91
By Bank GroupRs. in Million (September, 2017)
Bank Group Tonk Rajasthan IndiaRank of
District inState
Rank ofDistrict in
IndiaRegional Rural BanksNumber of Offices 38 1498 21424 17 206
Deposits 5007 214326 3683525 16 244
Credit 4499 162871 2344928 16 167
Credit-Deposit Ratio (C-D Ratio) 89.85 75.99 63.66 11 147
Private Sector Banks Number of Offices 14 1081 24874 25 338
Deposits 2710 534592 25744725 25 382
Credit 5653 534067 22885953 16 256
Credit-Deposit Ratio (C-D Ratio) 208.60 99.90 88.90 4 34
Foreign BanksNumber of Offices - 6 288 0 0
Deposits - 6967 4579384 0 0
Credit - 9762 3606418 0 0
Credit-Deposit Ratio (C-D Ratio) - 140.13 78.75 0 0
Public Sector Banks Number of Offices 95 4340 91976 17 318
Deposits 28286 2442645 75206645 25 406
Credit 22937 1487823 51102986 18 269
Credit-Deposit Ratio (C-D Ratio) 81.09 60.91 67.95 7 108
Small Finance BanksNumber of Offices 2 32 483 3 74
Deposits 39 1234 56129 8 85
Credit 53 1905 119689 11 124
Credit-Deposit Ratio (C-D Ratio) 137.16 - 213.24 10 121
All Scheduled Commercial Banks Number of Offices 149 6957 139045 18 320
Deposits 36042 3199764 109270408 22 406
Credit 33142 2196429 80059974 19 266
Credit-Deposit Ratio (C-D Ratio) 91.95 68.64 73.27 7 91

49
Tonk DistrictRajasthan
District FactbookDistrict Factbook™™
Market Size
Broad Category-wise Monthly Per Capita Expenditure - Urban In Rs. (2011-2012)
Broad Categories of Goods and Services Tonk Rajasthan IndiaRank ofDistrictin State
Rank ofDistrictin India
Cereals 148.31 145.56 175.52 14 418
Cereal Substitute 0.00 0.25 1.27 0 0
Pulses & Products 22.47 33.18 54.48 32 588
Milk & Milk Products 421.46 302.87 186.47 3 19
Sugar & Salt 36.52 38.11 30.44 16 120
Edible Oil 53.07 56.98 63.62 23 324
Egg, Fish & Meat 15.27 21.57 66.94 20 512
Vegetables 82.86 68.61 81.40 4 209
Fruits (Fresh) 48.89 34.49 42.02 7 107
Fruits (Dry) 31.43 15.65 13.85 4 25
Spices 41.79 35.62 36.99 10 110
Beverages etc. 40.41 36.36 42.85 12 194
Served Processed Food 13.26 49.23 89.68 24 540
Packaged Processed Food 46.34 39.98 37.37 8 103
Pan 1.27 0.77 4.66 6 397
Tobacco 29.77 24.57 15.54 8 59
Intoxicants 7.97 14.03 13.36 17 301
Fuel and Light 164.95 191.64 182.54 18 211
C lothing 133.65 124.05 118.73 7 189
Bedding etc. 14.14 8.06 8.72 4 139
Footwear 20.82 37.20 29.09 24 370
Education 180.69 188.48 135.73 8 106
Medical (Institutional) 0.00 14.48 33.13 0 0
Medical (Non-institutional) 84.45 72.77 98.85 10 222
Entertainment 25.85 31.86 43.77 13 404
Minor Durable Type Goods 0.34 4.02 8.42 29 579
Toilet Articles 60.38 50.51 56.88 6 122
Other Household Consumables 49.04 45.74 48.90 10 172
Consumer Services excl. Conveyance 120.45 119.05 155.78 11 213
Conveyance 79.08 161.96 180.98 25 408
Rent 33.33 71.44 166.93 21 403
Consumer Taxes & Cesses 11.63 11.85 22.22 7 255
Durable Goods 660.71 154.25 152.10 2 18
Monthly Per Capita Expenditure (MPCE) 2680.60 2205.19 2399.24 2 88
63
Tonk DistrictRajasthan
District FactbookDistrict Factbook™™
Life Style
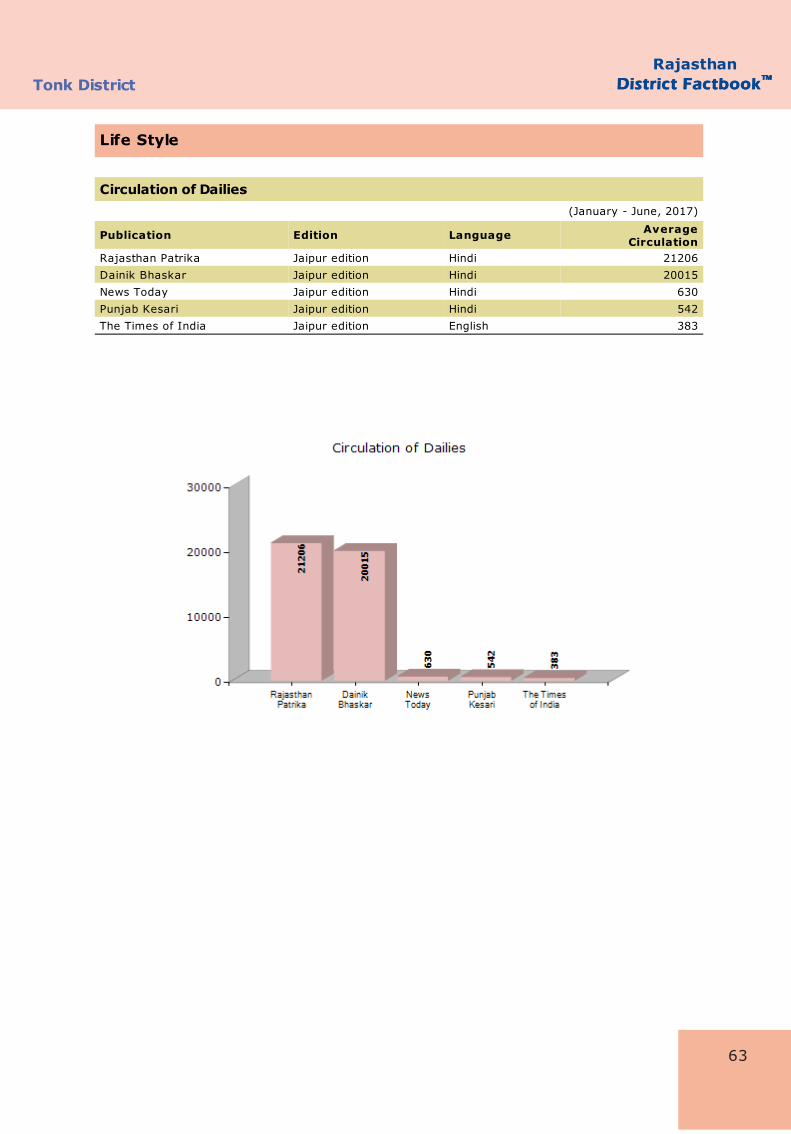
Circulation of Dailies (January - June, 2017)
Publication Edition Language AverageCirculation
Rajasthan Patrika Jaipur edition Hindi 21206
Dainik Bhaskar Jaipur edition Hindi 20015
News Today Jaipur edition Hindi 630
Punjab Kesari Jaipur edition Hindi 542
The Times of India Jaipur edition English 383
67
Tonk DistrictRajasthan
District FactbookDistrict Factbook™™
Infrastructure
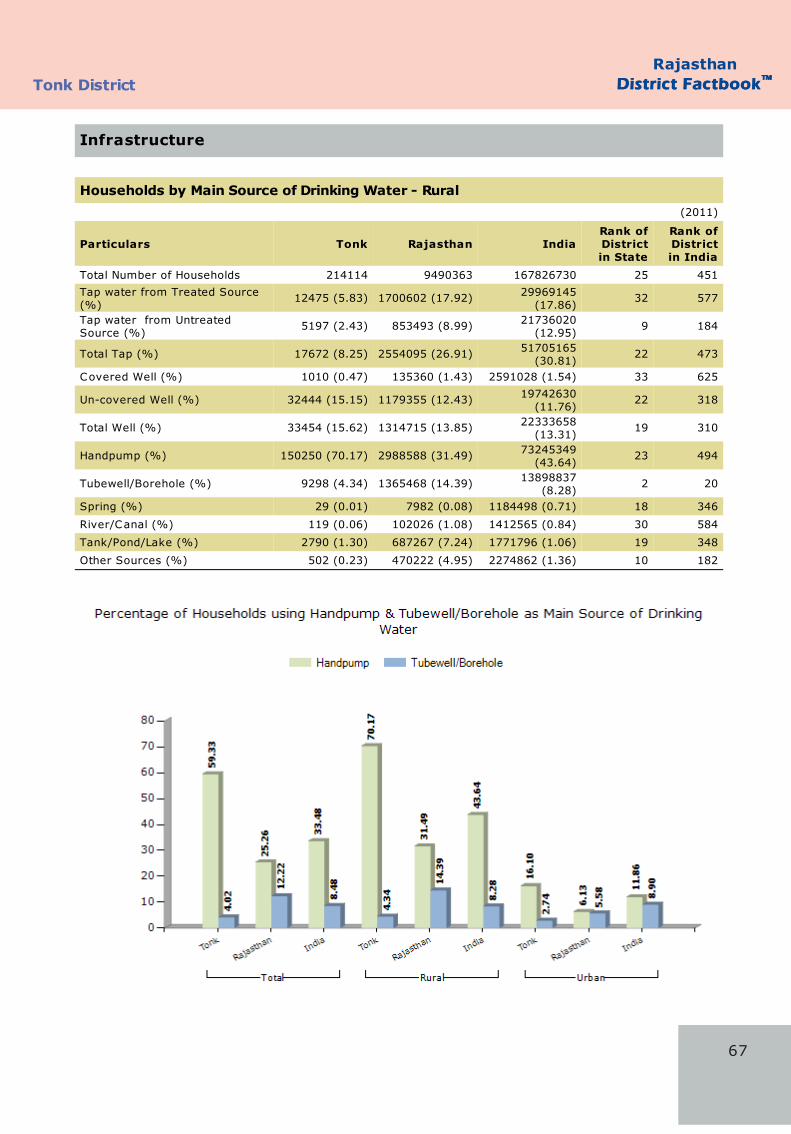
Households by Main Source of Drinking Water - Rural(2011)
Particulars Tonk Rajasthan IndiaRank ofDistrictin State
Rank ofDistrictin India
Total Number of Households 214114 9490363 167826730 25 451
Tap water from Treated Source(%)
12475 (5.83) 1700602 (17.92) 29969145(17.86)
32 577
Tap water from UntreatedSource (%)
5197 (2.43) 853493 (8.99) 21736020(12.95)
9 184
Total Tap (%) 17672 (8.25) 2554095 (26.91) 51705165(30.81)
22 473
Covered Well (%) 1010 (0.47) 135360 (1.43) 2591028 (1.54) 33 625
Un-covered Well (%) 32444 (15.15) 1179355 (12.43) 19742630(11.76)
22 318
Total Well (%) 33454 (15.62) 1314715 (13.85) 22333658(13.31)
19 310
Handpump (%) 150250 (70.17) 2988588 (31.49) 73245349(43.64)
23 494
Tubewell/Borehole (%) 9298 (4.34) 1365468 (14.39) 13898837(8.28)
2 20
Spring (%) 29 (0.01) 7982 (0.08) 1184498 (0.71) 18 346
River/Canal (%) 119 (0.06) 102026 (1.08) 1412565 (0.84) 30 584
Tank/Pond/Lake (%) 2790 (1.30) 687267 (7.24) 1771796 (1.06) 19 348
Other Sources (%) 502 (0.23) 470222 (4.95) 2274862 (1.36) 10 182

75
Tonk DistrictRajasthan
District FactbookDistrict Factbook™™
Infrastructure
Registered Motor Vehicles by Categories In Nos. (As on 31st March, 2017)
Categories Tonk Rajasthan Rank of Districtin State
Motor Rickshaw 0 90 0
Two Wheelers 207229 11250427 17
Auto Rickshaw 484 151425 32
Tempo - Passenger 162 43166 32
- Goods 262 69555 28
Car 5557 988391 29
Jeep 4227 435366 29
Tractor 22345 1029721 19
Trailers 1050 80042 22
Buses 1396 108681 23
Trucks 5086 561158 26
Taxi/Maxi/Cabs 1276 143075 29
Others 435 39465 26
Total 249509 14900562 17
Road Length under PWDIn Kms. (As on 31.03.2016)
District Black Top(BT)
WaterBound
Meccadum(WBM)
GravelledRoads
(GR)
SeasonalRoads
TotalRoad
Length
NationalHighways
Tonk 3210.14 3.97 13.00 0.50 3227.61 79.70
Rajasthan 145575.20 320.75 3018.09 162.10 149079.64 3466.54Rank of District inState
24 17 24 17 24 19

RajasthanDistrict FactbookDistrict Factbook™™ Tonk District
Industries
Establishment and Person Employed by Broad ActivitiesIn Nos. (2013)
Broad Activities DistrictEstablishment Person Employed
Rural Urban Total Rural Urban TotalA. Agriculture ActivitiesActivities Relating toAgriculture other thanCrop Production andPlantation
Tonk 1303 25 1328 2040 62 2102
Rajasthan 35074 1397 36471 54202 3956 58158
India 591177 50302 641479 1230186 131442 1361628
Rank of District in State 4 9 4 4 11 4
Rank of District in India 109 296 118 127 302 148
Livestock Tonk 23857 525 24382 39890 1010 40900
Rajasthan 558455 24029 582484 994894 43969 1038863
India 10528619 861707 11390326 17987448 1430992 19418442
Rank of District in State 3 8 3 3 7 3
Rank of District in India 121 241 123 116 231 124
Forestry and Logging Tonk 86 4 90 179 14 193
Rajasthan 4404 355 4759 6929 888 7817
India 578280 24187 602467 1167371 57438 1224809
Rank of District in State 7 15 7 6 11 7
Rank of District in India 234 415 268 227 389 273
Fishing and Aqua Culture Tonk 22 5 27 42 5 47
Rajasthan 375 105 480 641 197 838
India 387133 110168 497301 672313 205309 877622
Rank of District in State 3 3 3 3 6 3
Rank of District in India 360 354 382 355 400 385
Total Tonk 25268 559 25827 42151 1091 43242
Rajasthan 598308 25886 624194 1056666 49010 1105676
India 12085209 1046364 13131573 21057318 1825181 22882501
Rank of District in State 3 9 3 3 7 3
Rank of District in India 137 279 141 134 282 138
B. Non-Agriculture ActivitiesMining and Quarrying Tonk 26 5 31 293 6 299
Rajasthan 5873 1182 7055 39279 6349 45628
India 62810 22366 85176 404956 152518 557474
Rank of District in State 24 23 25 19 25 22
Rank of District in India 376 412 397 257 484 299
Manufacturing Tonk 4712 3767 8479 9050 8839 17889
Rajasthan 264718 211231 475949 675212 616459 1291671
India 5442870 4886952 10329822 13642473 16714800 30357272
Rank of District in State 16 13 16 17 13 17
Rank of District in India 323 278 322 380 292 366
Contd...
80

RajasthanDistrict FactbookDistrict Factbook™™ Tonk District
Labour and Workforce
Total Workers(2011)
Residence District Persons Male Female
Total Tonk 649161 371848 277313
Rajasthan 29886255 18297076 11589179
India 481888868 331939875 149948993
Rank of District in State 23 23 23
Rank of District in India 312 362 205
Rural Tonk 543041 292430 250611
Rajasthan 24385233 13775469 10609764
India 348743092 226837013 121906079
Rank of District in State 24 24 23
Rank of District in India 269 334 183
Urban Tonk 106120 79418 26702
Rajasthan 5501022 4521607 979415
India 133145776 105102862 28042914
Rank of District in State 17 18 13
Rank of District in India 286 305 248
88

97
Tonk DistrictRajasthan
District FactbookDistrict Factbook™™
Agriculture
Land UtilisationIn Hectares (2014-15)
Particulars Tonk Rajasthan Rank ofDistrictin State
i) Reporting Area For Land Utilisation Statistics 717958 34267469 18
- Forests 27464 2739819 24
ii) Not Available for Cultivation
-Area under Non Agricultural Uses 51926 1939610 15
-Barren and Un-culturable Land 27257 2403403 26
-Total 79183 4343013 18
iii) Other Uncultivated Land Excluding Fallow Land
-Permanent Pastures and Other Grazing Lands 40763 1673671 15
-Land under Misc Tree Crops and Groves Not Included in NetArea
220 26485 17
-Culturable Waste Land 42416 4038156 10
-Total 83399 5738312 14
iv) Fallow Land
-Fallow Lands Other than Current Fallows 25987 2068874 20
-Current Fallow 25445 1855955 17
-Total 51432 3924829 17
v) Net Area Sown 476480 17521496 14
vi) Total C ropped Area 624154 24235354 17
vii) Area Sown More than Once 147674 6713858 22

115
Tonk DistrictRajasthan
District FactbookDistrict Factbook™™
Education
Literacy Rate (2011)
Residence District Persons Male Female
Total Tonk 61.58 77.12 45.45
Rajasthan 66.11 79.19 52.12
India 72.98 80.88 64.63
Rank of District in State 23 19 27
Rank of District in India 541 429 592
Rural Tonk 58.01 75.46 39.66
Rajasthan 61.44 76.16 45.8
India 67.77 77.15 57.93
Rank of District in State 21 18 28
Rank of District in India 542 402 603
Urban Tonk 73.84 82.94 64.76
Rajasthan 79.68 87.91 70.73
India 84.11 88.76 79.11
Rank of District in State 28 31 26
Rank of District in India 574 539 585
Population by Educational Level(2011)
Educational Level Tonk Rajasthan IndiaRank ofDistrictin State
Rank ofDistrictin India
Illiterate 671667 30273155 447216165 22 262
Literate 749659 38275282 763638812 23 387
Literate without Educational Level 34718 1806164 35153231 24 334
Below Primary 164769 8083827 146897597 25 357
Primary 204120 10524424 184170833 27 370
Middle 150421 7319223 133903266 21 355
Matric/Secondary 83840 4610185 105939743 20 408
Higher Secondary/Intermediate Pre-University/Senior Secondary
51977 2515863 77942593 19 426
Non-technical Diploma or Certificate not Equal toDegree
133 7522 1072289 18 470
Technical Diploma or Certificate not Equal toDegree
3058 164634 7238719 22 321
Graduate and Above 53375 3063282 68288971 20 356
Unclassified 3248 180158 3031570 19 283

RajasthanDistrict FactbookDistrict Factbook™™ Tonk District
Health
Live Births Registered(2015)
Residence District Person Male FemaleTotal Tonk 32626 17830 14796
Rajasthan 1769339 986150 783189
India 23136145 11624918 10240904
Rank of District in State 23 23 23
Rank of District in India 279 263 272
Rural Tonk 11091 6236 4855
Rajasthan 746789 431635 315154
India 10203880 5439058 4753336
Rank of District in State 27 27 27
Rank of District in India 308 297 317
Urban Tonk 21535 11594 9941
Rajasthan 1022550 554515 468035
India 11677427 6185860 5487568
Rank of District in State 18 19 18
Rank of District in India 185 185 189
Still Births Registered(2015)
Residence District Person Male FemaleTotal Tonk 421 250 171
Rajasthan 27365 15278 12087
India 171129 76212 64611
Rank of District in State 25 24 29
Rank of District in India 123 91 121
Rural Tonk 115 63 52
Rajasthan 6315 3506 2809
India 59911 31770 26661
Rank of District in State 25 24 25
Rank of District in India 155 152 155
Urban Tonk 306 187 119
Rajasthan 21050 11772 9278
India 99046 44435 37945
Rank of District in State 26 25 27
Rank of District in India 93 64 99
124

129
Tonk DistrictRajasthan
District FactbookDistrict Factbook™™
Health
Houses used for Hospital/Dispensary(2011)
Residence District Total Number ofCensus Houses
Hospital/Dispensary etc.
Total Tonk 380666 777
Rajasthan 18070963 36649
India 330407375 682584
Rank of District in State 22 22
Rank of District in India 353 301
Rural Tonk 298911 611
Rajasthan 13296654 26432
India 220633493 360065
Rank of District in State 24 21
Rank of District in India 325 213
Urban Tonk 81755 166
Rajasthan 4774309 10217
India 109773882 322519
Rank of District in State 18 19
Rank of District in India 305 376
137
Tonk DistrictRajasthan
District FactbookDistrict Factbook™™
Environment and Pollution
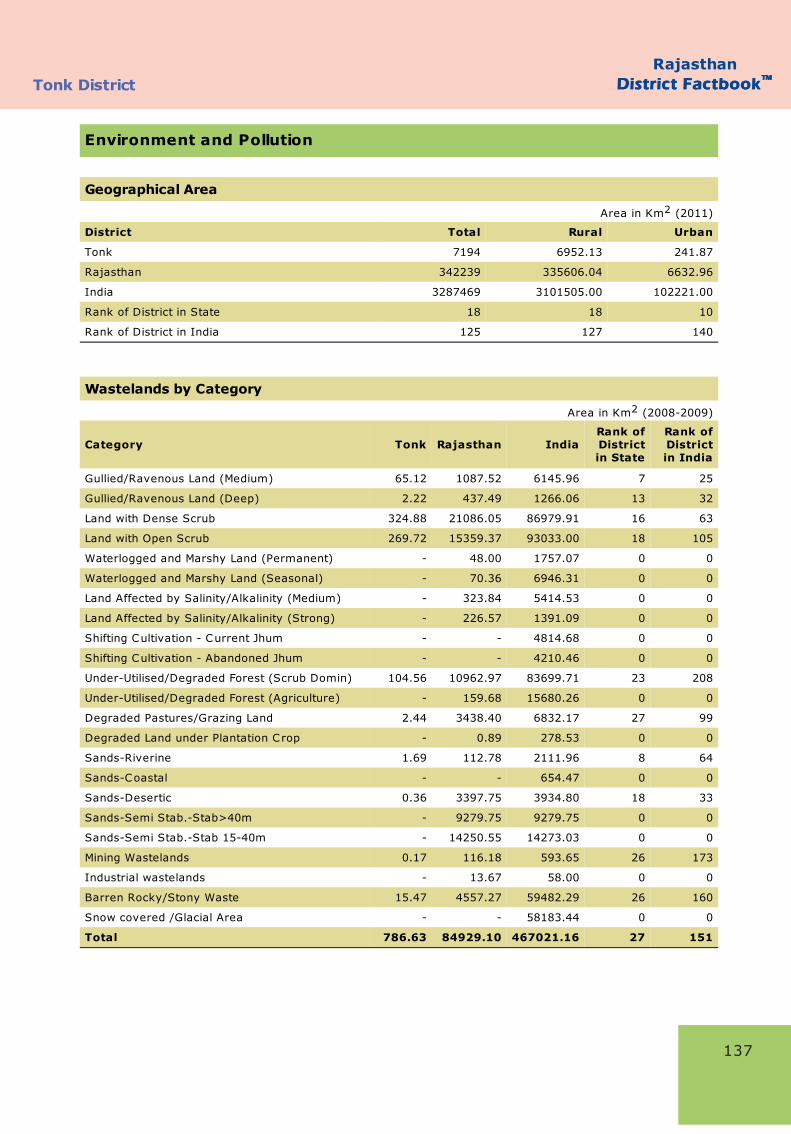
Geographical Area
Area in Km2 (2011)
District Total Rural Urban
Tonk 7194 6952.13 241.87
Rajasthan 342239 335606.04 6632.96
India 3287469 3101505.00 102221.00
Rank of District in State 18 18 10
Rank of District in India 125 127 140
Wastelands by Category
Area in Km2 (2008-2009)
Category Tonk Rajasthan IndiaRank ofDistrictin State
Rank ofDistrictin India
Gullied/Ravenous Land (Medium) 65.12 1087.52 6145.96 7 25
Gullied/Ravenous Land (Deep) 2.22 437.49 1266.06 13 32
Land with Dense Scrub 324.88 21086.05 86979.91 16 63
Land with Open Scrub 269.72 15359.37 93033.00 18 105
Waterlogged and Marshy Land (Permanent) - 48.00 1757.07 0 0
Waterlogged and Marshy Land (Seasonal) - 70.36 6946.31 0 0
Land Affected by Salinity/Alkalinity (Medium) - 323.84 5414.53 0 0
Land Affected by Salinity/Alkalinity (Strong) - 226.57 1391.09 0 0
Shifting Cultivation - Current Jhum - - 4814.68 0 0
Shifting Cultivation - Abandoned Jhum - - 4210.46 0 0
Under-Utilised/Degraded Forest (Scrub Domin) 104.56 10962.97 83699.71 23 208
Under-Utilised/Degraded Forest (Agriculture) - 159.68 15680.26 0 0
Degraded Pastures/Grazing Land 2.44 3438.40 6832.17 27 99
Degraded Land under Plantation Crop - 0.89 278.53 0 0
Sands-Riverine 1.69 112.78 2111.96 8 64
Sands-Coastal - - 654.47 0 0
Sands-Desertic 0.36 3397.75 3934.80 18 33
Sands-Semi Stab.-Stab>40m - 9279.75 9279.75 0 0
Sands-Semi Stab.-Stab 15-40m - 14250.55 14273.03 0 0
Mining Wastelands 0.17 116.18 593.65 26 173
Industrial wastelands - 13.67 58.00 0 0
Barren Rocky/Stony Waste 15.47 4557.27 59482.29 26 160
Snow covered /Glacial Area - - 58183.44 0 0
Total 786.63 84929.10 467021.16 27 151
141
Tonk DistrictRajasthan
District FactbookDistrict Factbook™™
Housing
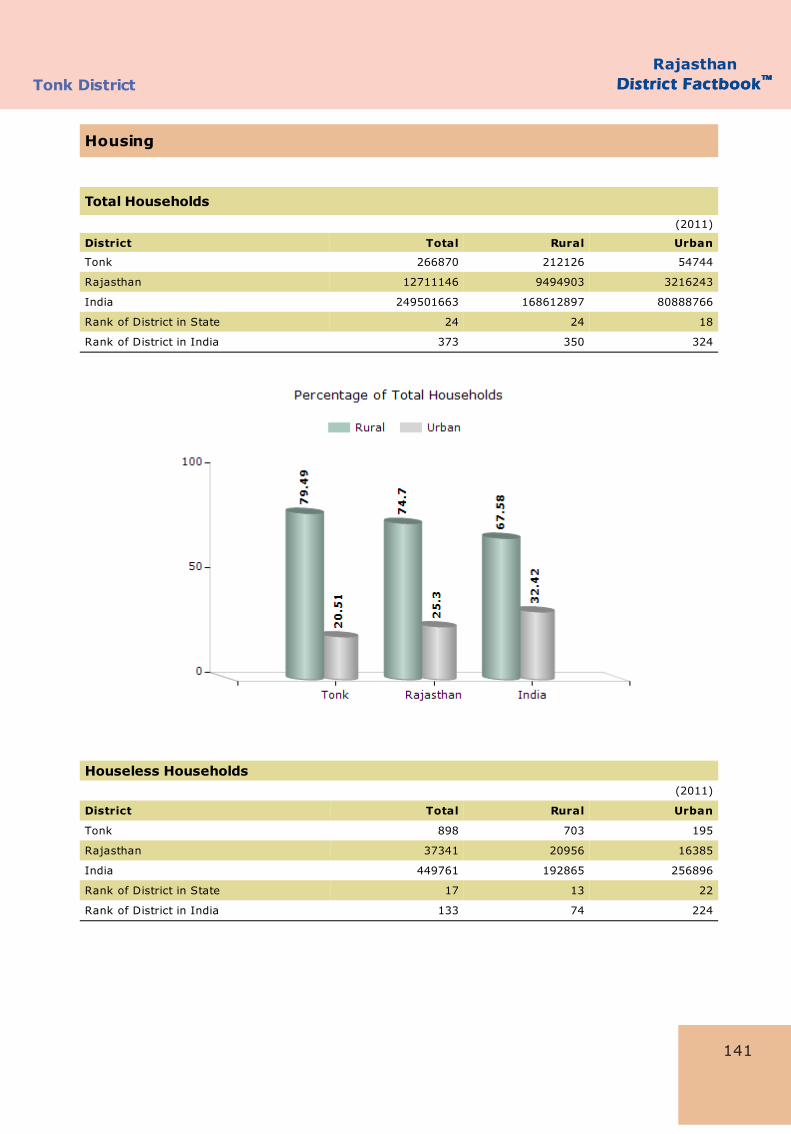
Total Households(2011)
District Total Rural Urban
Tonk 266870 212126 54744
Rajasthan 12711146 9494903 3216243
India 249501663 168612897 80888766
Rank of District in State 24 24 18
Rank of District in India 373 350 324
Houseless Households(2011)
District Total Rural Urban
Tonk 898 703 195
Rajasthan 37341 20956 16385
India 449761 192865 256896
Rank of District in State 17 13 22
Rank of District in India 133 74 224

Tonk DistrictRajasthan
District FactbookDistrict Factbook™™
Crime & Law
Incidence of IPC Crime In Nos. (2015)
Crime Heads Tonk Rajasthan IndiaRank ofDistrictin State
Rank ofDistrictin India
Murder 30 1569 32127 23 403Attempt to Commit Murder 17 1645 46471 28 466Culpable Homicide Not Amounting to Murder 4 69 3176 6 226
Attempt to Commit Culpable Homicide 0 144 6118 0 0Rape 36 3644 34651 31 309
Attempt to Commit Rape 21 407 4437 7 49Kidnapping & Abduction 81 5426 82999 29 295Dacoity 0 68 3972 0 0
Making Preparation and Assembly ForCommitting Dacoity
0 78 3163 0 0
Robbery 7 1227 36188 32 485Criminal Trespass/Burglary 95 6224 114123 23 324Theft 405 29067 467833 21 228
Unlawful Assembly 116 4006 10876 11 22Riots 39 424 65255 4 352Criminal Breach of Trust 1 516 19218 31 553Cheating 407 21898 115405 16 58
Forgery 0 4612 13846 0 0Counterfeiting 2 45 1701 13 148Arson 2 472 9710 32 502Grievous Hurt 92 1402 92996 5 219Dowry Deaths 1 463 7634 33 474
Assault on Women with Intent to Outrage herModesty
72 4813 82422 24 317
Insult to the Modesty of Women 0 9 8685 0 0Cruelty by Husband or his Relatives 332 14383 113403 18 96Importation of Girls From Foreign Country 0 0 6 0 0Causing Death by Negligence 198 9416 134384 19 256
Offences Against State 1 1 147 1 41
Offences Promoting Enmity Between DifferentGroups
0 23 424 0 0
Extortion 0 311 10636 0 0
Disclosure of Identity of Victims 0 0 0 0 0
Incidence of Rash Driving 355 13933 451069 13 250
Human Trafficking 0 7 1021 0 0
Unnatural Offence 0 50 1347 0 0Other IPC Crimes 1980 71728 973957 18 167Total Cognizable IPC Crimes 4294 198080 2949400 21 217
153

159
Tonk DistrictRajasthan
District FactbookDistrict Factbook™™
Social and Welfare Scheme
Mahatma Gandhi National Rural Employment Guarantee Scheme (MGNREGS)
Financial Performance under MGNREGSRs. in Lakh (2016-2017)
Particulars Tonk Rajasthan IndiaRank ofDistrictin State
Rank ofDistrictin India
A. Opening Balance (OB)C losing Balance (CB) as Opening Balance(OB)
- - - 0 0
Entered Opening Balance (OB) 720.48 20342.26 371387.64 6 66
Release of Last Financial Year but Received during the Current Financial Year
Centre 0.00 0.00 0.00 0 0
State 0.00 0.00 68004.11 0 0
Release from State Fund ($) to DistrictsCentral Share - - 1227.25 0 0
State Share 0.00 0.00 416005.36 0 0
Authorisation of EFMS 14955.36 519699.31 4714131.32 14 78
Miscellaneous Receipt 0.00 28.48 23011.29 0 0
B. Borrowed Fund From Other District or Revolving Fund 0.00 0.00 12.68 0 0
Refunded to District/State 0.00 0.00 89875.20 0 0
Inter-District Fund TransferFund Transfer to Other District 0.00 0.00 12.68 0 0
Fund Received from Other Districts 0.00 0.00 0.00 0 0
Availability 15675.84 203073.80 4817891.86 14 80Cumulative Labour Budget (LB) Estimation ofExpenditure
0.00 0.00 0.00 0 0
C. Cumulative Expenditure C. (I) Actual ExpenditureUnskilled Wage 8740.92 338887.15 4107501.14 16 123
Semi-skilled and Skilled Wage 759.66 26560.53 104035.62 17 37
Material 4649.42 120970.20 1350994.68 8 52
Tax 96.51 1993.15 9904.26 6 27
C. (II) Administrative Expenditure I. Receipts Expenditure 721.24 28205.67 275723.08 18 73
II. Non-Receipts Expenditure 2.07 82.38 2923.82 13 224
Total (I+II) 723.31 28288.05 278646.92 18 74Cumulative Expenditure (C. (I) + C.(II)) 14969.83 516699.08 5851082.66 14 97
%age Utilization 95.5 254.17 121.44 24 339
Balance 706.01 -313625.27 -1033190.79 10 72
D. Payment Due*I. On Unskilled Wage 42.69 3062.73 277776.30 19 395
II. On Semi-skilled and Skilled Wage 3.96 2209.94 34237.67 28 264
III. On Material 1069.27 42906.79 526530.69 16 131
IV. Tax 50.02 806.36 6886.68 4 44
Total (I+II+III+IV) 1165.94 48985.82 845431.34 17 181
Note : $ : Status of State Fund. * : Payment due means MR, Bills/Vouchers that have been Entered but Payment date has not beenEntered in the MIS.

i
RajasthanTonk District District Factbook™
Get Complete BookAt Datanet India eBooks Store
www.datanetindia-ebooks.comor go directly at
http://www.datanetindia-ebooks.com/District_Factbook/Rajasthan/Tonk