Tolerating Communication and Processor Failures in Distributed Real-Time Systems
Tolerating Waste inthe Innovation Economy
William H. Janeway
Cambridge University/Warburg Pincus
October 4, 2011

Economic Development through Technological Transformation
From ~1750, waves of innovative technology have driven increases in productivity and living standardsTransformational innovations are embodied in networks of infrastructure that create new economic spaceThe process is discontinuous and disruptive, inefficient and wasteful : resources cannot be optimally allocated in principleIt takes place at the intersection of the “real” economy with financial markets and institutionsIt is often sponsored and/or mediated by the state It expresses the essence of capitalism
2

Five Technological Revolutions, 1770s to 2000s (C. Perez, Technological Revolutions and Financial Capital, Table 2.1)
Technological revolution
Popular name for the period
Core country or countries
Big-bang initiating the revolution
Year
FIRST The ‘Industrial Revolution’
Britain Arkwright’s mill opens in Cromford
1771
SECOND Age of Steam and Railways
Britain (spreading to Continent and USA)
Test of the ‘Rocket’ steam engine for the Liverpool-Manchester railway
1829
THIRD Age of Steel, Electricity and Heavy Engineering
USA and Germany forging ahead and overtaking Britain
The Carnegie Bessemer steel plant opens in Pittsburgh, Pennsylvania
1875
FOURTH Age of Oil, the Automobile and Mass Production
USA (with Germany at first vying for world leadership), later spreading to Europe
First Model-T comes out of the Ford plant in Detroit Michigan
1908
FIFTH Age of Information and Telecommunications
USA (spreading to Europe and Asia)
The Intel microprocessor is announced in Santa Clara, California
1971

The Process of Innovation
The Three PhasesPhase 1: Discovery and Invention
Phase 2: Deployment
Phase 3: Exploration of New Economic Space
Phases 1 and 3 executed by trial and errorPhase 2 may be centrally planned or notAll require financing under conditions of uncertaintySources of funding decoupled from economic return
“Reasons of state”
Financial speculation
4

Types of Economic Waste
“Keynesian Waste” = under-utilized resources“Schumpeterian Waste” = essential to innovation
scientific discovery
technological development
discovery of what to do with the technology
The market economy on its ownGenerates too much Keynesian Waste
Has limited capacity to generate Schumpeterian Waste
Feedback: inadequate aggregate demand inhibits innovation on the supply side of the economy
5

Market Failure in the Innovation Economy
Nelson, 1959. “The Simple Economics of Basic Scientific Research”: limited ability to estimate returns to innovationArrow, 1971. “Economic Welfare and the Allocation of Resources to R&D”: limited ability to appropriate returns to innovation“The Failure of Market Failure”: limited ability to legitimize state intervention
6

Discovery and Invention: Sources of Funding
“Angel” rentiers Robert Darwin
7th Duke of Devonshire
Alfred Loomis
Monopoly rents of great corporationsReturn to customers through lower prices?
Return to stockholders through higher dividends/stock buybacks?
Fund scientific research?
The stateAll (relatively) unconcerned with economic return
7

Discovery and Invention: from Mechanical Tinkering to Scientific Research
The 19th Century U.S. “market in patents”Industry discovers science:
“What fools we had been! But then there was this consolation: we were not as great fools as our competitors....Years after we had taken chemistry to guide us [they] said they could not afford to employ a chemist. Had they known the truth then, they would have known they could not afford to be without one.” [Andrew Carnegie]The 20th Century U.S. “central research lab”
8

Discovery and Invention: Science in the Nation’s Service
World War II: U.S. Office of Scientific Research and Development1945: Vannevar Bush, “Science: The Endless Frontier”NIH: from $8 million (1947) to $1 billion (1966)1950: Korean War induces
National Science Foundation
Massive increase in Defense Department support of R&D
Federal Governments funds >50% of U.S. R&D 1953-1978
1980: Platform constructed for ICT and BioTech revolutions
9

Discovery and Invention: Dangers of Efficiency
Easier to tolerate waste when operating at the innovative frontier, unchallenged competitivelyBenefits of “loose” IP regime: patent pools, second sources, low-cost licenses “Pasteur’s Quadrant”When competitive position threatened, retreat to efficiency:
UK: from the Haldane Principle (1904) to the Rothschild Report (1971)
US: from The Endless Frontier (1945) to “Star Metrics” (2010) =
“Science and Technology for America’s Reinvestment: Measuring the Effect of Research on Innovation, Competitiveness and Science”
Post-1980:Central research retreats to applications at GE, ATT, IBM, Xerox
10
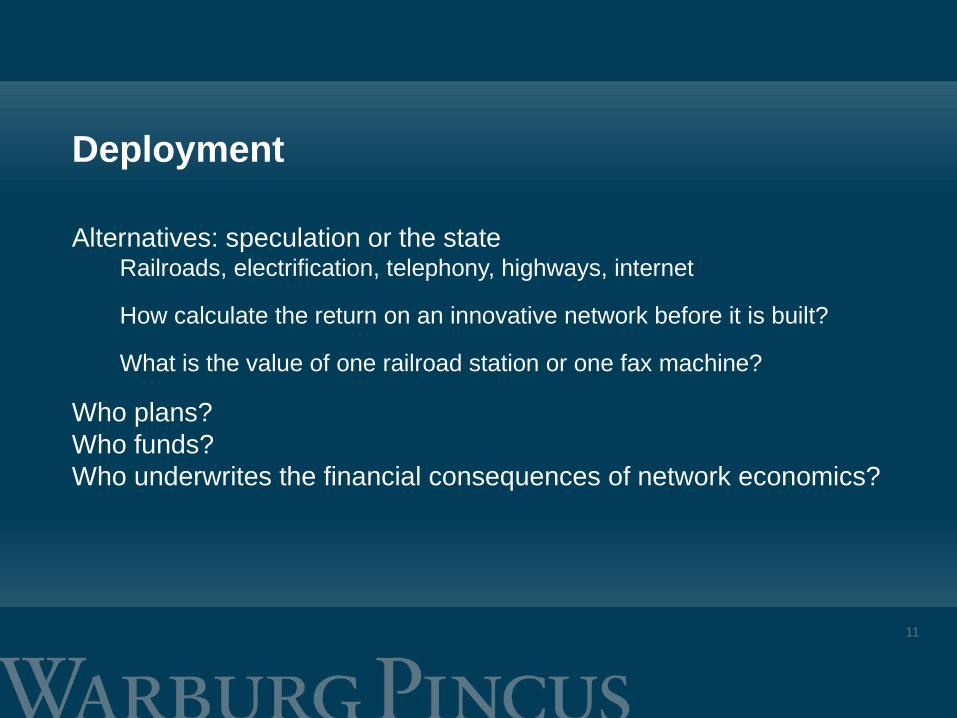
Deployment
Alternatives: speculation or the stateRailroads, electrification, telephony, highways, internet
How calculate the return on an innovative network before it is built?
What is the value of one railroad station or one fax machine?
Who plans?Who funds?Who underwrites the financial consequences of network economics?
11

Deployment: Network Economics
High capital cost; minimal marginal costUnder competition, all lose moneyAlternatives:
State ownership: national/regional/local
State-sanctioned cartel or monopoly
Bail-outs and bankruptcies = consolidation “the hard way”
12

Deployment: The Railroads
UK: Unplanned duplication of routes
Financed by unsubsidized speculation
Role of state: eminent domain and sanction of defensive cartels
France:State planning and control and underwriting
Funded by speculation
US: Unplanned duplication of routes
Funded by subsidized speculation
Endless struggle to defend returns against network economics
China: State planning and funding can be as wasteful as private sector
13

The Lesson from Deployment of Railroads
“…In each nation, policymakers…were certain that they understood the economic laws that ruled the railways and that only strict adherence to those laws would result in progress. However, when nations broke each other’s core economic rules, their railway industries did not fall apart. Thus, although the French were certain that if they allowed private parties to plan railroads the result would be a disarticulated, incoherent and ineffectual rail system, that strategy proved workable in both the the United states and Britain.“The most compelling evidence that economic laws do not narrowly circumscribe what is efficient is simply that the radically different strategies of the United States, France, and Britain produced rapid, dependable and cost-effective transport systems in relatively short order….” [F. Dobbin (1994), 222-3]
14

Exploring New Economic Space: The Necessity of Bubbles
Bubbles are endogenous to financial capitalismMomentum investing inevitable in an uncertain world
Even before index investing institutionalized the practice
Invert Schleifer & Vishny: “How long can you afford to be wrong?”
Bubbles always burstBubbles in the equity market do relatively little harm (2001)
Bubbles in the credit markets compromise the banking system and paralyze the real economy (2008)
Focus of a bubble can by anything: tulip bulbs, gold mines, real estateOccasionally the focus of a bubble is fundamental new technology
Bubbles fund the build out of the network
Bubbles fund the search for what to do with the network
15
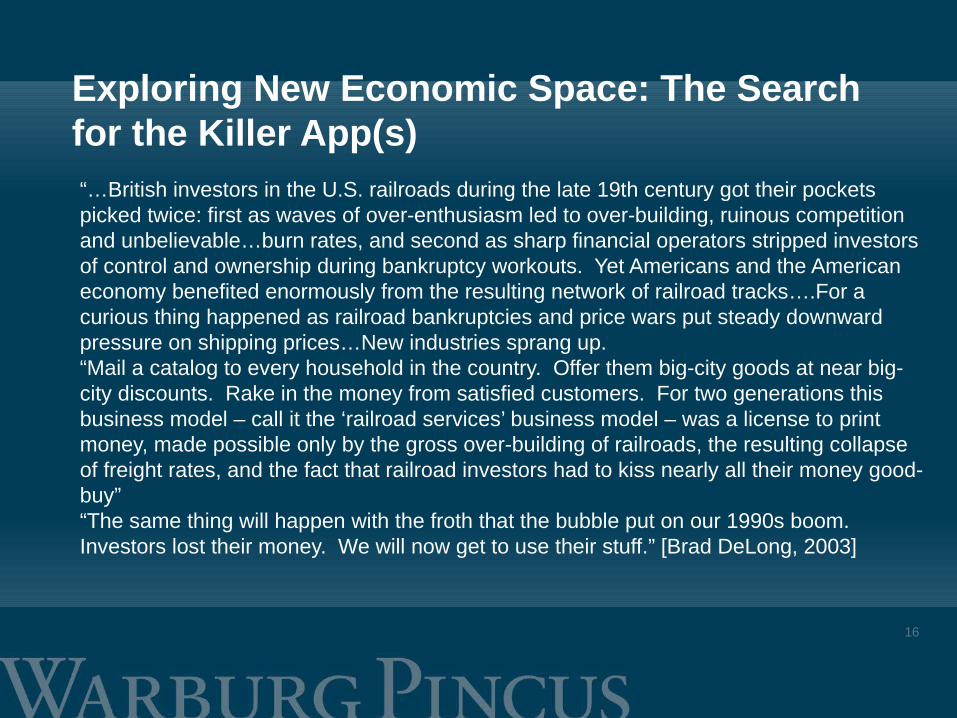
Exploring New Economic Space: The Search for the Killer App(s)“…British investors in the U.S. railroads during the late 19th century got their pockets picked twice: first as waves of over-enthusiasm led to over-building, ruinous competition and unbelievable…burn rates, and second as sharp financial operators stripped investors of control and ownership during bankruptcy workouts. Yet Americans and the American economy benefited enormously from the resulting network of railroad tracks….For a curious thing happened as railroad bankruptcies and price wars put steady downward pressure on shipping prices…New industries sprang up.“Mail a catalog to every household in the country. Offer them big-city goods at near big-city discounts. Rake in the money from satisfied customers. For two generations this business model – call it the ‘railroad services’ business model – was a license to print money, made possible only by the gross over-building of railroads, the resulting collapse of freight rates, and the fact that railroad investors had to kiss nearly all their money good-buy” “The same thing will happen with the froth that the bubble put on our 1990s boom. Investors lost their money. We will now get to use their stuff.” [Brad DeLong, 2003]
16
Exploring New Economic Space: Financial Assets versus Physical Assets
“…The daily revaluations of the Stock Exchange…inevitably exert a decisive influence on the rate of current investment. For there is no sense in building a new enterprise at a cost greater than that at which a similar existing enterprise can be purchased; while there is an inducement to spend on a new project what may seem an extravagant sum, if it can be floated off on the Stock Exchange at an immediate profit. Thus certain classes of investment are governed by the average expectation of those who deal on the Stock Exchange as revealed in the price of shares, rather than by the genuine expectation of the professional entrepreneur.” [Keynes (1936) 151]Q is “the ratio between two valuations of the same physical asset. One, the numerator, is the market valuation: the going price in the market for exchanging existing assets. The other, the denominator, is the replacement or reproduction cost: the price in the market for newly produced commodities.” [Tobin and Brainard (1977) 235]
17

Exploring New Economic Space: How to Value Innovations?
“By conveying a positive signal about profitability, higher aggregate investment…increases asset prices, which in turn raises the incentives to invest. This two-way feedback between real and financial activity makes economic decisions sensitive to higher-order expectations and amplifies the impact of noise on equilibrium outcomes. As a result, economic agents may behave as if they were engaged in a Keynesian “beauty contest” and the economy may exhibit fluctuations that may appear in the eyes of an external observer as if they were the product of “irrational exuberance” [Angelotos, et. al. ((2010) 31-2]“In the vast majority of cases, the prospects of investment projects – the stream of future returns – cannot be understood in standard probabilistic terms....This is obviously true for investments in innovative products and processes for which estimates of returns cannot be based solely on the profit history of existing products and processes.” [Frydman and Goldberg (2011) 41-2]
18

Exploring New Economic Space: Latency
Railroads: U.S. regional networks built 1830-1860Montgomery Ward founded 1872
Sears Roebuck founded 1886
Electrification: Edison’s Pearl Street Station constructed in 1882Replace steam engine with generator and motor
Street lighting, trams, amusement parks
50+ years to build out the grid
1920s: flexible manufacturing and home appliances
ICT: Robert Solow, 1983: "You can see the computer age everywhere but in the productivity statistics."
19

Exploring New Economic Space: The ICT Revolution…in process
Computers replace people, processes stay the same: AccountingComputers address problems people cannot: e.g., SimulationProcesses adapt to computers: MRP, ERP Breakthrough: distributed, networked, mobile computing
Customers work for free: ATM
Internet reciprocally integrates information and transactions: Amazon
Internet enables monetization of the “exhaust” from its use: Google
Big Data Structured data: we know how to manage and exploit it
Unstructured data: we are beginning to learn…
20
Exploring New Economic Space: Schumpeter’s 1st Error
“This [entrepreneurial] function is already losing importance and is bound to lose it at an accelerating rate in the future even if the economic process itself of which entrepreneurship was the prime mover went on unabated. For, on the one hand, it is much easier now than it has been in the past to do things that lie outside familiar routine – innovation itself is being reduced to routine….“On the other hand, personality and will power must count for less in environments which have become accustomed to economic change….The perfectly bureaucratized giant industrial unit not only ousts the small or medium-sized firms…, but in the end it also ousts the entrepreneur…” [Schumpeter (1943), 132-4]
21

Exploring New Economic Space: The Innovator’s Dilemma
Two different modesNew technology directly attacks existing products
IBM: RS6000 versus AS400
New business unattractive relative to established businessXerox: Alto versus Copiers
Innovation only possible if not “reduced to routine”: e.g., skunkworksBEA: WebLogic versus Tuxedo
22

Exploring New Economic Space: The Role of Venture Capital – 4 Stylized Facts
Venture capital returns show extreme skew: a small number of firms account for all of the excess return versus the public equity marketsVenture capital returns show persistence: unlike other asset classes, the return on one venture fund is predictive of the return on the next fund of the same firmVenture capital returns are highly dependent upon the performance of the public equity markets, especially the market for Initial Public OfferingsVenture capitalists have invested successfully in a narrow band of the spectrum of technological innovation: ICT and Biotech
23

2424
Venture Fund Performance Relative to the NASDAQFund Multiple and IRR measures of performance are estimated for a hypothetical set of funds that are created assuming that each terminated fund in the database made an equivalent investment in the NASDAQ. The Public Market Equivalent (PME) is a measure of the total disbursements to a fund expressed relative to the total distributions to the hypothetical fund. This data is also summarised excluding the top decile and quintile of funds.
Nasdaq Multiple 2.42 2.38 0.83 0.39 1.96 2.82 5.05
0.63
- Excluding top decile 2.23 2.27 0.63 -0.69 1.92 2.71 3.270.63
- Excluding top quintile 2.12 2.21 0.58 -0.90 1.86 2.58 2.92
0.63
Nasdaq IRR16% 15% 10% -0.24 11% 21% 45%
-24%
- Excluding top decile 14% 14% 8% -1.50 11% 19% 28%
-24%
- Excluding top quintile 13% 13% 7% -2.02 11% 17% 23%
-24%
Nasdaq PME 1.59 1.00 3.67 10.33 0.57 1.68
42.36
0.14
- Excluding top decile 1.02 0.93 0.57 0.66 0.57 1.33 2.480.14
- Excluding top quintile 0.88 0.83 0.43 0.44 0.54 1.19 1.85
0.14
Mean Med.
St. Dev. Skew
25thPerce
nt
75thPerce
nt Max. Min.
24

2525
The Bubble and Venture Fund Performance: 1998 – 2002The following table summarises the performance of funds that were active during the bubble and post bubble periods. To be considered active during the bubble period, a fund had to have made more than 50% of its distributions during the 1999Q2 – 2000Q3 period. To be considered active during the post-bubble period, a fund had to have made more than 50% of its distributions after 2000Q4.
Bubble FundsPost-Bubble
Funds
Full SampleExcludi
ngTop Decile Full
Sample
Excluding
Top Decile
IRR Multiple
IRR Multiple
IRR Multiple
IRR Multiple
Average 111% 7.94 85% 5.05 8% 2.37 -3% 1.21
Median 91% 4.66 78% 4.14 -3% 0.89 -7% 0.85
Stdev 100% 13.15 61% 3.73 38% 3.83 20% 1.18
Skewness 1.68 5.71 0.51 1.41 1.82 2.78 0.79 1.15
25th Percentile 39% 2.73 33% 2.12 -15% 0.64 -16% 0.58
75th Percentile 146% 7.73 131% 6.47 11% 1.70 7% 1.33
Max 515% 96.10 237% 16.69 116% 14.85 42% 6.13
Min -2% 0.97 -2% 0.97 -34% 0.18 -34% 0.18
No. Obs. 56 56 50 50 28 28 25 25
25

2626
Venture Fund Performance (IRR) Relative to the IPO MarketThe performance of the sample of venture funds, as measured by the IRR, is summarised by market and exit conditions indicators.
Mean Med.St.
Dev.Skew
25thPercen
t
75th Percen
t Max Min
- Market Conditions < -1 22% 4% 52%1.28
-15% 39%141%
-30%
- Market Conditions = -1 to 1 51% 27% 77%2.75
9% 65%515%
-94%
- Market Conditions > 1 41% 20% 60%2.52
10% 32%256%
-10%
- Exit Conditions <219% 9% 42% 1.60 -7% 29%
155%
-34%
- Exit Conditions = 2 to 333% 24% 42% 1.93 11% 40%
237%
-94%
- Exit Conditions >3106% 76%
110% 1.56 22% 167%
515% -6%
26

2727
1980 59 49.53 664 9.43 91981 97 16.76 1,068 6.05 81982 39 15.24 577 3.95 81983 196 23.59 3,770 4.00 121984 84 11.68 1,028 4.63 91985 76 13.20 1,293 3.80 131986 366 10.87 3,461 5.57 151987 127 9.97 2,361 5.35 151988 54 9.49 846 5.29 141989 65 13.70 1,223 6.39 151990 70 13.55 1,396 5.96 201991 157 17.95 4,923 6.66 251992 196 12.25 7,280v 5.88 241993 221 15.33 6,688 6.73 221994 167 13.73 4,671 7.53 231995 205 20.04 8,147 7.47 331996 272 17.01 11,482 5.66 321997 138 13.57 4,826 6.37 301998 78 27.01 3,782 5.24 411999 270 72.98 20,871 4.31 632000 264 49.59 25,499 4.93 732001 41 13.35 3,490 6.05 712002 22 8.48 2,109 7.47 712003 29 12.70 2,023 7.83 662004 93 12.72 11,015 6.75 692005 56 10.69 4,461 6.13 662006 57 9.92 5,117 8.10 762007 44 N/A 6,463 7.68 88
988
129
1315151415202524222333323041637371716669667688
Venture-Backed IPOs: Key Statistics by Year 1980-2007
Number of IPOs Offer Amount (U.S. $ MM)
Med Age at IPO(Years)
Source: Venture Expert; Thomson Financial; Jay Ritter http://bear.cba.ufl.edu/ritter/ipodata.htmNote: $1.00 1980 = $2.50 2007
Med Offer Amount (U.S. $)
Year Average 1st Day Return (%)
27

2828
Venture-Backed Liquidity Events by Year/Quarter 2005:1-2011:2
2005 350 163 17,324.7 106.3 57 4,482.4 78.6
2006 377 164 19,034.8 116.1 57 5,117.1 89.8
2007-1 88 31 4,640.3 149.7 18 2,190.6 121.7
2007-2 90 37 3,912.1 105.7 25 4,146.8 165.9
2007-3 108 55 11,261.7 204.8 12 945.2 78.8
2007-4 93 45 9,645.8 214.4 31 3,043.8 98.2
2007 379 168 29,460.0 175.4 86 10,326.3 120.1
2008-1 109 42 4,983.2 118.7 5 282.7 56.6
2008-2 87 27 3,321.2 123.0 0 0.0 0.0
2008-3 89 32 3,080.2 96.3 1 187.5 187.5
2008-4 66 18 2,390..9 132.8 0 0.0 0.0
2008 260 96 13,915.4 145.0 6 470.2 78.4
2009-1 65 15 666.0 44.4 0 0.0 0.0
2009-2 65 13 2,570.1 197.7 5 720.7 144.1
2009-3 69 23 1,392.4 60.5 3 572.1 190.7
2009-4 74 41 8,924.3 217.7 4 349.3 87.3
2009 273 92 13,552.7 147.3 12 1,642.1 136.8
2010-1 121 31 5,586.6 180.2 9 936.2 104.0
2010-2 97 22 2,932.2 133.3 17 1,274.9 75.0
2010-3 104 27 3,843.0 142.3 14 1,249.1 89.2
2010-4 88 36 5,675.7 157.7 ***34 3,557.3 111.2
2010 420 120 18,307.2 152.6 ***72 7,017.5 97.5
2011-1 109 45 5,891.2 130.9 ****14 1,375.8 98.3
2011-2 79 36 5,410.3 150.3 *****22 5,454.2 247.9
TotalM&A Deals
*Total Disclosed M&A Value
($ MM)
*Average M&ADeal Size
($ MM)**Number of
IPOsQuarter / Year
M&A Deals with Disclosed
Values
*Only accounts for deals with disclosed values **Includes all companies with at least one U.S. VC investor that trade on U.S. exchanges *** Includes 17 Chinese companies ****Includes 4 non-US companies, of which 3 Chinese *****Includes 8 non-US companies, of which 5 Chinese; 2 non-US companies raised aggregate proceeds of $2 billion.
Source: Thomson Reuters and National Venture Capital Association
Total Offer Amount($ MM)
Average IPO Offer Amount
($ MM)
28

Table X: U. S. VC Index Returns
For the period ending 3/31/20111 year 3 years 5 years 10 years 15 years
18.5% 2.0% 5.9% -0.1% 34.3%NASDAQ Composite
1 year 3 years 5 years 10 years 15 years 16.0% 6.9% 3.5% 4.2% 6.4%
Source: Cambridge Associates LLC.
29

30
Table IX: VC Fund-raising 1980-2010 # of Funds $B raised $B managed
1980 52 2.0 2.11885 121 4.0 11.21990 87 3.2 22.11995 172 9.9 33.52000 653 105.0 184.4 2005 235 28.8 229.22009 120 15.2 176.72010 157 12.3 NASource: National Venture Capital Association
30

Limited Scope of VC Investments
31
Amount ($million)
1980 1985 1990 1995 2000 2005 2009
ICT 231.5(44.3%)
1,851.2(70.3%)
1,366.5(53.3%)
4,020.2(54.5%)
75,373.7(75.0%)
13,642.6(59.5%)
8,052.2(45.5%)
Healthcare/ Biotech
87.3(16.7%)
362.6(13.8%)
674.1(26.3%)
1,744.6(23.7%)
7,574.6(7.5%)
6,624.2(28.9%)
6,116.3(34.6%)
Other 204.3(39.1%)
417.7(15.9%)
525.5(20.5%)
1,605.2(21.8%)
17,576.2(17.5%)
2,674.2(11.7%)
3,522.1(19.9%)
Total 523.0 2,631.5 2,566.1 7,370.1 100.524.6 22,941.0 17,690.7
• VCs dance on platform built by state investment in research:• Information and Communications Technology = Primary Focus• Biotechnology/Healthcare = Secondary Focus• All Other <20% of Investments
(Source: NVCA Yearbook, 2010)

Exploring New Economic Space: Cleantech/GreenTech
Two fundamental risksScience immature/technology nascent
Exposure to commodity markets
Plus political risk: dependent on government policies Investment in R&D
Procurement programs
Carbon price
Subsidies
At deployment, 1 unit = $1 billionInvestment in “clean energy” technologies 2010
China $54 billion
U.S. $34 billion
32

The Macroeconomics of the Innovation Economy: Schumpeter’s 2nd Error
“…Schumpeter emphasized the long-run efficiency enhancing aspects of economic downturns. We argue here that by ignoring the deleterious effects on R&D he underestimated the negative effects of recessions, and that on balance macro-economic policies that stabilized the economy are more likely to be conducive to long run growth.” [Stiglitz (1993) 5]“…Schumpeterian policies potentially foster economic growth, but they do not appear to be able alone to yield sustained long-run growth….By the same token, demand shocks…bear persistent effects upon output levels, rates of growth and rates of innovation. Keynesian policies not only have a strong impact on output volatility, but seem to be a necessary condition for long-run economic growth.” [Dosi et. al., (2010 1750]
33

Tolerating Waste: an Ironic Conundrum
Developed world: High tolerance for Keynesian Waste
Low tolerance for Schumpeterian Waste
Market failure NOT adequate rationale for state actionNational security and human health have legitimized state investment in research
Climate change/global warming not (yet) effective rationale
Higher degree of Keynesian waste makes Schumpeterian process less “Creative”/more “Destructive”
34

Bibliography: 1
G-M. Angelotos, Lorenzoni. G. and Pavan, A., 2010. “Beauty Contests and Irrational Exuberance: A Neoclassical Approach,” NBER Working Paper No. 15883K. Arrow, 1971. “The Simple Economics of Basic Scientific Research,” in K. Arrow (ed.), Essays in the Theory of Risk-bearing, New York: American Elsevier.C.M. Christensen, 1997. The Innovator’s Dilemma: When New Technologies Cause Great Firms to Fail, Cambridge MA: Harvard Business School Press.B. DeLong, 2003. “Profits of Doom,” Wired, 11.04F. Dobbin, 1994. Forging Industrial Policy: The United States, Britain and France in the Railway Age, Cambridge, England: Cambridge University Press.G. Dosi, Fagiolo, G. and Roventini, A., “Schumpeter meeting Keynes: A policy-friendly model of endogenous growth and business cycles”, Journal of Economic Dynamics and Growth, 34, 1746-1767.
35

Bibliography: 2
K.R. Fabrizio and Mowery, DC, 2007. “The Federal Role in Financing Major Innovations: Information Technology during the Postwar Period” in N.R. Lamoreaux and Sokoloff, K.L., Financing Innovation in the United States 1870 to the Present, Cambridge MA: MIT University Press.R. Frydman and Goldberg, M., 2011. Beyond Mechanical Markets: Asset Price Swings, Risk and the Role of the State, Princeton NJ: Princeton University Press.T. Hughes, 1983. Networks of Power: Electrification in Western Society, 1880-1930, Baltimore: The Johns Hopkins University Press.J.M. Keynes, 1973 [1936]. The Collected Writings of John Maynard Keynes, volume VII, The General Theory of Employment, Interest and Money, London: Macmillan for the Royal Economic Society. N.R. Lamoreaux and Sokoloff K.L., 2001. “Market Trade in Patents and the Rise of a Class of Specialized Inventors in the Nineteenth-Century United States,” American Economic Review, Papers and Proceedings, 91, pp. 39-44
36

Bibliography: 3
M.D. McKenzie and Janeway, W.H., 2011. “Venture capital funds and the public equity market,” Accounting and Finance, 51, 764-786.National Venture Capital Association, 2010 Yearbook, Thompson Reuters.R.R. Nelson, 1959. “Economic Welfare and the Allocation of Resources to R&D,” Journal of Political Economy, 67, 297-306.M. O’Sullivan, 2007. “Funding New Industries: A Historical Perspective on the Financing Role of the New York Stock Market in the Twentieth Century,” in Lamoreaux and Sokoloff (2007).C. Perez, 2002. Technological revolutions and Financial Capitalism: The Dynamics of Bubbles and Golden Ages, Cheltenham UK: Edward Elgar.J. Schumpeter, 1976 [1943]. Capitalism, Socialism and Democracy, London: Allen & Unwin.
37

Bibliography: 4
J. Schumpeter, 1939. Business Cycles: A theoretical, historical and statistical analysis of the capitalist process, vol. I, London: McGraw-HillSchleifer and Vishny R., 1997. “The Limits of Arbitrage”, Journal of Finance, 52:1, 32-55.J. Stiglitz, 1994. “Endogenous Growth and Cycles”, in Y. Shinnoya and Perlman, M.
(eds.) Innovation in Technology, Industries and Institutions. Studies in Schumpeterian Perspectives. Ann Arbor MI: The University of Michigan Press.
D.E. Stokes, 1997. Pasteur’s Quadrant: Basic Science and technological Innovation, Washington DC: The Brookings Institution.J. Tobin and Brainard, W.C., 1977. Cowles Foundation paper No. 440, reprinted in Private Values and Public Policy: Essays in Honor of William Fellner, Chapter 11, North-Holland.
38