to the Cacao Sensory Analysis Tasting Forma Cacao Sensory Analysis Tasting Form and Guide, a...
24
1 Cacao Sensory Analysis Tasting Form Guide to the
Transcript of to the Cacao Sensory Analysis Tasting Forma Cacao Sensory Analysis Tasting Form and Guide, a...
1
Cacao Sensory Analysis Tasting Form
Guideto the

Burgos Méndez, Dinorah Elizabeth Quality Manager CONACADO Agroindustrial San Francisco de Macorís, DOMINICAN REPUBLIC
Almonte de los Santos, Basilio Cacao Coordinator CLAC Santo Domingo, DOMINICAN REPUBLIC
Cárdenas Salazar, HildebrandoManager, Cooperativa Agraria Cafetalera Oro VerdeLamas, San Martin, PERÚ
Caspersen, Beth Ann Quality Control Manager, Equal ExchangeWest Bridgewater, U.S.
Choy Paz, Mey AlexandraHead of Cacao Quality, CAMSATingo María, Huánuco, PERÚ
Contreras Monjaras, Jose DavidQuality Control Manager, Cooperativa Agraria Cacaotera ACOPAGRO Ltda.Juanjuí, San Martin, PERÚ
Dominguez Vances, Martin EduardoHead of Coffee and Cacao Processing, Cooperativa Agraria NORANDINO Ltda.Piura, PERÚ
Flores Cárdenas, Liz AmandaQ-Grader Lamas, PERÚ
Gomez, JaimeTechnical Team Manager, Grupo CONACADOSan Francisco de Macorís, DOMINICAN REPUBLIC
Kintzer, Brad Chief Chocolate Maker, TCHOBerkeley, CA, U.S.
Liberati, CristinaGrant Projects Manager, Equal ExchangeWest Bridgewater, U.S.
Mapes Bediz, ZoharaDirector of R&D/Chocolate Maker, TCHOBerkeley, CA, U.S.
Marin Duran, IsaiasQuality Control Manager, Cooperativa Agraria Cafetalera Oro VerdeLamas, San Martin, PERÚ
Rufino Escobar, León Antonio Quality Control Manager, ARPROCATTumbes, PERÚ
Saavedra Gómez, Zara Elizabeth Equal Exchange ConsultantTingo María, Huánuco, PERÚ
Saavedra Gómez, Lidia Yessenia Cacao Grader and ConsultantTingo María, Huánuco, PERÚ
Sweitzer, LauraTCHO Source Program Manager, TCHOBerkeley, CA, U.S.
Ubillus Gutierrez, Juan CarlosProduction Manager, Cacao Processing Plant, Exportadora Romex S.A. Chincha, PERÚ
TECHNICAL TEAM
COLLABORATORS

Introduction 4
Cacao Sensory Analysis Tasting Form 6
Structure of the Tasting Form 8
How to analyze and evaluate each category 11
Aroma 12Acidity 13Bitterness 14Astringency 15Defects 16Flavor 17Aftertaste 18Comments 19Taster’s Points 19Final Score 19
Analyzing your Results 20
Bibliography and References 22
Image Credits 23
Contents

4
Introduction
In 2010, Equal Exchange and TCHO began the Cooperative Development Program aimed at strengthening their supply chain partners and interacting with them in new and innovative ways. When this project began, there was no universal methodology for physical and organoleptic evaluation of cacao beans. Through strategic alliances with cooperatives in Peru, Ecuador and the Dominican Republic, we proposed to develop the following tools to evaluate the quality of cacao: a Cacao Sensory Analysis Tasting Form and Guide, a standard Protocol for the Preparation of Liquor Samples, and a Taster Training Program. The objective of these tools is to achieve a common and inclusive language for all cacao stakeholders.
We are pleased to present this Guide to support your use of the Cacao Sensory Analysis Tasting Form. We hope that the guide will provide a more detailed explanation of the form, and help tasters to identify the potential, the attributes and the sensory profile of a sample. This document aims to support your understanding and interpretation of the form, and walks you through the steps to evaluate each of the
attributes found in a sample. We have also provided references to engage the taster's sensorial memory.
We hope that the following information will allow you to effectively carry out the sensory evaluation process for cacao. The intention is to make it understandable and accessible through the entire value chain, though the primary users may include the following:
• Laboratory technicians• Cacao Sellers • Cacao Buyers• Chocolatiers
The information is presented with some assumptions. The first is that the taster already has his/her sample prepared. The second assumption is that said taster and his/her tasting panel has a suitable space for the analysis. The third is that the taster has some basic knowledge of cacao sensory analysis. If you require further information, please refer to our bibliography and resources at the end of this document.
Welcome.
Good Luck!
5
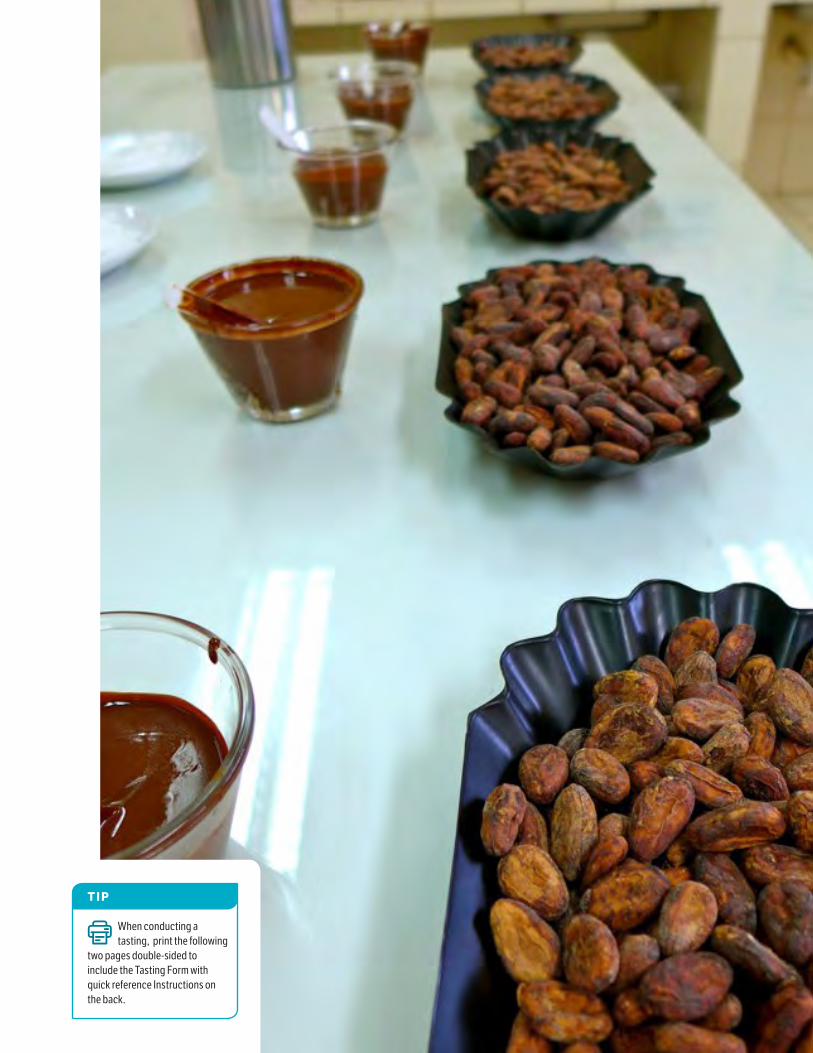
When conducting a tasting, print the following
two pages double-sided to include the Tasting Form with quick reference Instructions on the back.
T I P

Creative Commons Attribution-NonCommercial-ShareAlike 4.0 International License: Commercial purposes are not permitted. Sharing and modifications are allowed under the same license if appropriate credit and changes are indicated. USAID-Equal Exchange-TCHO Cooperative Development Project, Version 2017.
CACAO SENSORY ANALYSIS Tasting Form
SAMPLE
TASTER
DATE
CATEGORIES INTENSITY NOTES QUALITY(0–10) POINTS
Aroma0 1 2 3 4 5
x 1 =
Acidity0 1 2 3 4 5
x 1 =
Bitterness INTENSITY0 to 2.5: ≥ 5 in quality 2.5 to 5: ≤ 5 in quality
0 1 2 3 4 5
x 1 =
Astringency0 1 2 3 4 5
x 1 =
Defects0 1 2 3 4 5
x 2 =
Flavor
Cocoa/Cacao0 1 2 3 4 5
x 2 =
Sweet0 1 2 3 4 5
Nutty0 1 2 3 4 5
Dried Fruit0 1 2 3 4 5
Fresh Fruit0 1 2 3 4 5
Floral0 1 2 3 4 5
Spices0 1 2 3 4 5
Other
Aftertaste0 1 2 3 4 5
x 1 =
COMMENTS: TASTER’S POINTS x 1 =
FINAL SCORE
TIPS TO SCORE QUALITY FOR DEFECTS
Name the defect: A reduction in quality points should be defined in the notes.
Inverse relationship: As the defect flavor(s) increase in intensity, the quality score decreases.
INTENSITY SCALE
0
None/Not Detectable
1
Faint
2
Clearly Present
3
Moderate
4
Dominant
5
Extreme
QUALITY SCALE
0 1 2 3 4 5 6 7 8 9 10
Terrible Bad Ordinary Good Excellent
DIRT RAW CONTAMINANTS DECO
MPOS
ITION
MOLD
DEFECTS

The goal of these instructions is to give users of the form a quick and basic guide to its use. For more in-depth information, please reference the Guide to the Cacao Sensory Analysis Tasting Form or contact us at [email protected] Tasting Form Instructions
Filling in the Form
Aroma Smell the sample. Mark the intensity of the aroma on the first scale, write any characteristics that you find in the notes section, and score the quality. Remember that a low intensity or even absence of aroma does not imply a lower quality.
Acidity The relationship between intensity and quality varies depending on the perception and description of the acids that the taster finds during the evaluation. For example, if the taster perceives a citric or fruity acid, the score may be higher than if the acidity is more like vinegar (acetic acid).
Bitterness and Astringency
These are inherent characteristics of cacao, but the level of intensity can influence the quality, and there is often an inverse relationship. For example, a bitterness level that is ‘Clearly Present’ with an intensity of 2, might have a score between ‘Good’ and ‘Excellent’ in quality; while a higher intensity of bitterness may decrease the quality.
Defects Increased intensity of defects means a lower score in quality. For example, if you find a strong flavor such as dirt that is ‘Dominant’ with an intensity of 4, your quality score will likely be between ‘Terrible’ and ‘Bad’.
If quality points are deducted, the taster should write the name of the specific defect in the notes section. If the sample is clean or free of defects, it should be scored as ‘Excellent’ in quality. To the right we offer some general categories of defects and some specific examples of common defects within those categories.
Flavor The taster need only evaluate the characteristics that are perceived, as not all can be found in every sample. The quality score is based on a combination of factors including the harmony, clarity and complexity of the flavors.
Aftertaste The residual flavor left in the mouth after the sample has dissolved completely.
Taster’s Points The taster’s general impression and subjective quality score for the sample.
Comments This space is for observations which are not noted elsewhere (for example: appearance, texture). The taster may also use Comments to prepare a summary of the evaluation and recommendations.
Final Score A cumulative total of all quality points. The highest possible final score is 100 points.
11/0
2/17
This form contains two types of scales. The purpose of the Intensity Scale is to develop a flavor profile of the samples, while the Quality Scale helps to identify the sample’s potential. Remember that there is no direct relationship between intensity and quality, except in the case of Bitterness, Astringency and Defects. Half points are permitted when scoring on either scale.
Using the Scales
MO LD
musty, basement, mildew
D I RT
mud, wet earth, dust
R AW
vegetal, unripe, grassy, green
C O NTA M I N A NT S
plastic, chemical, smoke, metal, petrol
D EC OM POS ITI O N
hammy, meaty, rancid, putrid, compost
Note: Do not deduct points in defects for aroma, bitterness or astringency—these are evaluated in their respective categories.
Examples of Defects
A maximum evaluation time of 10 minutes per sample is recommended.T
IP
CATEGORIES INTENSITY NOTES QUALITY (0–10) POINTS
Defects0 1 2 3 4 5 dirt 1.5 x 2 = 3
Example:
CATEGORIES INTENSITY NOTES QUALITY (0–10) POINTS
Bitterness0 1 2 3 4 5 mild bitterness 8 x 1 = 8
Example:
This example is consistent with the guideline provided on the form for bitterness and astringency, which indicates that an intensity score lower than or equal to 2.5 may result in a quality score of 5 or higher.

how to: Analyze and Evaluate each Category
88
Taster’s Points The taster’s general impression and subjective quality score for the sample, taking into account all of the other categories of evaluation.
Creative Commons Attribution-NonCommercial-ShareAlike 4.0 International License: Commercial purposes are not permitted. Sharing and modifications are allowed under the same license if appropriate credit and changes are indicated. USAID-Equal Exchange-TCHO Cooperative Development Project, Version 2017.
CACAO SENSORY ANALYSIS Tasting Form
SAMPLE
TASTER
DATE
CATEGORIES INTENSITY NOTES QUALITY(0–10) POINTS
Aroma0 1 2 3 4 5
x 1 =
Acidity0 1 2 3 4 5
x 1 =
Bitterness INTENSITY0 to 2.5: ≥ 5 in quality 2.5 to 5: ≤ 5 in quality
0 1 2 3 4 5
x 1 =
Astringency0 1 2 3 4 5
x 1 =
Defects0 1 2 3 4 5
x 2 =
Flavor
Cocoa/Cacao0 1 2 3 4 5
x 2 =
Sweet0 1 2 3 4 5
Nutty0 1 2 3 4 5
Dried Fruit0 1 2 3 4 5
Fresh Fruit0 1 2 3 4 5
Floral0 1 2 3 4 5
Spices0 1 2 3 4 5
Other
Aftertaste0 1 2 3 4 5
x 1 =
COMMENTS: TASTER’S POINTS x 1 =
FINAL SCORE
TIPS TO SCORE QUALITY FOR DEFECTS
Name the defect: A reduction in quality points should be defined in the notes.
Inverse relationship: As the defect flavor(s) increase in intensity, the quality score decreases.
INTENSITY SCALE
0
None/Not Detectable
1
Faint
2
Clearly Present
3
Moderate
4
Dominant
5
Extreme
QUALITY SCALE
0 1 2 3 4 5 6 7 8 9 10
Terrible Bad Ordinary Good Excellent
DIRT RAW CONTAMINANTS DECO
MPOS
ITION
MOLD
DEFECTS
HeaderThe taster should fill out in clear and legible print the sample identification code, his/her name(s), surnames and date of the analysis.
# 156Elías Contreras Trujillo27 – Julio - 2017
Filling out the formThe analysis of the sample will be distributed into several categories: Aroma, Acidity, Bitterness, Astringency, Defects, Flavor and Aftertaste. Each attribute is organized into four fields, evaluated as follows:
1 INTENSITY Assess the intensity of the perceived attributes on a scale of 0 (absent) to 5 (extreme), half points are allowed.
2 NOTES Take note of specific attributes (descriptors) perceived in the sample, if the taster can and desires to capture that level of detail.
3 QUALITY The quality of each category is valued numerically, using a quality scale from 0 (terrible) to 10 (excellent). On this scale, the use of half points is also allowed.
4 POINTS Total points are valued numerically for quality, taking into account that in Defects and Flavor the quality points are doubled.
Final ScoreThis is the sum of all quality points obtained during the tasting. The maximum score is 100 points.
Comments This space is for observations which are not noted elsewhere (for example: appearance, texture). The taster may also use Comments to prepare a summary of the evaluation and recommendations.
Intensity & Quality Scales See page 9
Note: For Bitterness and Astringency the relation between intensity and quality is inverse, meaning that as the intensity increases, the quality tends to decrease.
The Structure of the Tasting Form

9 9
Stages of Sensory Analysis 1 Observe the appearance: color,
brightness, etc. The taster can take note of these observations in Comments and/or take them into consideration for in Taster’s Points.
2 Smell the sample to evaluate the Aroma category. Use a clean and odor-free container during this part of the evaluation.
3 Taste the sample to evaluate the following categories: Acidity, Bitterness, Astringency, Defects, and Flavors. If the sample is solid, chew it gently, allowing
it to slowly melt on the palate. It is possible that the taster will have to repeat the tasting process several times in order to identify and capture all the information needed to complete the analysis.
4 When the sample has been ingested and / or has been expiated, the taster analyzes residual flavors in the mouth for the Aftertaste category.
A maximum evaluation time of 10 minutes per sample is recommended.
T I P
This section helps the taster to define and standardize the intensity of each attribute, and provide some guidance to quantify the quality score. During the analysis, the intensity and /or quality of any of the categories may vary and change.
The taster can mark the scale according to his or her initial impression and indicate with an arrow a change in the intensity. A mark between two points of the scale will usually indicate a half point.
0 = None, not detectable
1 = Faint, weak presence
2 = Clearly Present, not difficult to perceive
3 = Moderate, indicating a distinctive feature
4 = Dominant, this attribute may mask or overpower other characteristics of the sample
5 = Extreme, the presentation of this attribute is the most intense possible for cacao in the sensorial memory of the taster
Creative Commons Attribution-NonCommercial-ShareAlike 4.0 International License: Commercial purposes are not permitted. Sharing and modifications are allowed under the same license if appropriate credit and changes are indicated. USAID-Equal Exchange-TCHO Cooperative Development Project, Version 2017.
CACAO SENSORY ANALYSIS Tasting Form
SAMPLE
TASTER
DATE
CATEGORIES INTENSITY NOTES QUALITY(0–10) POINTS
Aroma0 1 2 3 4 5
x 1 =
Acidity0 1 2 3 4 5
x 1 =
Bitterness INTENSITY0 to 2.5: ≥ 5 in quality 2.5 to 5: ≤ 5 in quality
0 1 2 3 4 5
x 1 =
Astringency0 1 2 3 4 5
x 1 =
Defects0 1 2 3 4 5
x 2 =
Flavor
Cocoa/Cacao0 1 2 3 4 5
x 2 =
Sweet0 1 2 3 4 5
Nutty0 1 2 3 4 5
Dried Fruit0 1 2 3 4 5
Fresh Fruit0 1 2 3 4 5
Floral0 1 2 3 4 5
Spices0 1 2 3 4 5
Other
Aftertaste0 1 2 3 4 5
x 1 =
COMMENTS: TASTER’S POINTS x 1 =
FINAL SCORE
TIPS TO SCORE QUALITY FOR DEFECTS
Name the defect: A reduction in quality points should be defined in the notes.
Inverse relationship: As the defect flavor(s) increase in intensity, the quality score decreases.
INTENSITY SCALE
0
None/Not Detectable
1
Faint
2
Clearly Present
3
Moderate
4
Dominant
5
Extreme
QUALITY SCALE
0 1 2 3 4 5 6 7 8 9 10
Terrible Bad Ordinary Good Excellent
DIRT RAW CONTAMINANTS DECO
MPOS
ITION
MOLD
DEFECTS
INTENSITY SCALE
TERRIBLE = approximately 0–2
BAD = approximately 2–4
ORDINARY = approximately 4–6
GOOD = approximately 6–8
EXCELLENT = approximately 8–10
Creative Commons Attribution-NonCommercial-ShareAlike 4.0 International License: Commercial purposes are not permitted. Sharing and modifications are allowed under the same license if appropriate credit and changes are indicated. USAID-Equal Exchange-TCHO Cooperative Development Project, Version 2017.
CACAO SENSORY ANALYSIS Tasting Form
SAMPLE
TASTER
DATE
CATEGORIES INTENSITY NOTES QUALITY(0–10) POINTS
Aroma0 1 2 3 4 5
x 1 =
Acidity0 1 2 3 4 5
x 1 =
Bitterness INTENSITY0 to 2.5: ≥ 5 in quality 2.5 to 5: ≤ 5 in quality
0 1 2 3 4 5
x 1 =
Astringency0 1 2 3 4 5
x 1 =
Defects0 1 2 3 4 5
x 2 =
Flavor
Cocoa/Cacao0 1 2 3 4 5
x 2 =
Sweet0 1 2 3 4 5
Nutty0 1 2 3 4 5
Dried Fruit0 1 2 3 4 5
Fresh Fruit0 1 2 3 4 5
Floral0 1 2 3 4 5
Spices0 1 2 3 4 5
Other
Aftertaste0 1 2 3 4 5
x 1 =
COMMENTS: TASTER’S POINTS x 1 =
FINAL SCORE
TIPS TO SCORE QUALITY FOR DEFECTS
Name the defect: A reduction in quality points should be defined in the notes.
Inverse relationship: As the defect flavor(s) increase in intensity, the quality score decreases.
INTENSITY SCALE
0
None/Not Detectable
1
Faint
2
Clearly Present
3
Moderate
4
Dominant
5
Extreme
QUALITY SCALE
0 1 2 3 4 5 6 7 8 9 10
Terrible Bad Ordinary Good Excellent
DIRT RAW CONTAMINANTS DECO
MPOS
ITION
MOLD
DEFECTSQUALITY SCALE
Intensity and Quality Scales
To assess the intensity of defects, you should take into account the total intensity of all the defects identified. We suggest that the taster explicitly name the defect that he or she has identified to avoid deduction of quality points without justification.
To evaluate quality in defects, there is an inverse relationship: the higher the intensity of the defective flavor, or defective flavors, the lower the quality score.
Tips to Evaluate Quality in Defects

10

1 1
How To:
Analyze and Evaluate each Category

1 2
CONCEPT
A sensory perception based on one’s olfactory senses, such as the sense of smell.1
1 The taster will take the sample container and bring it to the nose, and will deeply inhale trying to perceive the attributes of its aroma.
2 The taster will mark the intensity of the aroma, taking into consideration that the intensity is not directly correlated to the quality. Intensity for the aroma category varies widely depending on whether the sample is liquid or solid, but quality should not be affected by that factor.
3 Write down any notes related to the aroma; if the taster was not able to clearly perceive the aroma of the sample, the action could be repeated.
4 Rate the quality, using the scales as a guide, and for multiply the score by one. The maximum score in Aroma: 10 points.
Steps to Analyze Aroma
Aroma
If an aroma or a combination of aromas related to subcategories for flavor is perceived (cacao/chocolate, sweet, nutty, dried fruit, fresh fruit, floral, spices), the quality assessment might be between Good and Excellent.
EX
AM
PL
E 1
CATEGORIES INTENSITY NOTES QUALITY (0–10) POINTS
Aroma0 1 2 3 4 5 caramel, raisin,
brownie 9.5 x 1 = 9.5
If an aroma or a combination of aromas related to the defects subcategories is perceived (mold, dirt, raw, contaminants, decomposition) is perceived, the quality assessment might be Bad or Terrible.
EX
AM
PL
E 2
CATEGORIES INTENSITY NOTES QUALITY (0–10) POINTS
Aroma0 1 2 3 4 5
mold 3 x 1 = 3
1 2
The mark between two points on the scale indicates a half point—so in this example the intensity score is 2.5.
T I P

1 3
CONCEPT
The organoleptic property produced by pure or mixed substances, that when tasted generate acid flavor like citrus. Acid is the elemental flavor caused by diluted aqueous solutions of acidic substances, such as citric acid or tartaric acid.2
Acidity
1 During the tasting stage of analysis, mark the intensity of the acid or the combination of acids perceived, taking into account that the intensity is not directly correlated to the quality. The relation between intensity and quality varies depending on the perception and description of the types acids found during the tasting. These include citric, acetic, lactic, butyric, tartaric, malic, carbonic, and phosphoric, etc.
2 Write down any notes related to the acidity.
3 Rate the quality, using the scales as a guide, and for multiply the score by one. The maximum score in Acidity: 10 points.
Steps to Analyze Acidity
Citric acidlime, orange,
clementine, grapefruit
Tartaric acid grapes, tamarind
Acetic acidvinegar, sour
Malic acidapple
Lactic acidsour milk, yogurt
Butyric acidrancid butter,
fatty foods, vomit
Nitric acidputrid meat
If you perceive citric or fruity acid, the quality score might be between Good and Excellent.
EX
AM
PL
E 1
CATEGORIES INTENSITY NOTES QUALITY (0–10) POINTS
Acidity0 1 2 3 4 5 citric,
clementine 8 x 1 = 8
If you notice an acid similar to vinegar, with an intensity of 2 or “Present”, but it does not characterize the sample and overwhelm other features, the quality score might be Ordinary.
EX
AM
PL
E 2
CATEGORIES INTENSITY NOTES QUALITY (0–10) POINTS
Acidity0 1 2 3 4 5
sour, vinegar 5 x 1 = 5
ACIDS REFERENCES

CONCEPT
An organoleptic property produced by pure or mixed substances, that when tasted generate a bitter flavor. Bitterness is the elemental flavor caused by dilute aqueous solutions of various substances, such as quinine or caffeine.3
Bitterness
1 During the tasting stage of analysis, mark the intensity of the bitterness taking into account that intensity could correlate to quality and, frequently, there is an inverse relationship. You should refer to the small scales next to the categories names for Bitterness and Astringency. a. If the taster identifies a level of intensity for bitterness between Absent with an intensity of 0, and Present with an intensity of 2-2.5, the quality rating might be Ordinary, Good or Excellent. b. If the taster identifies a level of intensity for bitterness between Clearly Present with an intensity of 2.5-3, and Extreme with an intensity of 5, the quality rating might be Ordinary, Bad or Terrible.
2 Write down any notes related to bitterness.
3 Rate the quality, using the scales as a guide, and for multiply the score by one. The maximum score in Bitterness: 10 points.
Steps to Analyze Bitterness
If the bitterness intensity level is 2 or Clearly Present, the quality rating might be between Good and Excellent.
EX
AM
PL
E 1
If the bitterness intensity level is 5 or Extreme, similar to the experience of chewing an aspirin, the quality rating could be Terrible.
EX
AM
PL
E 2
BITTERNESS REFERENCES
CATEGORIES INTENSITY NOTES QUALITY (0–10) POINTS
BitternessINTENSITY
0 to 2.5: ≥ 5 in quality 2.5 to 5: ≤ 5 in quality
0 1 2 3 4 5mild bitterness, not a
dominant characteristic of the sample 8 x 1 = 8
CATEGORIES INTENSITY NOTES QUALITY (0–10) POINTS
BitternessINTENSITY
0 to 2.5: ≥ 5 in quality 2.5 to 5: ≤ 5 in quality
0 1 2 3 4 5 aspirin 2 x 1 = 2
Burnt coffee, caffeine Chicory, VerbenaCitrus peel and pith Aspirin
1 4
1 5
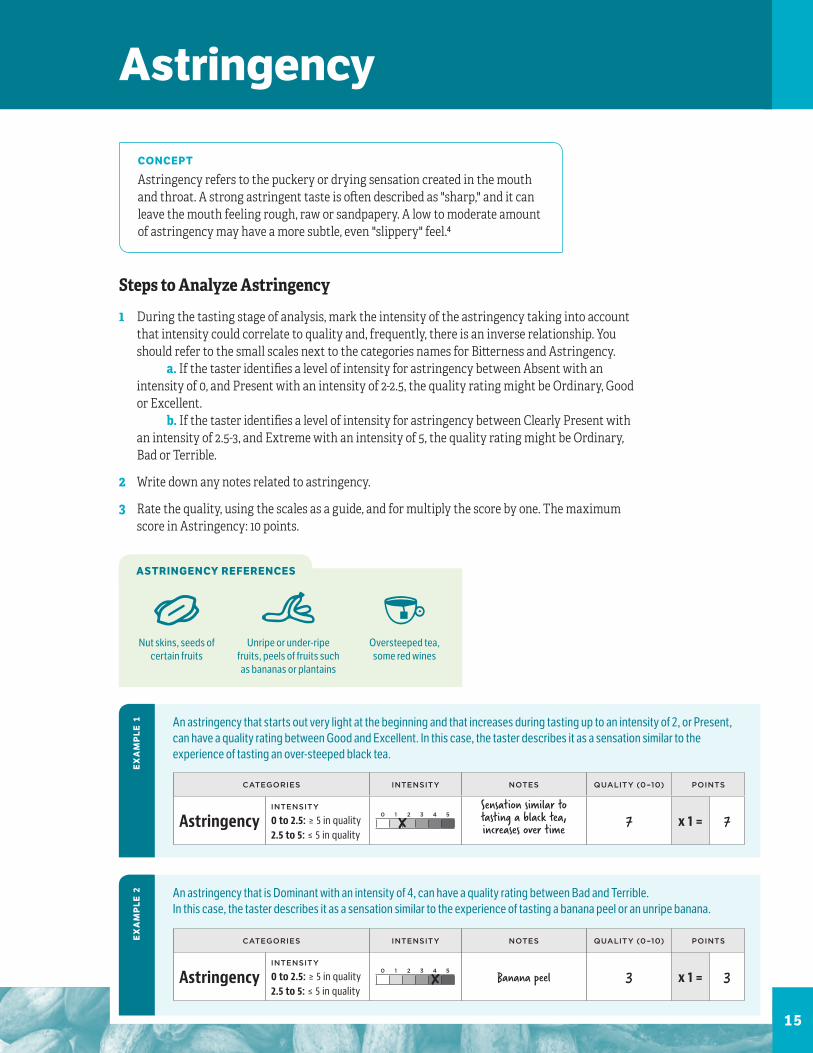
CONCEPT
Astringency refers to the puckery or drying sensation created in the mouth and throat. A strong astringent taste is often described as "sharp," and it can leave the mouth feeling rough, raw or sandpapery. A low to moderate amount of astringency may have a more subtle, even "slippery" feel.4
Astringency
1 During the tasting stage of analysis, mark the intensity of the astringency taking into account that intensity could correlate to quality and, frequently, there is an inverse relationship. You should refer to the small scales next to the categories names for Bitterness and Astringency. a. If the taster identifies a level of intensity for astringency between Absent with an intensity of 0, and Present with an intensity of 2-2.5, the quality rating might be Ordinary, Good or Excellent. b. If the taster identifies a level of intensity for astringency between Clearly Present with an intensity of 2.5-3, and Extreme with an intensity of 5, the quality rating might be Ordinary, Bad or Terrible.
2 Write down any notes related to astringency.
3 Rate the quality, using the scales as a guide, and for multiply the score by one. The maximum score in Astringency: 10 points.
Steps to Analyze Astringency
ASTRINGENCY REFERENCES
Oversteeped tea, some red wines
Unripe or under-ripe fruits, peels of fruits such as bananas or plantains
Nut skins, seeds of certain fruits
An astringency that starts out very light at the beginning and that increases during tasting up to an intensity of 2, or Present, can have a quality rating between Good and Excellent. In this case, the taster describes it as a sensation similar to the experience of tasting an over-steeped black tea.
EX
AM
PL
E 1
CATEGORIES INTENSITY NOTES QUALITY (0–10) POINTS
AstringencyINTENSITY
0 to 2.5: ≥ 5 in quality 2.5 to 5: ≤ 5 in quality
0 1 2 3 4 5Sensation similar to tasting a black tea, increases over time 7 x 1 = 7
An astringency that is Dominant with an intensity of 4, can have a quality rating between Bad and Terrible. In this case, the taster describes it as a sensation similar to the experience of tasting a banana peel or an unripe banana.
EX
AM
PL
E 2
CATEGORIES INTENSITY NOTES QUALITY (0–10) POINTS
AstringencyINTENSITY
0 to 2.5: ≥ 5 in quality 2.5 to 5: ≤ 5 in quality
0 1 2 3 4 5 Banana peel 3 x 1 = 3

1 616
CONCEPT
This category is defined by the presence of defective flavors that are not characteristic of cacao, generally associated with a deteriorating condition or transformation affecting the product.5
Defects
1 During the tasting stage of analysis, mark the intensity of the defect or combination of defects perceived, taking into consideration that as the defect flavor(s) increase in intensity, the quality score decreases.
2 Write down any notes related to defects. Note that any reduction in quality points should be defined in the notes. If the sample is clean or free of defects, the quality score is Excellent.
3 Remember that, in this case, flavors or textures related to the processing of the sample during roasting or grinding are not Defects. You may record these observations in Comments and suggest that the sample be processed again with new parameters.
4 Rate the quality, using the scales as a guide, and for multiply the score by TWO. The maximum score in Defects: 20 points.
Steps to Analyze Defects
DEFECTS REFERENCES
mud, wet earth, dust
vegetal, unripe, grassy, green
plastic, chemical, smoke, metal, petrol
musty, basement, mildew
hammy, meaty, rancid, putrid, compost
DIRT RAW CONTAMINANTS DECO
MPOS
ITION
MOLD
DEFECTS
The sample does not have an identifiable defect. In this case where the taster is unable to name the defect, he or she should not reduce the points in quality.
EX
AM
PL
E 1
CATEGORIES INTENSITY NOTES QUALITY (0–10) POINTS
Defects0 1 2 3 4 5 10 x 1 = 20
If you find a Dominant taste of mold and wet soil with an intensity of 4, then you might rate the quality between Bad and Terrible.
EX
AM
PL
E 2
CATEGORIES INTENSITY NOTES QUALITY (0–10) POINTS
Defects0 1 2 3 4 5
Strong mold, wet soil 2 x 1 = 4

1 7 17
CONCEPT
The impression caused by a food or another substance, which is determined primarily by chemical sensations detected via taste (the tongue) and smell (the retronasal cavity).
Flavor
CATEGORIES INTENSITY NOTES QUALITY (0–10) POINTS
Flavor
Cocoa/Cacao0 1 2 3 4 5 chocolaty
x 2 = 18
Sweet0 1 2 3 4 5 cane sugar
Nutty0 1 2 3 4 5 almonds, hazelnuts
Dried Fruit0 1 2 3 4 5 raisins
Fresh Fruit0 1 2 3 4 5
Floral0 1 2 3 4 5
Spices0 1 2 3 4 5
Other sweet tabacco
9
->EX
AM
PL
E 1
1 During the tasting stage of analysis, mark the intensity of the perceived positive or neutral flavors, taking into account that negative flavors are evaluated mainly in Defects. The relationship between intensity and quality varies depending on the perception and description of the flavors found during the tasting.
2 Write down any notes related to flavor(s). Not all the flavor categories are always present in a sample, only describe what you perceive.
3 The quality rating is based on a combination of factors including, but not limited to: harmony, clarity, complexity.
4 Rate the quality, using the scales as a guide, and for multiply the score by TWO. The maximum score in Flavor: 20 points.
Steps to Analyze Flavor
FLAVOR REFERENCES
Cocoa/Cacaochocolate, fudge,
brownie, cocoa powder, nibs
Sweetcandy, honey, cane sugar/panela, malt,
molasses, brown sugar
Nutspeanuts, almonds, pecans, pistachio
Fresh fruitsapples, banana,
melon, pineapple, cherry, grapes
Dry fruitsraisins, prunes, dried
fig, dried cherry, dried peach
Flowersroses, jasmine, coffee flowers
Spicescinnamon, cloves, basil, oregano, bay

1 8
CONCEPT
The residual flavors left in the mouth and on the palate, after the sample has dissolved completely.
Aftertaste
1 8
1 When the sample has been completely ingested or/and has been expiated, the taster analyzes residual flavors in the mouth.
2 The taster will mark the intensity of the aftertaste, taking into consideration that the intensity is not directly correlated to the quality.
3 Write down any notes related to the aftertaste.
4 Rate the quality, using the scales as a guide, and multiply the score by one. The maximum score in Aftertaste: 10 points.
Steps to Analyze Aftertaste
An aftertaste that might be rated Bad quality may be prolonged or short, and the intensities of bitterness and astringency tend to be higher.
EX
AM
PL
E 2
CATEGORIES INTENSITY NOTES QUALITY (0–10) POINTS
Aftertaste0 1 2 3 4 5 sharp astringency that
persists and intensifies 3.5 x 1 = 3.5
An aftertaste that might be rated Good or Excellent in quality may be prolonged or short, and may include positive attributes related to subcategories for Flavor (cacao / chocolate, sweet, nutty, dried fruit, fresh fruit, floral, spices) and might have low intensities of bitterness and astringency.
EX
AM
PL
E 1
CATEGORIES INTENSITY NOTES QUALITY (0–10) POINTS
Aftertaste0 1 2 3 4 5 long-lasting citrus note,
mild bitterness 8 x 1 = 8
The arrow indicates a change in the intensity perceived during the evaluation. In this example, the intensity started at 3, but increased to a 4.
T I P
->

1 9 19
Comments
1 This space is for observations which are not noted elsewhere (for example: appearance, texture).
2 The taster may also use Comments to prepare a summary of the evaluation and recommendations.
3 The taster may take note of any additional factors that have influenced the sensory analysis, such as environmental conditions and sample processing.
Steps for CommentsE
XA
MP
LE
COMMENTS: A complex sample with an aroma of roasted almonds and dried fruit flavors such as prunes that
last through the aftertaste.
CONCEPT
The taster’s general impression and subjective quality score for the sample, taking into account all of the other categories of evaluation. In this category, the taster can rate the sample based on personal and professional perception of quality.
Steps for Taster's Points After evaluating all other categories, rate the quality, using the scales as a guide, and multiply the score by one. The maximum score in Taster’s Points: 10 points.
Taster’s Points
The taster will tally all of the quality points from the far right-hand column (after multiplication) and notate the sum in the box next to Final Score. The maximum Final Score: 100 points.
Final Score

2 0
Analyzing your Results
There are many ways to communicate the results of your analysis. A spider graph representation of the flavor profile can be an effective way to visualize your results.
ScoringThe use of the information that results from sensory analysis depends on the user and his/her objectives. Possible actions are infinite but below we offer some suggestions.
Logically, the higher the Final Score, the better the sample. Final scores can be used for decision making, such as:
• Create flavors profile and other sensorial characteristics
• Identify and correct processing defects
• Decide if the sample is accepted for buying or selling, or if it is rejected
• Establish a value or ranking in comparison with other samples
• Determine a purchase or sales price
• Determine winners of a contest
• Set a standard or make comparison with a standard
20
FLAVOR PROFILE OF SAMPLE #XYZ
Sweet
Nutty
Dried FruitFresh Fruit
Floral
Spices
Cocoa/Cacao
Olor/Fragancia
20
Acidez
Amargor
Astringencia
Sabor/Aroma
Limpieza
Post-Gusto
Puntaje del catador
Score
16
12
8
4
0
CalibrationAn important step is to calibrate with other tasters. Calibration is not easy and requires a lot of practice. After tasting, the leader of the tasting panel must collate all results in a single summary scoring sheet. We recommend that the tasting panel review results category by category, and if there is a lot of difference between scores, the panel can re-taste and discuss in order to reach a final decision.
This image from the program Cropster shows the calibration of a group of tasters on a particular sample. The black lines represent the average scores.

2 1 21
Notes:

CAOBISCO/ECA/FCC. 2015. Cocoa Beans: Chocolate and Cocoa Industry Quality Requirements. End, M.J. and Dand, R., Editors. Accessed on March 14, 2018. http://www.cocoaquality.eu/downloads.php.
Chemonics International and Star Cuppers de Centroamerica. 2005. “Normas y Estándares de Catación”, para la Región de Centroamérica. Accessed on March 14, 2018. http://pdf.usaid.gov/pdf_docs/Pnadg946.pdf.
Cocoa of Excellence. 2015. Guía Técnica para la Participación en el Programa “COCOA OF EXCELLENCE” y en la celebración de los “INTERNATIONAL COCOA AWARDS”. Accessed on March 14, 2018. https://www.cipca.org.bo/index.php/component/joomdoc/Documentos/Gu%C3%ADa_t%C3%A9cnica_para_la_participaci%C3%B3n_en_Cocoa_en%20excellence.pdf/download
Fine Cacao and Chocolate Institute. 2016. FCCI cacao grading protocol and evaluation sheet. Accessed on March 14, 2018. https://chocolateinstitute.org/education/professional/.
Goodwin, Lindsey. 2017. Astringency Definition. Accessed on March 14, 2018.https://www.thespruce.com/definition-of-astringency-765670.
Gutsche, Astrid. 2014. Los Guardianes del Cacao. Lima: Editorial Planeta Peru.
Heymann, Hildegarde and Harry T. Lawless. 2013. Sensory Evaluation of Food.New York: Springer.
Ibáñez Moya, Francisco and Yolanda Barcina Angulo. 2001. Análisis sensorial de alimentos: métodos y aplicaciones. Oxford: Taylor and Francis.
Illy, Andrea and Rinantonio Viani. 2005. Espresso Coffee: The Science of Quality.Cambridge: Academic Press.
Instituto Nacional de Defensa de la Competencia y de la Protección de la Propiedad Intelectual (INDECOPI). 2008; Norma Técnica Peruana ISO 5492 “Análisis Sensorial” Vocabulario. Accessed on March 14, 2018. https://vdocuments.site/documents/ntp-iso-5492-2008-analisis-sensorial-vocabulario.html
Januszewska, Renata. 2018. Hidden Persuaders in Cocoa and Chocolate: A Flavor Lexicon for Cocoa and Chocolate Sensory Professionals. Cambridge: Woodhead Publishing.
Mouritsen, O. and Klavs Styrbæk. 2014. Umami: Unlocking the Secrets of the Fifth Taste. New York: Columbia University Press.
Williams, Pam and Jim Eber. 2012. Raising the Bar: The Future of Fine Chocolate. Vancouver: Wilmor.
1 Illy, 340. 2 Ibáñez Moya, 6.3 Ibáñez Moya, 6. 4 Goodwin.5 Ibáñez Moya, 8.
bibliogr aphy and r efer ences
2 2

Front and back coverPhoto courtesy Equal Exchange.
P.2–3Photo courtesy Equal Exchange.
P.5Photo courtesy Equal Exchange.
P.10–11Photo courtesy Equal Exchange.
P.13All icons from thenounproject.com. "Lemon" by Royyan Razka "Apple" by AomAm "Grapes" by BomSymbols "Balsamic Vinegar" by Vallone Design "Yogurt" by Joe Harrison "Butter" by Tom Glass, Jr. "Meat" by Knut M. Synstad
P.14All icons from thenounproject.com. "Lemon" by Hare Krishna "Fruit Bark" by Nook Fulloption"Coffee" by Aldric Rodríguez"Chicory" by Icons Producer "Pills" by Alex Arseneau
P.15All icons from thenounproject.com. "Peanut" by James Keuning"Banana Peel" by Stefan Kovac"Tea" by bmijnlieff
P.16All icons from thenounproject.com. "Food Waste" by Cono Studio Milano"Ham" by Blaise Sewell "Basement" by Georgiana Ionescu "Sprout" by Marie Van den Broeck "Grass" by Milinda Courey "Burn Barrel" by Luis Prado
P.17All icons from thenounproject.com. "Chocolate" by Maxim Kulikov"Honey" by Kokota"Nuts" by Artem Kovyazin "Fruits" by Artem Kovyazin"Dried Fruits" by Artem Kovyazin"Flowers" by Cezary Lopacinski"Cinnamon" by BomSymbols "Kitchen" by Dinosoft Labs
P.20Photo courtesy Equal Exchange.
image cr edits
2 3

Creative Commons Attribution-NonCommercial-ShareAlike 4.0 International License
Commercial purposes are not permitted. Sharing and modifications are allowed under the same license if appropriate credit and changes are indicated. USAID-Equal Exchange-TCHO Cooperative Development Project, Version 2018.
Published June 2018. Designed by Equal Exchange Creative, Project #4922.