
TO: Texas Air Research Center Texas A&M University ...
12
TO: Texas Air Research Center FROM: Don Collins Texas A&M University [email protected] 979.862.4401 SUBJECT: Final Report PROJECT NUMBER: 413TAM0142A PROJECT TITLE: Experimental study of the production of PM2.5 in Southeast Texas clouds PROJECT PERIOD: 9/1/13 – 8/31/15 DATE: 2/3/16 Up to 5 pages of progress report including the following sections: Project Description Objectives Methodology Accomplishments/Problems Future Work List of Publications and Presentations
Transcript of TO: Texas Air Research Center Texas A&M University ...

TO: Texas Air Research Center FROM: Don Collins
Texas A&M University [email protected] 979.862.4401
SUBJECT: Final Report PROJECT NUMBER: 413TAM0142A PROJECT TITLE: Experimental study of the production of PM2.5 in Southeast Texas clouds PROJECT PERIOD: 9/1/13 – 8/31/15
DATE: 2/3/16
Up to 5 pages of progress report including the following sections:
Project Description
Objectives Methodology
Accomplishments/Problems Future Work List of Publications and Presentations

The objective of this project was to measure production rates and properties of secondary aerosol formed under realistic conditions in southeast Texas. More specifically, we would employ our recently-developed Captive Aerosol Growth and Evolution (CAGE) chambers and would focus on secondary production resulting from aqueous phase reactions as would occur in boundary layer clouds.
The CAGE chambers were first used during a field project conducted between the time the proposal for this work was submitted and when this project was funded and began. During that initial use we identified some issues that complicated interpretation of those data and that we recognized had to be resolved prior to the planned experiments for this project. The most significant issues were: i) small leaks that were undetectable during standard operation with the chambers under only ~50 mbar vacuum, but became pronounced and problematic during cloud cycles when the vacuum exceeded 200 mbar, and ii) contamination in the chambers or tubing, valves, flow meters, etc. upstream of the chambers, which resulted in unacceptable growth rates of injected particles when zero air was flushed behind the permeable expanded PTFE membranes. We spent much of the first 1.5 years of this 2-year project focused on addressing those issues. A summary of the steps taken was provided in the annual project report. An updated version of that summary is provided at the end of this report. While we continued to work with the original CAGE chambers throughout the project period I decided to begin a parallel effort to construct a new pair of chambers that would retain much of the functionality of the original chambers, but would have fewer ancillary components and, importantly, correspondingly fewer potential sources of contamination. These new mobile CAGE or mCAGE chambers were designed and constructed over the winter and spring of 2015 and were first used in the field during the summer of 2015. Descriptions of the chambers, the experiments, and first results are provided below.
Just like the original CAGE chambers that were described in the original project proposal, the mCAGE chambers ultimately used are roughly 1 m3 all-Teflon cylindrical enclosures constructed primarily of UV-transmitting FEP film. The only non-FEP section is a gas-permeable ePTFE membrane sheet located at one end of the cylinder. Each chamber is suspended in a rectangular enclosure that has UV-transmitting Plexiglas G-UVT sides. The chamber rotates at about 1 rpm on a horizontal axis to minimize losses of large particles due to settling and losses of particles of all sizes by dampening convection. A photograph of one of the two is shown in Figure 1.

Figure 1. Photograph of one of the two mCAGE chambers on top of our building at Texas A&M.
The small loss of UV (and visible) solar radiation through the acrylic and FEP is offset by reflection off a highly UV-reflective ePTFE gasket sheet just below the chamber, with the resulting actinic flux in the chamber closely tracking that outside. Spectral intensity results from a preliminary experiment conducted on the roof of our building are shown in Figure 2. Each of the spectra represents the sum of the upwelling and downwelling hemispheric intensities. The intensity over the visible spectrum actually exceeds that outside, though the more relevant UV intensity closely matches that outside.
Figure 2. Comparison of the sum of upwelling and downwelling UV intensity inside the mCAGE chamber and just outside of it.
O3 + hν O(1D) + O2
HCHO + hν H∙ + HCO∙
NO2 + hν NO + O

Several m3/min of ambient air is drawn through the FEP inlet on top of the frame shown in Figure 1, then behind the gas-permeable ePTFE membrane, and exhausted through a blower located below the acrylic frame. Efficient gas exchange across the ePTFE membrane maintains near-ambient trace gas concentrations in the chamber. In late August we had an opportunity to test the gas transmission efficiency of one of the two chambers by connecting it to a proton transfer reaction – mass spectrometer (PTR-MS) and several trace gas analyzers operated by researchers from University of Houston (UH). The gas analyzers alternated between sampling air from the chamber and that just outside. The results of those experiments for all species for which the measured mixing ratios were above zero are shown in Figure 3. With the possible exception of one or two species, the in-chamber vs. outside mixing ratios were in agreement.
Figure 3. Comparison of in-chamber and outside mixing ratios of several trace gases. These measurements were made at the end of the field intensive described below.
Through support from this grant, we operated the mCAGE chamber at the Jones State Forest site in the Woodlands between the end of July and September 1, 2015. Researchers from UH have maintained carbon monoxide and ozone analyzers at the site for several years. More importantly, during the time we were there last summer the site was augmented with the

UH/Rice University mobile air quality lab that includes a PTR-MS, trace gas analyzers, and an Aerodyne Aerosol Mass Spectrometer (AMS) and with a chemical ionization mass spectrometer provided by Aerodyne that was used to make complementary measurements of aerosol composition.
Though our objectives during this field intensive differed from those originally identified in the proposal for this project, our underlying motivation to understand secondary aerosol formation in southeast Texas was unchanged. At this site, we were most interested in production of secondary organic aerosol (SOA) from nighttime reactions involving NO3 radical originating from NOx emissions from the Houston area and biogenic hydrocarbons emitted by trees in the surrounding forested area. Example 1-week time series of the gases responsible for the active nighttime chemistry are shown in Figure 4. The depletion of NO by sunset permits accumulation of a significant concentration of NO3∙, which then reacts with residual isoprene from daytime emissions and the monoterpenes that are continuously emitted throughout the night.
Figure 4. Example 1-week time series of mixing ratios of trace gases relevant for production of SOA from nighttime reactions with NO3∙. Measurements were made by researchers from University of Houston at the Jones State Forest site in the Woodlands.

Averages of those week-long time series are shown in the top three graphs in Figure 5. The bottom graph shows the approximate resulting reaction of NO3∙ with isoprene and the monoterpenes that is based on the rate of production of NO3∙ from reaction of NO2 and O3, the rate of destruction through reaction with NO, and the reaction rate coefficients for reaction of NO3∙ with the hydrocarbons. The products from those reactions contribute to growth of existing aerosol particles.
Figure 5. Hourly-averaged mixing ratios for the species shown in Figure 4 (top three graphs) and estimated nitrate-hydrocarbon reaction rates (bottom graph).

For most of the chamber measurements we injected two monodisperse particle modes into the chambers: one with an initial peak diameter, Dp, of about 70 nm and the other with an initial peak Dp of about 300 nm. Secondary aerosol production rate was assessed by tracking the growth rate of the mode of smaller particles. The mode of larger particles was used to raise the total aerosol surface area concentration in the chamber to roughly the same level as that outside. Without the addition of the larger particles the smaller ones would likely grow faster than if outside because there would be less competition for the condensable products that form through reactions involving NO3∙ or other oxidants. Both modes were generated by atomizing an ammonium sulfate solution and size classifying it with the same differential mobility analyzer (DMA) used to measure the evolving size distribution of the aerosol in the chamber. The concentration of the larger mode particles was maintained within a narrow range by automatically injecting more each time the integrated surface area concentration fell below a prescribed minimum. The smaller particle mode was tracked for as long as it could be discerned, often 0.5 – 1 day, after which a new mode was injected and the process repeated. In this way we were able to measure particle growth rate continuously for days or even weeks as the particles in the chamber was repeatedly depleted and then replenished. As an example, the results of the first experiment conducted are shown in Figure 6. What is evident in this example and is consistent with the results from subsequent experiments is the significant increase in particle growth that occurs after sunset (indicated by shading) as the nighttime nitrate radical chemistry begins. For this case the growth rate increased from less than 2 nm h-1 in the mid-afternoon to as high as 8 nm h-1 at night.
Figure 6. Results from first nighttime experiment conducted. At the start of the experiment a population of 70 nm particles were injected into the chamber. Those size of that mode was then tracked as the particles grew, slowly at first and then rapidly after sunset when the nitrate radical concentration increased.

Because our primary interest during this project was SOA formed from reaction of the nitrate radical with the two dominant (biogenic) hydrocarbons, isoprene and the monoterpenes, we focused our analysis on those days on which we had particle growth data and both the PTR-MS and trace gas analyzers were operating. A summary of the overlap of the three key datasets is shown in Figure 7. Though it is unfortunate that there were not more days on which all necessary data were available, the six days on which they were turned out to be diverse and very interesting.
Figure 7. Summary of availability of our particle growth data and the trace gas and hydrocarbon data provided by UH.
Figure 8 shows the particle growth and estimated nitrate-hydrocarbon reaction rates for the day on which the highest growth rate was observed. What is remarkable about the results is the contrast between the peak ~25 nm h-1 growth rate observed after sunset and the <5 nm h-1 (and at times ~0) growth observed during daytime when both O3 and OH∙ concentrations are highest.

Figure 8. Example experiment on Aug. 2/3, 2015 showing particle size and growth rate in green and the estimated nitrate-hydrocarbon reaction rates as bars.
The role of the nitrate radical is clear in Figure 8 in the strong correlation between the particle growth rate we observed and the estimated nitrate-hydrocarbon reaction rates shown with the bars. Similar temporal connections between the gas phase concentrations and particle growth were observed on the other days analyzed as well. Furthermore, the integrated nighttime particle growth observed on the six days with complete data correlate well with the corresponding integral of the estimated nitrate-hydrocarbon reaction rates, as is shown in Figure 9. The text color for the experiment dates is linked with that of the back trajectories terminating at the site at 8:00 p.m. on the same day. It is interesting that the highest growth events occurred when the origin of the air was to the east and northeast and not from the Houston area. Though additional analysis are needed, it is likely that this is due to contributions from decreased titration by NO and increased biogenic hydrocarbon emissions from that area.
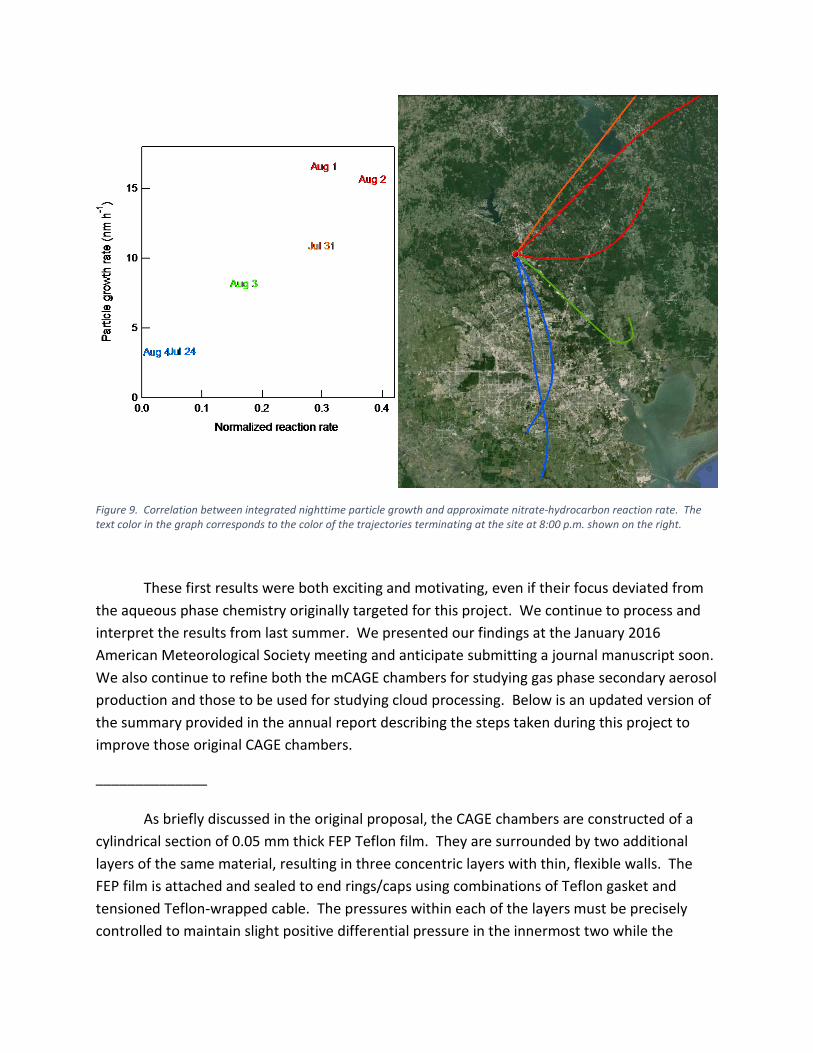
Figure 9. Correlation between integrated nighttime particle growth and approximate nitrate-hydrocarbon reaction rate. The text color in the graph corresponds to the color of the trajectories terminating at the site at 8:00 p.m. shown on the right.
These first results were both exciting and motivating, even if their focus deviated from the aqueous phase chemistry originally targeted for this project. We continue to process and interpret the results from last summer. We presented our findings at the January 2016 American Meteorological Society meeting and anticipate submitting a journal manuscript soon. We also continue to refine both the mCAGE chambers for studying gas phase secondary aerosol production and those to be used for studying cloud processing. Below is an updated version of the summary provided in the annual report describing the steps taken during this project to improve those original CAGE chambers.
______________
As briefly discussed in the original proposal, the CAGE chambers are constructed of a cylindrical section of 0.05 mm thick FEP Teflon film. They are surrounded by two additional layers of the same material, resulting in three concentric layers with thin, flexible walls. The FEP film is attached and sealed to end rings/caps using combinations of Teflon gasket and tensioned Teflon-wrapped cable. The pressures within each of the layers must be precisely controlled to maintain slight positive differential pressure in the innermost two while the

absolute pressure changes about two orders of magnitude more during a typical cloud cycle. In addition to the seals at the ends of the FEP layers, there are over a hundred tubing and pipe connections in each chamber that must be leak free. The manifestation of a leak between the chamber and the surrounding layer is a reduction of particle retention time below that expected based on the rate at which sample is withdrawn and replaced with particle-free air. A leak between the two outermost layers or between the outermost layer and the surrounding environment becomes most evident only during cloud cycles as the vacuum in the chambers increases significantly with the adiabatic expansion. Both of these problems were identified in the preliminary experiments, the former resulting in particle loss rates of as much as 30% per hour and the latter resulting in the need for additional vacuum pumps. The graduate students involved in this project spent a considerable amount of time systematically working through all potential leaks and devising approaches to reduce or eliminate them. Over a period of months they redesigned and constructed improved seals for the FEP layers, replaced all flange gaskets, and made numerous other modifications of components, tubing, and air flow ducts. To guide them in identifying the sources and determining whether they had been sealed, they filled the chambers with elevated levels of ozone using a high concentration generator they constructed and then “sniffed” for leaks using a trace-level ozone analyzer. This effort resulted in a substantial improvement in particle retention and vacuum control.
The more challenging problem we worked to resolve is contamination levels in the chambers that result in unexplained growth of injected particles even when the volumes behind the ePTFE membranes are flushed with zero air. The experimental approach taken with these chambers in which monodisperse particle populations are injected and their size tracked over time likely results in increased sensitivity and detectability of such contamination sources relative to the more conventional approach of injecting polydisperse particle populations and tracking their volume or mass concentration. Regardless, any unexplained particle growth must be smaller than the changes in particle size that will accompany cloud processing. The chambers are constructed only of Teflon and great care was taken during their construction and installation to avoid introducing any contamination. They were repeatedly conditioned by filling with several ppm of ozone and then exposing them to direct sunlight throughout the day. The injected ozone, and oxidants produced as it is photolyzed such as hydroxyl radical, react with sites on the Teflon surfaces and with potential contaminants that deposited on the walls. Though such conditioning reduced the unexplained particle growth rate, it was still unacceptably high in both chambers.
Based on our observation that the compounds condensing on the particles were likely organic, we next sampled air at dozens of points in the chambers, particle generation system, and gas conditioning system using a PTR-MS. Figure 10 shows results from a set of those

measurements that suggest an array of VOCs were concentrated in the outermost layer of the chamber system, with substantially lower concentrations in the chambers. These experiments were valuable, but difficulty in identifying the VOCs associated with each m/z and the inability of the PTR-MS to detect many relevant compounds led us to develop the capability to directly measure particle mass production potential of the air throughout the chamber system. We designed and constructed the Potential Aerosol Mass system (e.g., Kang et al., 2007) depicted in Figure 11 and repeated the sampling process used with the PTR-MS. Through these tests we determined that a substantial source of contamination was the homemade heated catalyst system we had used in the zero air system. Even when this was turned off, residual contamination that had deposited in the tubing and components upstream of the chambers resulted in particle growth. We removed the impacted tubing and worked to clean or replace the impacted components. Despite the resulting reduction in unexplained particle growth rate, it remained stubbornly high and we continue to work to achieve further reductions.
Figure 10. Example PTR-MS spectra measured in the chamber and surrounding layers.
Figure 11. Potential Aerosol Mass (PAM) system that was constructed to locate sources of contamination responsible for unexplained particle growth.
m/z
Sign
al
From Chamber
UV Bulb
Charcoal Filters
To DMA
N2SheathGas
O3
OH∙
O3
O3
O3
O3
HO2∙
OH∙
OH∙ HO2∙
HO2∙
OH∙