Preserving air quality in Texas Professor David Allen Department of Chemical Engineering Center for...
54
Preserving air quality Preserving air quality in Texas in Texas Professor David Allen Professor David Allen Department of Chemical Engineering Department of Chemical Engineering Center for Energy and Environmental Resources Center for Energy and Environmental Resources University of Texas University of Texas Big, Big, Beauti Beauti ful ful Sky? Sky?
-
Upload
earl-turner -
Category
Documents
-
view
215 -
download
1
Transcript of Preserving air quality in Texas Professor David Allen Department of Chemical Engineering Center for...
Preserving air quality in Preserving air quality in TexasTexas
Professor David AllenProfessor David AllenDepartment of Chemical EngineeringDepartment of Chemical EngineeringCenter for Energy and Environmental ResourcesCenter for Energy and Environmental ResourcesUniversity of TexasUniversity of Texas
Big, Big, BeautifBeautiful Sky?ul Sky?
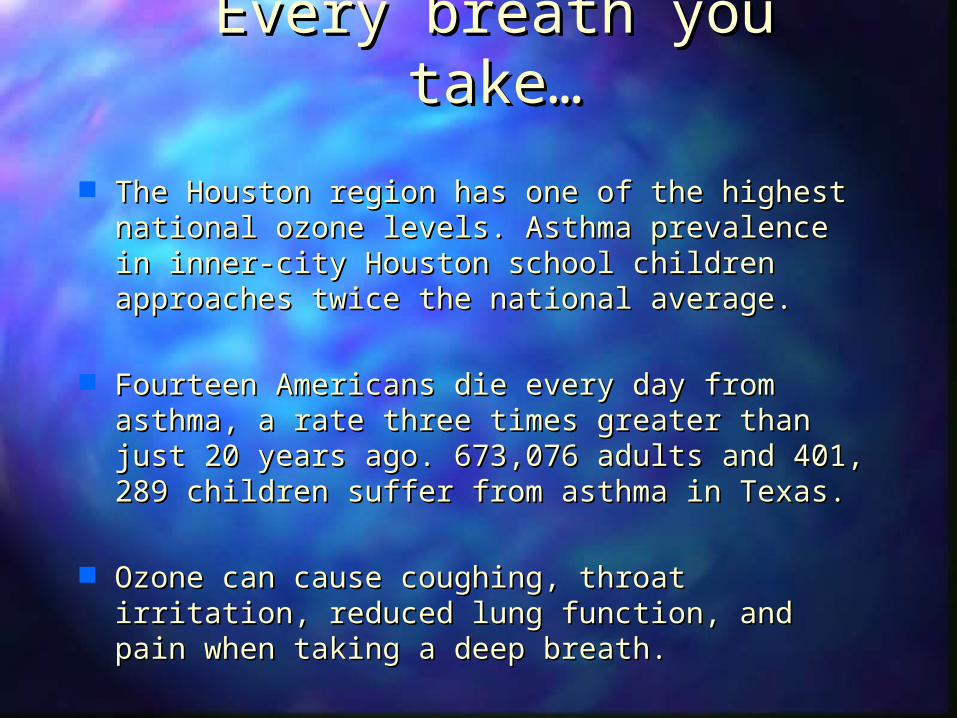
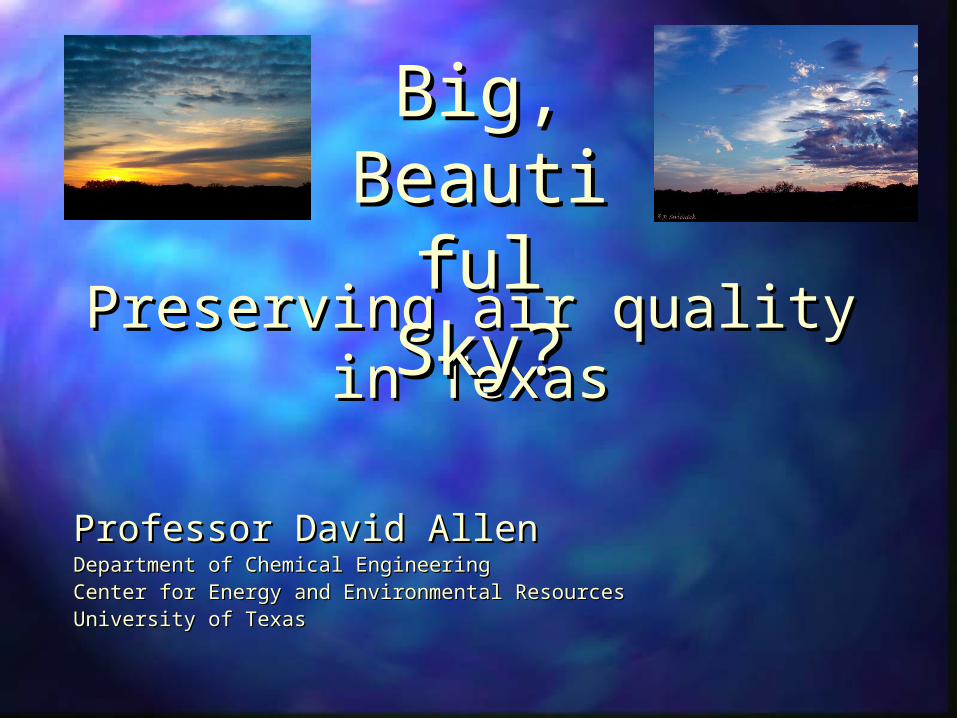
Every breath you take…Every breath you take…
The Houston region has one of the highest The Houston region has one of the highest national ozone levels. Asthma prevalence in national ozone levels. Asthma prevalence in inner-city Houston school children approaches inner-city Houston school children approaches twice the national average.twice the national average.
Fourteen Americans die every day from asthma, Fourteen Americans die every day from asthma, a rate three times greater than just 20 years a rate three times greater than just 20 years ago. 673,076 adults and 401, 289 children ago. 673,076 adults and 401, 289 children suffer from asthma in Texas. suffer from asthma in Texas.
Ozone can cause coughing, throat irritation, Ozone can cause coughing, throat irritation, reduced lung function, and pain when taking a reduced lung function, and pain when taking a deep breath. deep breath.
Breath of Life?Breath of Life?
Scientists have estimated that Scientists have estimated that the number of deaths in the the number of deaths in the United States associated with air United States associated with air pollution range from 50,000 to pollution range from 50,000 to 100,000 per year. 100,000 per year.
While particulate matter is the While particulate matter is the form of air pollution most form of air pollution most prominently linked to premature prominently linked to premature death, there is increasing death, there is increasing evidence that ozone plays a role.evidence that ozone plays a role.
OutlineOutline What are the components of air pollution and What are the components of air pollution and
how is Texas doing?how is Texas doing?
What is photochemical smog and how is it What is photochemical smog and how is it formed?formed?
A tale of two cities: AustinA tale of two cities: Austin
How do we understand air pollution and who How do we understand air pollution and who sets air quality standards? sets air quality standards?
A tale of tow cities: HoustonA tale of tow cities: Houston
What are scientists and officials doing so we What are scientists and officials doing so we can breath easier?can breath easier?
What can all of us do?What can all of us do?
iona williams
would it be too much to print out a flier of these questions for peopl to take notes on? maybe we could offer a prize after the talk for people who can answer certain questions?
Air Quality in Texas Air Quality in Texas citiescities
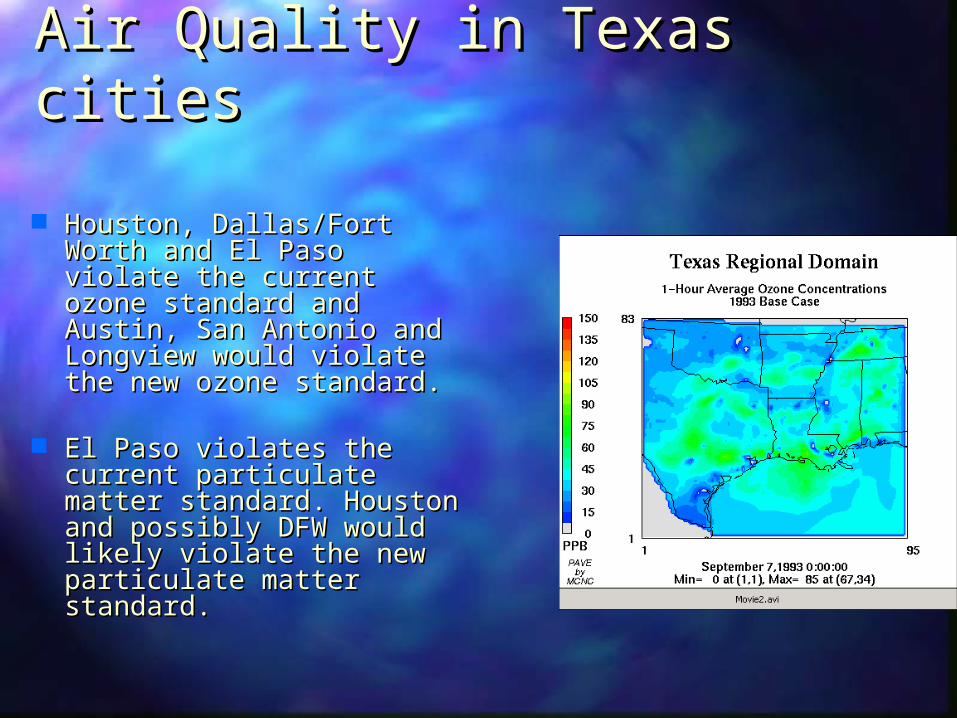
Houston, Dallas/Fort Houston, Dallas/Fort Worth and El Paso violate Worth and El Paso violate the current ozone the current ozone standard and Austin, San standard and Austin, San Antonio and Longview Antonio and Longview would violate the new would violate the new ozone standard.ozone standard.
El Paso violates the El Paso violates the current particulate matter current particulate matter standard. Houston and standard. Houston and possibly DFW would likely possibly DFW would likely violate the new particulate violate the new particulate matter standard. matter standard.
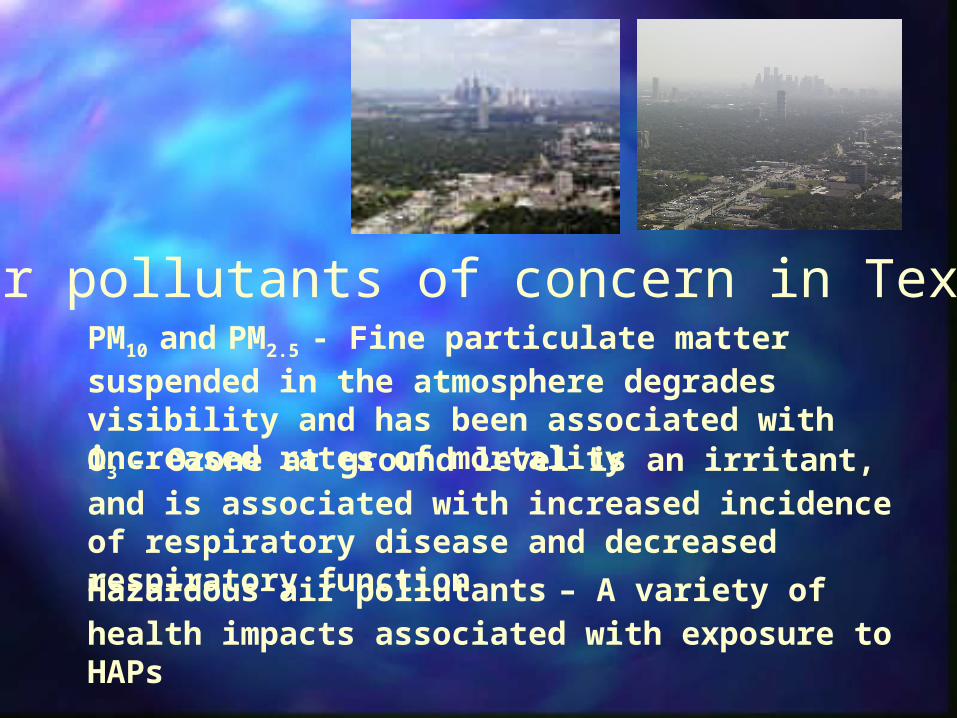
Air pollutants of concern in Texas
PM10 and PM2.5 - Fine particulate matter suspended in the atmosphere degrades visibility and has been associated with increased rates of mortality
O3 - Ozone at ground level is an irritant, and is associated with increased incidence of respiratory disease and decreased respiratory function
Hazardous air pollutants – A variety of health impacts associated with exposure to HAPs
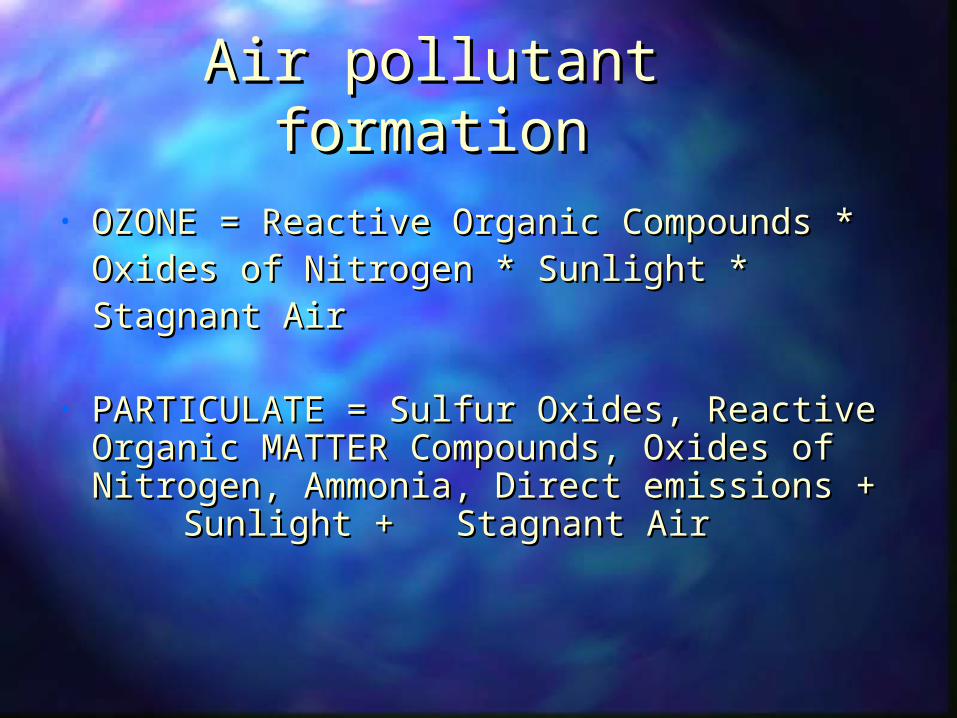
Air pollutant formationAir pollutant formation• OZONE = Reactive Organic Compounds *OZONE = Reactive Organic Compounds *
Oxides of Nitrogen * Sunlight *Oxides of Nitrogen * Sunlight *Stagnant AirStagnant Air
• PARTICULATE = Sulfur Oxides, Reactive PARTICULATE = Sulfur Oxides, Reactive Organic MATTER Compounds, Oxides of Organic MATTER Compounds, Oxides of Nitrogen, Ammonia, Direct emissions + Nitrogen, Ammonia, Direct emissions +
Sunlight + Sunlight + Stagnant AirStagnant Air
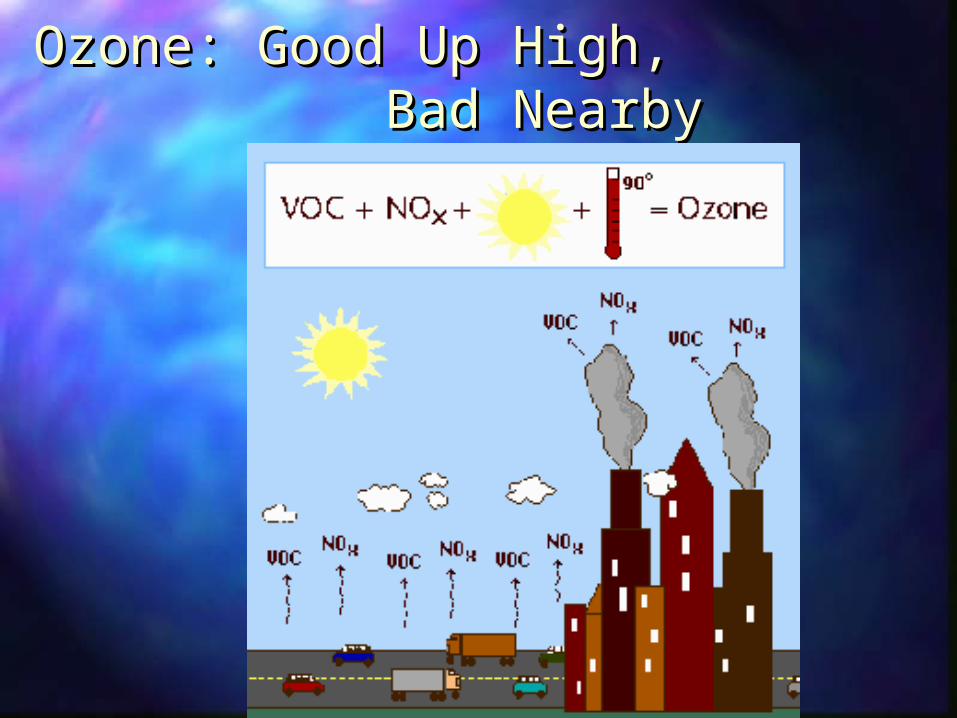
Ozone: Good Up High, Ozone: Good Up High, Bad Nearby Bad Nearby
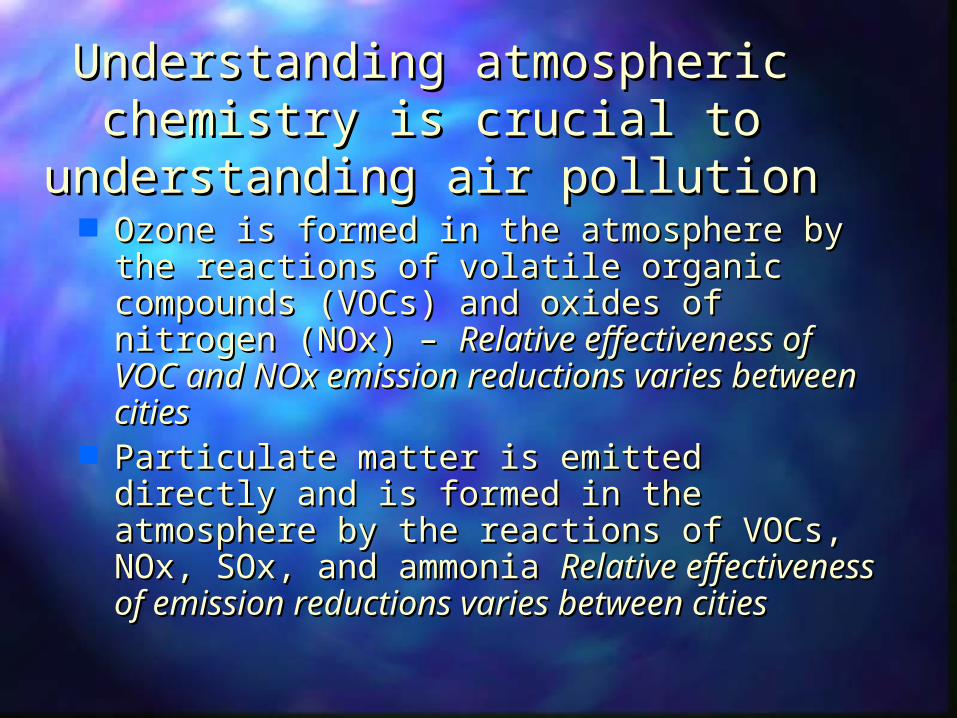
Understanding atmospheric Understanding atmospheric chemistry is crucial to chemistry is crucial to
understanding air pollutionunderstanding air pollution Ozone is formed in the atmosphere by Ozone is formed in the atmosphere by
the reactions of volatile organic the reactions of volatile organic compounds (VOCs) and oxides of compounds (VOCs) and oxides of nitrogen (NOx) – nitrogen (NOx) – Relative effectiveness of Relative effectiveness of VOC and NOx emission reductions varies VOC and NOx emission reductions varies between citiesbetween cities
Particulate matter is emitted directly and Particulate matter is emitted directly and is formed in the atmosphere by the is formed in the atmosphere by the reactions of VOCs, NOx, SOx, and reactions of VOCs, NOx, SOx, and ammonia ammonia Relative effectiveness of Relative effectiveness of emission reductions varies between citiesemission reductions varies between cities

A Tale of Two Cities: A Tale of Two Cities: AustinAustin
Austin: Moderate ozone and fine Austin: Moderate ozone and fine particulate matter concentrations; air particulate matter concentrations; air quality dependent on both local and quality dependent on both local and regional sourcesregional sources
Houston: Sees some of the highest ozone Houston: Sees some of the highest ozone concentrations in the United States but concentrations in the United States but relatively moderate particulate matter relatively moderate particulate matter concentrations; dominated by a mix of concentrations; dominated by a mix of local emissions, industrial and urban local emissions, industrial and urban

Austin’s statusAustin’s status All monitors meet the All monitors meet the
current National Ambient current National Ambient Air Quality Standards – Air Quality Standards – no local regulations in no local regulations in place – only national place – only national initiatives (for example, initiatives (for example, cleaner cars)cleaner cars)
The region would be in The region would be in non-attainment for the non-attainment for the new, more stringent new, more stringent NAAQS, due to be NAAQS, due to be implemented in 2004implemented in 2004
An Early Action Compact An Early Action Compact has been initiatedhas been initiated
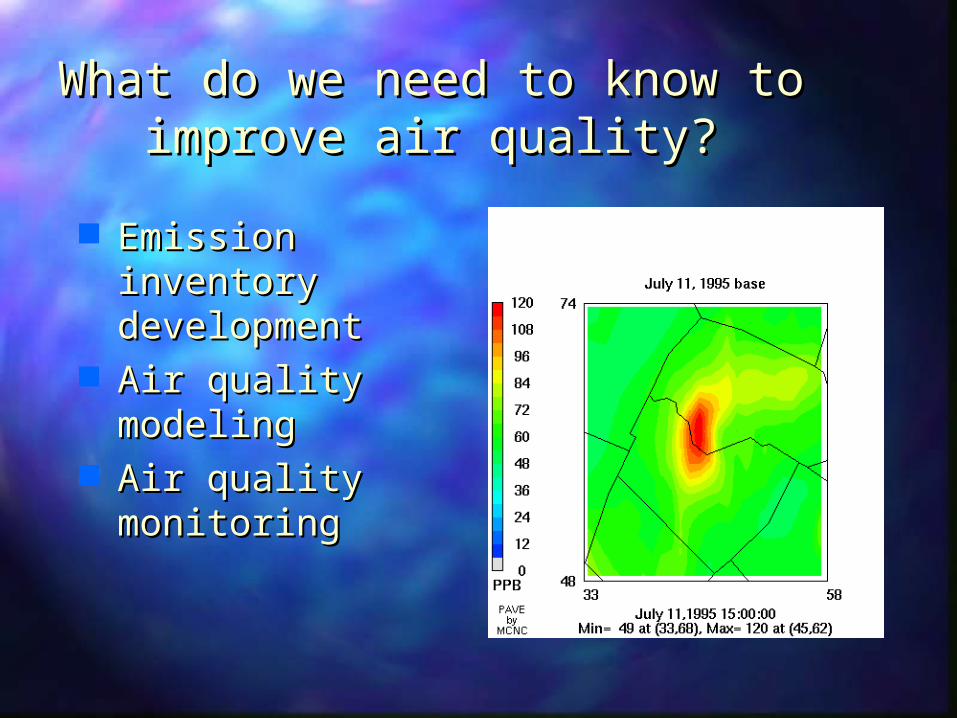
What do we need to know to What do we need to know to improve air quality?improve air quality?
Emission Emission inventory inventory developmentdevelopment
Air quality Air quality modelingmodeling
Air quality Air quality monitoringmonitoring
How do we How do we improve air improve air quality?quality?
National Ambient air Quality Standards National Ambient air Quality Standards (NAAQS) set the threshold for action for (NAAQS) set the threshold for action for many air pollutantsmany air pollutants
States prepare plans (State States prepare plans (State Implementation Plans or SIPs) for Implementation Plans or SIPs) for individual citiesindividual cities
Who sets air quality Who sets air quality standards?standards?
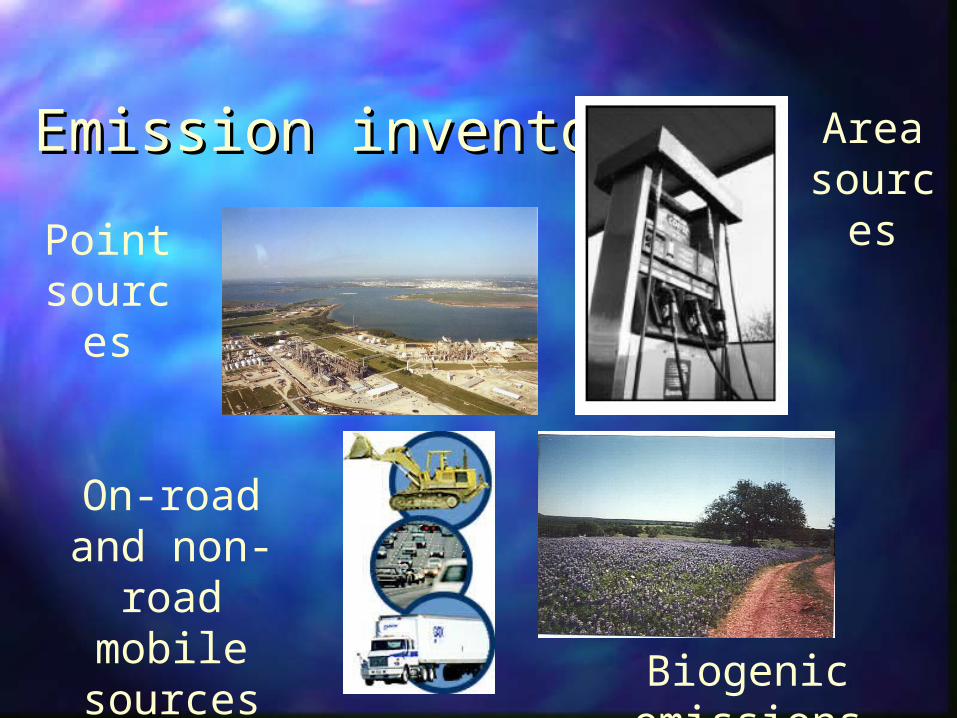
Emission inventoriesEmission inventories
On-road and non-road
mobile sources
Point sources
Area sources
Biogenic emissions
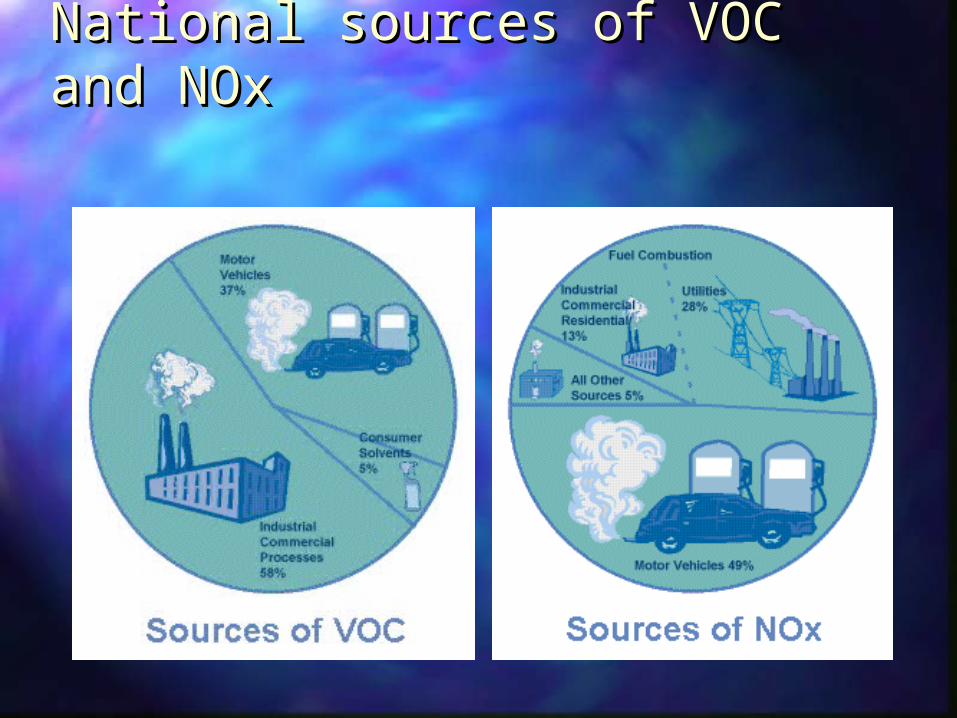
National sources of VOC and National sources of VOC and NOxNOx
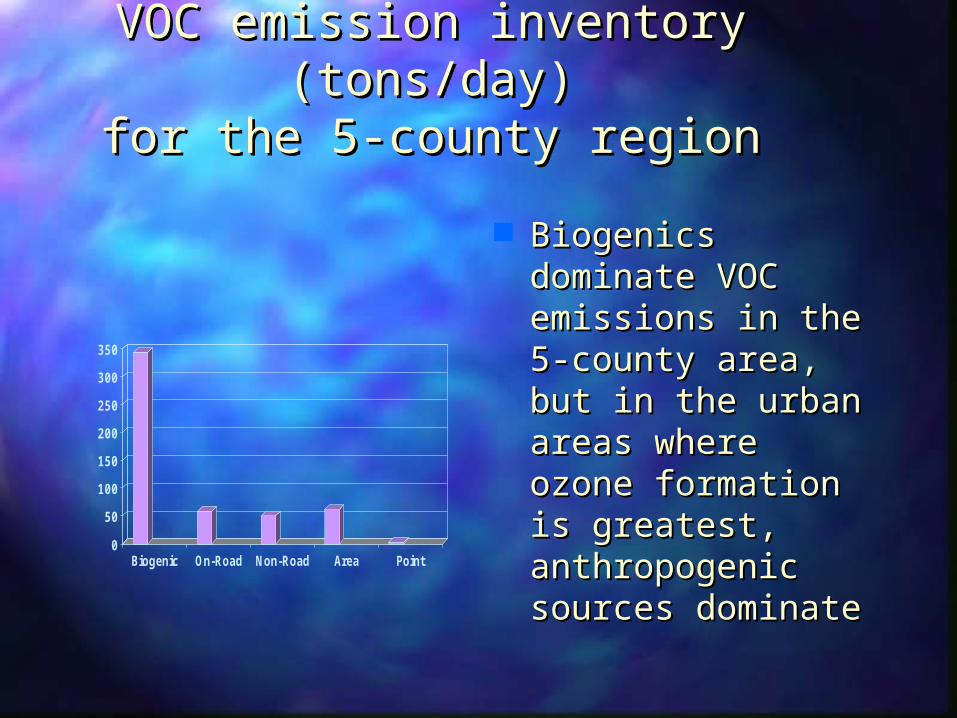
VOC emission inventory VOC emission inventory (tons/day)(tons/day)
for the 5-county regionfor the 5-county region
Biogenics Biogenics dominate VOC dominate VOC emissions in the 5-emissions in the 5-county area, but in county area, but in the urban areas the urban areas where ozone where ozone formation is formation is greatest, greatest, anthropogenic anthropogenic sources dominatesources dominate
0
50
100
150
200
250
300
350
Biogenic On-Road Non-Road Area Point
iona williams
Biogenic: Applied to material, processes, or activities of living or once-living organisms.Anthropogenic: originating in human activityA Dictionary of Earth Sciences. Ed. Ailsa Allaby and Michael Allaby. Oxford University Press, 1999. Oxford Reference Online. Oxford University Press. 1 August 2003 <http://www.oxfordreference.com/views/ENTRY.html?subview=Main&entry=t13.000886>The Concise Oxford Dictionary. Ed. Judy Pearsall. Oxford University Press, 2001. Oxford Reference Online. Oxford University Press. 1 August 2003 <http://www.oxfordreference.com/views/ENTRY.html?subview=Main&entry=t23.002188>
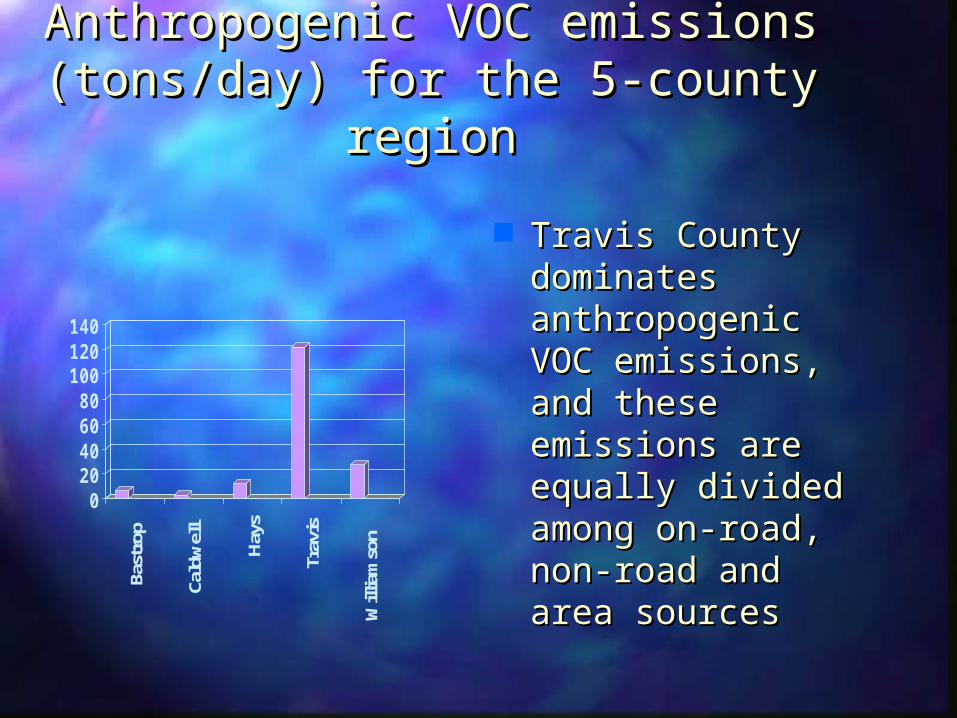
Anthropogenic VOC emissions Anthropogenic VOC emissions (tons/day) for the 5-county (tons/day) for the 5-county
regionregion
Travis County Travis County dominates dominates anthropogenic anthropogenic VOC emissions, VOC emissions, and these and these emissions are emissions are equally divided equally divided among on-road, among on-road, non-road and area non-road and area sourcessources
020406080100120140
Bastrop
Caldwell
Hays
Travis
Williamson
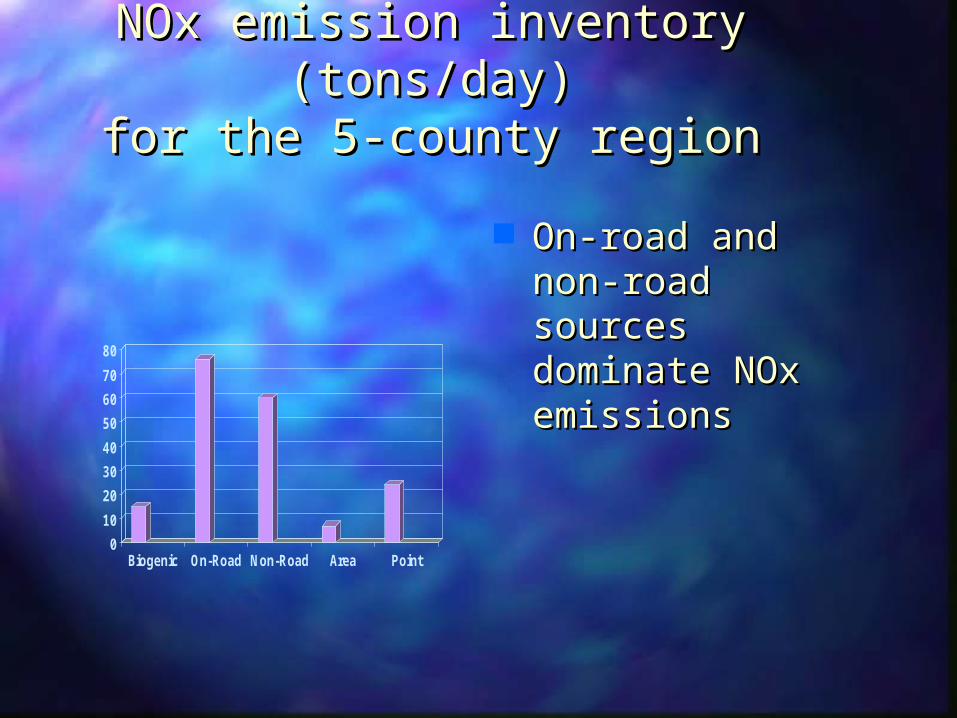
NOx emission inventory NOx emission inventory (tons/day)(tons/day)
for the 5-county regionfor the 5-county region
On-road and non-On-road and non-road sources road sources dominate NOx dominate NOx emissionsemissions
0
10
20
30
40
50
60
70
80
Biogenic On-Road Non-Road Area Point
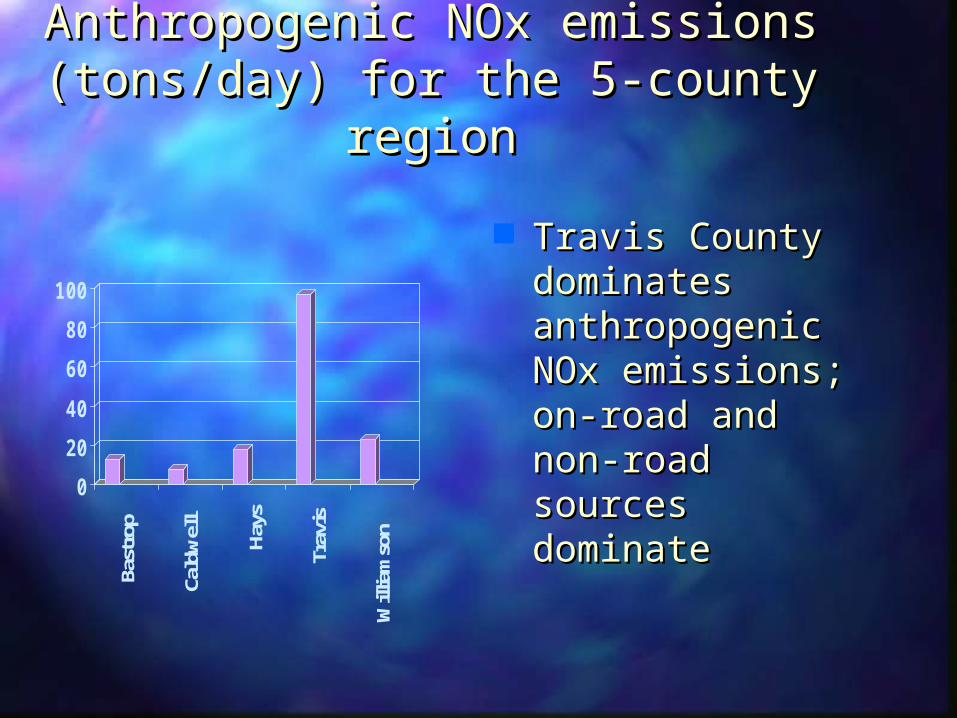
Anthropogenic NOx emissions Anthropogenic NOx emissions (tons/day) for the 5-county (tons/day) for the 5-county
regionregion
Travis County Travis County dominates dominates anthropogenic anthropogenic NOx emissions; NOx emissions; on-road and non-on-road and non-road sources road sources dominate dominate
0
20
40
60
80
100
Bastrop
Caldwell
Hays
Travis
Williamson
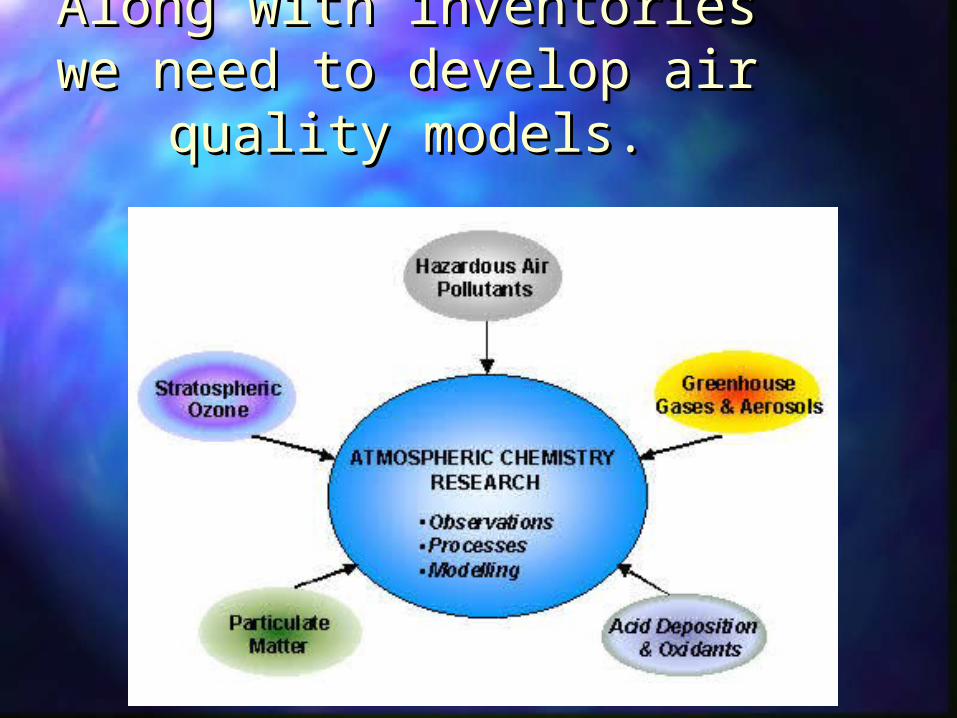
Along with inventories we Along with inventories we need to develop air quality need to develop air quality
models.models.
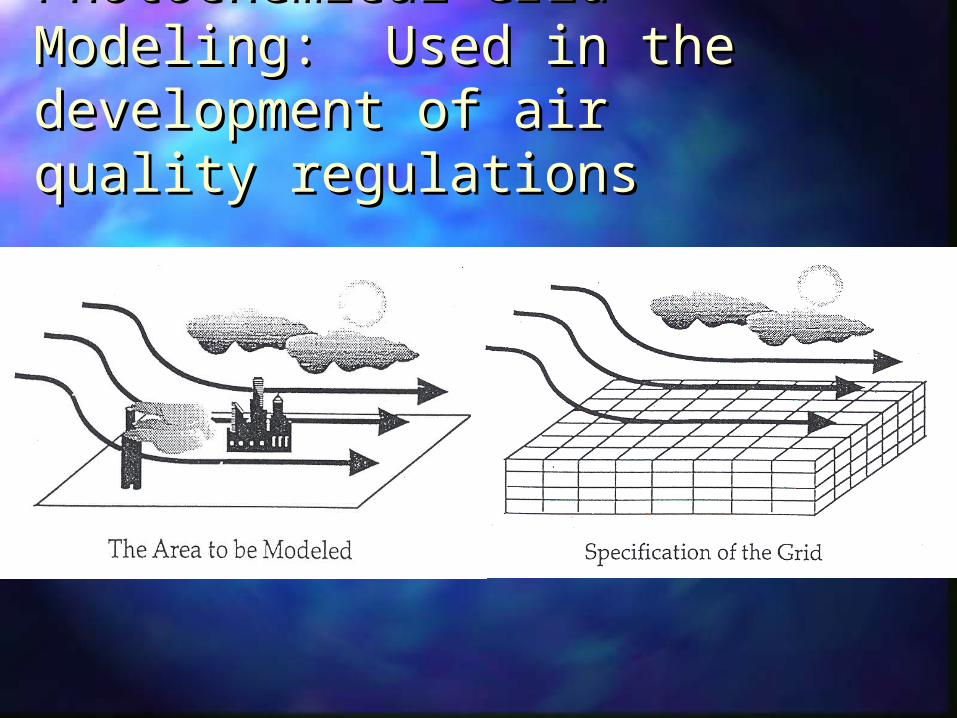
Photochemical Grid Photochemical Grid Modeling: Used in the Modeling: Used in the development of air quality development of air quality regulationsregulations
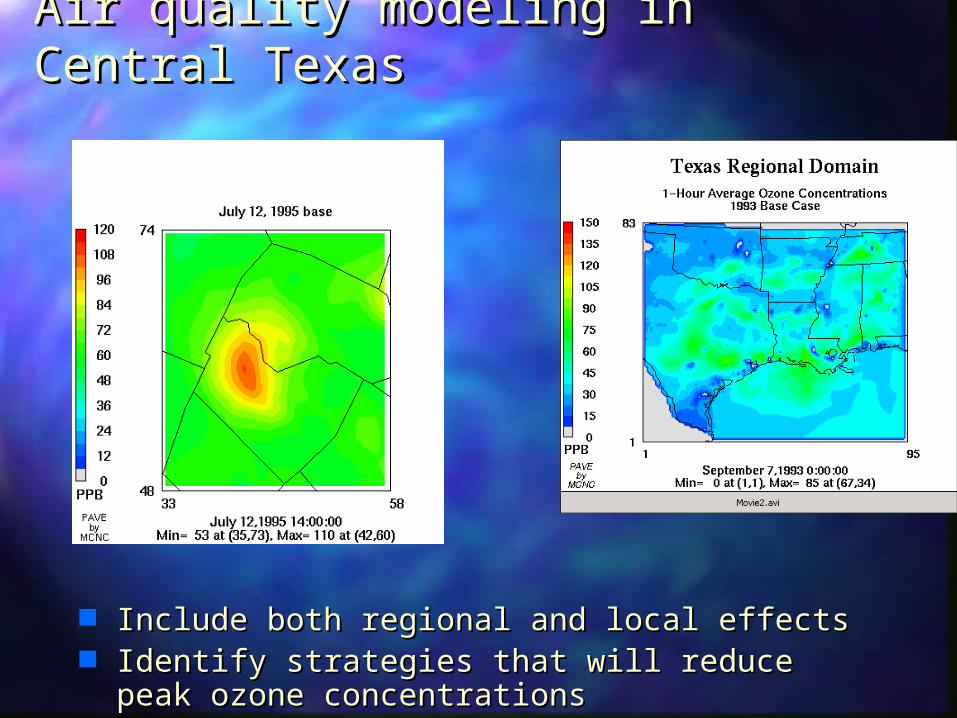
Air quality modeling in Central Air quality modeling in Central TexasTexas
Include both regional and local effectsInclude both regional and local effects Identify strategies that will reduce peak ozone Identify strategies that will reduce peak ozone
concentrationsconcentrations
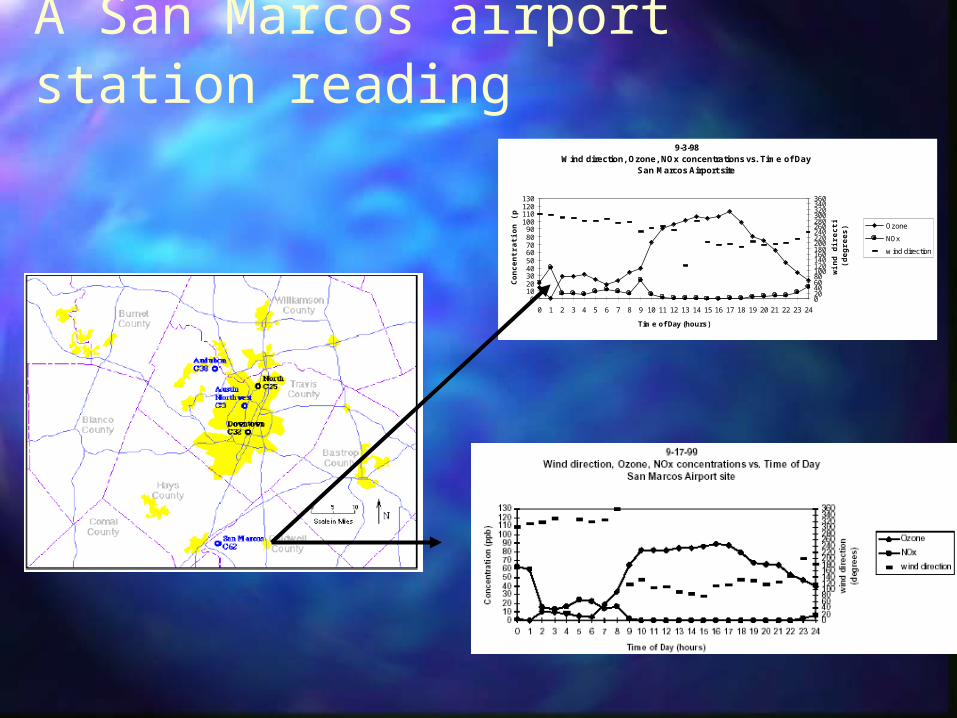
A San Marcos airport station reading
9-3-98Wind direction, Ozone, NOx concentrations vs. Time of Day
San Marcos Airport site
0102030405060708090
100110120130
0 1 2 3 4 5 6 7 8 9 10 11 12 13 14 15 16 17 18 19 20 21 22 23 24
Time of Day (hours)
Co
nce
ntr
atio
n (
pp
b)
020406080100120140160180200220240260280300320340360
win
d d
irec
tio
n
(deg
rees
)
Ozone
NOx
w ind direction
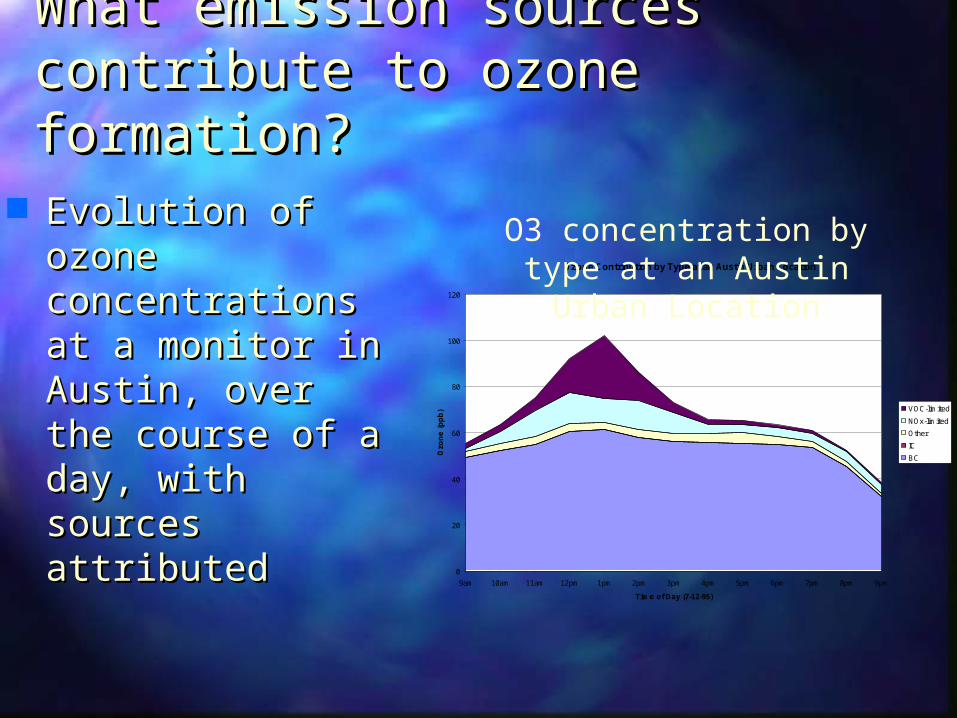
What emission sources What emission sources contribute to ozone contribute to ozone formation?formation?
Evolution of Evolution of ozone ozone concentrations at concentrations at a monitor in a monitor in Austin, over the Austin, over the course of a day, course of a day, with sources with sources attributedattributed
Ozone Contribution by Type at an Austin Urban Location
0
20
40
60
80
100
120
9am 10am 11am 12pm 1pm 2pm 3pm 4pm 5pm 6pm 7pm 8pm 9pm
Time of Day (7-12-95)
Ozo
ne
(p
pb
) VOC-limited
NOx-limited
Other
IC
BC
O3 concentration by type at an Austin Urban Location
Sample back trajectories Sample back trajectories for high ozone episodes in for high ozone episodes in Austin…..Austin…..
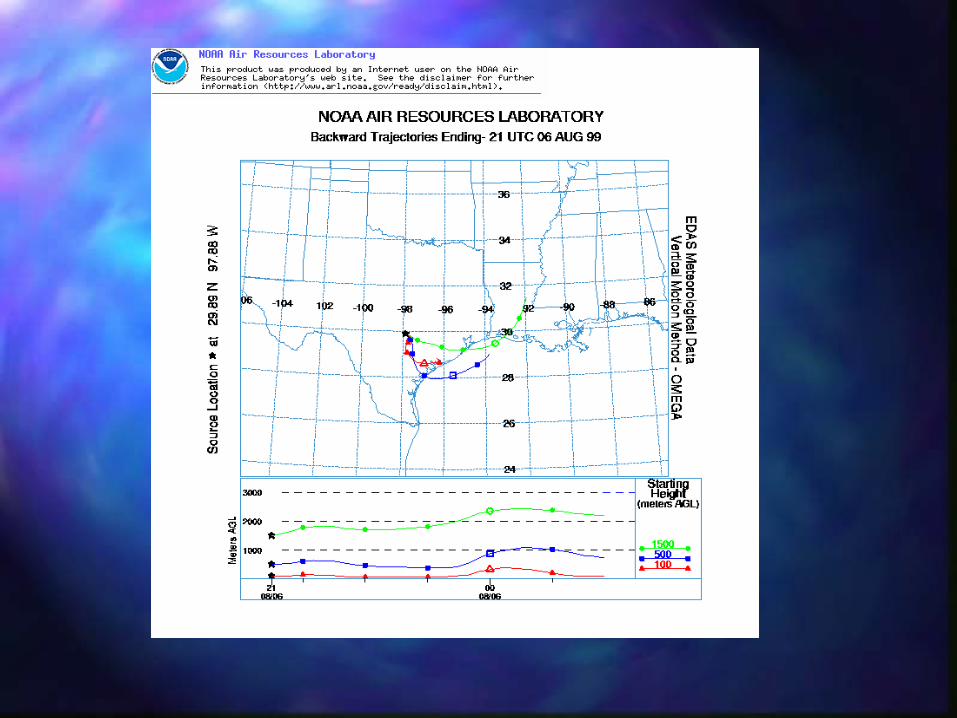
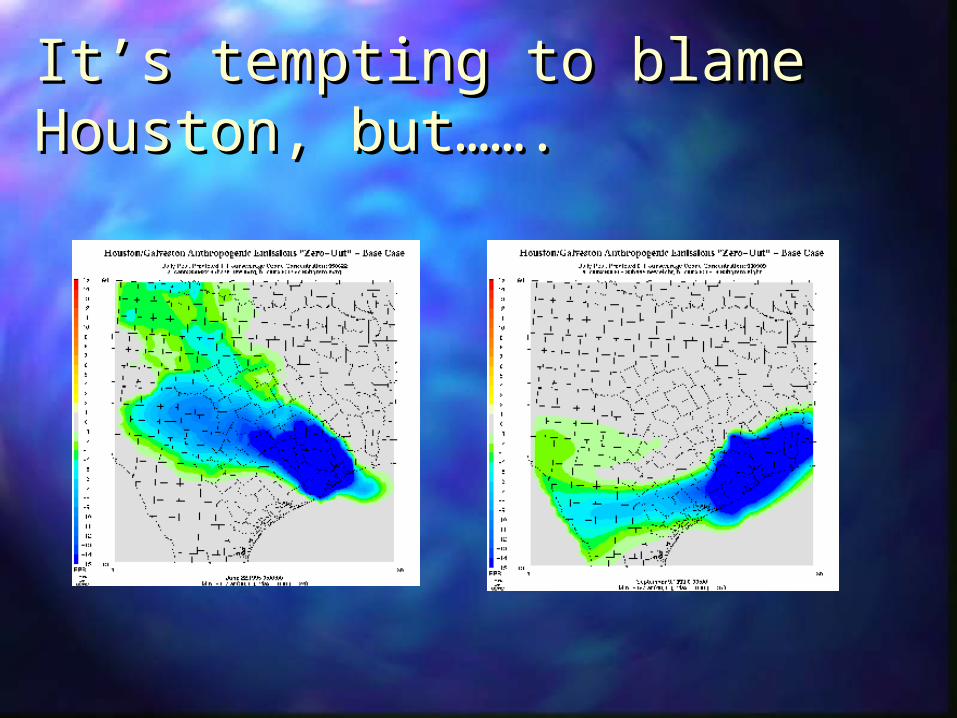
It’s tempting to blame It’s tempting to blame Houston, but…….Houston, but…….

Every city in eastern Texas Every city in eastern Texas has an impact on at least one has an impact on at least one other cityother city

32-Hour back trajectories for days with peak 8-hour ozone levels over 75 ppb. 1993-1999
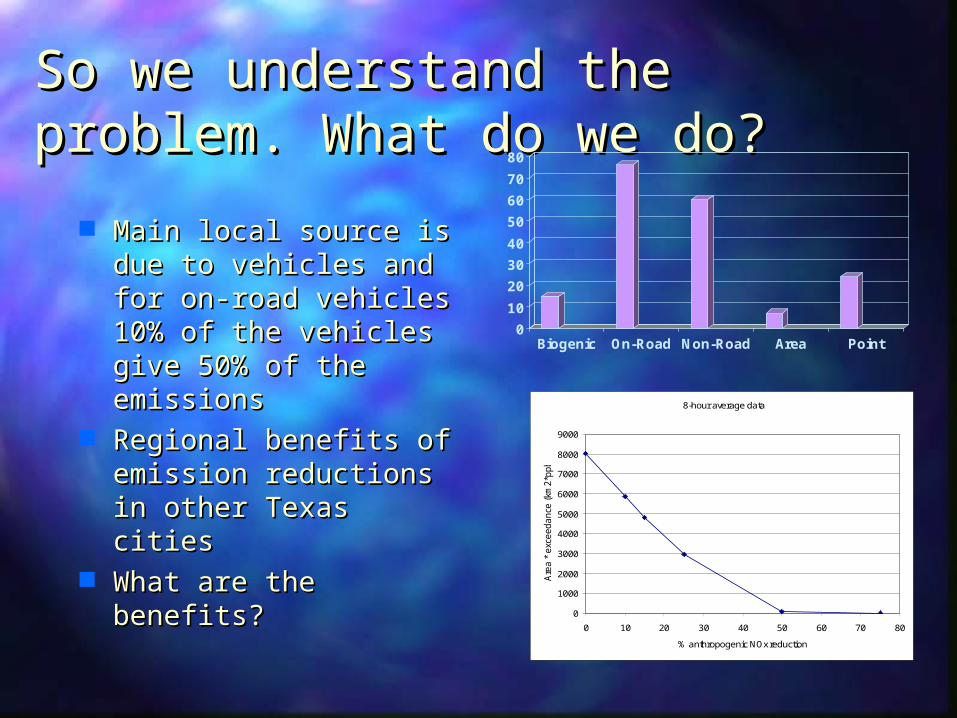
So we understand the So we understand the problem. What do we do?problem. What do we do?
Main local source is Main local source is due to vehicles and due to vehicles and for on-road vehicles for on-road vehicles 10% of the vehicles 10% of the vehicles give 50% of the give 50% of the emissionsemissions
Regional benefits of Regional benefits of emission reductions emission reductions in other Texas citiesin other Texas cities
What are the What are the benefits?benefits?
0
10
20
30
40
50
60
70
80
Biogenic On-Road Non-Road Area Point
8-hour average data
0
1000
2000
3000
4000
5000
6000
7000
8000
9000
0 10 20 30 40 50 60 70 80
% anthropogenic NOx reduction
Are
a *
exc
eedance
(km
2*p
pb)
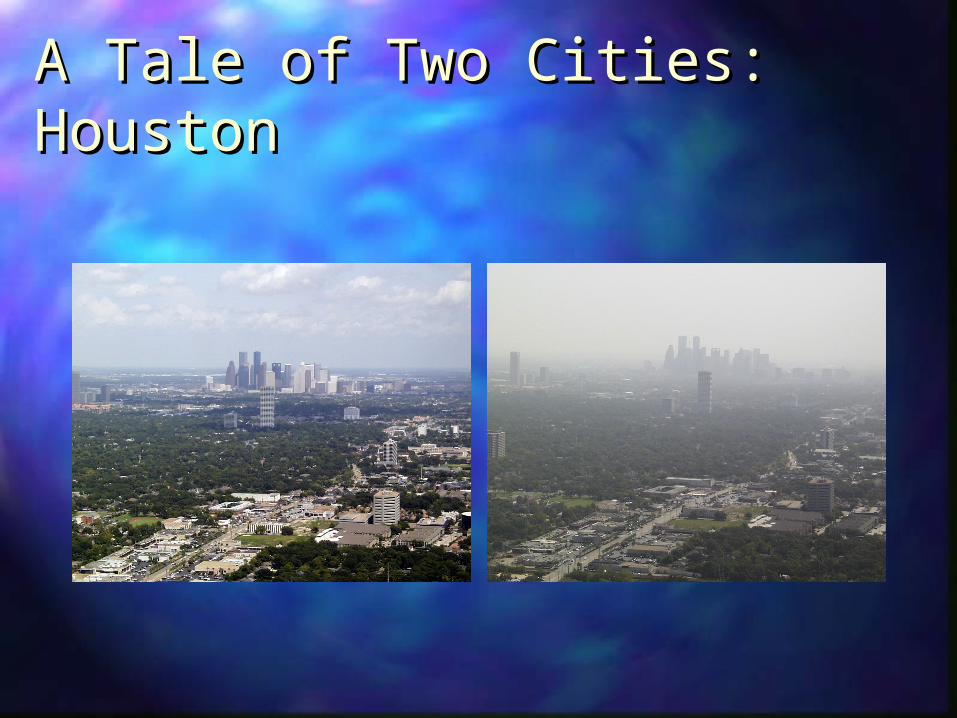
A Tale of Two Cities: A Tale of Two Cities: HoustonHouston

•The Houston-Galveston area is a severe ozone non-attainment area
•The current State Implementation Plan (SIP) calls for significant NOx emission reductions (approximately 70% of the projected 2007 inventory; 90+% for point sources)
•SIP also calls for VOC emission reductions (approximately 25% of the projected 2007 inventory)
•Costs and benefits of controls have been estimated to be ~5 billion/yr
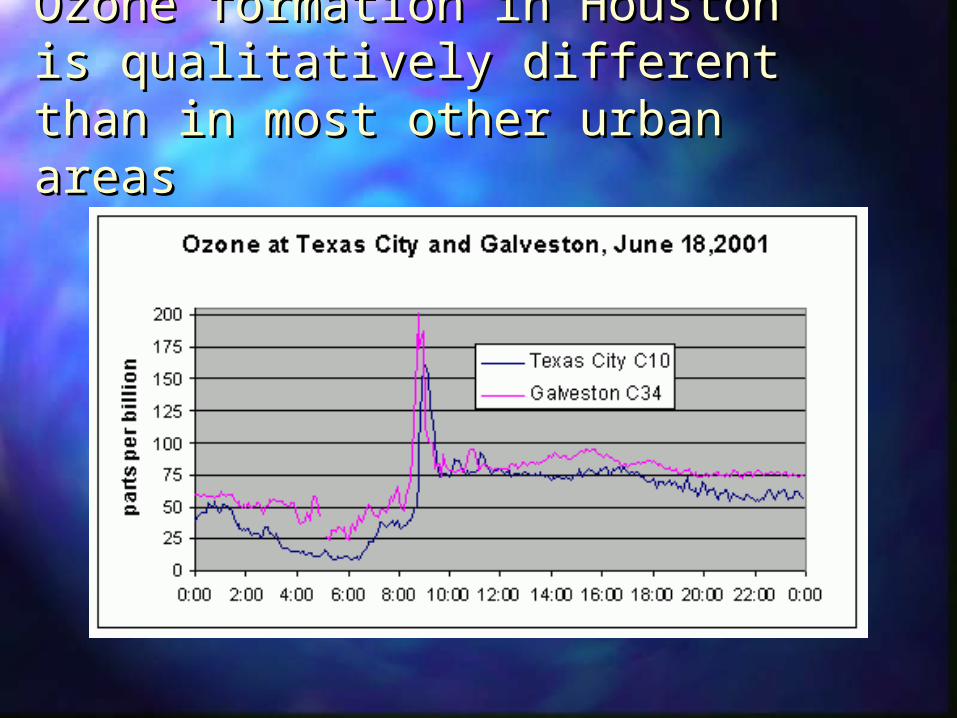
Ozone formation in Houston is Ozone formation in Houston is qualitatively different than in qualitatively different than in most other urban areasmost other urban areas
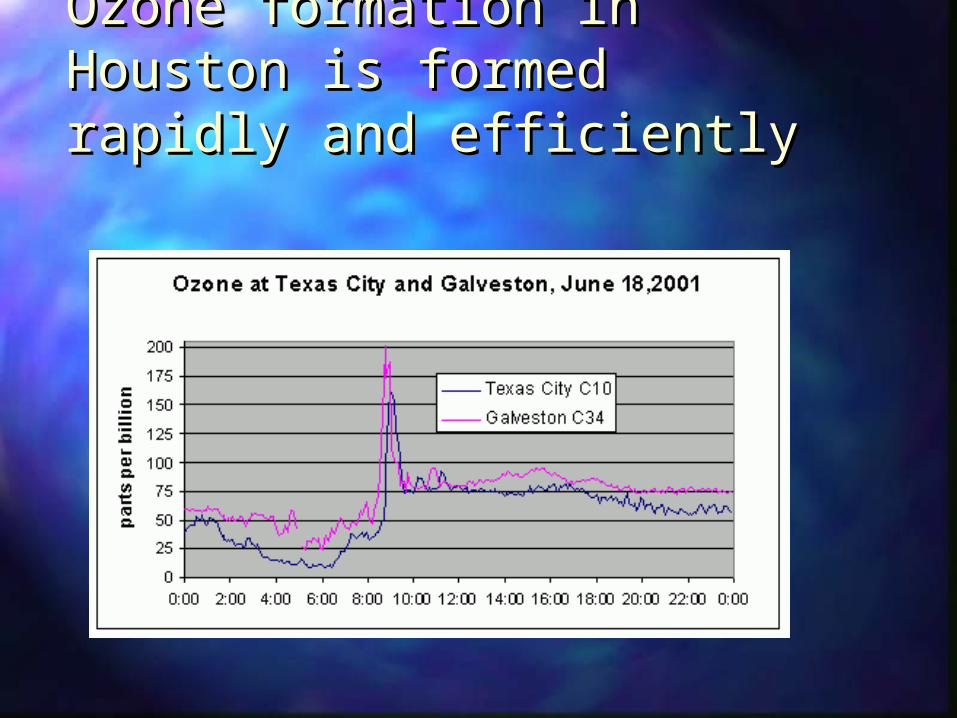
Ozone formation in Houston Ozone formation in Houston is formed rapidly and is formed rapidly and efficientlyefficiently
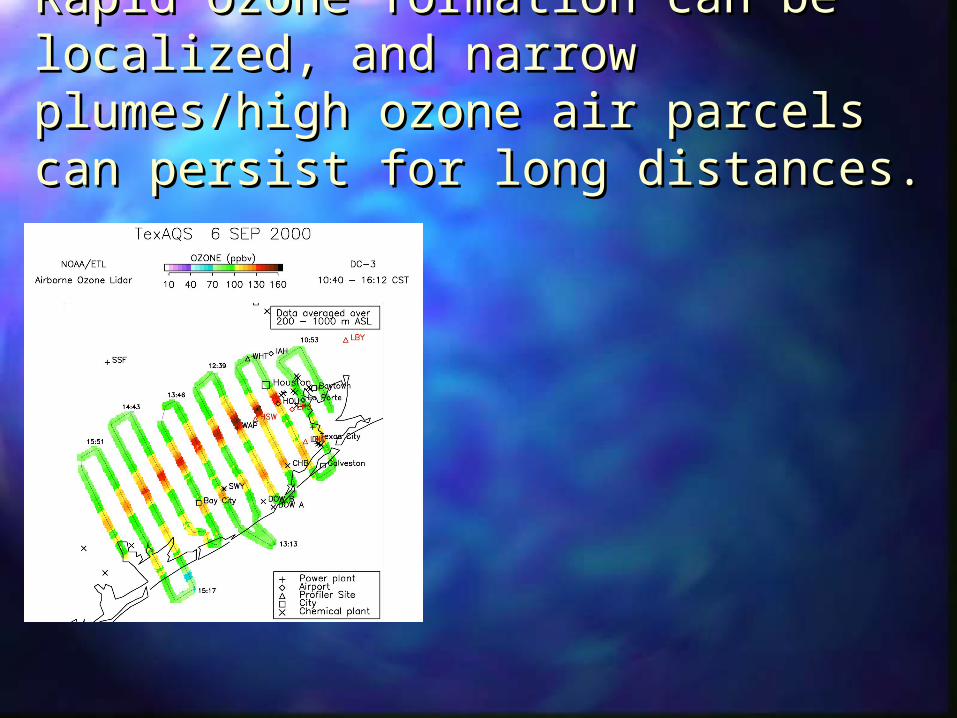
Rapid ozone formation can be Rapid ozone formation can be localized, and narrow plumes/high localized, and narrow plumes/high ozone air parcels can persist for long ozone air parcels can persist for long distances.distances.

What causes these events?Localized, high hydrocarbon concentrations
0
5
10
15
20
25
30
35
40
Top 10%MeanBottom 10%
AnthropogenicBiogenicCOMethane
OH
Rea
ctiv
ity (
s-1
)
iona williams
What are bottom, top, and high?
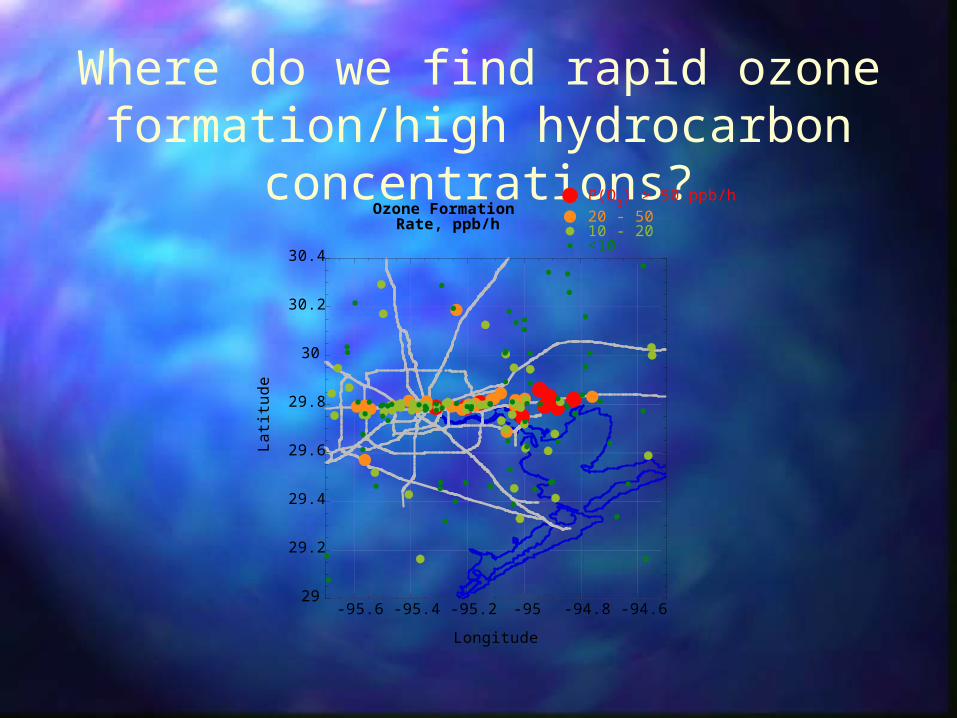
Where do we find rapid ozone formation/high hydrocarbon concentrations?
29
29.2
29.4
29.6
29.8
30
30.2
30.4
-95.6 -95.4 -95.2 -95 -94.8 -94.6
Ozone FormationRate, ppb/h
P(O3) > 50 ppb/h
20 - 5010 - 20<10
Latit
ude
Longitude
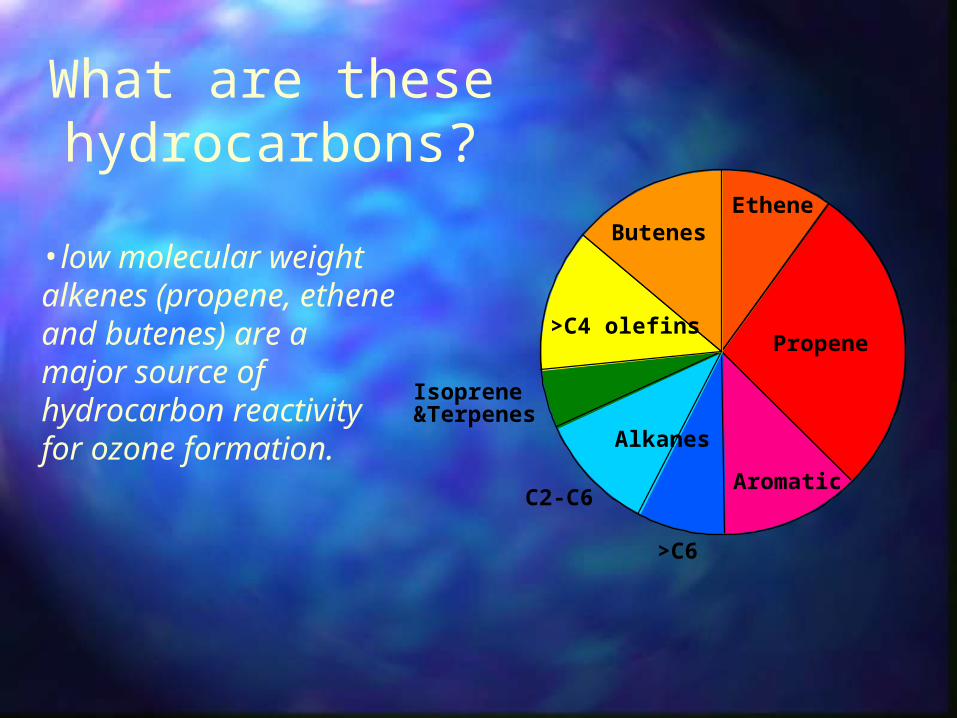
What are these hydrocarbons?
•low molecular weight alkenes (propene, ethene and butenes) are a major source of hydrocarbon reactivity for ozone formation.
Propene
ButenesEthene
Aromatic
>C4 olefins
Alkanes
C2-C6
>C6
Isoprene&Terpenes
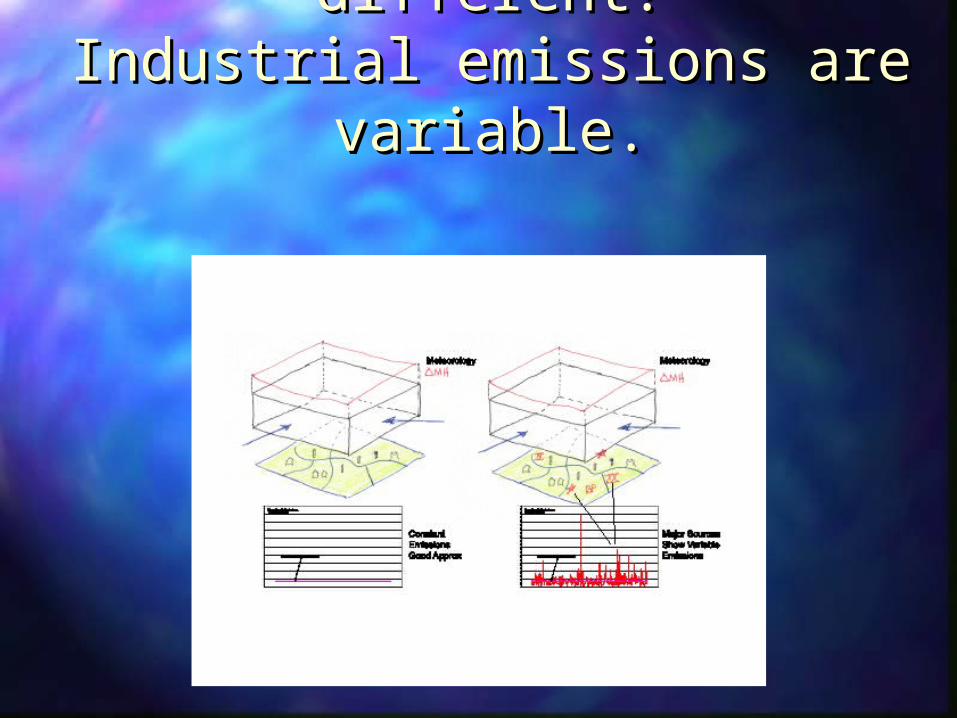
Why is Houston so different?Why is Houston so different?Industrial emissions are Industrial emissions are
variable.variable.
Texas Air Quality Study -2000Texas Air Quality Study -2000(TEXAQS - 2000) (TEXAQS - 2000)
Provide scientific basis for air quality Provide scientific basis for air quality management strategies in southeast management strategies in southeast
TexasTexas
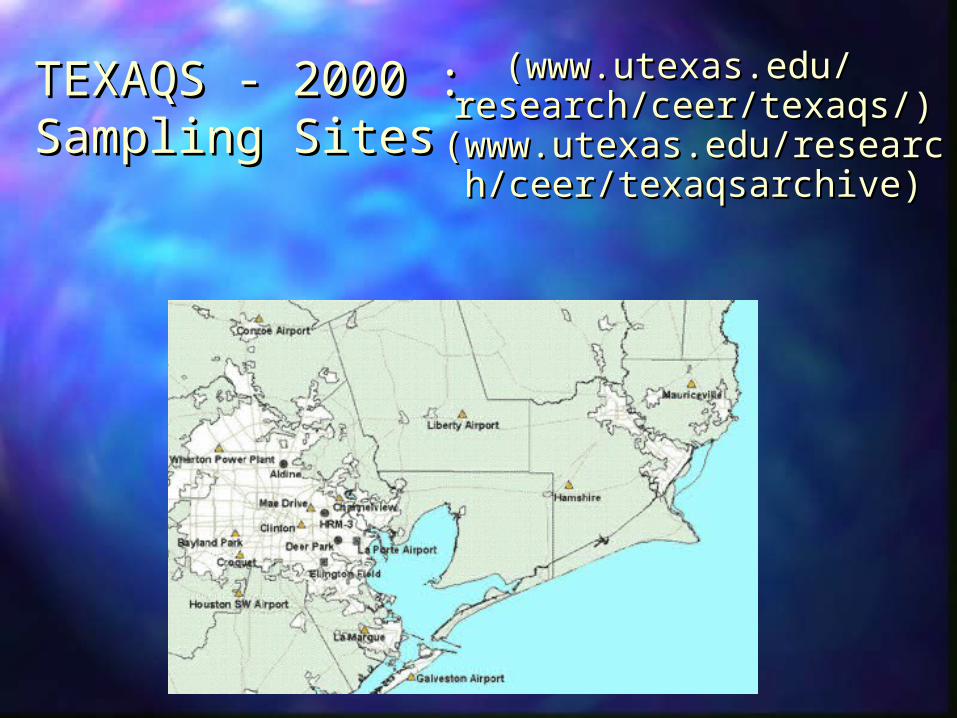
TEXAQS - 2000 :TEXAQS - 2000 :Sampling SitesSampling Sites
(www.utexas.edu/(www.utexas.edu/research/ceer/texaqs/) research/ceer/texaqs/) (www.utexas.edu/resea(www.utexas.edu/research/ceer/texaqsarchive)rch/ceer/texaqsarchive)
TEXAQS and other research TEXAQS and other research programs address key areas of programs address key areas of uncertaintyuncertainty
Emission inventories.Emission inventories.
Chemical and physical processes in Chemical and physical processes in the atmosphere.the atmosphere.
Regional air quality modeling.Regional air quality modeling.

TexAQS and other research TexAQS and other research programs indicate:programs indicate:
Emission inventories: Emission inventories: Data from TexAQS Data from TexAQS suggest that the VOC emission inventory is low by a suggest that the VOC emission inventory is low by a factor of 3-10factor of 3-10
Emissions are variable: Emissions are variable: Daily variations can Daily variations can change emissions from any single facility by a factor change emissions from any single facility by a factor of 100 or more of 100 or more
Air quality models, on which regulations Air quality models, on which regulations are based, are unable to describe the are based, are unable to describe the spatial variability that we seespatial variability that we see Existing Existing regulatory models have been unable to replicate regulatory models have been unable to replicate critical observations critical observations

How did our improved scientific How did our improved scientific understanding get incorporated understanding get incorporated into the regulations?into the regulations?
Accelerated Science Evaluation Accelerated Science Evaluation TCEQ commissioners to decide TCEQ commissioners to decide
whether to stay with existing plan whether to stay with existing plan or to craft a “mid-course or to craft a “mid-course correction”correction”
For updates, see the web site: For updates, see the web site: (www.utexas.edu/research/ceer/texaqsarchive)(www.utexas.edu/research/ceer/texaqsarchive)

ACCELERATED SCIENCE EVALUATIONof
OZONE FORMATION IN THE HOUSTON-GALVESTON AREA
Working CommitteeDavid Allen, University of Texas
Mark Estes, Texas Natural Resource Conservation CommissionJames Smith, Texas Natural Resource Conservation Commission
Harvey Jeffries, University of North Carolina
DRAFT—Work-in-progress.
September 27, 2001
Actions taken by the TCEQActions taken by the TCEQ
Based on the data from TexAQS, Based on the data from TexAQS, which indicate that VOC emissions which indicate that VOC emissions from industrial facilities are from industrial facilities are underestimated, new rules have underestimated, new rules have been proposed for emissions of been proposed for emissions of reactive hydrocarbons from flares, reactive hydrocarbons from flares, cooling towers and fugitive sources cooling towers and fugitive sources
Benefits of better scientific Benefits of better scientific understanding to the State of understanding to the State of TexasTexas
More effective SIPMore effective SIP More confidence by policy-makers More confidence by policy-makers
in the decision making processin the decision making process Demonstration of the value of Demonstration of the value of
timely scientific analysestimely scientific analyses Demonstration of the value of Demonstration of the value of
federal/state scientific partnershipsfederal/state scientific partnerships
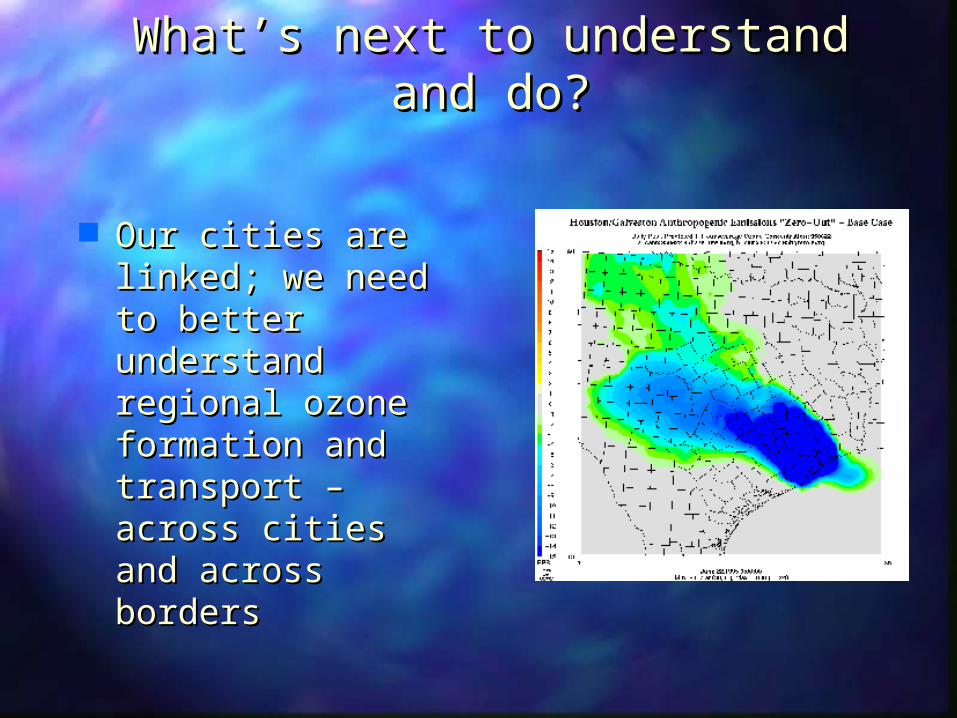
What’s next to understand and What’s next to understand and do?do?
Our cities are Our cities are linked; we need to linked; we need to better better understand understand regional ozone regional ozone formation and formation and transport – across transport – across cities and across cities and across bordersborders
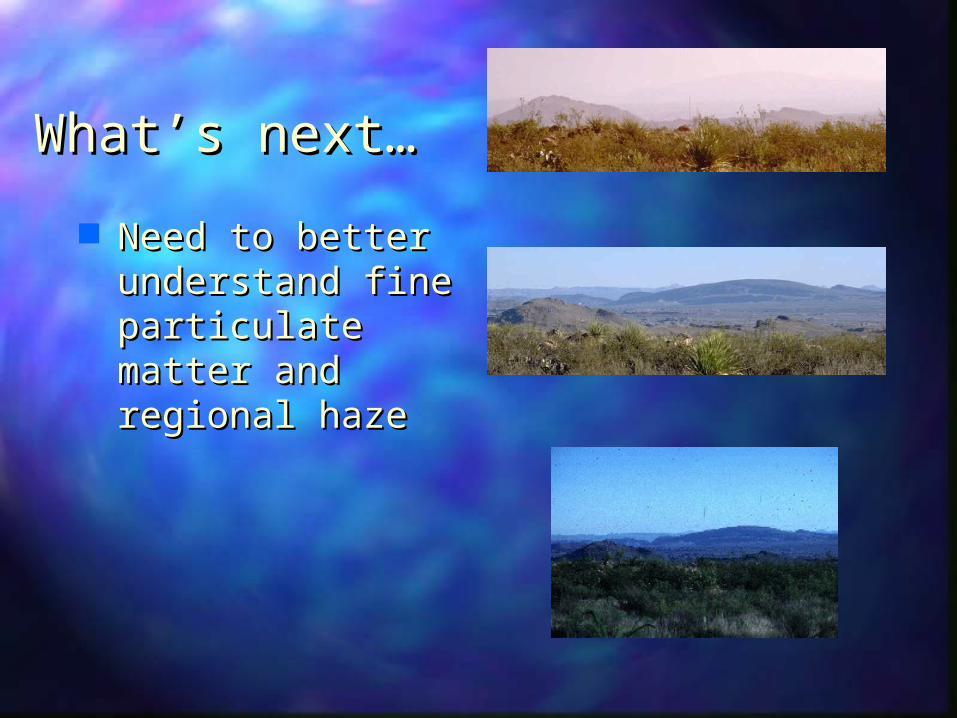
What’s next…What’s next…
Need to better Need to better understand fine understand fine particulate matter particulate matter and regional hazeand regional haze
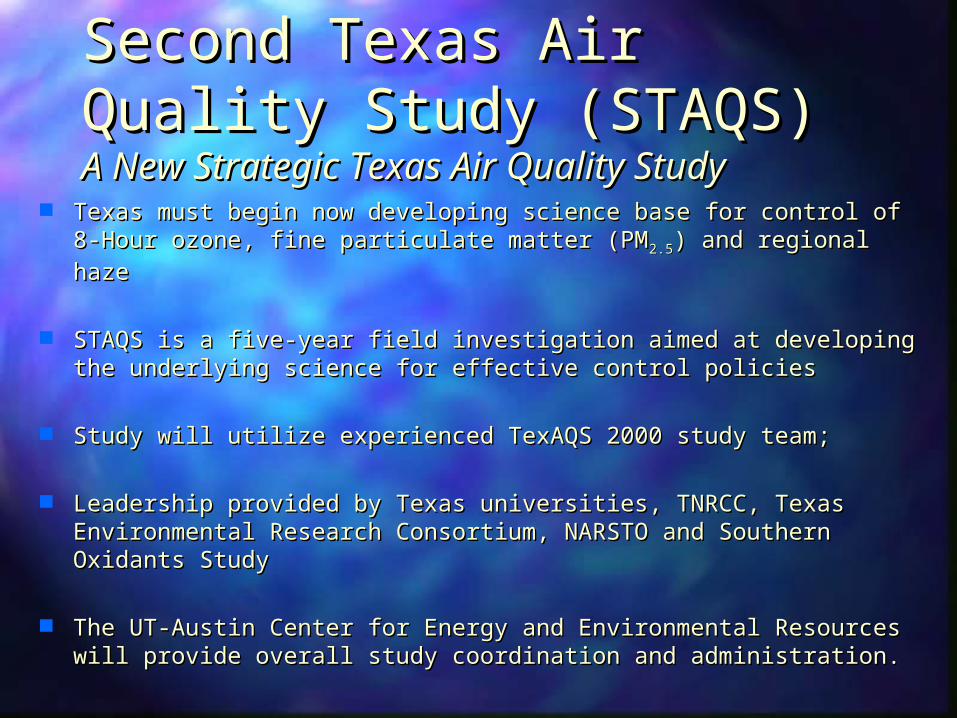
Second Texas Air Quality Second Texas Air Quality Study (STAQS)Study (STAQS) A New Strategic Texas Air Quality StudyA New Strategic Texas Air Quality Study
Texas must begin now developing science base for control of 8-Hour Texas must begin now developing science base for control of 8-Hour ozone, fine particulate matter (PMozone, fine particulate matter (PM2.52.5) and regional haze) and regional haze
STAQS is a five-year field investigation aimed at developing the STAQS is a five-year field investigation aimed at developing the underlying science for effective control policies underlying science for effective control policies
Study will utilize experienced TexAQS 2000 study team; Study will utilize experienced TexAQS 2000 study team;
Leadership provided by Texas universities, TNRCC, Texas Leadership provided by Texas universities, TNRCC, Texas Environmental Research Consortium, NARSTO and Southern Oxidants Environmental Research Consortium, NARSTO and Southern Oxidants StudyStudy
The UT-Austin Center for Energy and Environmental Resources will The UT-Austin Center for Energy and Environmental Resources will provide overall study coordination and administration.provide overall study coordination and administration.
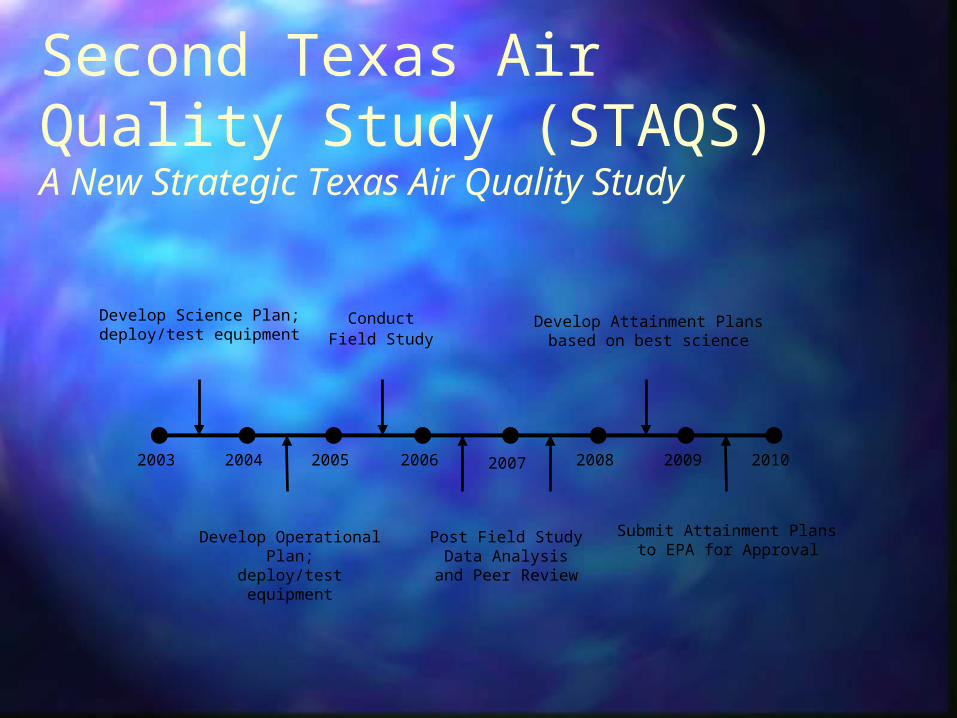
2003 2004 2005 2006 2007 2008 2009 2010
Develop Science Plan;deploy/test equipment
Develop Operational Plan;deploy/test equipment
ConductField Study
Post Field StudyData Analysis
and Peer Review
Develop Attainment Plansbased on best science
Submit Attainment Plansto EPA for Approval
Second Texas Air Quality Study (STAQS) A New Strategic Texas Air Quality Study
What can we do?What can we do?•Keep your automobile well tuned and maintained.
•Carpool, use mass transit, walk, bicycle, and/or reduce driving, especially on hot summer days.
•During the summer, fill your gas tank during the cooler evening hours.
•Participate in your local utility's energy conservation programs.
•Seal containers of household cleaners, workshop chemicals and solvents, and garden chemicals to prevent VOC from evaporating
into the air. Dispose of them properly.
Questions?Questions?
David AllenDavid Allen
[email protected]@che.utexas.edu
www.utexas.edu/research/ceer/airqualitywww.utexas.edu/research/ceer/airquality
www.utexas.edu/research/ceer/texaqswww.utexas.edu/research/ceer/texaqs
www.utexas.edu/research/ceer/www.utexas.edu/research/ceer/texaqsarchivetexaqsarchive