
to ensure reliability bul poer system - NERC Analysis DL/2011_RARPR_FINAL.pdfentity, and Manitoba...
68
2011 Risk Assessment of Reliability Performance the reliability of the to ensure bulk power system July 2011
Transcript of to ensure reliability bul poer system - NERC Analysis DL/2011_RARPR_FINAL.pdfentity, and Manitoba...
2011 Risk Assessment ofReliability Performance
the reliability of theto ensure
bulk power systemJuly 2011
NERC’s Mission
i 2011 Risk Assessment of Reliability Performance
NERC’s Mission The North American Electric Reliability Corporation (NERC) is an international regulatory authority established to evaluate reliability of the bulk power system in North America. NERC develops and enforces Reliability Standards; assesses adequacy annually via a ten‐year forecast and winter and summer forecasts; monitors the bulk power system; and educates, trains, and certifies industry personnel. NERC is the electric reliability organization for North America, subject to oversight by the U.S. Federal Energy Regulatory Commission (FERC) and governmental authorities in Canada.1
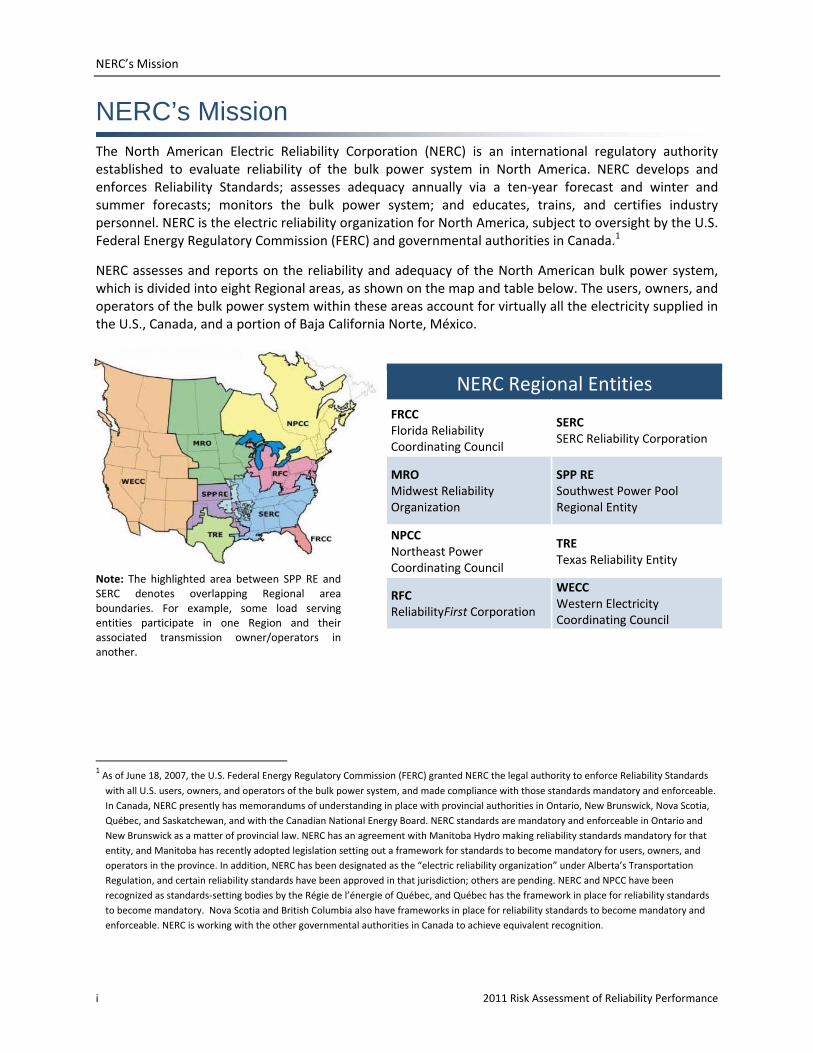
NERC assesses and reports on the reliability and adequacy of the North American bulk power system, which is divided into eight Regional areas, as shown on the map and table below. The users, owners, and operators of the bulk power system within these areas account for virtually all the electricity supplied in the U.S., Canada, and a portion of Baja California Norte, México.
1 As of June 18, 2007, the U.S. Federal Energy Regulatory Commission (FERC) granted NERC the legal authority to enforce Reliability Standards
with all U.S. users, owners, and operators of the bulk power system, and made compliance with those standards mandatory and enforceable.
In Canada, NERC presently has memorandums of understanding in place with provincial authorities in Ontario, New Brunswick, Nova Scotia,
Québec, and Saskatchewan, and with the Canadian National Energy Board. NERC standards are mandatory and enforceable in Ontario and
New Brunswick as a matter of provincial law. NERC has an agreement with Manitoba Hydro making reliability standards mandatory for that
entity, and Manitoba has recently adopted legislation setting out a framework for standards to become mandatory for users, owners, and
operators in the province. In addition, NERC has been designated as the “electric reliability organization” under Alberta’s Transportation
Regulation, and certain reliability standards have been approved in that jurisdiction; others are pending. NERC and NPCC have been
recognized as standards‐setting bodies by the Régie de l’énergie of Québec, and Québec has the framework in place for reliability standards
to become mandatory. Nova Scotia and British Columbia also have frameworks in place for reliability standards to become mandatory and
enforceable. NERC is working with the other governmental authorities in Canada to achieve equivalent recognition.
NERC Regional Entities
FRCCFlorida Reliability Coordinating Council
SERC SERC Reliability Corporation
MRO Midwest Reliability Organization
SPP RE Southwest Power Pool Regional Entity
NPCC Northeast Power Coordinating Council
TRE Texas Reliability Entity
RFC ReliabilityFirst Corporation
WECC Western Electricity Coordinating Council
Note: The highlighted area between SPP RE andSERC denotes overlapping Regional areaboundaries. For example, some load servingentities participate in one Region and theirassociated transmission owner/operators inanother.

Table of Contents
2011 Risk Assessment of Reliability Performance ii
Table of Contents NERC’S MISSION ................................................................................................................................................. I
TABLE OF CONTENTS .......................................................................................................................................... II
EXECUTIVE SUMMARY ....................................................................................................................................... 1
INTRODUCTION.................................................................................................................................................. 4
RELIABILITY METRICS PERFORMANCE ................................................................................................................. 8
INTRODUCTION................................................................................................................................................ 8
2010 PERFORMANCE METRICS RESULTS AND TRENDS.............................................................................................. 10
ALR1‐3 Planning Reserve Margin ....................................................................................................................... 10
ALR1‐4 BPS Transmission Related Events Resulting in Loss of Load ................................................................... 12
ALR1‐12 Interconnection Frequency Response................................................................................................... 14
ALR2‐3 Activation of Under Frequency Load Shedding ...................................................................................... 14
ALR2‐4 Average Percent Non‐Recovery Disturbance Control Standards (DCS) .................................................. 16
ALR2‐5 Disturbance Control Events Greater Than Most Severe Single Contingency .......................................... 17
ALR 1‐5 System Voltage Performance ................................................................................................................ 19
ALR3‐5 Interconnection Reliability Operating Limit/ System Operating Limit (IROL/SOL) Exceedances ............ 19
ALR4‐1 Automatic Transmission Outages Caused by Protection System Misoperations ................................... 20
ALR6‐11 – ALR6‐14 ............................................................................................................................................. 20
ALR6‐15 Element Availability Percentage (APC) ................................................................................................. 26
ALR6‐16 Transmission System Unavailability ..................................................................................................... 27
ALR6‐2 Energy Emergency Alert 3 (EEA3) .......................................................................................................... 28
ALR 6‐3 Energy Emergency Alert 2 (EEA2) .......................................................................................................... 30
ALR 6‐1 Transmission Constraint Mitigation ...................................................................................................... 31
INTEGRATED BULK POWER SYSTEM RISK ASSESSMENT ............................................................................................. 33
RELIABILITY METRICS CONCLUSIONS AND RECOMMENDATIONS .................................................................................. 36
FUTURE ADVANCEMENTS: INTEGRATED RELIABILITY INDEX ........................................................................................ 36
TRANSMISSION EQUIPMENT PERFORMANCE .................................................................................................... 40
INTRODUCTION............................................................................................................................................... 40
PERFORMANCE TRENDS .................................................................................................................................... 40
CONCLUSIONS ................................................................................................................................................ 47
GENERATION EQUIPMENT PERFORMANCE ........................................................................................................ 48
INTRODUCTION............................................................................................................................................... 48
GENERATION KEY PERFORMANCE INDICATORS ....................................................................................................... 48
CONCLUSIONS ................................................................................................................................................ 53
DISTURBANCE EVENT TRENDS ........................................................................................................................... 55
INTRODUCTION............................................................................................................................................... 55
PERFORMANCE TRENDS .................................................................................................................................... 55
CONCLUSIONS ................................................................................................................................................ 57
ABBREVIATIONS USED IN THIS REPORT ............................................................................................................. 58
CONTRIBUTIONS ............................................................................................................................................... 61
Executive Summary
1 2011 Risk Assessment of Reliability Performance
Executive Summary
Executive Summary
2011 Transition Report The 2011 Risk Assessment of Reliability Performance is a foundational report, with the goal to provide a
view of risks to reliability based on historic performance. The objective is to integrate many ongoing
efforts underway providing technical analysis and
feedback on risk attributes and reliability trends to
stakeholders, regulators, policymakers and industry.
The joint report development was led by NERC staff
in collaboration with several groups independently
analyzing specific aspects of bulk power system
reliability, including the Reliability Metrics Working
Group (RMWG), Transmission Availability Data
System Working Group (TADSWG), Generating
Availability Data System Task Force (GADSTF), and
Event Analysis Working Group (EAWG).
Since its inaugural report,2 the RMWG has advanced
the development and understanding of risk
attributes impacting reliability performance and the
corresponding metrics that provide insight to the
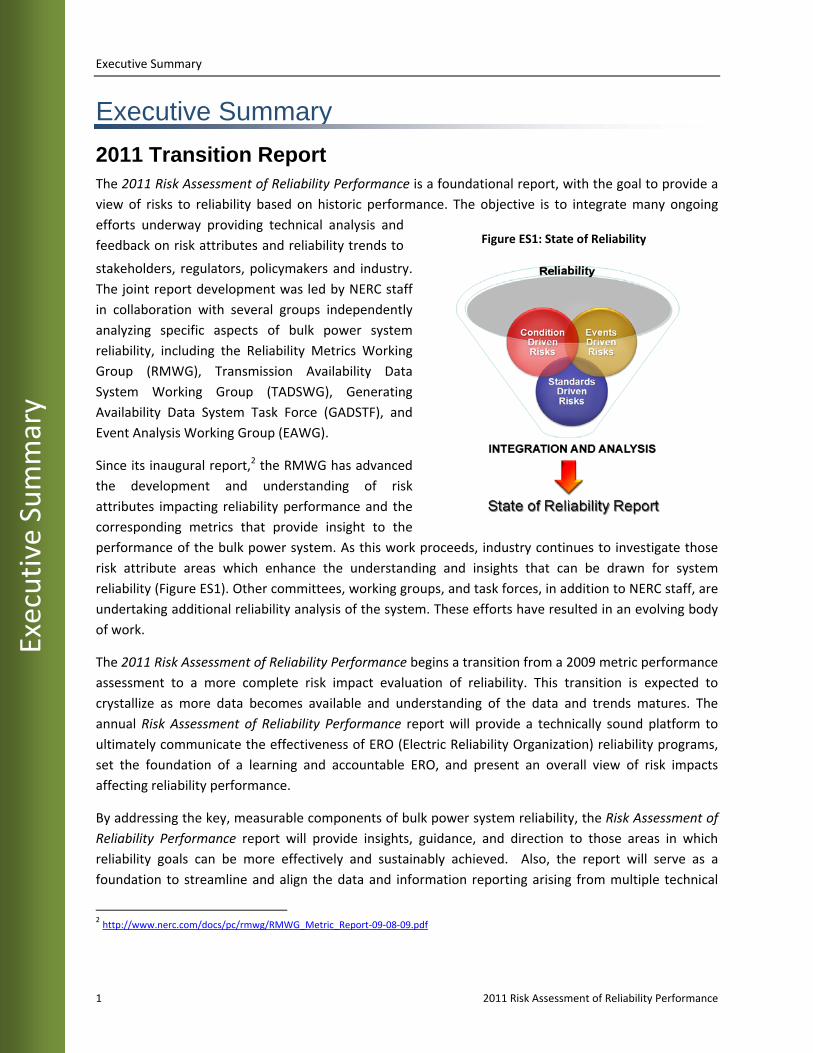
performance of the bulk power system. As this work proceeds, industry continues to investigate those
risk attribute areas which enhance the understanding and insights that can be drawn for system
reliability (Figure ES1). Other committees, working groups, and task forces, in addition to NERC staff, are
undertaking additional reliability analysis of the system. These efforts have resulted in an evolving body
of work.
The 2011 Risk Assessment of Reliability Performance begins a transition from a 2009 metric performance
assessment to a more complete risk impact evaluation of reliability. This transition is expected to
crystallize as more data becomes available and understanding of the data and trends matures. The
annual Risk Assessment of Reliability Performance report will provide a technically sound platform to
ultimately communicate the effectiveness of ERO (Electric Reliability Organization) reliability programs,
set the foundation of a learning and accountable ERO, and present an overall view of risk impacts
affecting reliability performance.
By addressing the key, measurable components of bulk power system reliability, the Risk Assessment of
Reliability Performance report will provide insights, guidance, and direction to those areas in which
reliability goals can be more effectively and sustainably achieved. Also, the report will serve as a
foundation to streamline and align the data and information reporting arising from multiple technical
2 http://www.nerc.com/docs/pc/rmwg/RMWG_Metric_Report‐09‐08‐09.pdf
Figure ES1: State of Reliability
Executive Summary
2011 Risk Assessment of Reliability Performance 2
Executive Su
mmary
groups, thereby providing efficient data and information transparency. The key findings and
recommendations are envisioned as input to NERC’s Reliability Standards and project prioritization,
compliance process improvement, event analysis, reliability assessment, and critical infrastructure
protection.
The ultimate goal of the State of Reliability report is twofold. First, the report will illuminate the
historical, overall bulk power system reliability picture. By using robust data, the reliability of the system
can be explained and documented. Currently, there are no measures, datasets, or reports that explicitly
and completely state the historical performance of the system.
Second, the report will help identify risk clusters, prioritize, and create actionable results for reliability
improvement. Once a risk universe has been found, it can be parsed into component clusters.3 These
significant risk clusters can be selected as priority projects to develop coordinated and multifunctional
solutions to relevant problems. The State of Reliability report will provide an industry reference for
historical bulk power system reliability, analytical insights with a view to action, and will enable the
discovery and prioritization of specific, actionable risk control steps.
Key Findings and Recommendations
Reliability Metrics Performance
The Operating and Planning Committees approved eighteen metrics that address the characteristics of
an adequate level of reliability (ALR), the following seven metrics are improving based on metric trends,
indicating the bulk power system is performing better during the time frame analyzed:
ALR1‐3: Planning Reserve Margin
ALR1‐4: BPS Transmission Related Events Resulting in Loss of Load
ALR2‐5: Disturbance Control Events Greater than Most Severe Single Contingency
ALR6‐2: Energy Emergency Alert 3 (EEA3)
ALR6‐3: Energy Emergency Alert 2 (EEA2)
ALR6‐11: Automatic Transmission Outages Initiated by Failed Protection System Equipment
ALR6‐13: Automatic Transmission Outages Initiated by Failed AC Substation Equipment
The remaining metrics do not have sufficient data to derive useful conclusions, or currently lack data.
With a more thorough data matrix for these metrics, more conclusions about reliability will be
ascertained. All metrics will be evaluated on a regular basis to determine each metric’s contribution to
quantitative reliability measurement.
3 Malcolm K. Sparrow, The Regulatory Craft, The Brookings Institution, 2000.

Executive Summary
3 2011 Risk Assessment of Reliability Performance
Executive Summary
Transmission Availability Performance
On a NERC‐wide average basis, the automatic transmission outage rate has improved from 2008 to
2010. Considering both automatic and non‐automatic outages, 2010 records indicate transmission
element availability percentage exceeds 95%.
Unexpectedly, almost one‐third of all sustained, automatic outages are dependent or common mode
events. Though a number of protection systems are intended to trip three or more circuits, many
events go beyond their design basis. In addition, a number of multiple outage events were initiated by
protection system misoperations. These events, which go beyond their design expectations and
operating procedures, represent a tangible threat to reliability. A deeper review of the root causes of
dependent and common mode events, which include three or more automatic outages, is a high priority
for NERC and the industry. More focus into this problem would improve the design basis assumed for
reliable operation of the system. A joint team should be formed to analyze these outages.
Generating Availability Performance
On the average, units appear to require maintenance with increasing regularity to meet unit availability
goals. In the last three years, the Equivalent Forced Outage Rate – Demand (EFORd) increased,
indicating a higher risk that a unit may not be available to meet generating requirements due to forced
outages or de‐ratings. From 2009 to 2010, the average maintenance hours increased by 24 hours per
unit. The three leading root causes for multiple unit forced trips are transmission outages, lack of fuel,
and weather. Detailed analysis is needed to identify the root causes of increasing forced outage rate.
Disturbance Events
One of most important bulk power system performance measures is the number of significant
disturbance events and their impact on system reliability. The trends have been captured in the severity
risk curve analysis featured in the reliability metrics assessment.
Since the event analysis field test commenced in October 2010, a total of 42 events within five
categories were reported through the end of 2010. Equipment failure is the number one cause
identified from the event analyses completed from 2010. This suggests more data and analysis into
equipment failure may prove fruitful. However, with such a small dataset, no conclusions can be drawn.
Report Organization
Following the introductory chapter, the second chapter details results for 2010 RMWG approved
performance metrics and lays out methods for integrating the variety of risks into an integrated risk
index. This chapter also addresses concepts for measuring bulk power system events. The third chapter
outlines transmission system performance results that the TADSWG have endorsed using the three‐year
history of TADS data. Reviewed by the GADSTF, the fourth chapter provides an overview of generating
availability trends for 72 percent of generators in North America. The fifth chapter provides a brief
summary of reported disturbances based on event categories described in the EAWG’s enhanced event
analysis field test process document.
Introduction
2011 Risk Assessment of Reliability Performance 4
Intro
ductio
n
Figure 1: State of Reliability Concepts
Introduction
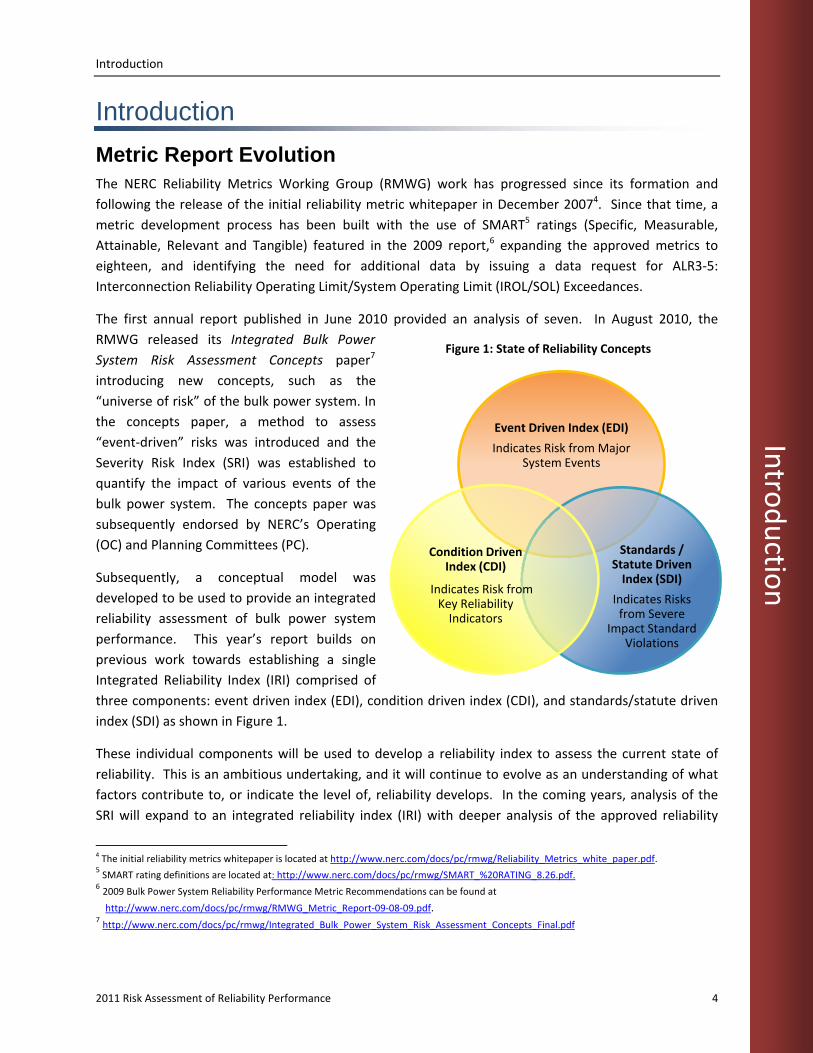
Metric Report Evolution The NERC Reliability Metrics Working Group (RMWG) work has progressed since its formation and
following the release of the initial reliability metric whitepaper in December 20074. Since that time, a
metric development process has been built with the use of SMART5 ratings (Specific, Measurable,
Attainable, Relevant and Tangible) featured in the 2009 report,6 expanding the approved metrics to
eighteen, and identifying the need for additional data by issuing a data request for ALR3‐5:
Interconnection Reliability Operating Limit/System Operating Limit (IROL/SOL) Exceedances.
The first annual report published in June 2010 provided an analysis of seven. In August 2010, the
RMWG released its Integrated Bulk Power
System Risk Assessment Concepts paper7
introducing new concepts, such as the
“universe of risk” of the bulk power system. In
the concepts paper, a method to assess
“event‐driven” risks was introduced and the
Severity Risk Index (SRI) was established to
quantify the impact of various events of the
bulk power system. The concepts paper was
subsequently endorsed by NERC’s Operating
(OC) and Planning Committees (PC).
Subsequently, a conceptual model was
developed to be used to provide an integrated
reliability assessment of bulk power system
performance. This year’s report builds on
previous work towards establishing a single
Integrated Reliability Index (IRI) comprised of
three components: event driven index (EDI), condition driven index (CDI), and standards/statute driven
index (SDI) as shown in Figure 1.
These individual components will be used to develop a reliability index to assess the current state of
reliability. This is an ambitious undertaking, and it will continue to evolve as an understanding of what
factors contribute to, or indicate the level of, reliability develops. In the coming years, analysis of the
SRI will expand to an integrated reliability index (IRI) with deeper analysis of the approved reliability
4 The initial reliability metrics whitepaper is located at http://www.nerc.com/docs/pc/rmwg/Reliability_Metrics_white_paper.pdf. 5 SMART rating definitions are located at: http://www.nerc.com/docs/pc/rmwg/SMART_%20RATING_8.26.pdf.
6 2009 Bulk Power System Reliability Performance Metric Recommendations can be found at
http://www.nerc.com/docs/pc/rmwg/RMWG_Metric_Report‐09‐08‐09.pdf. 7 http://www.nerc.com/docs/pc/rmwg/Integrated_Bulk_Power_System_Risk_Assessment_Concepts_Final.pdf
Event Driven Index (EDI)
Indicates Risk from Major System Events
Standards / Statute Driven Index (SDI)
Indicates Risks from Severe
Impact Standard Violations
Condition Driven Index (CDI)
Indicates Risk from Key Reliability Indicators

Introduction
5 2011 Risk Assessment of Reliability Performance
Introduction
Figure 2: Data Source Integration and Analysis
metrics, and establish the cornerstones for developing an IRI. Chapter two of this report elaborates on
recommendations for next steps to better refine and weigh the components of the IRI, as well as its use
to establish a “State of Reliability” for the bulk power system in North America.
For this work to be effective and useful to stakeholders, it must use existing data sources, align with
other industry analyses, and integrate with other initiatives as shown in Figure 2. NERC’s data resources
are introduced in this report: Transmission Availability Data System (TADS), Generating Availability Data
System (GADS), Event Analysis database, and, in the future, Demand Response Availability Data System
(DADS).8
An open development process is
used, incorporating continuous
improvement through leveraging
industry expertise and technical
judgment. As new data becomes
available, more concrete conclusions
from the reliability metrics will be
drawn and recommendations for
reliability standards and compliance
process improvement will be
developed.
This evolution will take time, and the
first assessment of ongoing reliability using the three components of an integrated reliability assessment
is expected in the 2012 Annual Report. The goal is not only to measure performance, but to highlight
areas for improvement as well as reinforcing and measuring industry success. As this view of reliability is
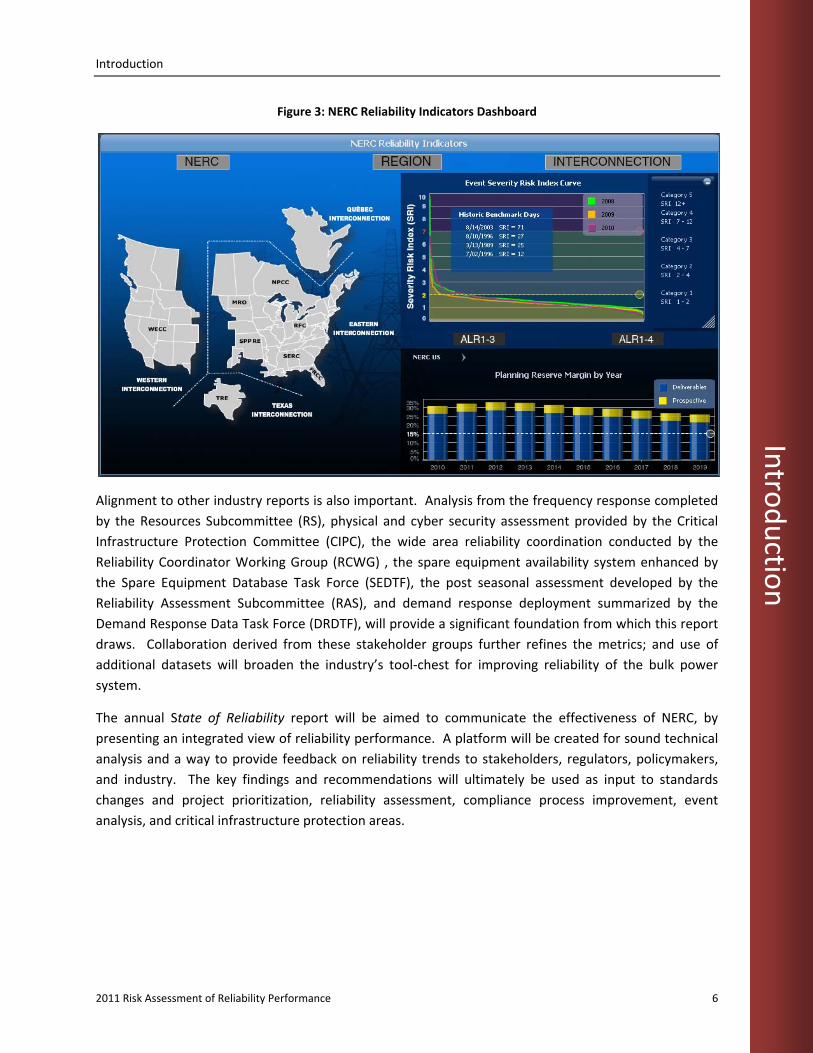
developed, the quarterly performance metrics will be updated as illustrated in Figure 3 on a Reliability
Indicators dashboard at NERC’s website.9 Industry will be kept informed of the evolution through yearly
webinars, providing quarterly data updates, and publishing its annual report.
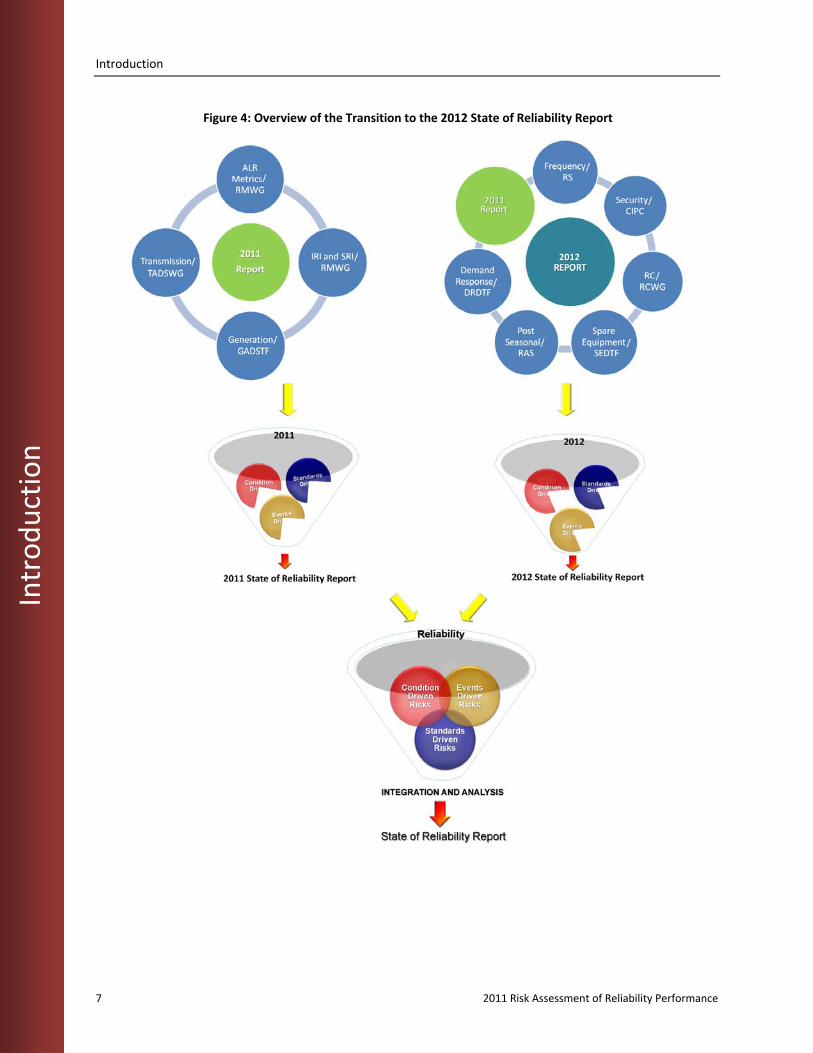
Roadmap for the Future As shown in Figure 4, the 2011 Reliability Performance Analysis report begins a transition from a metric
performance assessment to a “State of Reliability” report by collaborating with other groups to form a
unified approach to historical reliability performance analysis. This process will require engagement
with a number of NERC industry subject matter experts to develop a broad picture of the bulk power
system’s historic reliability.
8 DADS will begin mandatory data collection from April 2011 through October 2011, with data due on December 15, 2011. 9 Reliability Indicators’ dashboard is available at: http://www.nerc.com/page.php?cid=4|331.
Introduction
2011 Risk Assessment of Reliability Performance 6
Intro
ductio
n
Figure 3: NERC Reliability Indicators Dashboard
Alignment to other industry reports is also important. Analysis from the frequency response completed
by the Resources Subcommittee (RS), physical and cyber security assessment provided by the Critical
Infrastructure Protection Committee (CIPC), the wide area reliability coordination conducted by the
Reliability Coordinator Working Group (RCWG) , the spare equipment availability system enhanced by
the Spare Equipment Database Task Force (SEDTF), the post seasonal assessment developed by the
Reliability Assessment Subcommittee (RAS), and demand response deployment summarized by the
Demand Response Data Task Force (DRDTF), will provide a significant foundation from which this report
draws. Collaboration derived from these stakeholder groups further refines the metrics; and use of
additional datasets will broaden the industry’s tool‐chest for improving reliability of the bulk power
system.
The annual State of Reliability report will be aimed to communicate the effectiveness of NERC, by
presenting an integrated view of reliability performance. A platform will be created for sound technical
analysis and a way to provide feedback on reliability trends to stakeholders, regulators, policymakers,
and industry. The key findings and recommendations will ultimately be used as input to standards
changes and project prioritization, reliability assessment, compliance process improvement, event
analysis, and critical infrastructure protection areas.
Introduction
7 2011 Risk Assessment of Reliability Performance
Introduction
Figure 4: Overview of the Transition to the 2012 State of Reliability Report
Reliability Metrics Performance
2011 Risk Assessment of Reliability Performance 8
Reliab
ility Metrics P
erform
ance
Reliability Metrics Performance
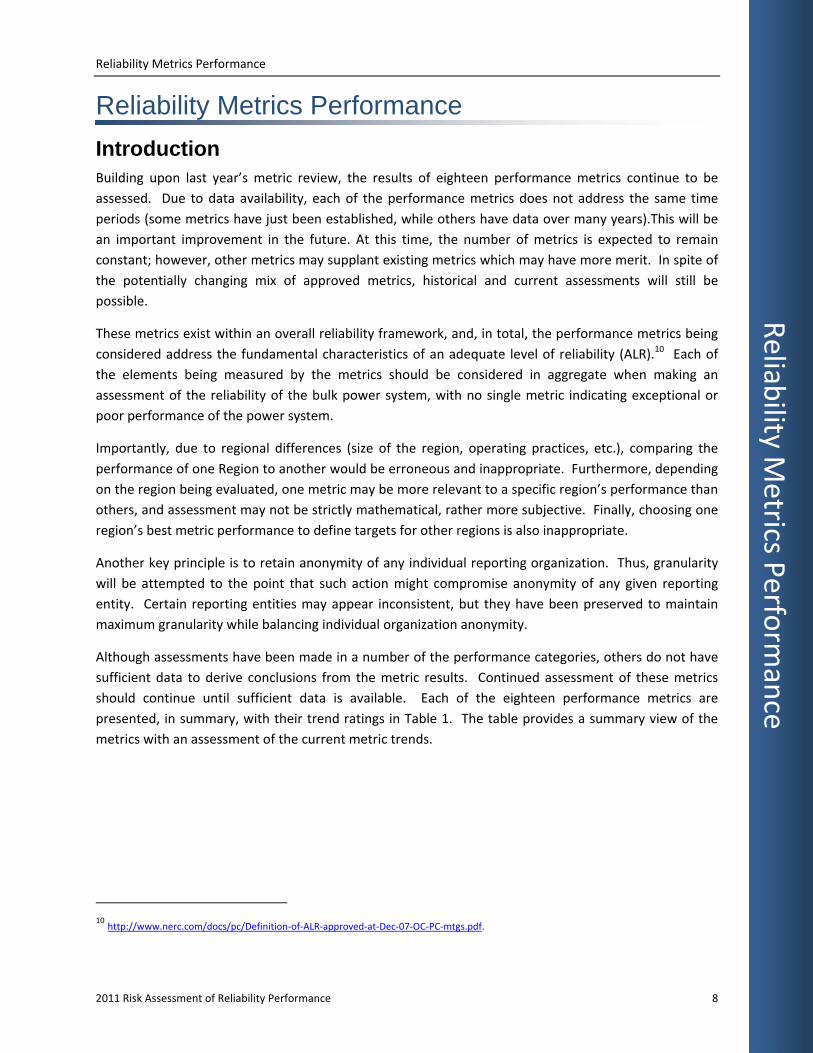
Introduction Building upon last year’s metric review, the results of eighteen performance metrics continue to be
assessed. Due to data availability, each of the performance metrics does not address the same time
periods (some metrics have just been established, while others have data over many years).This will be
an important improvement in the future. At this time, the number of metrics is expected to remain
constant; however, other metrics may supplant existing metrics which may have more merit. In spite of
the potentially changing mix of approved metrics, historical and current assessments will still be
possible.
These metrics exist within an overall reliability framework, and, in total, the performance metrics being
considered address the fundamental characteristics of an adequate level of reliability (ALR).10 Each of
the elements being measured by the metrics should be considered in aggregate when making an
assessment of the reliability of the bulk power system, with no single metric indicating exceptional or
poor performance of the power system.
Importantly, due to regional differences (size of the region, operating practices, etc.), comparing the
performance of one Region to another would be erroneous and inappropriate. Furthermore, depending
on the region being evaluated, one metric may be more relevant to a specific region’s performance than
others, and assessment may not be strictly mathematical, rather more subjective. Finally, choosing one
region’s best metric performance to define targets for other regions is also inappropriate.
Another key principle is to retain anonymity of any individual reporting organization. Thus, granularity
will be attempted to the point that such action might compromise anonymity of any given reporting
entity. Certain reporting entities may appear inconsistent, but they have been preserved to maintain
maximum granularity while balancing individual organization anonymity.
Although assessments have been made in a number of the performance categories, others do not have
sufficient data to derive conclusions from the metric results. Continued assessment of these metrics
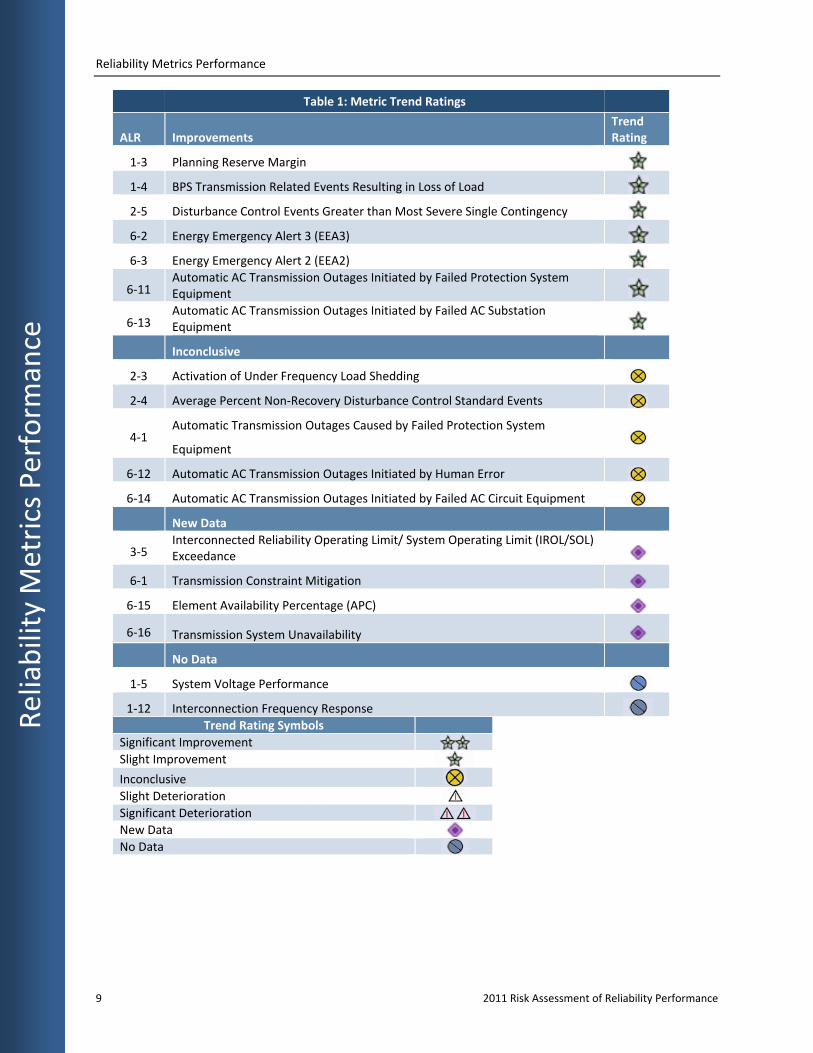
should continue until sufficient data is available. Each of the eighteen performance metrics are
presented, in summary, with their trend ratings in Table 1. The table provides a summary view of the
metrics with an assessment of the current metric trends.
10 http://www.nerc.com/docs/pc/Definition‐of‐ALR‐approved‐at‐Dec‐07‐OC‐PC‐mtgs.pdf.
Reliability Metrics Performance
9 2011 Risk Assessment of Reliability Performance
Reliability M
etrics Perform
ance
Table 1: Metric Trend Ratings
ALR Improvements Trend Rating
1‐3 Planning Reserve Margin
1‐4 BPS Transmission Related Events Resulting in Loss of Load
2‐5 Disturbance Control Events Greater than Most Severe Single Contingency
6‐2 Energy Emergency Alert 3 (EEA3)
6‐3 Energy Emergency Alert 2 (EEA2)
6‐11 Automatic AC Transmission Outages Initiated by Failed Protection SystemEquipment
6‐13 Automatic AC Transmission Outages Initiated by Failed AC Substation Equipment
Inconclusive
2‐3 Activation of Under Frequency Load Shedding
2‐4 Average Percent Non‐Recovery Disturbance Control Standard Events
4‐1 Automatic Transmission Outages Caused by Failed Protection System
Equipment
6‐12 Automatic AC Transmission Outages Initiated by Human Error
6‐14 Automatic AC Transmission Outages Initiated by Failed AC Circuit Equipment
New Data
3‐5 Interconnected Reliability Operating Limit/ System Operating Limit (IROL/SOL) Exceedance
6‐1 Transmission Constraint Mitigation
6‐15 Element Availability Percentage (APC)
6‐16 Transmission System Unavailability
No Data
1‐5 System Voltage Performance
1‐12 Interconnection Frequency Response
Trend Rating Symbols
Significant Improvement
Slight Improvement
Inconclusive
Slight Deterioration
Significant Deterioration
New Data
No Data
Reliability Metrics Performance
2011 Risk Assessment of Reliability Performance 10
Reliab
ility Metrics P
erform
ance
2010 Performance Metrics Results and Trends
ALR1‐3 Planning Reserve Margin
Background
The Planning Reserve Margin11 is a measure of the relationship between the amount of resource
capacity forecast and the expected demand in the planning horizon.12 Coupled with probabilistic
analysis, calculated Planning Reserve Margins is an industry standard used by system planners for
decades as an indication of system resource adequacy.
Planning Reserve Margin is the difference between forecast capacity and projected peak demand (50/50
forecast13), normalized by projected peak demand and shown as a percentage. Based on experience, for
portions of the bulk power system that are not energy‐constrained, Planning Reserve Margin indicates
the amount of capacity available to maintain reliable operation, while meeting unforeseen increases in
demand (e.g., extreme weather) and unexpected unavailability of existing capacity (e.g., long‐term
generation outages). Further, from a planning perspective, Planning Reserve Margin trends identify
whether capacity additions are projected to keep pace with demand growth.
Assessment
Planning Reserve Margins, considering anticipated capacity resources and adjusted potential capacity
resources,14 decrease in the latter years of the 10‐year forecasts in each of the four interconnections for
both the 200915 and 2010 resource projections. Typically, the early years provide more certainty since
new generation is either in‐service or under construction with firm commitments. In the later years,
there is less certainty about the resources that will be needed to meet peak demand. Declining Planning
Reserve Margins are inherent in a conventional forecast (assuming load growth) and do not necessarily
indicate a trend of a degrading resource adequacy. Rather, they are an indication of the potential need
for additional resources. In addition, key observations can be made about the Planning Reserve Margin
forecast, such as short‐term assessment comparison to target margins, rate of margin change through
the assessment period, identification of margins that are approaching or below a target requirement,
and comparisons from year‐to‐year forecasts.
While resource planners are able to forecast the need for resources, the type of resource that will
actually be built or acquired to fill the need is less certain. For example, in the northeast U.S. markets,
with a three to five year forward capacity market, firm commitments are not made in the long‐term.
However, resource planners do recognize the need for resources in their long‐term planning and
11 Detailed calculations of Planning Reserve Margin are available at: http://www.nerc.com/page.php?cid=4|331|333.
12 The Planning Reserve Margin indicated here is not the same as an operating reserve margin that system operators use for near‐term operations decisions.
13 These demand forecasts are based on “50/50” or median weather (a 50 percent chance of the weather being warmer and a 50 percent chance of the weather being cooler).
14 See Terms Used in this Report of the 2010 Long‐Term Reliability Assessment, http://www.nerc.com/files/2010_LTRA_v2‐.pdf.
15 2009 Long‐Term Reliability Assessment, http://www.nerc.com/files/2009_LTRA.pdf.
Reliability Metrics Performance
11 2011 Risk Assessment of Reliability Performance
Reliability M
etrics Perform
ance
account for these resources through generator queues. These queues are then adjusted to reflect an
adjusted forecast of resources—pro‐rated by approximately 20 percent, depending on the assessment
area.
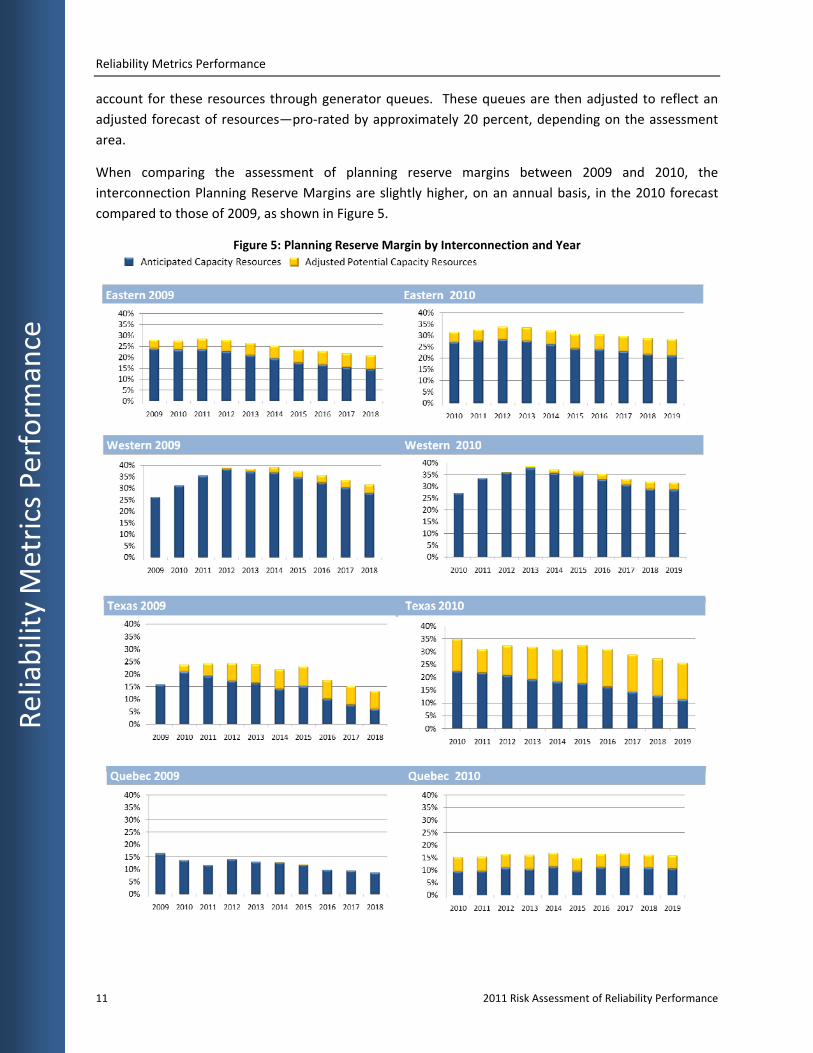
When comparing the assessment of planning reserve margins between 2009 and 2010, the
interconnection Planning Reserve Margins are slightly higher, on an annual basis, in the 2010 forecast
compared to those of 2009, as shown in Figure 5.
Figure 5: Planning Reserve Margin by Interconnection and Year
Reliability Metrics Performance
2011 Risk Assessment of Reliability Performance 12
Reliab
ility Metrics P
erform
ance
This conclusion results from slightly higher capacity forecasts and slightly lower demand forecasts.
Importantly, the pace of any economic recovery will affect future comparisons.16 This metric can be
used by NERC to assess the individual interconnections in the ten‐year long‐term reliability assessments.
If a noticeable change occurs, further investigation is necessary to determine the causes and likely
effects on reliability, and the potential need for additional resources.
Special Considerations
The Planning Reserve Margin is a capacity‐based metric. Therefore, it does not provide an accurate
assessment of performance in energy‐limited systems (e.g., hydro capacity with limited water resources
or systems with significant variable generation penetration). In addition, the Planning Reserve Margin
does not provide a measure of potential transmission constraints internal to their respective assessment
areas. Planning Reserve Margin data, shown in Figure 5, is used for NERC’s seasonal and long‐term
reliability assessments as the primary metric to determine the resource adequacy of assessment areas.
The North American bulk power system is divided into four distinct interconnections. These
interconnections are loosely connected with limited ability to share capacity or energy across the
interconnection. To reflect this limitation, the Planning Reserve Margins are calculated in this report
based on interconnection values rather than by national boundaries, as is the practice of the Reliability
Assessment Subcommittee (RAS).
ALR1‐4 BPS Transmission Related Events Resulting in Loss of Load
Background
This metric measures bulk power system transmission‐related events resulting in the loss of load,
excluding weather‐related outages. Planners and operators can use this metric to validate their design
and operating criteria by identifying the number of instances when loss of load occurs.
For the purposes of this metric, an “event” is an unplanned transmission disturbance that produces an
abnormal system condition due to equipment failures or system operational actions, and results in the
loss of firm system demand for more than 15 minutes. The reporting criteria for such events are
outlined below:17
16 Potential Reliability Impacts of Swift Demand Growth after a Long‐Term Recession,
http://www.nerc.com/files/NERC_Swift_Scenario_Aug_2010.pdf 17 Details of event definitions are available at: http://www.nerc.com/files/EOP‐004‐1.pdf.
Reliability Metrics Performance
13 2011 Risk Assessment of Reliability Performance
Reliability M
etrics Perform
ance
Entities with a previous year recorded peak demand of more than 3,000 MW are required to
report all such losses of firm demand totaling more than 300 MW.
All other entities are required to report all such losses of firm demands totaling more than 200
MW or 50 percent of the total customers being supplied immediately prior to the incident,
whichever is less.
Firm load shedding of 100 MW or more used to maintain the continuity of the bulk power
system reliability.
Assessment
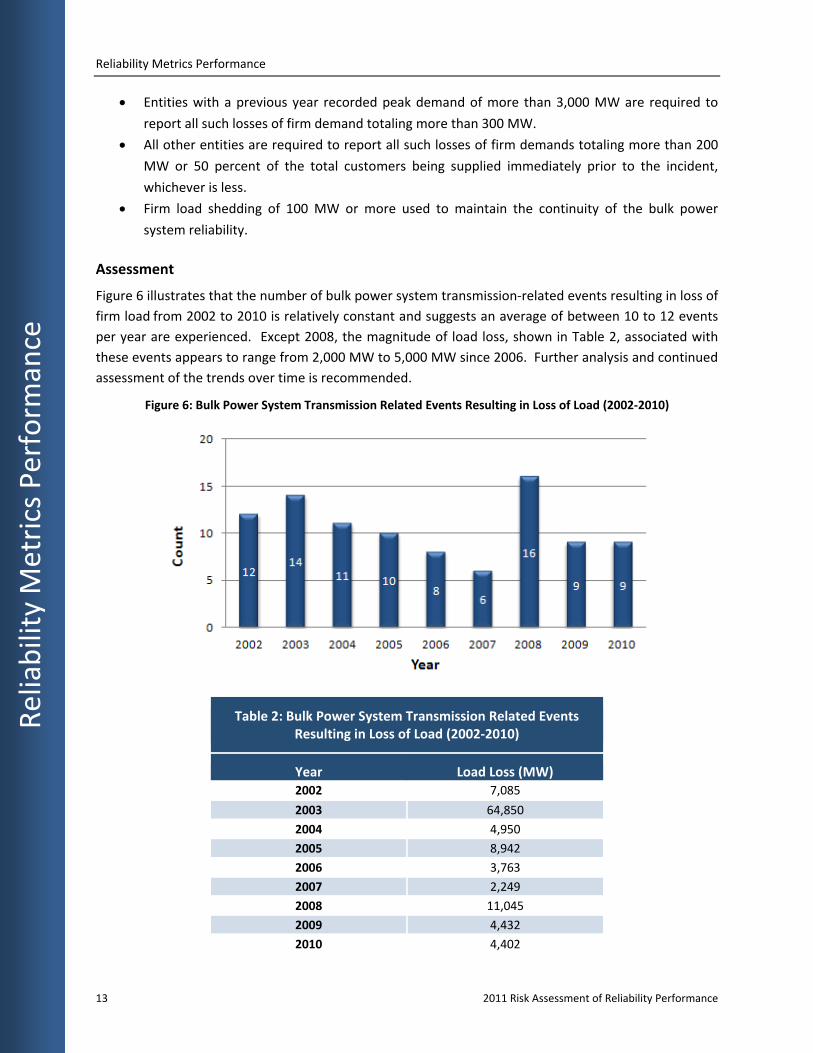
Figure 6 illustrates that the number of bulk power system transmission‐related events resulting in loss of
firm load from 2002 to 2010 is relatively constant and suggests an average of between 10 to 12 events
per year are experienced. Except 2008, the magnitude of load loss, shown in Table 2, associated with
these events appears to range from 2,000 MW to 5,000 MW since 2006. Further analysis and continued
assessment of the trends over time is recommended.
Figure 6: Bulk Power System Transmission Related Events Resulting in Loss of Load (2002‐2010)
Table 2: Bulk Power System Transmission Related Events Resulting in Loss of Load (2002‐2010)
Year Load Loss (MW) 2002 7,085
2003 64,850
2004 4,950
2005 8,942
2006 3,763
2007 2,249
2008 11,045
2009 4,432
2010 4,402
Reliability Metrics Performance
2011 Risk Assessment of Reliability Performance 14
Reliab
ility Metrics P
erform
ance
Special Considerations
The collected data does not indicate whether load loss, during an event, occurred as designed or not as
designed. Further investigation into the usefulness of separating load loss as designed and unexpected
load loss should be conducted.
ALR1‐12 Interconnection Frequency Response
Background
This metric is used to track and monitor Interconnection Frequency Response. Frequency Response is a
measure of an Interconnection’s ability to stabilize frequency immediately following the sudden loss of
generation or load. It is a critical component to the reliable operation of the bulk power system,
particularly during disturbances and restoration. The metric measures the average frequency response
for all events where frequency drops more than 35 mHz within a year.
Assessment
During the study period, there was no formal, established data collection process for ALR1‐12.
Therefore, no assessment was possible. Full use of data being gathered from the frequency response
project should be used to derive this metric.
ALR2‐3 Activation of Under Frequency Load Shedding
Background
The purpose of Under Frequency Load Shedding (UFLS) is to balance generation and load in an island
following an extreme event. The UFLS activation metric measures the number of times it is activated
and the total MW of load interrupted in each Regional Entity and NERC‐wide.
Assessment
Figure 7 and Table 3 illustrate a history of UFLS events from 2006 through 2010. Notably, single events
had a load shedding range from 15 MW to 2,273 MW. The activation of UFLS is the last automated
reliability measure associated with a decline in frequency in order to rebalance the system. Further
assessment of the MW loss for these activations is recommended.
Because of the large range of load lost in UFLS events, the need to establish a UFLS total load loss
threshold is under evaluation. The significance of a UFLS activation compared to the total load loss of
the activation will be assessed over time.

Reliability Metrics Performance
15 2011 Risk Assessment of Reliability Performance
Reliability M
etrics Perform
ance
Figure 7: ALR2‐3 Count of Activations by Year and Regional Entity (2006‐2010)
Special Considerations
The use of a single metric cannot capture all of the relevant information associated with UFLS events as
the events relate to each respective UFLS plan. Namely, use of UFLS as designed is a successful measure
of system performance. The ability to measure the reliability of the bulk power system is directly
associated with how it performs compared to what is planned.
Table 3: ALR2‐3 Under Frequency Load Shedding
MW Loss
2006 2007 2008 2009 2010
FRCC ‐ ‐ 2,273 ‐ ‐
MRO ‐ 486 ‐ ‐ ‐
NPCC 94 ‐ 63 20 25
RFC ‐ ‐ ‐ ‐ ‐
SPP ‐ ‐ 672 15 ‐
SERC ‐ ‐ ‐ ‐ ‐
TRE ‐ ‐ ‐ ‐ ‐
WECC ‐ ‐ ‐ ‐ ‐
Reliability Metrics Performance
2011 Risk Assessment of Reliability Performance 16
Reliab
ility Metrics P
erform
ance
ALR2‐4 Average Percent Non‐Recovery Disturbance Control Standards (DCS)
Background
This metric measures the Balancing Authority’s (BA) or Reserve Sharing Group’s (RSG) ability to balance
resources and demand with the timely deployment of contingency reserve, thereby returning the
interconnection frequency to within defined limits following a Reportable Disturbance.18 The relative
percentage provides an indication of performance measured at a BA or RSG.
Assessment
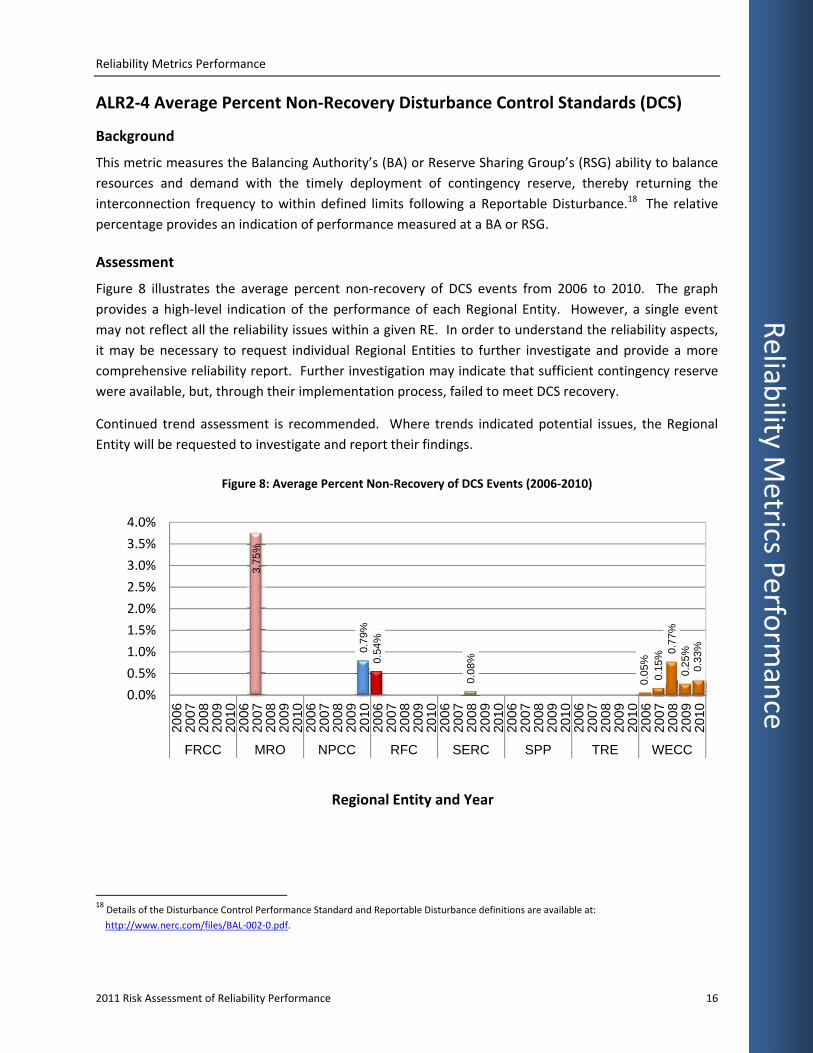
Figure 8 illustrates the average percent non‐recovery of DCS events from 2006 to 2010. The graph
provides a high‐level indication of the performance of each Regional Entity. However, a single event
may not reflect all the reliability issues within a given RE. In order to understand the reliability aspects,
it may be necessary to request individual Regional Entities to further investigate and provide a more
comprehensive reliability report. Further investigation may indicate that sufficient contingency reserve
were available, but, through their implementation process, failed to meet DCS recovery.
Continued trend assessment is recommended. Where trends indicated potential issues, the Regional
Entity will be requested to investigate and report their findings.
Figure 8: Average Percent Non‐Recovery of DCS Events (2006‐2010)
18 Details of the Disturbance Control Performance Standard and Reportable Disturbance definitions are available at:
http://www.nerc.com/files/BAL‐002‐0.pdf.
3.75
%
0.79
%0.
54%
0.08
%
0.05
%0.
15% 0.
77%
0.25
%0.
33%
0.0%
0.5%
1.0%
1.5%
2.0%
2.5%
3.0%
3.5%
4.0%
2006
2007
2008
2009
2010
2006
2007
2008
2009
2010
2006
2007
2008
2009
2010
2006
2007
2008
2009
2010
2006
2007
2008
2009
2010
2006
2007
2008
2009
2010
2006
2007
2008
2009
2010
2006
2007
2008
2009
2010
FRCC MRO NPCC RFC SERC SPP TRE WECC
Regional Entity and Year
Reliability Metrics Performance
17 2011 Risk Assessment of Reliability Performance
Reliability M
etrics Perform
ance
Special Considerations
This metric aggregates the number of events based on reporting from individual Balancing Authorities or
Reserve Sharing Groups. It does not capture the severity of the DCS events. Most Regional Entities use
80 percent of the Most Severe Single Contingency to establish the minimum threshold for reportable
disturbance, while others use 35 percent.19
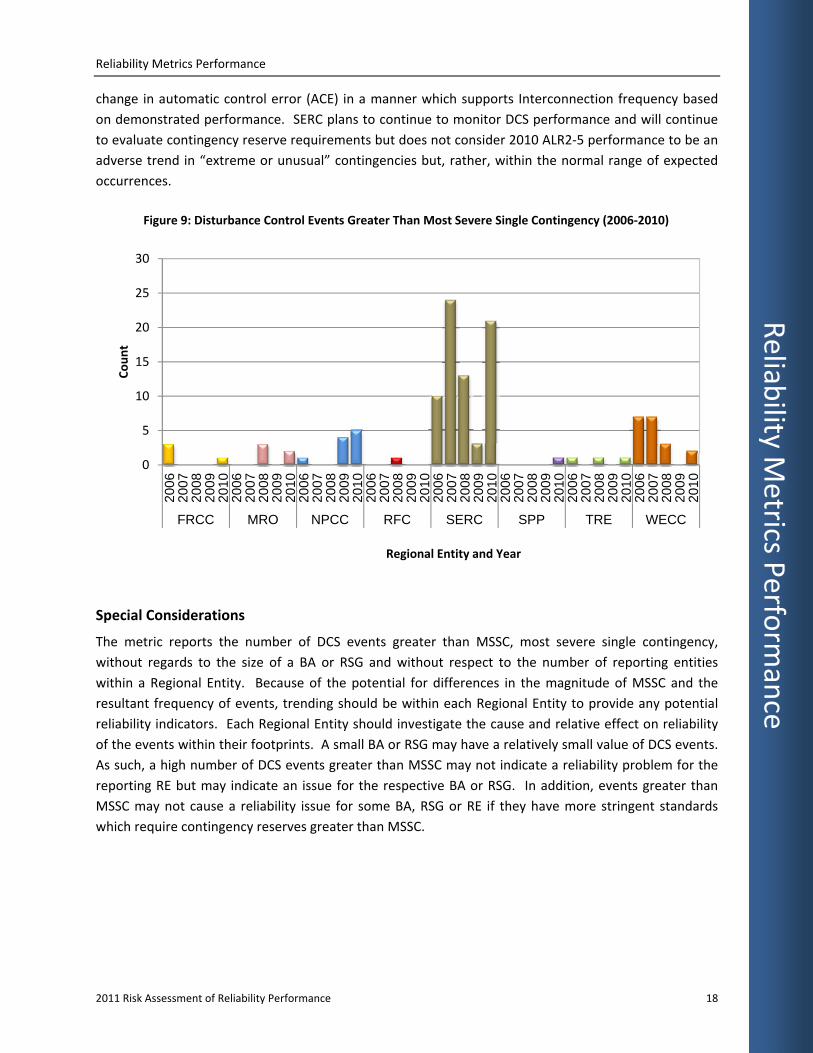
ALR2‐5 Disturbance Control Events Greater Than Most Severe Single Contingency
Background
This metric represents the number of disturbance events that exceed the Most Severe Single
Contingency (MSSC), and is specific to each BA. Each Regional Entity reports disturbances greater than
the MSSC on behalf of the BA or Reserve Sharing Group (RSG). The result validates current contingency
reserve requirements. The MSSC is determined based on the specific configuration of each BA or RSG
and can vary in significance and impact on the BPS.
Assessment
Figure 9 represents the number of DCS events within each RE that are greater than the MSSC from 2006
to 2010. This metric and resulting trend can provide insight regarding the risk of events greater than the
MSSC and the potential for loss of load.
In 2010, SERC had 16 BAL‐002 reporting entities; eight Balancing Areas elected to maintain Contingency
Reserve levels independent of any reserve sharing group. These 16 entities experienced 79 reportable
DCS events—21 of which were categorized as greater than their most severe single contingency. Every
DCS event categorized as greater than the most severe single contingency occurred within a Balancing
Area maintaining independent Contingency Reserve levels. Significantly, all 79 Regional Entities
reported compliance with the Disturbance Recovery Criterion, including for those Disturbances that
were considered greater than their most severe single contingency. This supports a conclusion that
regardless of the size of the BA or participation in a Reserve Sharing Group, SERC’s BAL‐002 reporting
entities have demonstrated the ability in 2010 to use Contingency Reserve to balance resources and
demand and return Interconnection frequency within defined limits following Reportable Disturbances.
If the SERC Balancing Areas without large generating units and who do not participate in a Reserve
Sharing Group change the determination of their most severe single contingencies to effect an increase
in the DCS reporting threshold (and concurrently the threshold for determining those disturbances
which are greater than the most severe single contingency), there will be a reduction in both the gross
count of DCS events in SERC and in the subset considered under ALR2‐5. Masking the discrete events
which cause Balancing Area to respond may not reduce “risk” to the system. However, it is desirable to
maintain a reporting threshold which encourages the Balancing Authority to respond to any unexplained
19http://www.wecc.biz/Standards/Development/Lists/Request%20Form/DispForm.aspx?ID=69&Source=/Standards/Development/Pages/WEC
CStandardsArchive.aspx.
Reliability Metrics Performance
2011 Risk Assessment of Reliability Performance 18
Reliab
ility Metrics P
erform
ance
change in automatic control error (ACE) in a manner which supports Interconnection frequency based
on demonstrated performance. SERC plans to continue to monitor DCS performance and will continue
to evaluate contingency reserve requirements but does not consider 2010 ALR2‐5 performance to be an
adverse trend in “extreme or unusual” contingencies but, rather, within the normal range of expected
occurrences.
Special Considerations
The metric reports the number of DCS events greater than MSSC, most severe single contingency,
without regards to the size of a BA or RSG and without respect to the number of reporting entities
within a Regional Entity. Because of the potential for differences in the magnitude of MSSC and the
resultant frequency of events, trending should be within each Regional Entity to provide any potential
reliability indicators. Each Regional Entity should investigate the cause and relative effect on reliability
of the events within their footprints. A small BA or RSG may have a relatively small value of DCS events.
As such, a high number of DCS events greater than MSSC may not indicate a reliability problem for the
reporting RE but may indicate an issue for the respective BA or RSG. In addition, events greater than
MSSC may not cause a reliability issue for some BA, RSG or RE if they have more stringent standards
which require contingency reserves greater than MSSC.
0
5
10
15
20
25
30
2006
2007
2008
2009
2010
2006
2007
2008
2009
2010
2006
2007
2008
2009
2010
2006
2007
2008
2009
2010
2006
2007
2008
2009
2010
2006
2007
2008
2009
2010
2006
2007
2008
2009
2010
2006
2007
2008
2009
2010
FRCC MRO NPCC RFC SERC SPP TRE WECC
Count
Regional Entity and Year
Figure 9: Disturbance Control Events Greater Than Most Severe Single Contingency (2006‐2010)

Reliability Metrics Performance
19 2011 Risk Assessment of Reliability Performance
Reliability M
etrics Perform
ance
ALR 1‐5 System Voltage Performance
Background
The purpose of this metric is to measure the transmission system voltage performance (either absolute
or per unit of a nominal value) over time. This should provide an indication of the reactive capability
available to the transmission system. The metric is intended to record the amount of time that system
voltage is outside a predetermined band around nominal.
Special Considerations
With a pilot program specified in early 2011, NERC’s Operating and Planning Committees approved a
voluntary data request letter for respective Transmission Owners (TOs) to submit relevant data on key
buses. The number of buses, the monitored voltage levels, and the acceptable voltage ranges may vary
by reporting entities. Based upon the usefulness of the data collected in the pilot program, additional
data needs will be reviewed in the future.
ALR3‐5 Interconnection Reliability Operating Limit/ System Operating Limit
(IROL/SOL) Exceedances
Background
This metric measures the number of times that a defined Interconnection Reliability Operating Limit
(IROL) or System Operating Limit (SOL) was exceeded and the duration of these events. Exceeding
IROL/SOLs could lead to outages if prompt operator control actions are not taken in a timely manner to
return the system to within normal operating limits. Also, exceeding the limits may not directly lead to
an outage, but it puts the system at risk if an outage were to occur during the time the system is outside
it limit.
This metric was approved by NERC’s Operating and Planning Committees in June 2010 and a data
request was subsequently issued in August 2010 to collect the data for this metric. Based on the results
of the pilot conducted in the third and fourth quarter of 2010, there is merit in continuing measurement
of this metric. The reporting of IROL/SOL exceedances became mandatory in 2011, and data collected in
Table 4 for 2010 has been provided voluntarily.
Table 4: ALR3‐5 IROL/SOL Exceedances
3Q2010 4Q2010 1Q2011 Number of Reporting RCs 9 10 15
≤ 10 minutes 123 226 124
10 minutes < Duration ≤ 20 minutes 10 36 12
20 minutes < Duration ≤ 30 minutes 3 7 3
> 30 minutes 0 1 0
Reliability Metrics Performance
2011 Risk Assessment of Reliability Performance 20
Reliab
ility Metrics P
erform
ance
ALR4‐1 Automatic Transmission Outages Caused by Protection System
Misoperations
Background
Originally titled Correct Protection System Operations, this metric has undergone a number of changes
since its initial development. To ensure that it best portrays how misoperations affect transmission
outages, it was necessary to establish a common understanding of misoperations and the data needed
to support the metric. NERC’s ERO‐Reliability Assessment and Performance Analysis (ERO‐RAPA) group
evaluated several options of transitioning from existing procedures for the collection of misoperations
data to a consistent approach which was introduced at the beginning of 2011. With the NERC System
Protection and Control Subcommittee’s (SPCS) technical guidance, NERC and the Regional Entities have
agreed upon a set of specifications for misoperations reporting including format, categories, event type
codes, and reporting period to have a final consistent reporting template.20 Only automatic
transmission outages 200 kV and above, including AC circuits and transformers, will be used in the
calculation of this metric.
Special Considerations
Data collection will begin in the third quarter of 2011 for the second quarter of misoperation events. As
revised, this metric cannot be calculated for this report at the current time. The revised title and metric
form can be viewed at the NERC website.21
ALR6‐11 – ALR6‐14
ALR6‐11 Automatic AC Transmission Outages Initiated by Failed Protection System Equipment
ALR6‐12 Automatic AC Transmission Outages Initiated by Human Error
ALR6‐13 Automatic AC Transmission Outages Initiated by Failed AC Substation Equipment
ALR6‐14 Automatic AC Circuit Outages Initiated by Failed AC Circuit Equipment
Background
These metrics evolved from the original ALR4‐1 metric for correct protection system operations and
now illustrate a normalized count (on a per element basis) of AC transmission element outages (i.e.,
TADS momentary and sustained automatic outages)22 that were initiated by: Failed Protection System
20 The current Protection System Misoperation template is available at: http://www.nerc.com/filez/rmwg.html.
21 The current metric ALR4‐1 form is available at: http://www.nerc.com/docs/pc/rmwg/ALR_4‐1Percent.pdf.
22 Definitions for TADS outages are located on page 4 of http://www.nerc.com/docs/pc/tadswg/Appendix%207%2020101202a%20clean.pdf.
Reliability Metrics Performance
21 2011 Risk Assessment of Reliability Performance
Reliability M
etrics Perform
ance
Equipment, (ALR6‐11); Human Error (ALR6‐12); Failed AC Substation Equipment (ALR6‐13); and Failed AC
Circuit Equipment (ALR6‐14). These metrics are all related to the non‐weather related initiating cause
codes for automatic outages of AC circuits and transformers operated 200 kV and above.
Assessment
Figure 10 through Figure 13 show the normalized automatic outages per circuit or per 100 circuit‐miles
and automatic outages per transformer for facilities operated at 200 kV and above. As shown in all eight
of the charts, there are some regional trends in the three years of outage data. However, some Regional
Entity’s values have increased from one year to the next, stayed the same, or decreased with no
discernable regional trends. For example, ALR6‐11 computes the automatic AC Circuit automatic
outages initiated by failed protection system equipment.
There are some trends to the ALR6‐11 to ALR6‐14 data, but many Regional Entities do not have enough
data for a valid trend analysis to be performed. NERC’s outage rate seems to be improving every year.
On a regional basis, metric ALR6‐11, along with ALR6‐12 through ALR6‐14 may not be statistically
significant, and will require confidence intervals23 are calculated. ALR metric outage frequency rates and
regional equipment inventories that are smaller than others are likely to require more than 36 months
of outage data. Some numerically larger frequency rates and areas with larger equipment inventories
(such as NERC) may not require more than 36 months of data to obtain a reasonably narrow confidence
interval.
While more data is still needed on a regional basis to determine if each Regional Entity’s bulk power
system is becoming more reliable year‐to‐year; there are areas of potential improvement which include
power system condition, protection performance, and human factors. The industry can benefit from
detailed analysis of these outage causes by identifying lessons learned and rolling average trends of
NERC‐wide performance. With a confidence interval of relatively narrow bandwidth, changes in
statistical data can be determined to be primarily due to random sampling error or if they are
significantly different due to performance.
23The detailed Confidence Interval computation is available at:
http://www.nerc.com/docs/pc/tadstf/TADS_Nov_2_2007APPENDIX_C_Confidence_Interval.pdf.
Reliability Metrics Performance
2011 Risk Assessment of Reliability Performance 22
Reliab
ility Metrics P
erform
ance
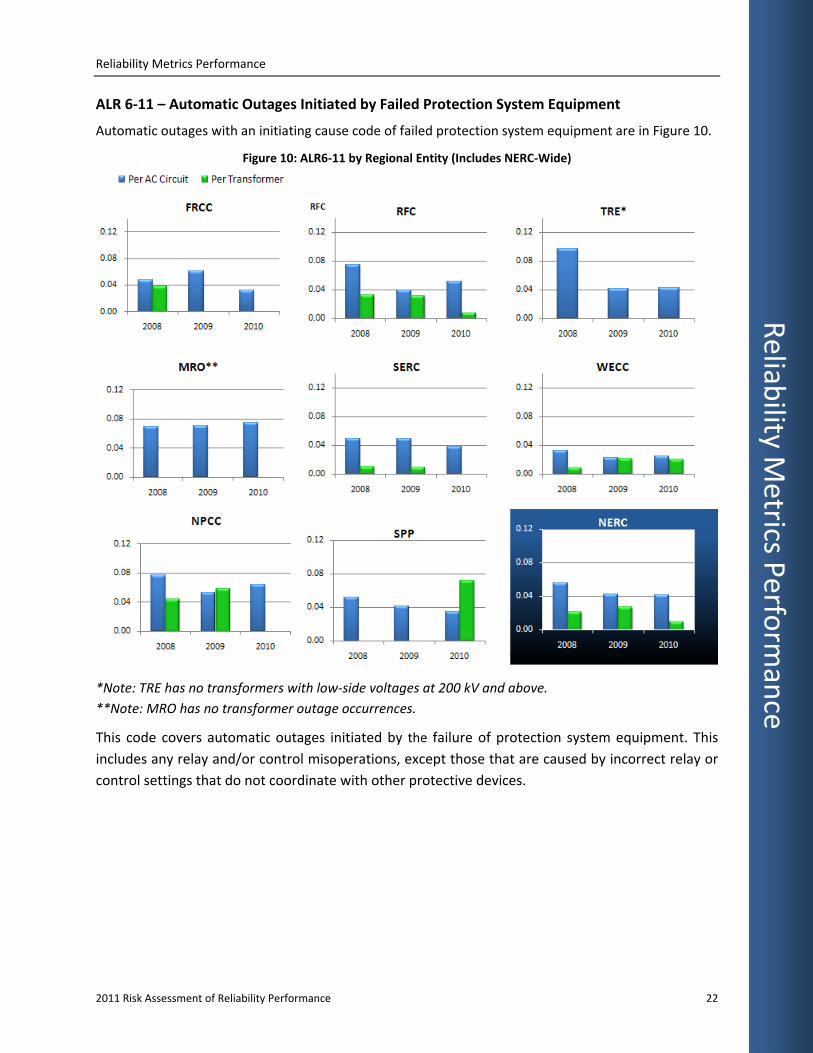
ALR 6‐11 – Automatic Outages Initiated by Failed Protection System Equipment
Automatic outages with an initiating cause code of failed protection system equipment are in Figure 10.
Figure 10: ALR6‐11 by Regional Entity (Includes NERC‐Wide)
*Note: TRE has no transformers with low‐side voltages at 200 kV and above.
**Note: MRO has no transformer outage occurrences.
This code covers automatic outages initiated by the failure of protection system equipment. This
includes any relay and/or control misoperations, except those that are caused by incorrect relay or
control settings that do not coordinate with other protective devices.
Reliability Metrics Performance
23 2011 Risk Assessment of Reliability Performance
Reliability M
etrics Perform
ance
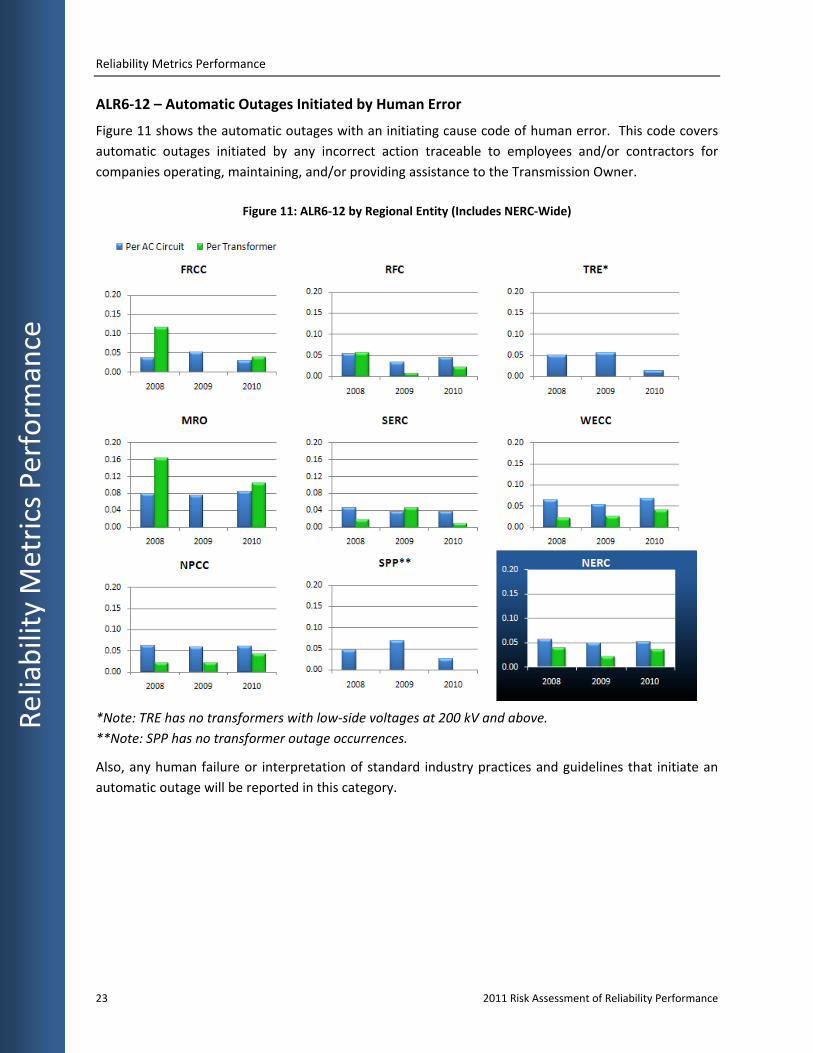
ALR6‐12 – Automatic Outages Initiated by Human Error
Figure 11 shows the automatic outages with an initiating cause code of human error. This code covers
automatic outages initiated by any incorrect action traceable to employees and/or contractors for
companies operating, maintaining, and/or providing assistance to the Transmission Owner.
*Note: TRE has no transformers with low‐side voltages at 200 kV and above.
**Note: SPP has no transformer outage occurrences.
Also, any human failure or interpretation of standard industry practices and guidelines that initiate an
automatic outage will be reported in this category.
Figure 11: ALR6‐12 by Regional Entity (Includes NERC‐Wide)

Reliability Metrics Performance
2011 Risk Assessment of Reliability Performance 24
Reliab
ility Metrics P
erform
ance
ALR6‐13 – Automatic Outages Initiated by Failed AC Substation Equipment
Figure 12 shows the automatic outages with an initiating cause code of failed AC substation equipment.
This code covers automatic outages initiated by the failure of AC Substation; i.e., equipment “inside the
substation fence” including transformers and circuit breakers but excluding protection system
equipment.24
*Note: TRE has no transformers with low‐side voltages at 200 kV and above.
24TADS Initiating Cause Code definitions are located at: http://www.nerc.com/docs/pc/tadswg/TADS_Definitions_Appendix_7_092909.pdf.
Figure 12: ALR6‐13 by Regional Entity (Includes NERC‐Wide)

Reliability Metrics Performance
25 2011 Risk Assessment of Reliability Performance
Reliability M
etrics Perform
ance
ALR6‐14 Automatic AC Transmission Outages Initiated by Failed AC Circuit Equipment
Figure 13 shows the automatic outages with an initiating cause code of failed AC circuit equipment.
These automatic outages are initiated by the failure of AC Circuit equipment, i.e., overhead or
underground equipment “outside the substation fence.” 25
*Note: TRE has no transformers with low‐side voltages at 200 kV and above.
**Note: MRO and SPP have no transformer outage occurrences.
25TADS Initiating Cause Code definitions are located at: http://www.nerc.com/docs/pc/tadswg/TADS_Definitions_Appendix_7_092909.pdf.
Figure 13: ALR6‐14 by Regional Entity (Includes NERC‐Wide)
Reliability Metrics Performance
2011 Risk Assessment of Reliability Performance 26
Reliab
ility Metrics P
erform
ance
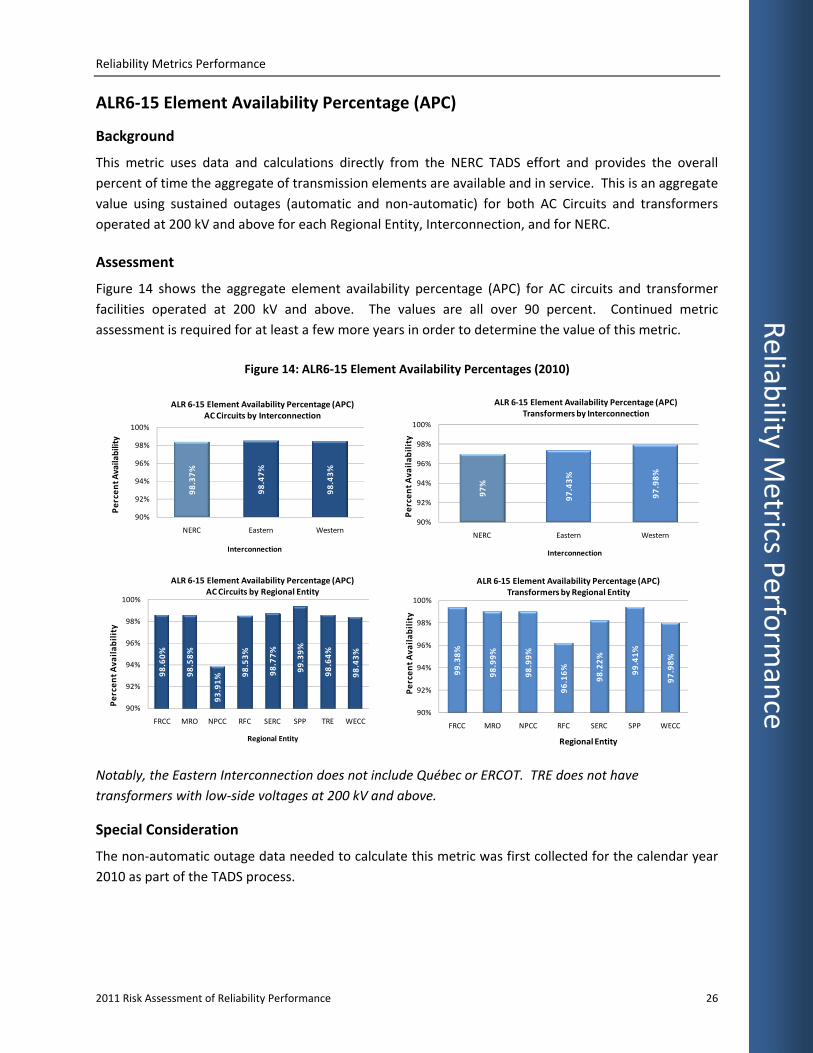
ALR6‐15 Element Availability Percentage (APC)
Background
This metric uses data and calculations directly from the NERC TADS effort and provides the overall
percent of time the aggregate of transmission elements are available and in service. This is an aggregate
value using sustained outages (automatic and non‐automatic) for both AC Circuits and transformers
operated at 200 kV and above for each Regional Entity, Interconnection, and for NERC.
Assessment
Figure 14 shows the aggregate element availability percentage (APC) for AC circuits and transformer
facilities operated at 200 kV and above. The values are all over 90 percent. Continued metric
assessment is required for at least a few more years in order to determine the value of this metric.
Figure 14: ALR6‐15 Element Availability Percentages (2010)
Notably, the Eastern Interconnection does not include Québec or ERCOT. TRE does not have
transformers with low‐side voltages at 200 kV and above.
Special Consideration
The non‐automatic outage data needed to calculate this metric was first collected for the calendar year
2010 as part of the TADS process.
99.38%
98.99%
98.99%
96.16%
98.22%
99.41%
97.98%
90%
92%
94%
96%
98%
100%
FRCC MRO NPCC RFC SERC SPP WECC
Percent Availability
Regional Entity
ALR 6‐15 Element Availability Percentage (APC)Transformers by Regional Entity
98.37%
98.47%
98.43%
90%
92%
94%
96%
98%
100%
NERC Eastern Western
PercentAvailab
ility
Interconnection
ALR 6‐15 Element Availability Percentage (APC)AC Circuits by Interconnection
97%
97.43%
97.98%
90%
92%
94%
96%
98%
100%
NERC Eastern Western
Percent Ava
ilability
Interconnection
ALR 6‐15 Element Availability Percentage (APC)Transformers by Interconnection
98.60%
98.58%
93.91% 98.53%
98.77%
99.39%
98.64%
98.43%
90%
92%
94%
96%
98%
100%
FRCC MRO NPCC RFC SERC SPP TRE WECC
Percent Ava
ilability
Regional Entity
ALR 6‐15 Element Availability Percentage (APC)AC Circuits by Regional Entity

Reliability Metrics Performance
27 2011 Risk Assessment of Reliability Performance
Reliability M
etrics Perform
ance
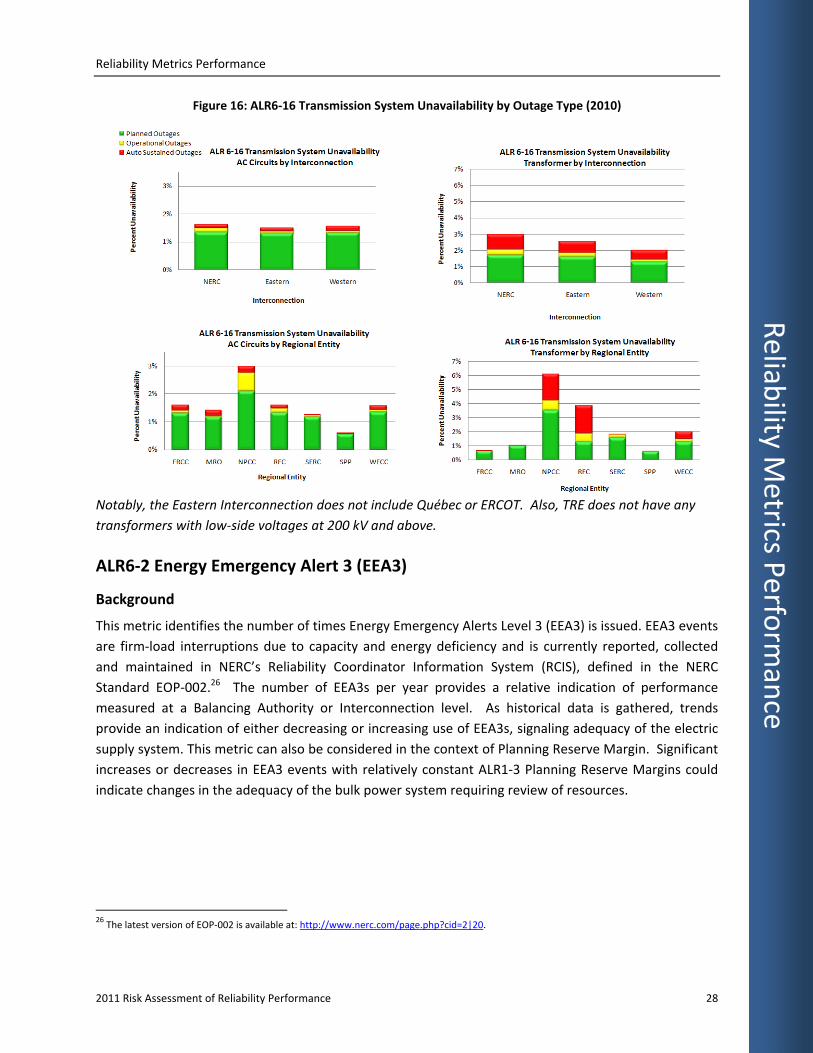
ALR6‐16 Transmission System Unavailability
Background
This metric uses data and calculations directly from the NERC TADS effort and shows the overall percent
of time that AC circuit and transformer TADS elements are unavailable due to sustained automatic and
non‐automatic outages. This is a value using sustained outages for both AC circuits and transformers
operated at 200 kV and above for each Regional Entity, Interconnection, and consolidated values for
NERC.
Assessment
Figure 15 and Figure 16 illustrate the 2010 unavailability percentage for AC circuits and transformer
facilities operated at 200 kV and above. The values for AC circuits are all under 3 percent.
Continued metric assessment is recommended in order to determine the value of this metric.
Special Consideration
The non‐automatic outage data needed to calculate this metric was first collected for the calendar year
2010 as part of the TADS process.
Figure 15: ALR6‐16 Transmission System Unavailability (2010)
Reliability Metrics Performance
2011 Risk Assessment of Reliability Performance 28
Reliab
ility Metrics P
erform
ance
Figure 16: ALR6‐16 Transmission System Unavailability by Outage Type (2010)
Notably, the Eastern Interconnection does not include Québec or ERCOT. Also, TRE does not have any
transformers with low‐side voltages at 200 kV and above.
ALR6‐2 Energy Emergency Alert 3 (EEA3)
Background
This metric identifies the number of times Energy Emergency Alerts Level 3 (EEA3) is issued. EEA3 events
are firm‐load interruptions due to capacity and energy deficiency and is currently reported, collected
and maintained in NERC’s Reliability Coordinator Information System (RCIS), defined in the NERC
Standard EOP‐002.26 The number of EEA3s per year provides a relative indication of performance
measured at a Balancing Authority or Interconnection level. As historical data is gathered, trends
provide an indication of either decreasing or increasing use of EEA3s, signaling adequacy of the electric
supply system. This metric can also be considered in the context of Planning Reserve Margin. Significant
increases or decreases in EEA3 events with relatively constant ALR1‐3 Planning Reserve Margins could
indicate changes in the adequacy of the bulk power system requiring review of resources.
26 The latest version of EOP‐002 is available at: http://www.nerc.com/page.php?cid=2|20.
Reliability Metrics Performance
29 2011 Risk Assessment of Reliability Performance
Reliability M
etrics Perform
ance
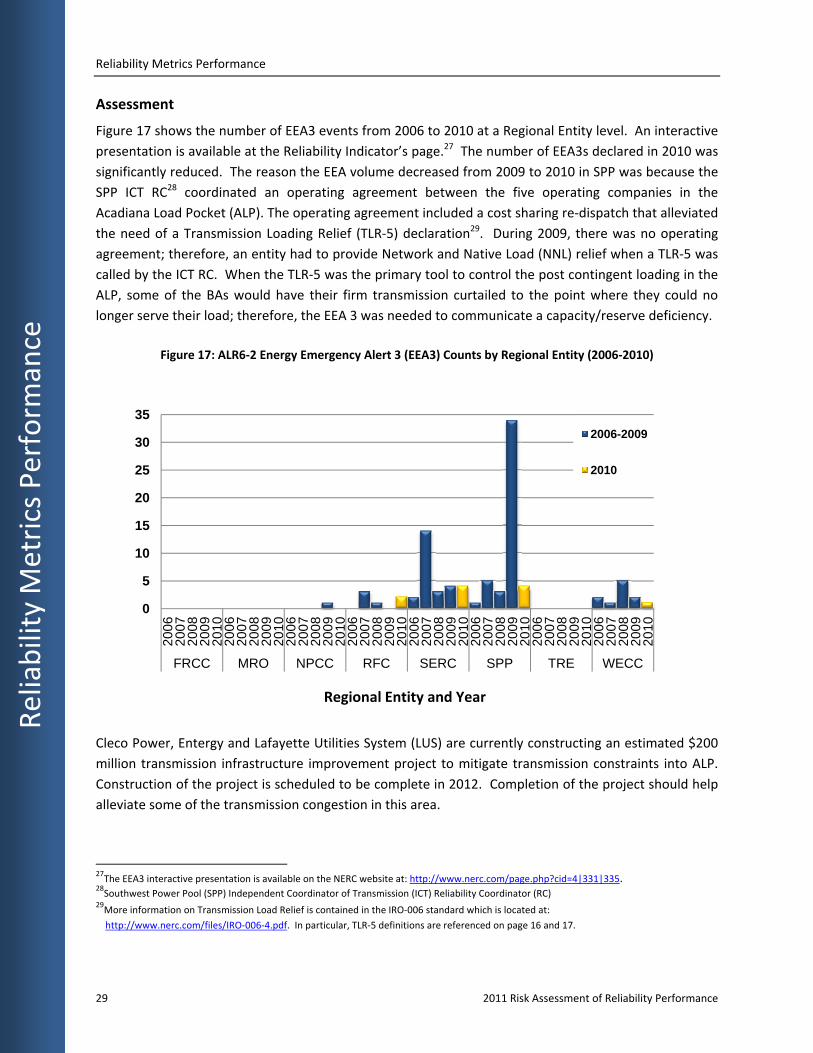
Assessment
Figure 17 shows the number of EEA3 events from 2006 to 2010 at a Regional Entity level. An interactive
presentation is available at the Reliability Indicator’s page.27 The number of EEA3s declared in 2010 was
significantly reduced. The reason the EEA volume decreased from 2009 to 2010 in SPP was because the
SPP ICT RC28 coordinated an operating agreement between the five operating companies in the
Acadiana Load Pocket (ALP). The operating agreement included a cost sharing re‐dispatch that alleviated
the need of a Transmission Loading Relief (TLR‐5) declaration29. During 2009, there was no operating
agreement; therefore, an entity had to provide Network and Native Load (NNL) relief when a TLR‐5 was
called by the ICT RC. When the TLR‐5 was the primary tool to control the post contingent loading in the
ALP, some of the BAs would have their firm transmission curtailed to the point where they could no
longer serve their load; therefore, the EEA 3 was needed to communicate a capacity/reserve deficiency.
Figure 17: ALR6‐2 Energy Emergency Alert 3 (EEA3) Counts by Regional Entity (2006‐2010)
Cleco Power, Entergy and Lafayette Utilities System (LUS) are currently constructing an estimated $200
million transmission infrastructure improvement project to mitigate transmission constraints into ALP.
Construction of the project is scheduled to be complete in 2012. Completion of the project should help
alleviate some of the transmission congestion in this area.
27The EEA3 interactive presentation is available on the NERC website at: http://www.nerc.com/page.php?cid=4|331|335.
28Southwest Power Pool (SPP) Independent Coordinator of Transmission (ICT) Reliability Coordinator (RC)
29More information on Transmission Load Relief is contained in the IRO‐006 standard which is located at:
http://www.nerc.com/files/IRO‐006‐4.pdf. In particular, TLR‐5 definitions are referenced on page 16 and 17.
0
5
10
15
20
25
30
35
2006
2007
2008
2009
2010
2006
2007
2008
2009
2010
2006
2007
2008
2009
2010
2006
2007
2008
2009
2010
2006
2007
2008
2009
2010
2006
2007
2008
2009
2010
2006
2007
2008
2009
2010
2006
2007
2008
2009
2010
FRCC MRO NPCC RFC SERC SPP TRE WECC
2006-2009
2010
Regional Entity and Year

Reliability Metrics Performance
2011 Risk Assessment of Reliability Performance 30
Reliab
ility Metrics P
erform
ance
SPP RTO continues to coordinate operating plans with the operating entities in this area. Mitigation
plans and local operating guides in place are expected to provide sufficient flexibility should issues arise.
NERC will continue to monitor this area for reliability impacts and coordinate any actions with the SPP
Reliability Coordinator and SPP Regional Entity.
Special Considerations
The need to include the magnitude and duration of the EEA3 declarations in this metric is under
evaluation.
ALR 6‐3 Energy Emergency Alert 2 (EEA2)
Background
The Energy Emergency Alert 2 (EEA2) metric measures the number of events that BAs declare for
deficient capacity and energy during peak load periods. The number of EEA2 events, and any trends in
their reporting, indicates how robust the system is in supplying aggregate load requirements. The EEA2
declarations may also serve as a leading indicator of energy and capacity shortfall in the adequacy of the
electric supply system. EEA2 declarations provide a sense of the frequency of precursor events to more
severe EEA3 declarations. This metric measures the number of events that Balancing Authorities
declare for deficient capacity and energy during peak load periods. At this time, however, this data
reflects inclusion of Demand Side Resources that would not be indicative of inadequacy of the electric
supply system.
Demand response is a legitimate resource to be called upon by balancing authorities and does not
indicate a reliability concern. The historical record may include demand response activations and non‐
firm load interruptions, per applicable contracts, within the EEA alerts.30 EEA2 events called solely for
activation of demand response or interruption of non‐firm load per applicable contracts should be
excluded from this metric.
This metric can also be considered in the context of the Planning Reserve Margin. Significant increases
or decreases in EEA2 events with relatively constant Planning Reserve Margins could indicate volatility in
the actual loads compared to forecasted levels or changes in the adequacy of the bulk power system
required to meet load demands. As more data is gathered, there might be an indication of either
decreasing or increasing adequacy in the electric supply system’s Planning Reserve Margins.
Assessment
Figure 18 shows the number of EEA2 events by Regional Entity from 2006 to 2010 from the EEA2
interactive reports available online.31 The general trend continues to show improved performance
which may have been influenced by the overall reduction in demand throughout NERC caused by the
economic downturn.
30 The EEA2 is defined at http://www.nerc.com/files/EOP‐002‐2.pdf.
31 EEA2 interactive version located at: http://www.nerc.com/page.php?cid=4|331|341.

Reliability Metrics Performance
31 2011 Risk Assessment of Reliability Performance
Reliability M
etrics Perform
ance
There two issues that should be assessed further for the EEA2 metric. To begin, specific performance
for any one region should be investigated for issues or events that may affect the results. Secondly,
determining whether performance reported includes those events resulting from the economic
operation of DSM and non‐firm load interruption should also be investigated.
Special Considerations
The intent of this metric is to measure only EEAs that are called for reliability reasons and not for
economic factors, such as demand side management (DSM) and non‐firm load interruption. The
historical data for this metric may include events that were called for economic factors. However,
recent data should only include EEAs called for reliability reasons.
ALR 6‐1 Transmission Constraint Mitigation
Background
The intent of this metric is to identify trends in the number of mitigation measures (Special Protection
Schemes (SPS), Remedial Action Schemes (RAS), and Operating Procedures) required to meet
Transmission Planning (TPL)32 reliability requirements. By their nature, SPS do not indicate an inherent
weakness in the bulk power system; they are an indication of methods that are taken to operate the
system through the range of conditions it must perform.
32 In particular, the standard is TPL‐005‐0 and is located at http://www.nerc.com/files/TPL‐005‐0.pdf.
0
5
10
15
20
25
30
35
40
45
50
2006
2007
2008
2009
2010
2006
2007
2008
2009
2010
2006
2007
2008
2009
2010
2006
2007
2008
2009
2010
2006
2007
2008
2009
2010
2006
2007
2008
2009
2010
2006
2007
2008
2009
2010
2006
2007
2008
2009
2010
FRCC MRO NPCC RFC SERC SPP TRE WECC
2006-2009
2010
Regional Entity and Year
Figure 18: ALR6‐3 Energy Emergency Alert 2 (EEA2)

Reliability Metrics Performance
2011 Risk Assessment of Reliability Performance 32
Reliab
ility Metrics P
erform
ance
Assessment
A pilot with four Regional Entities was completed and, based on the results, the pilot data collection was
expanded to all regions. The initial results of the data collection are shown in Figure 19 and Table 5. Per
Regional Entity, there are a relatively constant number of regional mitigation measure plans over the
data collection time period.
Figure 19: ALR6‐1 Transmission Constraint Mitigation by SPS/RAS (2009‐2014)
*”‐“ data is not available.
Special Considerations
This metric is only intended to evaluate the trend use of these plans, and whether the metric indicates
robustness of the transmission system is increasing, remaining static, or decreasing. A certain number
of SPS mitigation plans may be necessary to support reliable operation of the system. An increase of
SPS may indicate additional, required transmission capacity is required. Correspondingly, a reduction in
Table 5: ALR6‐1 Transmission Constraint Mitigation by Operating Procedure/Guides (2009‐2014)
2009 2010 2011 2014
FRCC ‐ 107 75 66
MRO 79 79 81 81
NPCC ‐ ‐ ‐ ‐RFC 2 1 3 4
SPP 39 40 40 40
SERC 6 7 15 ‐
TRE 29 25 25 ‐
WECC 110 111 ‐ ‐

Reliability Metrics Performance
33 2011 Risk Assessment of Reliability Performance
Reliability M
etrics Perform
ance
the number of SPS may be an indicator of increased generation or transmission facilities being placed in‐
service, which may imply greater robustness of the bulk power system.
In general, mitigation plans are a viable and valuable tool for effective operation of the bulk power
system. In power system planning, reliability, operability, capacity and cost‐efficiency are
simultaneously considered through a variety of system scenarios. Mitigation measures are a method for
optimizing a power system across these scenarios.
Integrated Bulk Power System Risk Assessment
Introduction
In developing eighteen metrics to measure adequate level of reliability, any such measurement of
reliability must include consideration of the risks present within the bulk power system to appropriately
prioritize and manage these system risks. This approach not only can be used to measure risk reduction
over time. Also, a uniform event analysis process can be applied to identify significant events for further
detailed review.
The Operating Committee (OC) and Planning Committee (PC) endorsed the concepts and framework33 of
the risk‐based approach in their September 2010 meetings and further supported the event severity risk
index (SRI) calculation34 in March 2011.
Recommendations
NERC should embrace the use of risk assessment to identify trends and lessons learned to
improve bulk power system reliability.
The SRI should be integrated into the event analysis process and root cause analysis.
As trend evaluations increase the knowledge of risks to the bulk power system, data required to
support additional assessment should be gathered.
Event Severity Risk Index (SRI)
Risk assessment is an essential tool for achieving the alignment between organizations, people and
technology. This will assist in quantifying inherent risks, identifying where potential high risks exist, and
evaluating where the most significant risk reduction can be achieved. NERC, the Regional Entities, and
registered entities can use this tool to focus on the areas of highest reliability risk to provide a sound
basis for development of results‐based standards and compliance programs. Risk assessment also
serves to engage all stakeholders in a dialogue about specific risk factors and a strategic plan for risk
reduction and early detection.
33 http://www.nerc.com/docs/pc/rmwg/Integrated_Bulk_Power_System_Risk_Assessment_Concepts_Final.pdf 34 http://www.nerc.com/docs/pc/rmwg/SRI_Equation_Refinement_May6_2011.pdf
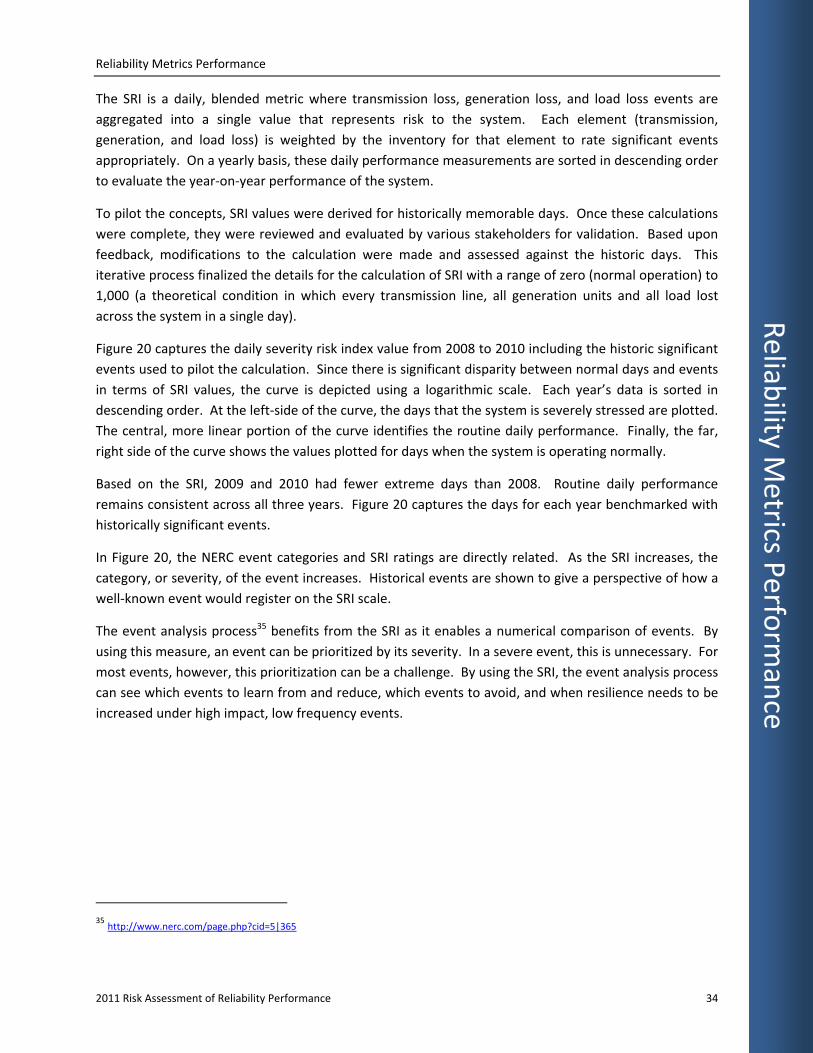
Reliability Metrics Performance
2011 Risk Assessment of Reliability Performance 34
Reliab
ility Metrics P
erform
ance
The SRI is a daily, blended metric where transmission loss, generation loss, and load loss events are
aggregated into a single value that represents risk to the system. Each element (transmission,
generation, and load loss) is weighted by the inventory for that element to rate significant events
appropriately. On a yearly basis, these daily performance measurements are sorted in descending order
to evaluate the year‐on‐year performance of the system.
To pilot the concepts, SRI values were derived for historically memorable days. Once these calculations
were complete, they were reviewed and evaluated by various stakeholders for validation. Based upon
feedback, modifications to the calculation were made and assessed against the historic days. This
iterative process finalized the details for the calculation of SRI with a range of zero (normal operation) to
1,000 (a theoretical condition in which every transmission line, all generation units and all load lost
across the system in a single day).
Figure 20 captures the daily severity risk index value from 2008 to 2010 including the historic significant
events used to pilot the calculation. Since there is significant disparity between normal days and events
in terms of SRI values, the curve is depicted using a logarithmic scale. Each year’s data is sorted in
descending order. At the left‐side of the curve, the days that the system is severely stressed are plotted.
The central, more linear portion of the curve identifies the routine daily performance. Finally, the far,
right side of the curve shows the values plotted for days when the system is operating normally.
Based on the SRI, 2009 and 2010 had fewer extreme days than 2008. Routine daily performance
remains consistent across all three years. Figure 20 captures the days for each year benchmarked with
historically significant events.
In Figure 20, the NERC event categories and SRI ratings are directly related. As the SRI increases, the
category, or severity, of the event increases. Historical events are shown to give a perspective of how a
well‐known event would register on the SRI scale.
The event analysis process35 benefits from the SRI as it enables a numerical comparison of events. By
using this measure, an event can be prioritized by its severity. In a severe event, this is unnecessary. For
most events, however, this prioritization can be a challenge. By using the SRI, the event analysis process
can see which events to learn from and reduce, which events to avoid, and when resilience needs to be
increased under high impact, low frequency events.
35 http://www.nerc.com/page.php?cid=5|365
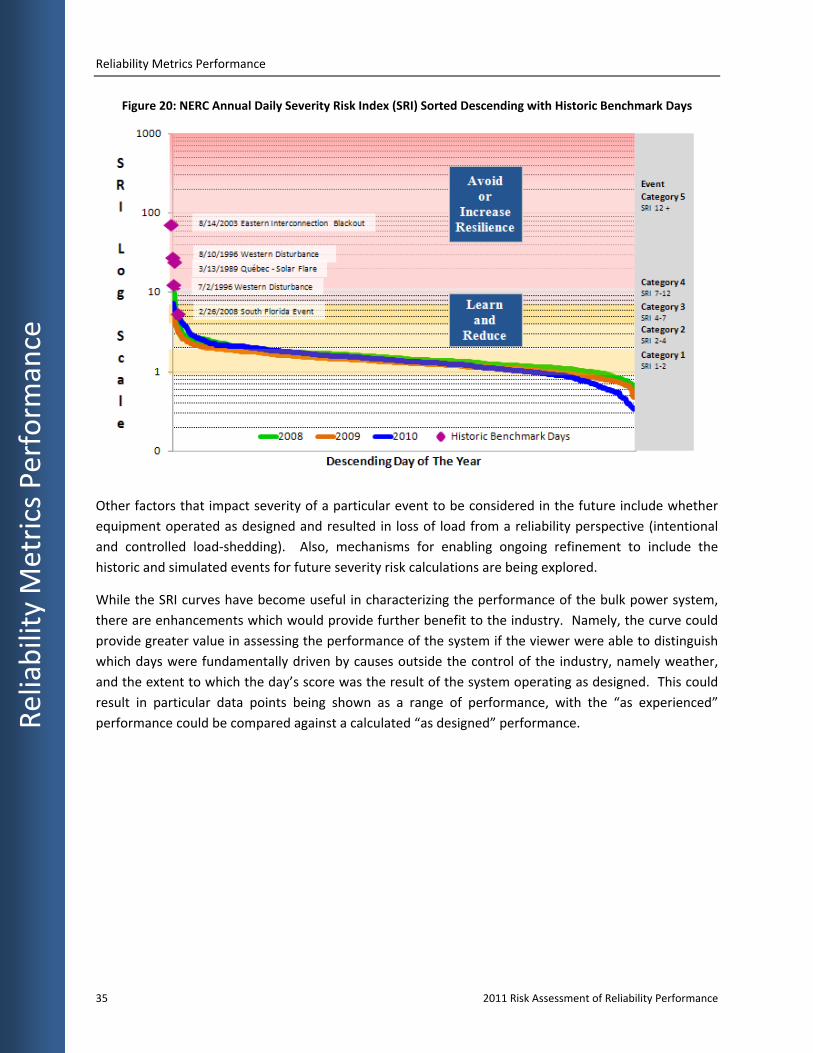
Reliability Metrics Performance
35 2011 Risk Assessment of Reliability Performance
Reliability M
etrics Perform
ance
Figure 20: NERC Annual Daily Severity Risk Index (SRI) Sorted Descending with Historic Benchmark Days
Other factors that impact severity of a particular event to be considered in the future include whether
equipment operated as designed and resulted in loss of load from a reliability perspective (intentional
and controlled load‐shedding). Also, mechanisms for enabling ongoing refinement to include the
historic and simulated events for future severity risk calculations are being explored.
While the SRI curves have become useful in characterizing the performance of the bulk power system,
there are enhancements which would provide further benefit to the industry. Namely, the curve could
provide greater value in assessing the performance of the system if the viewer were able to distinguish
which days were fundamentally driven by causes outside the control of the industry, namely weather,
and the extent to which the day’s score was the result of the system operating as designed. This could
result in particular data points being shown as a range of performance, with the “as experienced”
performance could be compared against a calculated “as designed” performance.

Reliability Metrics Performance
2011 Risk Assessment of Reliability Performance 36
Reliab
ility Metrics P
erform
ance
Reliability Metrics Conclusions and Recommendations Among the eighteen metrics that address the characteristics of an adequate level of reliability (ALR),
trends indicate the system is performing better in the following seven areas:
ALR1‐3 Planning Reserve Margin
ALR1‐4 BPS Transmission Related Events Resulting in Loss of Load
ALR2‐5 Disturbance Control Events Greater than Most Severe Single Contingency
ALR6‐2 Energy Emergency Alert 3 (EEA3)
ALR6‐3 Energy Emergency Alert 2 (EEA2)
ALR6‐11 Automatic Transmission Outages Initiated by Failed Protection System Equipment
ALR6‐13 Automatic Transmission Outages Initiated by Failed AC Substation Equipment
Many of the remaining metrics do not have sufficient data to derive useful conclusions. With a more
thorough data matrix, more conclusions about reliability could be drawn. All metrics will be assessed on
a regular basis to determine their contribution to quantitative reliability measurement. In addition to
further collection, an investigation into the data collection processes for some metrics will also be
investigated. In particular, a study should be conducted to determine the usefulness of a 100 MW load
loss threshold for ALR2‐3.
For the IRI, more investigation is needed to determine the overlap of the components (CDI, EDI, and
SDI). At this time, components of the IRI should be solidified before the IRI will be useful. In particular,
the CDI should be more thoroughly understood as an index by collecting more data over time.
Future Advancements: Integrated Reliability Index As the next step to the severity risk index, an integrated reliability index (IRI) is under development to
provide a more complete bulk power system reliability picture. Currently, the concept of the IRI is in a
whitepaper status.36 Upon completion, the IRI should peer beyond the severity risk index’s narrow,
event based scope and illuminate a broader, quantitative picture of total bulk power system reliability.
The IRI is composed of three component indices that attempt to capture different families of risk to the
bulk power system. These are the Event Driven Index (EDI), Standards/Statute Driven Index (SDI), and
Condition Driven Index (CDI) as shown in Figure 21.
The ultimate goal of the IRI is to provide the industry meaningful trends of the bulk power system's
performance and guidance on how the industry can improve reliability and support risk‐informed
decision making. The development of these composite indices aims to inform, increase transparency,
and quantify the effectiveness of risk reduction or mitigation actions. Also, these metrics will facilitate
unitary assessment of risks which impacted reliability of the bulk power system.
36 http://www.nerc.com/docs/pc/rmwg/Integrated_Reliability_Index_WhitePaper_DRAFT.pdf
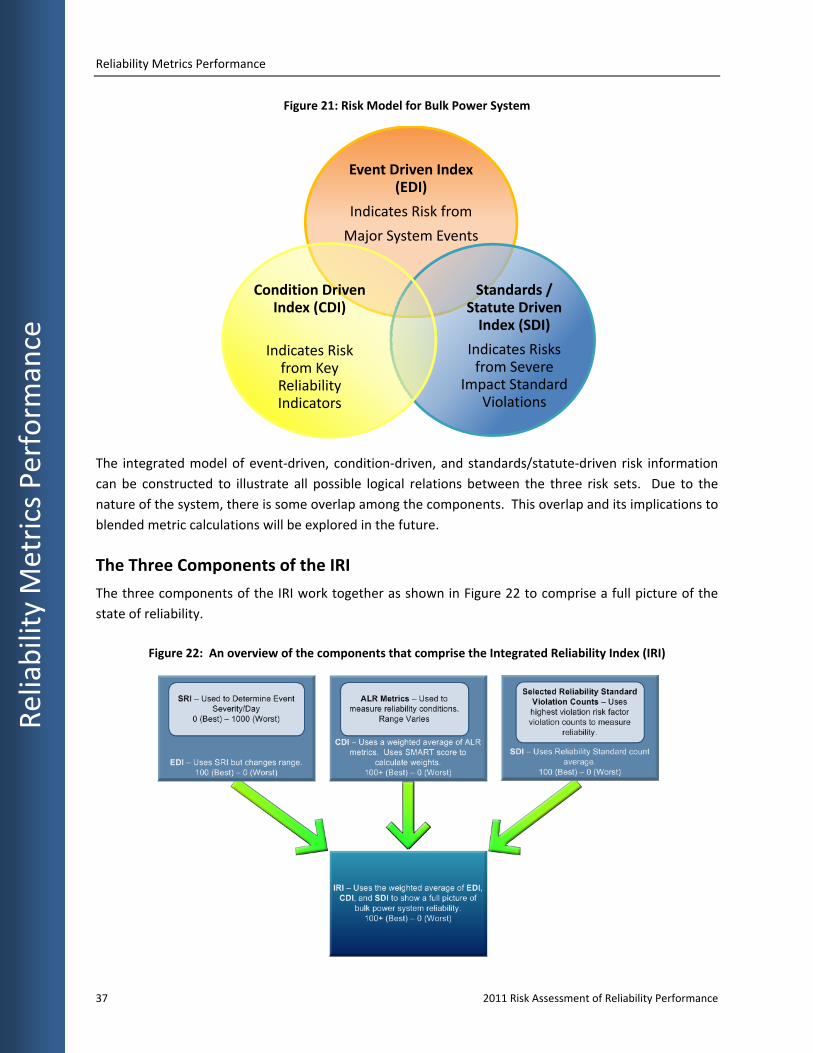
Reliability Metrics Performance
37 2011 Risk Assessment of Reliability Performance
Reliability M
etrics Perform
ance
Figure 21: Risk Model for Bulk Power System
The integrated model of event‐driven, condition‐driven, and standards/statute‐driven risk information
can be constructed to illustrate all possible logical relations between the three risk sets. Due to the
nature of the system, there is some overlap among the components. This overlap and its implications to
blended metric calculations will be explored in the future.
The Three Components of the IRI
The three components of the IRI work together as shown in Figure 22 to comprise a full picture of the
state of reliability.
Figure 22: An overview of the components that comprise the Integrated Reliability Index (IRI)
Event Driven Index (EDI)
Indicates Risk from
Major System Events
Standards / Statute Driven Index (SDI)
Indicates Risks from Severe
Impact Standard Violations
Condition Driven Index (CDI)
Indicates Risk from Key Reliability Indicators
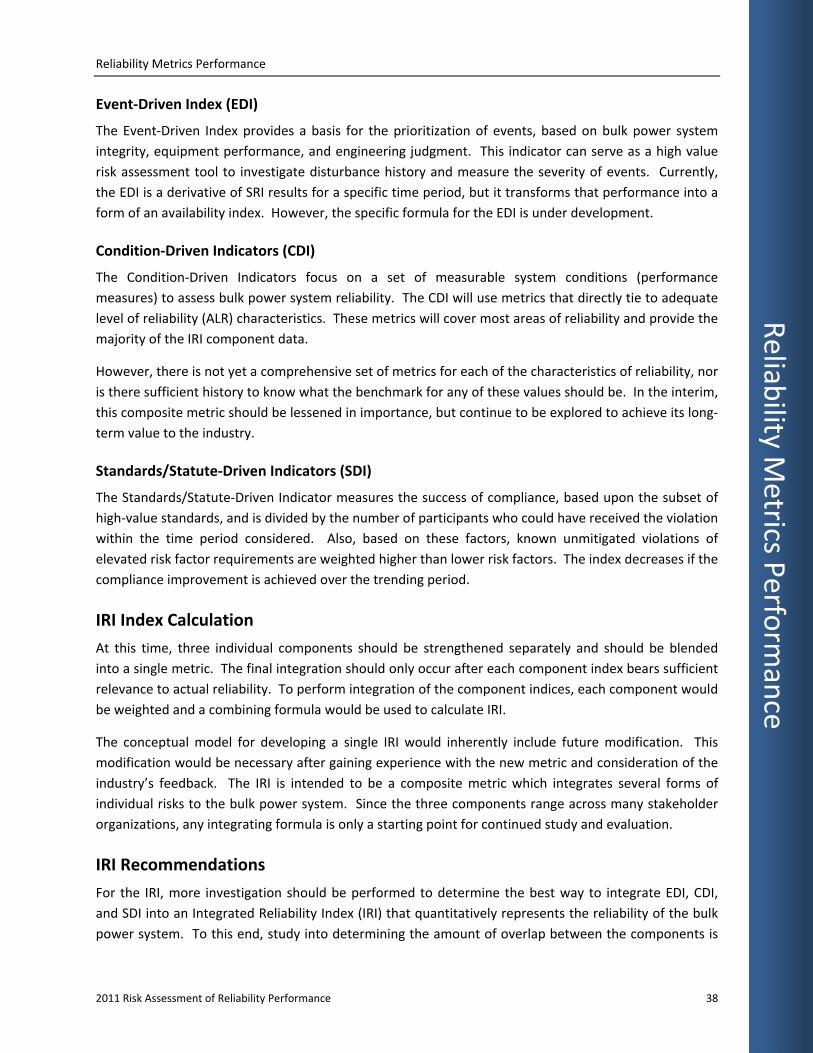
Reliability Metrics Performance
2011 Risk Assessment of Reliability Performance 38
Reliab
ility Metrics P
erform
ance
Event‐Driven Index (EDI)
The Event‐Driven Index provides a basis for the prioritization of events, based on bulk power system
integrity, equipment performance, and engineering judgment. This indicator can serve as a high value
risk assessment tool to investigate disturbance history and measure the severity of events. Currently,
the EDI is a derivative of SRI results for a specific time period, but it transforms that performance into a
form of an availability index. However, the specific formula for the EDI is under development.
Condition‐Driven Indicators (CDI)
The Condition‐Driven Indicators focus on a set of measurable system conditions (performance
measures) to assess bulk power system reliability. The CDI will use metrics that directly tie to adequate
level of reliability (ALR) characteristics. These metrics will cover most areas of reliability and provide the
majority of the IRI component data.
However, there is not yet a comprehensive set of metrics for each of the characteristics of reliability, nor
is there sufficient history to know what the benchmark for any of these values should be. In the interim,
this composite metric should be lessened in importance, but continue to be explored to achieve its long‐
term value to the industry.
Standards/Statute‐Driven Indicators (SDI)
The Standards/Statute‐Driven Indicator measures the success of compliance, based upon the subset of
high‐value standards, and is divided by the number of participants who could have received the violation
within the time period considered. Also, based on these factors, known unmitigated violations of
elevated risk factor requirements are weighted higher than lower risk factors. The index decreases if the
compliance improvement is achieved over the trending period.
IRI Index Calculation
At this time, three individual components should be strengthened separately and should be blended
into a single metric. The final integration should only occur after each component index bears sufficient
relevance to actual reliability. To perform integration of the component indices, each component would
be weighted and a combining formula would be used to calculate IRI.
The conceptual model for developing a single IRI would inherently include future modification. This
modification would be necessary after gaining experience with the new metric and consideration of the
industry’s feedback. The IRI is intended to be a composite metric which integrates several forms of
individual risks to the bulk power system. Since the three components range across many stakeholder
organizations, any integrating formula is only a starting point for continued study and evaluation.
IRI Recommendations
For the IRI, more investigation should be performed to determine the best way to integrate EDI, CDI,
and SDI into an Integrated Reliability Index (IRI) that quantitatively represents the reliability of the bulk
power system. To this end, study into determining the amount of overlap between the components is
Reliability Metrics Performance
39 2011 Risk Assessment of Reliability Performance
Reliability M
etrics Perform
ance
necessary. Also, the CDI component of the IRI needs to be solidified. More accurate metric data is
needed to paint a fuller picture of system conditions. Many of the metrics used to calculate the CDI are
new, or have limited supporting data. Compared to the SDI, which measures well‐known violation
counts, and the EDI, which uses the well‐defined SRI, the CDI lacks the depth of rigor and should be
improved with further investigation.
Transmission Equipment Performance
2011 Risk Assessment of Reliability Performance 40
Transm
ission Eq
uipmen
t Perfo
rmance
Transmission Equipment Performance
Introduction The Transmission Availability Data System (TADS) was launched with the establishment of a TADS task force
by the NERC Planning Committee in October 200637. On October 27, 2007, the NERC Board of Trustees
approved the collection of automatic transmission outage data beginning in calendar year 2008 (Phase I).
Subsequently, on October 29, 2008, the NERC Board of Trustees approved the collection of non‐automatic
outage data beginning in calendar year 2010 (Phase II).
This chapter focuses on automatic outage trends from calendar year 2008 to 2010. Since only one year of
non‐automatic outages has been collected, insufficient information is available for use in this report.
When calculating bulk power system performance, care must be exercised when interpreting results.
Misinterpretation can lead to erroneous conclusions regarding system performance. A mathematical
confidence interval technique was applied to determine the relevance of trending for transmission
metrics.38 On a regional basis, there was not enough data to perform statistically relevant trending. On a
NERC‐wide basis, however, there is enough information to accurately determine whether the yearly outage
variation compared to the average is due to random statistical variation, or the particular year in question is
significantly different in performance.
Performance Trends Transmission performance information has been provided by Transmission Owners (TOs) within NERC
through the NERC TADS process. The data presented reflects momentary and sustained AC automatic
outages of transmission elements that operate at voltages greater than or equal to 200 kV with the criteria
specified in the TADS process. The following elements listed below are included:
AC Circuits ≥ 200 kV (Overhead and Underground Circuits). Radial circuits are included;
DC Circuits with ≥ +/‐200 kV DC voltage;
Transformers with ≥ 200 kV low‐side voltage; and
AC/DC Back‐to‐Back (BTB) Converters with ≥ 200 kV AC voltage, on both sides.
37For additional details on TADS, the Data Reporting Instruction Manual is located at:
http://www.nerc.com/docs/pc/tadswg/Data%20Reporting%20Instr%20Manual%2020101202a%20clean.pdf. 38The detailed Confidence Interval computation is available at:
http://www.nerc.com/docs/pc/tadstf/TADS_Nov_2_2007APPENDIX_C_Confidence_Interval.pdf.
Transmission Equipment Performance
41 2011 Risk Assessment of Reliability Performance
Transm
ission Equipmen
t Perform
ance
AC Element Outage Summary and Leading Causes
Table 6 shows the 2008, 2009, and 2010 NERC total AC transmission element inventory and a summary of
the associated outages. The number of circuits increased from year‐to‐year due to new construction or
reconstruction to higher voltages. For every outage experienced on the transmission system, cause codes
are recorded according to the TADS process.39 Causes of both momentary and sustained outages have been
indicated. These causes are analyzed to identify trends, similarities, and to provide insight into what could
be done to prevent future occurrences.
Figure 23 and Figure 24 describe the top ten initiating cause codes for sustained and momentary automatic
outages from 2008 to 2010. Based on the two figures, the relationship between the total number of
outages and total outage hours are provided. Failed AC Substation Equipment and Failed AC Circuit
Equipment are the top two causes of sustained outage hours with 65 percent of the total outage hours. The
two largest causes of momentary outage hours within NERC are “Lightning” and “Weather, excluding
Lightning”.
Importantly, Human Error, Failed Protection System Equipment, and Failed AC Circuit Equipment initiating
cause codes have very similar totals numbers of outages and should all be considered significant focus
points in reducing the number of sustained automatic outages for all elements.
39Please refer to section F in http://www.nerc.com/docs/pc/tadswg/Appendix%207%2020101202a%20clean.pdf for TADS automatic outage codes.
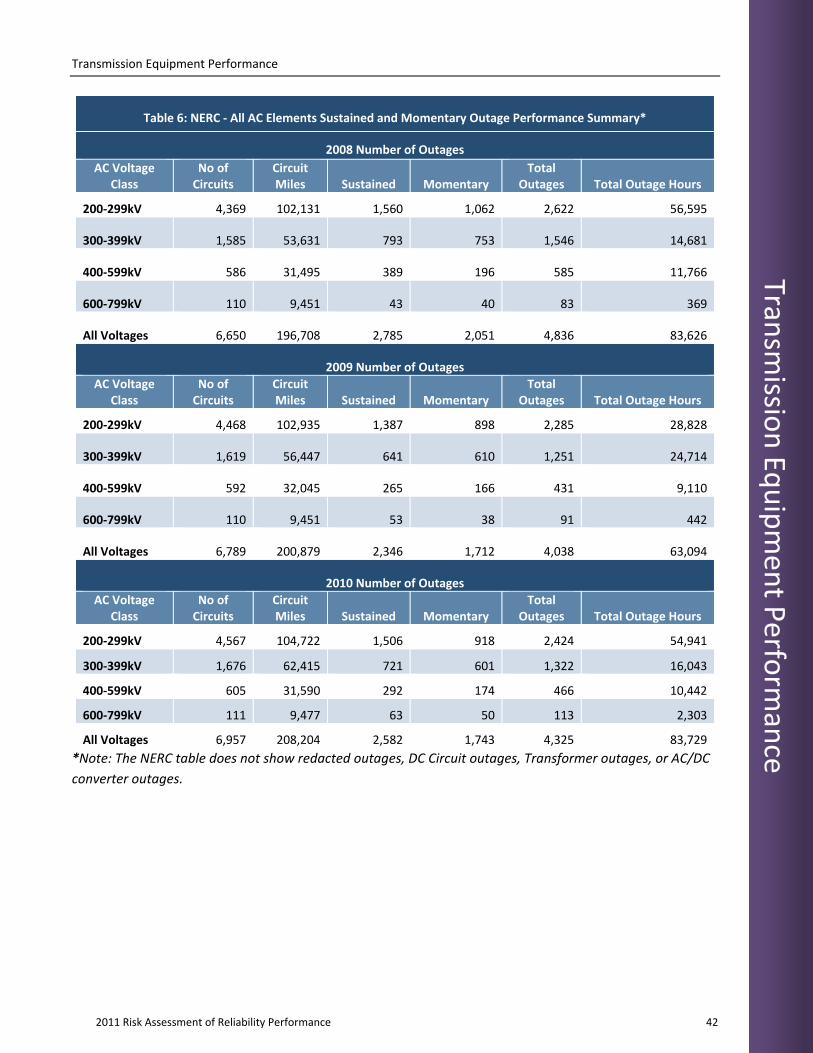
Transmission Equipment Performance
2011 Risk Assessment of Reliability Performance 42
Transm
ission Eq
uipmen
t Perfo
rmance
Table 6: NERC ‐ All AC Elements Sustained and Momentary Outage Performance Summary*
2008 Number of Outages
AC Voltage Class
No of Circuits
Circuit Miles Sustained Momentary
Total Outages Total Outage Hours
200‐299kV 4,369 102,131 1,560 1,062 2,622 56,595
300‐399kV 1,585 53,631 793 753 1,546 14,681
400‐599kV 586 31,495 389 196 585 11,766
600‐799kV 110 9,451 43 40 83 369
All Voltages 6,650 196,708 2,785 2,051 4,836 83,626
2009 Number of Outages
AC Voltage Class
No of Circuits
Circuit Miles Sustained Momentary
Total Outages Total Outage Hours
200‐299kV 4,468 102,935 1,387 898 2,285 28,828
300‐399kV 1,619 56,447 641 610 1,251 24,714
400‐599kV 592 32,045 265 166 431 9,110
600‐799kV 110 9,451 53 38 91 442
All Voltages 6,789 200,879 2,346 1,712 4,038 63,094
2010 Number of Outages
AC Voltage Class
No of Circuits
Circuit Miles Sustained Momentary
Total Outages Total Outage Hours
200‐299kV 4,567 104,722 1,506 918 2,424 54,941
300‐399kV 1,676 62,415 721 601 1,322 16,043
400‐599kV 605 31,590 292 174 466 10,442
600‐799kV 111 9,477 63 50 113 2,303
All Voltages 6,957 208,204 2,582 1,743 4,325 83,729
*Note: The NERC table does not show redacted outages, DC Circuit outages, Transformer outages, or AC/DC
converter outages.
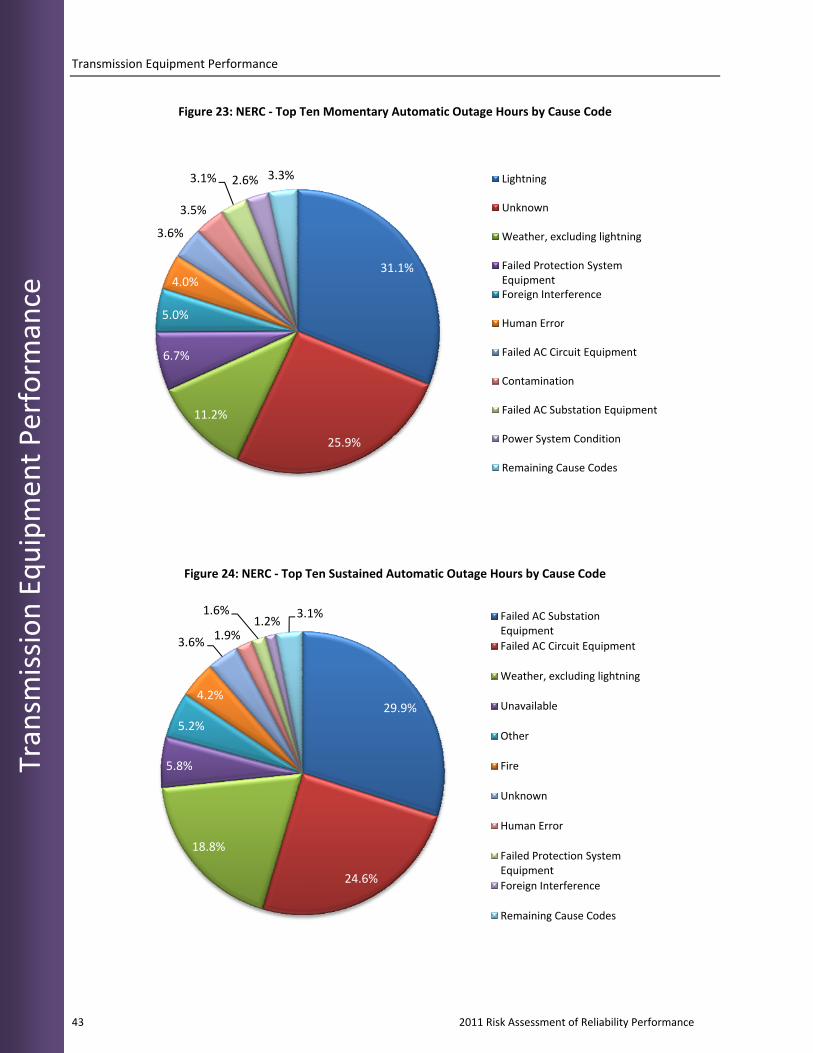
Transmission Equipment Performance
43 2011 Risk Assessment of Reliability Performance
Transm
ission Equipmen
t Perform
ance
Figure 23: NERC ‐ Top Ten Momentary Automatic Outage Hours by Cause Code
Figure 24: NERC ‐ Top Ten Sustained Automatic Outage Hours by Cause Code
31.1%
25.9%
11.2%
6.7%
5.0%
4.0%
3.6%
3.5%
3.1% 2.6% 3.3% Lightning
Unknown
Weather, excluding lightning
Failed Protection System EquipmentForeign Interference
Human Error
Failed AC Circuit Equipment
Contamination
Failed AC Substation Equipment
Power System Condition
Remaining Cause Codes
29.9%
24.6%
18.8%
5.8%
5.2%
4.2%
3.6%1.9%
1.6%1.2%
3.1% Failed AC Substation Equipment
Failed AC Circuit Equipment
Weather, excluding lightning
Unavailable
Other
Fire
Unknown
Human Error
Failed Protection System Equipment
Foreign Interference
Remaining Cause Codes

Transmission Equipment Performance
2011 Risk Assessment of Reliability Performance 44
Transm
ission Eq
uipmen
t Perfo
rmance
Transmission Monthly Outages
Figure 25 displays the total number of automatic outages on a monthly basis. The three months with the
highest total of automatic outages were June, July, and August. From a seasonal perspective, winter,
November 1 to the end of February, had a monthly, 3‐year average of 271 outages. Summer, June 1
through September 30, had a monthly, 3‐year average of 453 outages.
Figure 25: Number of Automatic Outages by Month for AC Circuits (2008‐2010)*
*This figure does not show redacted outages, DC Circuit outages, Transformer outages, or AC/DC Converter
outages.
Outage Initiation Location
For every outage experienced on the transmission system, the outage initiation code is identified and
recorded. The outage initiation code can be measured to identify trends and similarities and provide insight
into areas for improvement.
The “Outage Initiation Code” describes where an automatic outage was initiated on the power system. The
five codes are as follows:
Element‐Initiated
Other Element‐Initiated
AC Substation‐Initiated
AC/DC Terminal‐Initiated (for DC circuits)
Other Facility Initiated: any facility not included in any other outage initiation code
Notably, the protection system is not part of an “AC Substation” or an “AC/DC Terminal”. If a protection
system misoperates and initiates an outage, it will be classified as “Other‐Facility Initiated”. Figure 26 and
Figure 27 show the initiating location of sustained and momentary automatic outages from 2008 to 2010.

Transmission Equipment Performance
45 2011 Risk Assessment of Reliability Performance
Transm
ission Equipmen
t Perform
ance
With both momentary and sustained automatic outages taken into account; the outage was initiated on the
TADS element – AC circuit or transformer – more than 60 percent of the time, as shown in Figure 26 and
Figure 27.
Figure 26
Figure 27
Transmission Outage Events
Figure 28 illustrates the relationship between the numbers of automatic outages per TADS event. All three
years, 2008, 2009, and 2010, follow a similar trend. The largest number of automatic outages per event is
fourteen in 2010, thirteen in 2009, and eight in 2008. There are around 70 to 100 events that contain
between fourteen and three automatic outages (see below). There are around 330 to 400 events that
contain two or more automatic outages. Each of the other events contains only one automatic outage. In
the figure, the total number of events in 2008 to 2010 ranged from 3,920 to 4,569 events per year. In 2010,
over 90 percent of TADS events contained at least one automatic outage.
Figure 26: Sustained Automatic Outage
Initiation Code
Figure 27: Momentary Automatic Outage
Initiation Code
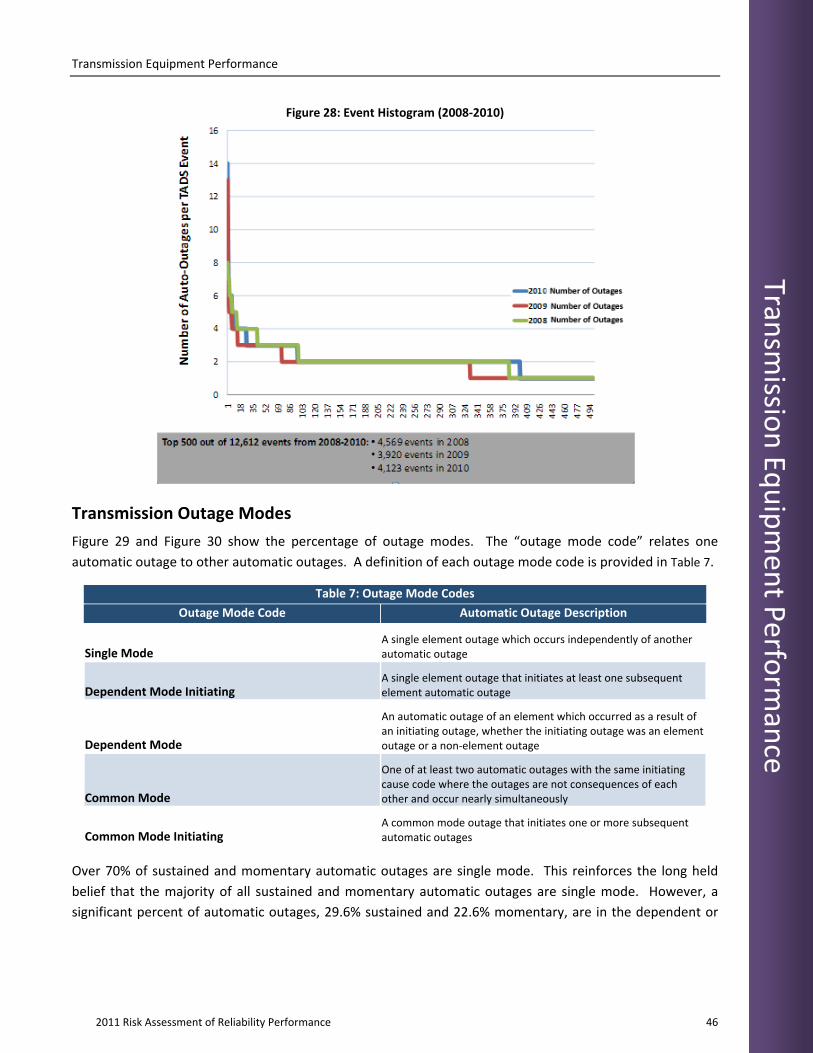
Transmission Equipment Performance
2011 Risk Assessment of Reliability Performance 46
Transm
ission Eq
uipmen
t Perfo
rmance
Transmission Outage Modes
Figure 29 and Figure 30 show the percentage of outage modes. The “outage mode code” relates one
automatic outage to other automatic outages. A definition of each outage mode code is provided in Table 7.
Table 7: Outage Mode Codes
Outage Mode Code Automatic Outage Description
Single Mode A single element outage which occurs independently of another automatic outage
Dependent Mode Initiating A single element outage that initiates at least one subsequent element automatic outage
Dependent Mode
An automatic outage of an element which occurred as a result of an initiating outage, whether the initiating outage was an element outage or a non‐element outage
Common Mode
One of at least two automatic outages with the same initiating cause code where the outages are not consequences of each other and occur nearly simultaneously
Common Mode Initiating A common mode outage that initiates one or more subsequent automatic outages
Over 70% of sustained and momentary automatic outages are single mode. This reinforces the long held
belief that the majority of all sustained and momentary automatic outages are single mode. However, a
significant percent of automatic outages, 29.6% sustained and 22.6% momentary, are in the dependent or
Figure 28: Event Histogram (2008‐2010)
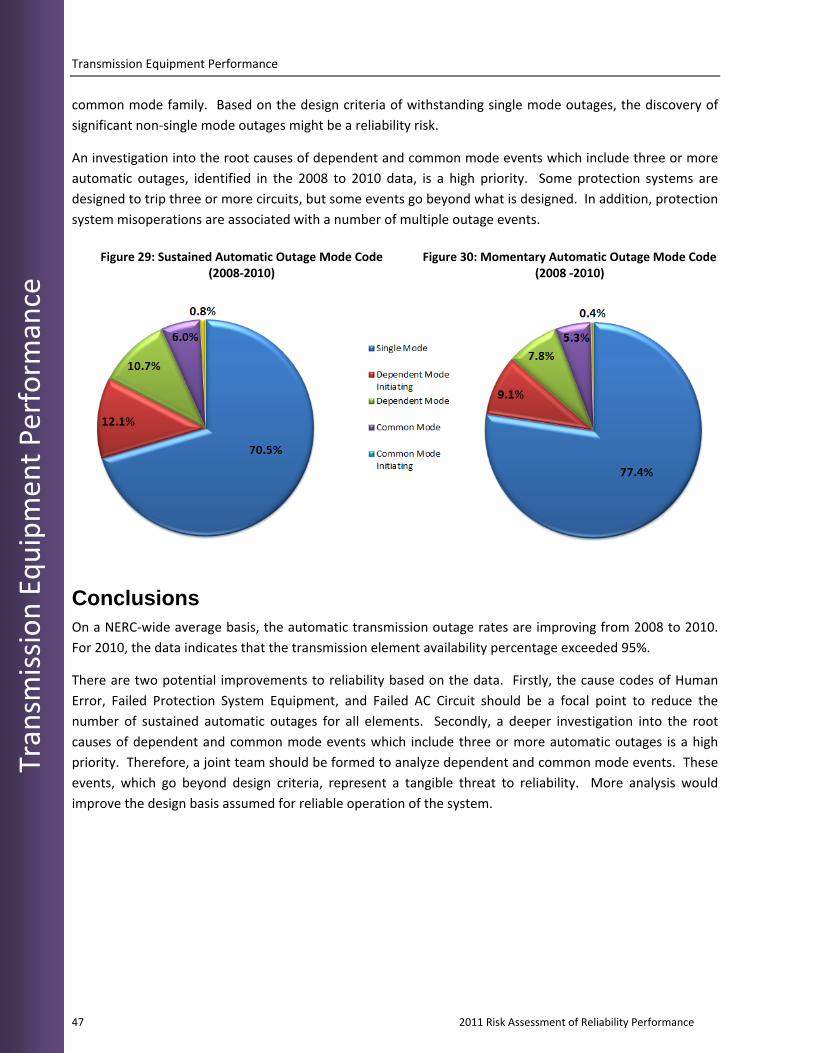
Transmission Equipment Performance
47 2011 Risk Assessment of Reliability Performance
Transm
ission Equipmen
t Perform
ance
common mode family. Based on the design criteria of withstanding single mode outages, the discovery of
significant non‐single mode outages might be a reliability risk.
An investigation into the root causes of dependent and common mode events which include three or more
automatic outages, identified in the 2008 to 2010 data, is a high priority. Some protection systems are
designed to trip three or more circuits, but some events go beyond what is designed. In addition, protection
system misoperations are associated with a number of multiple outage events.
Conclusions On a NERC‐wide average basis, the automatic transmission outage rates are improving from 2008 to 2010.
For 2010, the data indicates that the transmission element availability percentage exceeded 95%.
There are two potential improvements to reliability based on the data. Firstly, the cause codes of Human
Error, Failed Protection System Equipment, and Failed AC Circuit should be a focal point to reduce the
number of sustained automatic outages for all elements. Secondly, a deeper investigation into the root
causes of dependent and common mode events which include three or more automatic outages is a high
priority. Therefore, a joint team should be formed to analyze dependent and common mode events. These
events, which go beyond design criteria, represent a tangible threat to reliability. More analysis would
improve the design basis assumed for reliable operation of the system.
Figure 29: Sustained Automatic Outage Mode Code(2008‐2010)
Figure 30: Momentary Automatic Outage Mode Code(2008 ‐2010)

Generation Equipment Performance
2011 Risk Assessment of Reliability Performance 48
Gen
eration Eq
uipmen
t Perfo
rmance
Generation Equipment Performance
Introduction The development of the Generating Availability Data System (GADS) began in 1982. This data system
collects, records, and retrieves voluntarily provided operating information. By pooling individual unit
information, generating unit availability performance is calculated. Also, the information supports
equipment reliability, availability analyses and risk‐informed decision‐making to relevant parties. Finally,
reports and information resulting from the data collected through GADS are now used for benchmarking
and analyzing electric power plants.
Currently, the data collected through GADS contains 72 percent of North American generating units with
generating capacity of 20 MW or higher.40 However, many newer combined‐cycle plants are not reporting
information, and a full view of each unit type is not presented. Rather, a sample of all the units in North
America that fit a given, more general category is provided41 for the 2008 to 2010 assessment period.
Generation Key Performance Indicators Three key performance indicators42 used to measure the availability of generating units are Equivalent
Availability Factor (EAF), Net Capacity Factor (NCF), and Equivalent Forced Outage Rate – Demand (EFORd).
In Table 8, the North American fleet average EAF, NCF, and EFORd compared to unit age for all generating
units with a capacity of 20 MW and higher is provided for the years 2008‐2010. For this period, the same
group of units was used, so a true measure of comparable trending could be completed. During the last
three years, the EAF has declined, NCF dropped in 2008 and has partly recovered in 2010, and EFORd has
increased. Overall, the fleet of units reported to GADS is aging overall. On a three‐year average, fossil units
are around 12 years older than the rest of the fleet.
During this three‐year period, the average FOH was 287 hours, average MOH (including extensions to MO)
was 171 hours, and the average POH (with extensions of PO) was 470 hours as shown in Figure 31.
40 http://www.nerc.com/docs/pc/gadstf/GADSTF_Recommendation_Report_02‐18‐2011_FINAL.pdf
41GADS contains 1,500+ units under 20 MW that are not included in this report.
42 http://www.nerc.com/page.php?cid=4|43
Table 8: General Availability Review of GADS Fleet Units by Year*
2008 2009 2010 Average
Equivalent Availability Factor (EAF) 87.52 87.53 86.38 87.15
Net Capacity Factor (NCF) 50.49 46.87 48.30 48.55
Equivalent Forced Outage Rate ‐Demand (EFORd) 5.66 5.57 6.24 5.82
Number of Units ≥20 MW 3,991 3,991 3,991 3,991
Average Age of the Fleet in Years (all unit types) 31.1 31.9 33.0 32.0
Average Age of the Fleet in Years (fossil units only) 42.2 43.2 44.3 43.2
*Includes only GADS reporting units with greater than 20MW generation capability
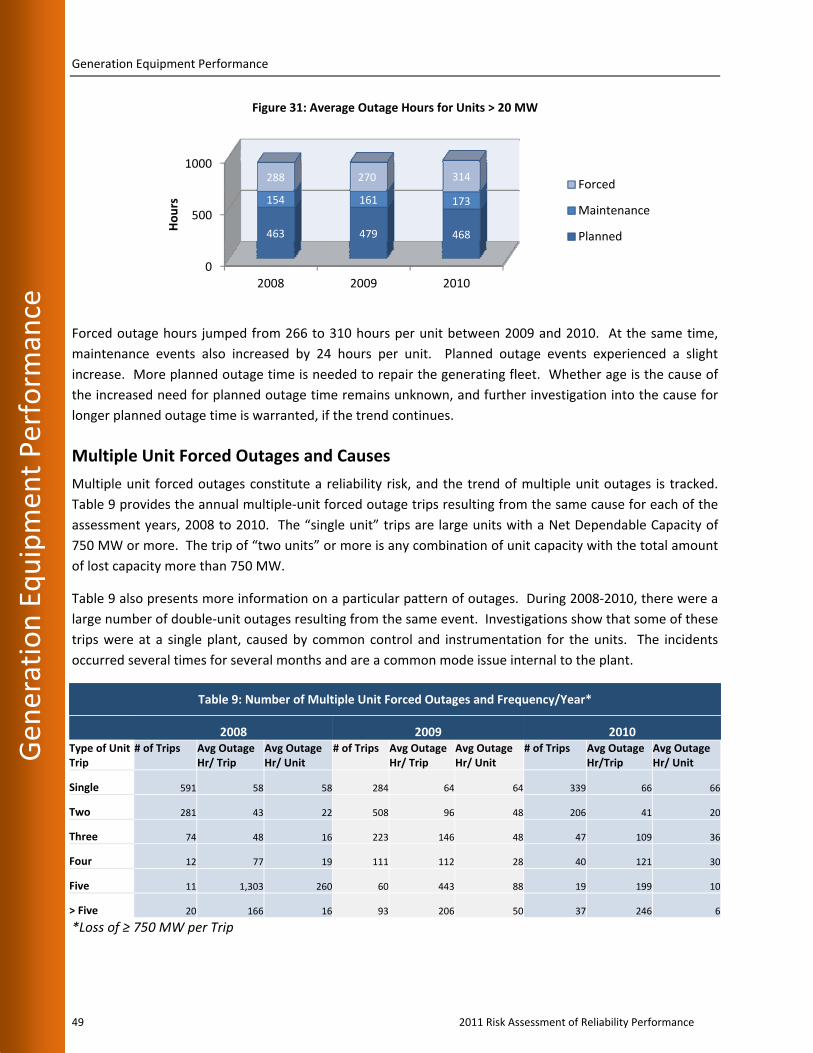
Generation Equipment Performance
49 2011 Risk Assessment of Reliability Performance
Gen
eration Equipmen
t Perform
ance
Forced outage hours jumped from 266 to 310 hours per unit between 2009 and 2010. At the same time,
maintenance events also increased by 24 hours per unit. Planned outage events experienced a slight
increase. More planned outage time is needed to repair the generating fleet. Whether age is the cause of
the increased need for planned outage time remains unknown, and further investigation into the cause for
longer planned outage time is warranted, if the trend continues.
Multiple Unit Forced Outages and Causes
Multiple unit forced outages constitute a reliability risk, and the trend of multiple unit outages is tracked.
Table 9 provides the annual multiple‐unit forced outage trips resulting from the same cause for each of the
assessment years, 2008 to 2010. The “single unit” trips are large units with a Net Dependable Capacity of
750 MW or more. The trip of “two units” or more is any combination of unit capacity with the total amount
of lost capacity more than 750 MW.
Table 9 also presents more information on a particular pattern of outages. During 2008‐2010, there were a
large number of double‐unit outages resulting from the same event. Investigations show that some of these
trips were at a single plant, caused by common control and instrumentation for the units. The incidents
occurred several times for several months and are a common mode issue internal to the plant.
Table 9: Number of Multiple Unit Forced Outages and Frequency/Year*
2008 2009 2010 Type of Unit Trip
# of Trips Avg Outage Hr/ Trip
Avg Outage Hr/ Unit
# of Trips Avg Outage Hr/ Trip
Avg Outage Hr/ Unit
# of Trips Avg Outage Hr/Trip
Avg Outage Hr/ Unit
Single 591 58 58 284 64 64 339 66 66
Two 281 43 22 508 96 48 206 41 20
Three 74 48 16 223 146 48 47 109 36
Four 12 77 19 111 112 28 40 121 30
Five 11 1,303 260 60 443 88 19 199 10
> Five 20 166 16 93 206 50 37 246 6
*Loss of ≥ 750 MW per Trip
0
500
1000
2008 2009 2010
463 479 468
154 161 173
288 270 314Hours
Forced
Maintenance
Planned
Figure 31: Average Outage Hours for Units > 20 MW
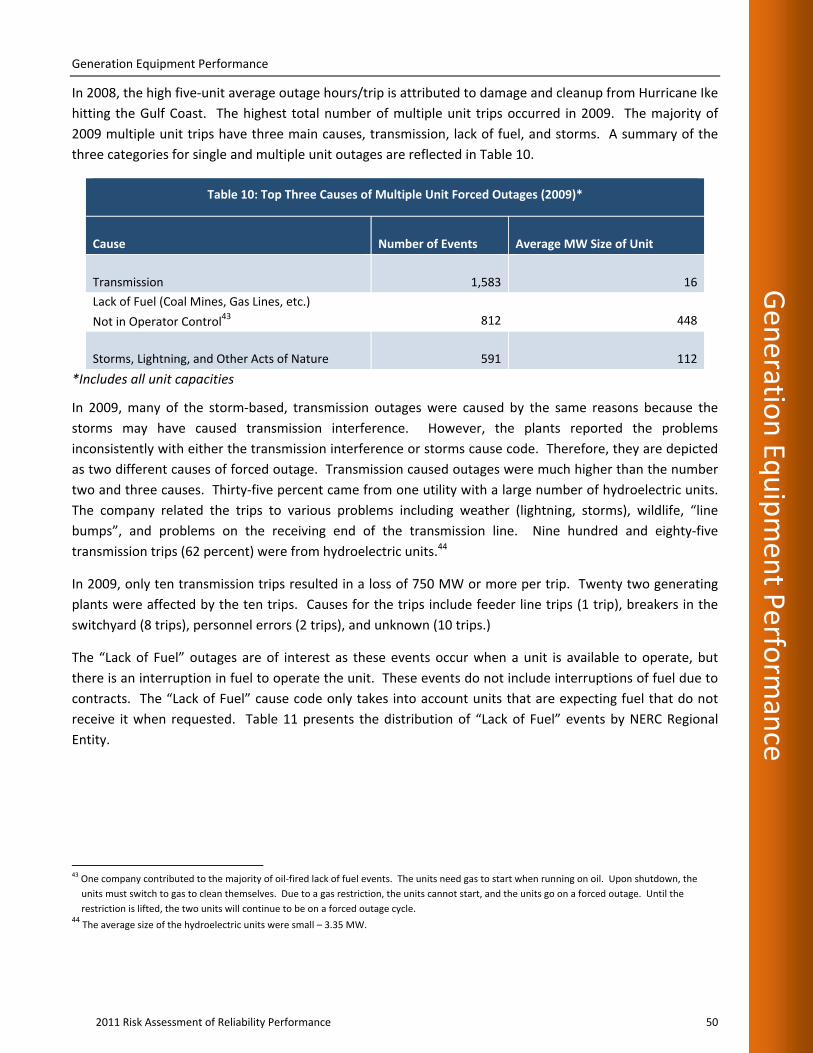
Generation Equipment Performance
2011 Risk Assessment of Reliability Performance 50
Gen
eration Eq
uipmen
t Perfo
rmance
In 2008, the high five‐unit average outage hours/trip is attributed to damage and cleanup from Hurricane Ike
hitting the Gulf Coast. The highest total number of multiple unit trips occurred in 2009. The majority of
2009 multiple unit trips have three main causes, transmission, lack of fuel, and storms. A summary of the
three categories for single and multiple unit outages are reflected in Table 10.
Table 10: Top Three Causes of Multiple Unit Forced Outages (2009)*
Cause Number of Events Average MW Size of Unit
Transmission 1,583 16
Lack of Fuel (Coal Mines, Gas Lines, etc.)
Not in Operator Control43 812 448
Storms, Lightning, and Other Acts of Nature 591 112
*Includes all unit capacities
In 2009, many of the storm‐based, transmission outages were caused by the same reasons because the
storms may have caused transmission interference. However, the plants reported the problems
inconsistently with either the transmission interference or storms cause code. Therefore, they are depicted
as two different causes of forced outage. Transmission caused outages were much higher than the number
two and three causes. Thirty‐five percent came from one utility with a large number of hydroelectric units.
The company related the trips to various problems including weather (lightning, storms), wildlife, “line
bumps”, and problems on the receiving end of the transmission line. Nine hundred and eighty‐five
transmission trips (62 percent) were from hydroelectric units.44
In 2009, only ten transmission trips resulted in a loss of 750 MW or more per trip. Twenty two generating
plants were affected by the ten trips. Causes for the trips include feeder line trips (1 trip), breakers in the
switchyard (8 trips), personnel errors (2 trips), and unknown (10 trips.)
The “Lack of Fuel” outages are of interest as these events occur when a unit is available to operate, but
there is an interruption in fuel to operate the unit. These events do not include interruptions of fuel due to
contracts. The “Lack of Fuel” cause code only takes into account units that are expecting fuel that do not
receive it when requested. Table 11 presents the distribution of “Lack of Fuel” events by NERC Regional
Entity.
43 One company contributed to the majority of oil‐fired lack of fuel events. The units need gas to start when running on oil. Upon shutdown, the
units must switch to gas to clean themselves. Due to a gas restriction, the units cannot start, and the units go on a forced outage. Until the
restriction is lifted, the two units will continue to be on a forced outage cycle. 44 The average size of the hydroelectric units were small – 3.35 MW.
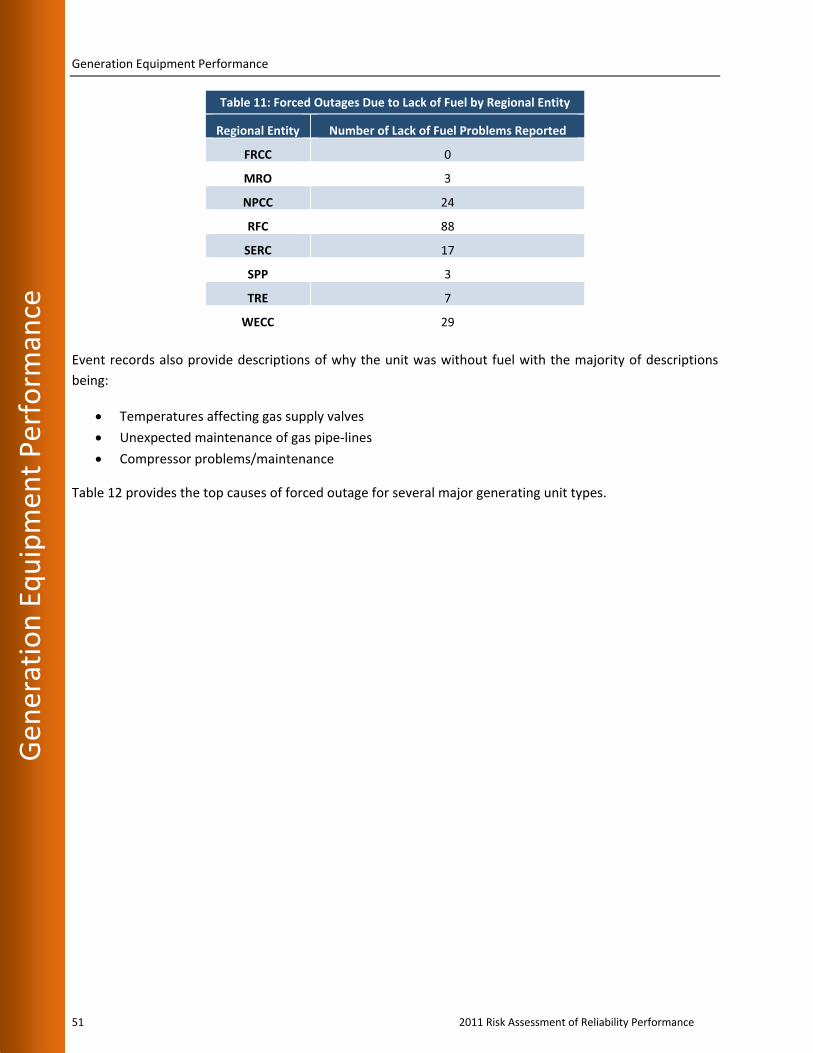
Generation Equipment Performance
51 2011 Risk Assessment of Reliability Performance
Gen
eration Equipmen
t Perform
ance
Event records also provide descriptions of why the unit was without fuel with the majority of descriptions
being:
Temperatures affecting gas supply valves
Unexpected maintenance of gas pipe‐lines
Compressor problems/maintenance
Table 12 provides the top causes of forced outage for several major generating unit types.
Table 11: Forced Outages Due to Lack of Fuel by Regional Entity
Regional Entity Number of Lack of Fuel Problems Reported
FRCC 0
MRO 3
NPCC 24
RFC 88
SERC 17
SPP 3
TRE 7
WECC 29
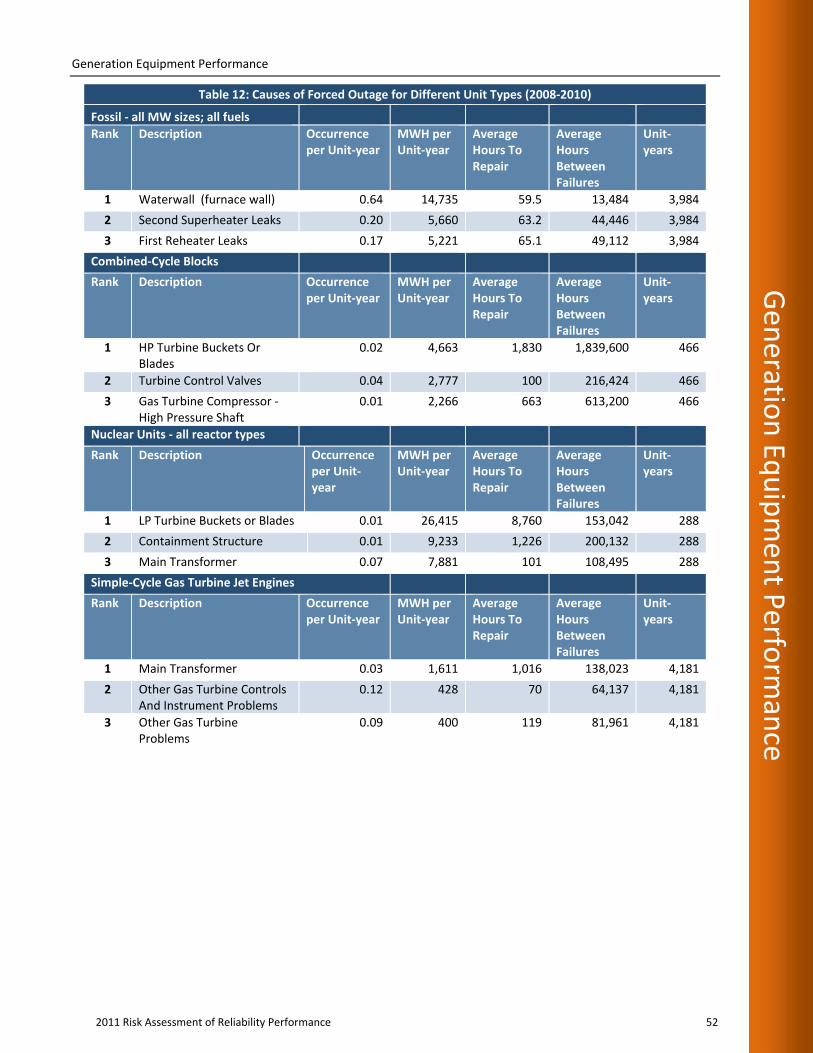
Generation Equipment Performance
2011 Risk Assessment of Reliability Performance 52
Gen
eration Eq
uipmen
t Perfo
rmance
Table 12: Causes of Forced Outage for Different Unit Types (2008‐2010)
Fossil ‐ all MW sizes; all fuels
Rank Description Occurrence per Unit‐year
MWH per Unit‐year
Average Hours To Repair
Average Hours Between Failures
Unit‐years
1 Waterwall (furnace wall) 0.64 14,735 59.5 13,484 3,984
2 Second Superheater Leaks 0.20 5,660 63.2 44,446 3,984
3 First Reheater Leaks 0.17 5,221 65.1 49,112 3,984
Combined‐Cycle Blocks
Rank Description Occurrence per Unit‐year
MWH per Unit‐year
Average Hours To Repair
Average Hours Between Failures
Unit‐years
1 HP Turbine Buckets Or Blades
0.02 4,663 1,830 1,839,600 466
2 Turbine Control Valves 0.04 2,777 100 216,424 466
3 Gas Turbine Compressor ‐ High Pressure Shaft
0.01 2,266 663 613,200 466
Nuclear Units ‐ all reactor types
Rank Description Occurrence per Unit‐year
MWH per Unit‐year
Average Hours To Repair
Average Hours Between Failures
Unit‐years
1 LP Turbine Buckets or Blades 0.01 26,415 8,760 153,042 288
2 Containment Structure 0.01 9,233 1,226 200,132 288
3 Main Transformer 0.07 7,881 101 108,495 288
Simple‐Cycle Gas Turbine Jet Engines
Rank Description Occurrence per Unit‐year
MWH per Unit‐year
Average Hours To Repair
Average Hours Between Failures
Unit‐years
1 Main Transformer 0.03 1,611 1,016 138,023 4,181
2 Other Gas Turbine Controls And Instrument Problems
0.12 428 70 64,137 4,181
3 Other Gas Turbine Problems
0.09 400 119 81,961 4,181

Generation Equipment Performance
53 2011 Risk Assessment of Reliability Performance
Gen
eration Equipmen
t Perform
ance
2008‐2010 Review of Summer and Winter Availability
To address seasonality of unit availability from 2008 to 2010, unit information for the months of June to
September (summer) and December through February (winter) were pooled to calculate forced outage
events.45 Figure 32 shows the average Equivalent Availability Factor (EAF) is three percentage points higher,
and the average Equivalent Forced Outage Rate ‐ Demand (EFORd) is slightly under one‐half of a percentage
point lower in the summer period than in the winter period. The units were more reliable with less forced
events during high‐demand times during the summer season than the winter season. On average, units
have a higher Net Capacity Factor (NCF) of 4.5 percentage points in the summer season.
During the spring season (March‐May), 77 percent of the units took a planned outage (PO) for an average
231 hours, 9.6 days. In fall (October‐November), only 42 percent of the units experienced a PO, and the
average duration was a shorter 134 hours, 5.6 days. Some units took both spring and fall planned outages,
although this is rare. Based on this assessment, generating units are prepared for the summer peak
demand. The resulting availability indicates that spring and fall maintenance was, on average, successful.
This is measured by an increased EAF and a lowered EFORd.
Figure 32: Summer‐Winter Average EAF, NCF, and EFORd (2008‐2010)
Conclusions During 2008‐2010, the average Equivalent Availability Factor (EAF), which measures the overall availability
of generating units, decreased. At the same time, the average Net Capacity Factor (NCF), an indicator of
energy production, decreased in 2009 and rebounded in 2010. The average number of forced outages in
2010 is greater than in 2008, while at the same time, the average planned outage times have slightly
increased. As a result, the Equivalent Forced Outage Rate – Demand (EFORd) also increased illustrating that
more units have experienced forced events during peak‐demand times in 2010, than in the previous two
years. Potentially, with shorter planned outage periods in 2010, there may be less time to repair equipment
45 A study of peak periods was conducted by the NERC Generating Availability Trend Evaluation (GATE) Working Group several years ago, see
http://www.nerc.com/files/Seasonal‐Performance‐Trends.pdf
91.16
53.43
3.96
88.18
48.96
4.41
0 10 20 30 40 50 60 70 80 90 100
EAF
NCF
EFORd
Percent (%)
Winter
Summer
Generation Equipment Performance
2011 Risk Assessment of Reliability Performance 54
Gen
eration Eq
uipmen
t Perfo
rmance
and prevent forced unit outages. Detailed analysis to delve into the root causes of increasing forced outage
rate should be performed.
In the last three years, there has been an increase in Equivalent Forced Outage Rate – Demand (EFORd).
This indicator measures the rate of forced outage events on generating units during periods of load demand.
Forced outage hours jumped from 266 to 310 hours per unit between 2009 and 2010. At the same time,
maintenance events also increased by 24 hours per unit. Planned outage events increased slightly over the
three‐year period. The resulting conclusions from this trend are:
More or longer planned outage time is needed to repair the generating fleet. Whether age is the
cause of the increased need for planned outage time remains unknown, and further investigation
into the cause for longer planned outage time is warranted, if the trend continues.
From 2008 to 2010, there were a large number of double‐unit outages resulting from the same
event. Investigations show that some of these trips were at a single plant, and the trips were caused
by common control and instrumentation for the units.
In addition, there are many multiple unit forced outages due to lack of fuel. The majority of multiple unit
trips have three main causes: transmission, lack of fuel, and storms. With special interest in the forced
outages due to “Lack of Fuel,” additional analysis revealed that 77 percent of the units experiencing
unexpected fuel stoppage are oil‐fired fossil units while gas‐fired units experienced 15 percent of the
unexpected fuel stoppages.
Finally, based on the information assessed, generating units continue to be more reliable during the peak
summer periods.
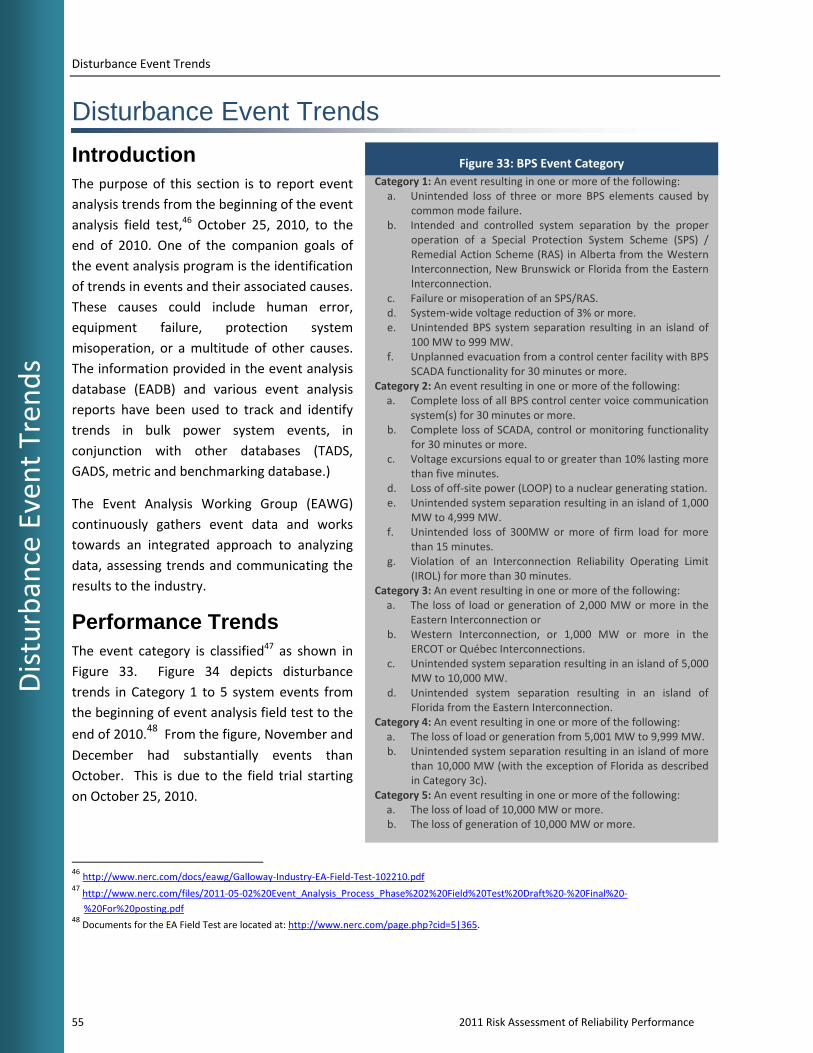
Disturbance Event Trends
55 2011 Risk Assessment of Reliability Performance
Disturbance Event Tren
ds
Category 1: An event resulting in one or more of the following: a. Unintended loss of three or more BPS elements caused by
common mode failure. b. Intended and controlled system separation by the proper
operation of a Special Protection System Scheme (SPS) / Remedial Action Scheme (RAS) in Alberta from the Western Interconnection, New Brunswick or Florida from the Eastern Interconnection.
c. Failure or misoperation of an SPS/RAS. d. System‐wide voltage reduction of 3% or more. e. Unintended BPS system separation resulting in an island of
100 MW to 999 MW. f. Unplanned evacuation from a control center facility with BPS
SCADA functionality for 30 minutes or more. Category 2: An event resulting in one or more of the following: a. Complete loss of all BPS control center voice communication
system(s) for 30 minutes or more. b. Complete loss of SCADA, control or monitoring functionality
for 30 minutes or more. c. Voltage excursions equal to or greater than 10% lasting more
than five minutes. d. Loss of off‐site power (LOOP) to a nuclear generating station. e. Unintended system separation resulting in an island of 1,000
MW to 4,999 MW. f. Unintended loss of 300MW or more of firm load for more
than 15 minutes. g. Violation of an Interconnection Reliability Operating Limit
(IROL) for more than 30 minutes. Category 3: An event resulting in one or more of the following: a. The loss of load or generation of 2,000 MW or more in the
Eastern Interconnection or b. Western Interconnection, or 1,000 MW or more in the
ERCOT or Québec Interconnections. c. Unintended system separation resulting in an island of 5,000
MW to 10,000 MW. d. Unintended system separation resulting in an island of
Florida from the Eastern Interconnection. Category 4: An event resulting in one or more of the following: a. The loss of load or generation from 5,001 MW to 9,999 MW. b. Unintended system separation resulting in an island of more
than 10,000 MW (with the exception of Florida as described in Category 3c).
Category 5: An event resulting in one or more of the following: a. The loss of load of 10,000 MW or more. b. The loss of generation of 10,000 MW or more.
Figure 33: BPS Event Category
Disturbance Event Trends
Introduction The purpose of this section is to report event
analysis trends from the beginning of the event
analysis field test,46 October 25, 2010, to the
end of 2010. One of the companion goals of
the event analysis program is the identification
of trends in events and their associated causes.
These causes could include human error,
equipment failure, protection system
misoperation, or a multitude of other causes.
The information provided in the event analysis
database (EADB) and various event analysis
reports have been used to track and identify
trends in bulk power system events, in
conjunction with other databases (TADS,
GADS, metric and benchmarking database.)
The Event Analysis Working Group (EAWG)
continuously gathers event data and works
towards an integrated approach to analyzing
data, assessing trends and communicating the
results to the industry.
Performance Trends The event category is classified47 as shown in
Figure 33. Figure 34 depicts disturbance
trends in Category 1 to 5 system events from
the beginning of event analysis field test to the
end of 2010.48 From the figure, November and
December had substantially events than
October. This is due to the field trial starting
on October 25, 2010.
46 http://www.nerc.com/docs/eawg/Galloway‐Industry‐EA‐Field‐Test‐102210.pdf 47 http://www.nerc.com/files/2011‐05‐02%20Event_Analysis_Process_Phase%202%20Field%20Test%20Draft%20‐%20Final%20‐
%20For%20posting.pdf 48 Documents for the EA Field Test are located at: http://www.nerc.com/page.php?cid=5|365.

Disturbance Event Trends
2011 Risk Assessment of Reliability Performance 56
Distu
rbance Even
t Trends
Figure 34: Event Category by Month (October 25, 2010 – December 31, 2010)
In addition to the category of the events, an event’s status plays a critical role in data accuracy. By
examining Figure 35, over 80% of the events reported in 2010 have been closed, meaning the category, root
cause, and other important information have been sufficiently finalized in order for analysis to be accurate
for each event. At this time, there is not enough data to draw any long‐term conclusions about event
analysis performance.
Figure 35: Event Count by Status
(October 25, 2010 – December 31, 2010)
Figure 36 shows the top 3 event causes: equipment failure and protection system misoperation. Because of
how new and limited the data is, however, there may not be statistical significance for this result. Further
2
11 12
25
3
7 6
16
1 1
2
0
5
10
15
20
25
30
35
40
45
50
October November December 2010
Event Count Category 3
Category 2
Category 1
10
32
42
0
10
20
30
40
50
60
70
Open Closed Open and Closed
Event Count
Status

Disturbance Event Trends
57 2011 Risk Assessment of Reliability Performance
Disturbance Event Tren
ds
trending of cause codes for closed events and the development of a richer dataset is needed to assess
trends between event cause codes and event counts.
Figure 36: Top 3 Event Counts by Cause Code for all 2010 Closed
Conclusions Due to the relatively new process for events analysis and categorization, more time is required before
conclusive recommendations may be obtained. Further analysis and data will provide valuable statistics in
the future.
9
5 5
0
2
4
6
8
10
Equipment Failure Protection System Misoperation Human Error
Event Count
Cause Codes

Abbreviations Used in This Report
2011 Risk Assessment of Reliability Performance 58
Abbreviatio
ns U
sed in
This R
eport
Abbreviations Used in This Report
Acronym Definition
ALP Acadiana Load Pocket
ALR Adequate Level of Reliability
ARR Automatic Reliability Report
BA Balancing Authority
BPS Bulk Power System
CDI Condition Driven Index
CEII Critical Energy Infrastructure Information
CIPC Critical Infrastructure Protection Committee
CLECO Cleco Power LLC
DADS Future Demand Availability Data System
DCS Disturbance Control Standard
DOE Department Of Energy
DSM Demand Side Management
EA Event Analysis
EAF Equivalent Availability Factor
ECAR East Central Area Reliability
EDI Event Drive Index
EEA Energy Emergency Alert
EFORd Equivalent Forced Outage Rate, Demand
EMS Energy Management System
ERCOT Electric Reliability Council of Texas
ERO Electric Reliability Organization
ESAI Energy Security Analysis, Inc.
FERC Federal Energy Regulatory Commission
FOH Forced Outage Hours
FRCC Florida Reliability Coordinating Council
GADS Generation Availability Data System
GOP Generation Operator
IEEE Institute of Electrical and Electronics Engineers
IESO Independent Electricity System Operator
IROL Interconnection Reliability Operating Limit

Abbreviations Used in This Report
59 2011 Risk Assessment of Reliability Performance
Abbreviations Used in
This Rep
ort
Acronym Definition
IRI Integrated Reliability Index
LOLE Loss of Load Expectation
LUS Lafayette Utilities System
MAIN Mid‐America Interconnected Network, Inc
MAPP Mid‐continent Area Power Pool
MOH Maintenance Outage Hours
MRO Midwest Reliability Organization
MSSC Most Severe Single Contingency
NCF Net Capacity Factor
NEAT NERC Event Analysis Tool
NERC North American Electric Reliability Corporation
NPCC Northeast Power Coordinating Council
OC Operating Committee
OL Operating Limit
OP Operating Procedures
ORS Operating Reliability Subcommittee
PC Planning Committee
PO Planned Outage
POH Planned Outage Hours
RAPA Reliability Assessment Performance Analysis
RAS Remedial Action Schemes
RC Reliability Coordinator
RCIS Reliability Coordination Information System
RCWG Reliability Coordinator Working Group
RE Regional Entity
RFC Reliability First Corporation
RMWG Reliability Metrics Working Group
RSG Reserve Sharing Group
SAIDI System Average Interruption Duration Index
SAIFI System Average Interruption Frequency Index
SCADA Supervisory Control and Data Acquisition
SDI Standard/statute Driven Index
SERC SERC Reliability Corporation

Abbreviations Used in This Report
2011 Risk Assessment of Reliability Performance 60
Abbreviatio
ns U
sed in
This R
eport
Acronym Definition
SRI Severity Risk Index
SMART Specific, Measurable, Attainable, Relevant and Tangible
SOL System Operating Limit
SPS Special Protection Schemes
SPCS System Protection and Control Subcommittee
SPP Southwest Power Pool
SRI System Risk Index
TADS Transmission Availability Data System
TADSWG Transmission Availability Data System Working Group
TO Transmission Owner
TOP Transmission Operator
WECC Western Electricity Coordinating Council
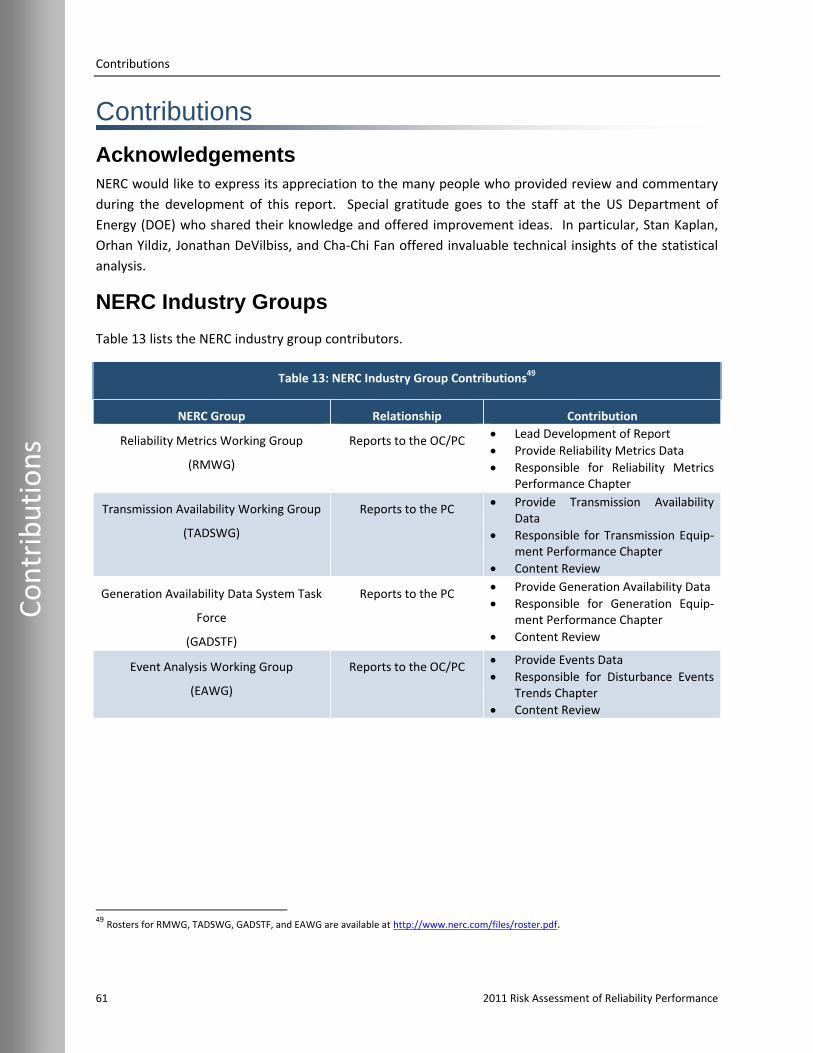
Contributions
61 2011 Risk Assessment of Reliability Performance
Contributions
Contributions
Acknowledgements NERC would like to express its appreciation to the many people who provided review and commentary
during the development of this report. Special gratitude goes to the staff at the US Department of
Energy (DOE) who shared their knowledge and offered improvement ideas. In particular, Stan Kaplan,
Orhan Yildiz, Jonathan DeVilbiss, and Cha‐Chi Fan offered invaluable technical insights of the statistical
analysis.
NERC Industry Groups
Table 13 lists the NERC industry group contributors.
Table 13: NERC Industry Group Contributions49
NERC Group Relationship Contribution
Reliability Metrics Working Group
(RMWG)
Reports to the OC/PC Lead Development of Report
Provide Reliability Metrics Data
Responsible for Reliability Metrics Performance Chapter
Transmission Availability Working Group
(TADSWG)
Reports to the PC Provide Transmission Availability
Data
Responsible for Transmission Equip‐ment Performance Chapter
Content Review
Generation Availability Data System Task
Force
(GADSTF)
Reports to the PC Provide Generation Availability Data
Responsible for Generation Equip‐ment Performance Chapter
Content Review
Event Analysis Working Group
(EAWG)
Reports to the OC/PC Provide Events Data
Responsible for Disturbance Events Trends Chapter
Content Review
49 Rosters for RMWG, TADSWG, GADSTF, and EAWG are available at http://www.nerc.com/files/roster.pdf.

Contributions
2011 Risk Assessment of Reliability Performance 62
Contrib
utio
ns
Regional Entity Staff Table 15 provides a list of the Regional Entity staff who provided the data and content review.
Table 14: Contributing Regional Entity Staff
Name Regional Entity Vince Ordax FRCC John Seidel MRO Phil Fedora NPCC
Jeffery Mitchell RFC Carter Edge SERC
Alan Wahlstrom SPP Curtis Crews TRE
Steven Rueckert WECC
NERC Staff Table 15 provides a list of the NERC staff who contributed to this report.
Table 15: Contributing NERC Staff
Name Title E‐mail Address
Mark Lauby Vice President and Director of Reliability Assessment and Performance Analysis
Jessica Bian Manager of Performance Analysis [email protected]
John Moura Manager of Reliability Assessments [email protected]
Andrew Slone Engineer, Reliability Performance Analysis [email protected]
Jim Robinson TADS Project Manager [email protected]
Clyde Melton Engineer, Reliability Performance Analysis [email protected]
Mike Curley Manager of GADS Services [email protected]
James Powell Engineer, Reliability Performance Analysis [email protected]
Earl Shockley Director of Events Analysis and
Investigations
Ed Ruck Senior Data and Alert Specialist [email protected]
Michelle Marx Administrative Assistant [email protected]
Wei Nan Mo Intern, Performance Analysis [email protected]

Errata
63 2011 Risk Assessment of Reliability Performance
Errata
Errata
October 4, 2011
Page 55, Paragraph 1, Sentence 1: Changed October 25, 2011 to October 25, 2010.
Page 13, Figure 6: Corrected values for figure 6.
Page 13, Table 2: Corrected values for table 2.

2011 Risk Assessment of Reliability Performance 64

the reliability of theto ensure
bulk power systemthe
bulk power systemthe reliability
bulk power systemreliability of the
bulk power system of the


