TO - dtic.mil · Variation of Drag Coefficient and Strouhal Number with Reynolds ... 5.1 Base...
103
UNCLASSIFIED AD NUMBER CLASSIFICATION CHANGES TO: FROM: LIMITATION CHANGES TO: FROM: AUTHORITY THIS PAGE IS UNCLASSIFIED AD231946 UNCLASSIFIED CONFIDENTIAL Approved for public release; distribution is unlimited. Distribution authorized to U.S. Gov't. agencies and their contractors; Administrative/Operational Use; 26 AUG 1959. Other requests shall be referred to Rome Air Development Center, Griffiss AFB, NY. RADC ltr 15 Jun 1983 ; RADC ltr 15 Jun 1983
Transcript of TO - dtic.mil · Variation of Drag Coefficient and Strouhal Number with Reynolds ... 5.1 Base...

UNCLASSIFIED
AD NUMBER
CLASSIFICATION CHANGESTO:FROM:
LIMITATION CHANGESTO:
FROM:
AUTHORITY
THIS PAGE IS UNCLASSIFIED
AD231946
UNCLASSIFIED
CONFIDENTIAL
Approved for public release; distribution isunlimited.
Distribution authorized to U.S. Gov't. agenciesand their contractors;Administrative/Operational Use; 26 AUG 1959.Other requests shall be referred to Rome AirDevelopment Center, Griffiss AFB, NY.
RADC ltr 15 Jun 1983 ; RADC ltr 15 Jun 1983
REPORT MAS SEEN DELIMITED
EARED FOR PUBLIC RELIAIE
DOD DIRECTiVE 5200,20 AND
F -RICTIOHS ARE IMPOSED UPON
AND OISCLOSURE.
IBUTION STATEMENT A
iED FOR PUBLIC RELiA^Ej
ON UNLIHITED.
■«a^mmfmmimm**
AD
UNCLASSIFIED
.^«s
CLASSIFICATION CHANGED
TO: UNCLASSIFIED^, ONFIDENTIAL-
AUTHORItfY: ^1.-/ Ki *z
^TlnJS^ Vhs. f/?DC
SSIFIED

UNCLASSIFI
Reproduced
[Pnned Semices Technical Information Agency ARLINGTON HALL STATION; ARLINGTON 12 VIRGINIA
llCE: WHENGC |ER DATA ARE 1 U A DEF1NITEL lu. S. GOVERN IGATION WHAT; I FORMULATE WINGS, SPECIF WCATION OR O hY OTHER PEi flSSION TO MA 1 MAY IN ANY
> / ERNMENT OR OTHER DRAWINGS, SPECIFICATIONS OR BKD FOR ANY PURPOSE OTHER THAN IN CONNECTION L xTir-76*'0 GOVERNMENT PROCUREMENT OPERATION, ANT THRREEY INCURS NO «ESPONSIBIUTY, NOR ANY
;r*SSS AND THE FACT THAT THE GOVERNMENT MAY 'XFJ?mimiF^' OR m ANYWAY SUPPLIED THE SAID mtiSSL8, OR 0THER DATA IS NOT TO BE REGARDED BY l™??l8?: AS IN ANY MANNER LICENSING THE HOLDER ^Vrx.*?^ CORP0R>vTION' OR CONVEYING ANY RIGHTS OR ^TI «.TURE' VaE OR SELL ANY PATENTED INVENTION tN AY BE RELATED THERETO.
SSIFIED

UNCLASSIFIED
MASSACHUSETTS INSTITUTE CH| TECHNOLOGY
LINCOLN LABORATORY
EXPERIMEHTAL. INVESTIGATION OF WJlPliD-INDUCED
i ■ VIBRATIONS IN ANTENNA M3i«ERS
William Weaver, Jr -1,
Approved ytr£^£c<-****t A
Group Report No. 75-4
vi ^ ^«ft^*'»* t«
:;.: TSÄ i- aimöiOf* ■ ST&tSOfe
ÄtllM©?©« M, VIKOIHIA
.-, |J f := nsss
August 26, 1959
Xh'ftü^a.earch reported in this document was saß'lplteii jointly by the Department of the Arn'ta,,. »Hi e Department of the Navy, and the De ^W1'" sot of the Air Force under Air Force
CoAbwc« P(o.^FI9rR04V5200
LEXINGTON MASSACHUSETTS
UNCLASSIFIIED
ER 75-4
TABLE OF COHTEMTS
Page
I. SUMMARY........... 1
II. HJTRODUCTION 2
2.1 Origin and Background of the Problem , ,., g 2.2 Object !!!!!!! ' ' ' * 4 2.3 Scope .-., , " h 2. k Notation • - ■ ^ .'!.!!!..."!.... °..' 6
III. AERODYNAMIC ASPECTS.. 10
3• 1 Fundamental Considerations in 3• 2 Circular Cylinder in a Fluid Stream .....!!.'!!»!!!!!!"] ' ii 3- 3 The Fluctuating Lift and Drag Forces. r' 3 • ^ Effect of Vibration on Lift Forces ' 15 3. 5 Effect of Protuberances .................. 17
IV. VIBRATION ASPECTS . '
'♦•1 Preliminary Considerations ^, _ 17
4.2 Natural Frequencies of a Prismatical Member with BLaatlc End Connections p0
4. 3 Response of an Elastic System to Vortex Forces 20 4. h Self-Amplification of Vibrations ....'.......]. ' 23
V. TEST PROGRAM AND DESIGN OF COMPONENTS 28
5 • 1 Basic Assumptions PQ
5 • 2 Phases of Test Program !.'!.'!."!!.!] 29 5-3 Design of Test Members and Support Systems ,,,[ 29
VI. MATERIALS AND APPARATUS -,
6.1 Materials ,, 6.2 Test Apparatus ..'!*!.* !!!.*!!!.'!.*!.! 31
VII. TESTING PROCEDURES ^
7.1 Tests on Stationary Cylinders , ,g 7-2 Tests on Spring-Supported Cylinders. '' ^S 7. 3 Tests on Flexural Members 37
VIII. TEST RESULTS
8.1 Genereil
8.2 Results of Tests on Stationary Cylinders ' i *! i!."!!!.'!!.'!!! 37 8.3 Results of Tests on Spring-Supported Cylinders 8.4 Results of Tests on Flexural Members
38 39
8.5 Correlation among the Results of the Three Phases"^nd" Compari '■1th Previously Published Information , ' OQ
Lsons
A- 1442

ER 75-^ 11
TABLE OF CONTENTS
Page
IX. DESIGN CRITERIA, PROCEDURES, AND APPLICATIONS ^3
9-1 General 43 9-2 Design Criteria , hk 9- 3 Analysis Charts. kk 9.h Procedure for Design against Lateral Vibrations 57 9.5 Analysis of Existing Structures 57
X. DISCUSSION 6l
10.1 Validity of Initial Assumptions. 6l 10.2 Vibrations In Subcrltlcal Range 62 10. 3 Vibrations In Supercritical Range 62 10.4 Discussion on Use of Spoilers 62
XI. CONCLUSIONS AND RECOMMENDATIONS. 63
11.1 Conclusions. 63 11.2 Recommendations. 63 11. 3 Recommendations for Further Research 6k
BIBLIOGRAPHY. 65
APPENDICES
A. Phase A Test Results 67 B. Phase B Test Results. 78 C. Phase C Test Results. 89

ER 75-4 lil
LIST OP ILLUSTRATIONS
FIGURES
3.1
3-2
3.3
3.^
3-5
3-6
3.7
h.l
8.1
8.2
9.1
A-l
A-2
A-3
A-h
A-5
A-6
A-7
A-8
A-9
A-10
A-ll
A-12
A-13
B-l
Flow for Very Low N„
Flow for N0 < UO, n
Page
. 12
. 12
Flow for ^0 < 1^ < 3 x 10⁵ t 12
Flow for 3 x 10⁵< NR
Variation of Drag Coefficient and Strouhal Number with Reynolds Number for a Circular Cylinder.
Vortex Geometry Behind Cylinder ,
Dimensional Increase in Vortex Street Due to Vibration.
Fundamental Frequencies of Various Members in Terms of Frequency of Pinned Member
Comparison of Results of Present Values of CL. with Previously Reported Experimental Values of C^ for Stationary Cylinders
Comparison of Ng Curves with Published Values..................
Schematic Diagram of G. C, I. Antenna
Transducer Calibration - Sanborn Oscillograph. ,,.,
Oscillograph Record for Stationary 5"^ Bare Cylinder (Subcritical Reynolds Number).
12
13
Ik
16
19
40
42
59
68
68
Oscillogrsph Record for Stationary 5"^ Cylinder with 8 Windings 69
Oscillograph Record for Stationary 5"^ Cylinder with Spoilers.. 69
Oscillograph Record for Stationary 10"^ Bare Cylinder (Supercritical Reynolds Number).
Oscillograph Record for Stationary 10"^ Cylinder with 16 Windings
Values of C^ for Bare Cylinders and with Spoilers..............
Summary of C_ curves.•..•..............,,.,.,,,..,.,..,.,,,
Combined Values of N for Bare Cylinders................. S 0000000000
Values of N, for Cylinders with 8 and 16 Windings..............
Influence of Number of Windings on Spoiler Effectiveness - 3"<6 Cylinder. ...........................;.
Influence of Winding Diameter on Spoiler Effectiveness - Vd Cylinder ..,.,
Influence of Pitch on Spoiler Effectiveness - 6"^ Cylinder.,...
Oscillograph Record of Decay Curve for 6"^ Spring-Supported Cylinder....................... 00o>.to „
70
70
71
72
73
74
75
76
77
79

ER 75-^ iv
LIST OF ILLUSTRATIONS
FIGURES page
B-2 Oscillograph Record for 6V Spring-Supported Bare cylinder...... 80
B-3 Oscillograph Record for 6'V Spring-Supported Cylinder with 8 Windings , ;,, 8l
B-4 Oscillograph Record for 6'y Spring-Supported Cylinder with Spoilers 02
B-5 Response of 5V Cylinder - k = 201 lb/in .. 83
B-6 Values of Standard C^ - Bare Cylinders................... ... 6k
B-7 Values of Standard (L - Cylinders with Numerous Windings........ 85
B-8 Values of N - Bare Cylinders. 86 s
B-9 Values of Ns - Cylinders with Numerous Windings................. 8?
B-10 Incremental Load Factors for Oscillating Cylinders ..... . 88
C-1 Oscillograph Record of Decay Curve for Member MUhl............... 90
C-2 Oscillograph Record for M4bl (Bare)............................. 90 c-3 Oscillograph Record for M4bl (with Spoilers over lOO^t of Length) 91
C-k Oscillograph Record for M4bl (with Spoilers over kOfr of Length). 91
C-5 Response of Member M2c 92
C-6 Values of Standard CL. - Bare Members 93
C-7 Values of Ns for First Mode - Phase C........................... 9U
C-8 (ILF) for Vibrating Members. 95
PHOTOGRAPHS
2.1 28 ft. Kennedy Paraboloid Reflector. 3
5.1 Base Layout - Phase A (3V Cylinder in Place)............. .7.... 30
5-2 h"tf Spring-Supported Cylinder 32
5-3 Members Ml 33
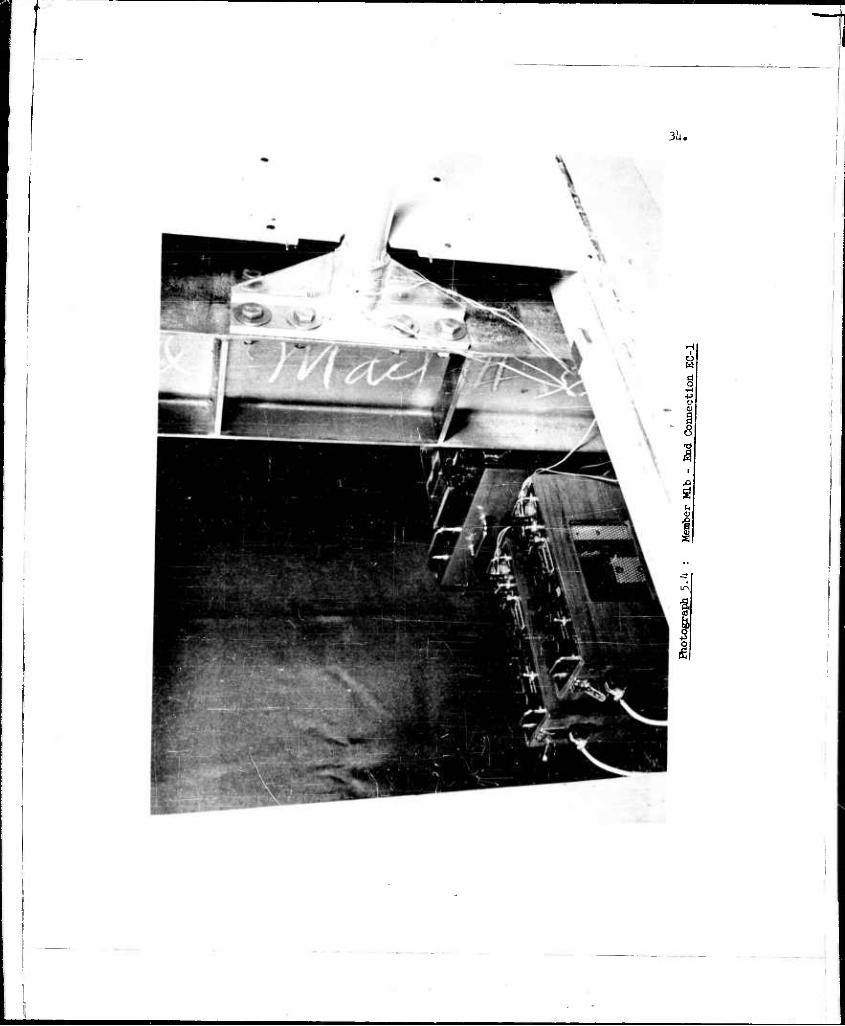
5.^ Member MLb - End Connection EC-1................................ 34
9-1 120' x 30' G.C.I. Antenna Structure..... 58 ANALYSIS CHARTS
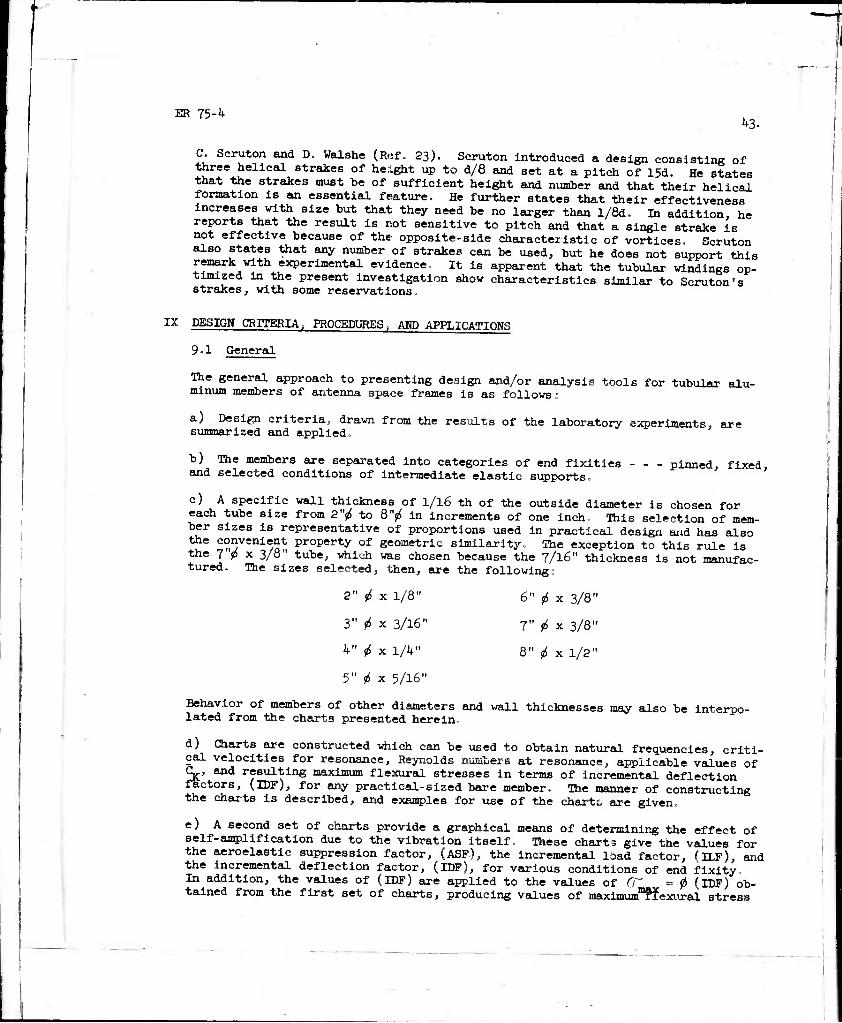
AC-al Maximum Plexural StrfiBR at Ends of Fixed Aluminum Tube Due to Vibration. 1+5
AC-a2 Maximum Flexural Stress at Ends of Semi-Fixed (f=2.10 f ) Tube Due to Vibration. ...?....,.,. k6
AC-a3 Maximum Flexural Stress at Center of Pinned Aluminum Tube Due to Vibration. .... U7
AC-ah Maximum Flexural Stress in Centilever Aluminum Tube Due to Vibration 48
AC-bl and 2 (TDF) for Fixed Members...................................... 51 AC-b3 (IDF) for Pinned Members. 52 AC-b4 (IDF) for Cantilever Members. 53
ER 75-4
1
I. SUMMARY
Steady wind flow acting upon a structural member induces lateral vibrations in the member due to the generation of lift forces associated with the shedding of vortices from alternating sides« When the frequency of vortex shedding is approxi- mately equal to the natural frequency of the member, resonant vibrations result which are amplified to a certain extent by the self-exciting nature of the oscil- lations. Stresses caused by severe and frequent vibrations have resulted in
\ failures in a variety of types of structures.
The present investigation deals with the generation and suppression of wind- induced vibrations in the circular aluminum tubular members of large radar antenna apace frames. Failures and undesirable vibrations have occurred in individual members of this type of facility, and a means of analyzing and reducing their response is required.
The experimental portion of the investigation consists of wind tunnel tests on stationary cylinders, oscillating cylinders, and vibrating flexural members. The significant results of the^test program are the following; (l) a continuous curve for the RMS value of the Karman lift coefficient was obtained for the range of Reynolds numbers of interest in this investigation, (2) a curve expressing the extent of the self-amplification characteristics of members was determined, (3) a system of aerodynamic spoilers was tested and optimized, and (h) non-dimensional Strouhal frequencies were evaluated and compared with established values.
Experimental results are combined with theoretical developments to give a semi- empirical solution to the response problem In the form of graphical analysis charts. Design and analysis procedures are outlined, and the use of optimised spoilers is recommended for applicable cases.
K Field tests are recommended for the purpose of obtaining information on damping in existing structures and for the advantage of studying vibration phenomena under atmospheric conditions.
(
KR 75-4
II. IMTRODUCTIOH
2.1 Origin and Background of the Problem
A steady wind flow acting upon a cylindrical structural member Induces lateral vibrations In the member due to the formation of vortices on alter- nating sides of the member. These vortices are formed and shed from opposite sides of the member at a regular frequency, depending upon the velocity of the wind, and as a result alternating lateral forces are exerted upon the member by the fluid motion. When the frequency of vortex shedding (and hence, the frequency of the alternating forces) is approximately equal to the frequency of one of the normal modes of vibration of the member, a condi- tion of resonance results. If the structural damping and the stiffness of the member are small and the wind remains steady, large amplitudes of vibra- tion will be developed.
Theae vibrations possess the ability of self-anpllflcation and for this reason may be considered to be self-exciting for a limited range of wind velocities at and around the resonant, or "critical", wind velocity. Ihis self-amplification has an upper limit of vibratlonal stability, however, so that the vibrations produced by the wind are not catastropic in nature. Oscillation persists for a certain range of wind speed above the critical velocity and reaches a maximum amplitude near the top of the range.
liiere are several methods by which vibrations of this type can be suppressed.
a) By increasing the flexural stiffness of the member so that its critical velocity is above the range of moderate winds.
b) By reducing the effective length of the member through the Introduction of intermediate struts.
c) By use of damping devices to restrict the amplitude of vibration.
d) By attaching "spoilers" to the member which serve to disrupt the flow near the surface and to interfere with the regular formation of vor- tices, thereby destroying the cause of the vibrations.
In the past, the first three methods of suppressing wind-induced vibrations have been used repeatedly. "Hie solution to this problem by the method of applying spoilers to the surface of the member has not, in general, been attempted in civil engineering structures because of a lack of information concerning their design and their effectiveness.
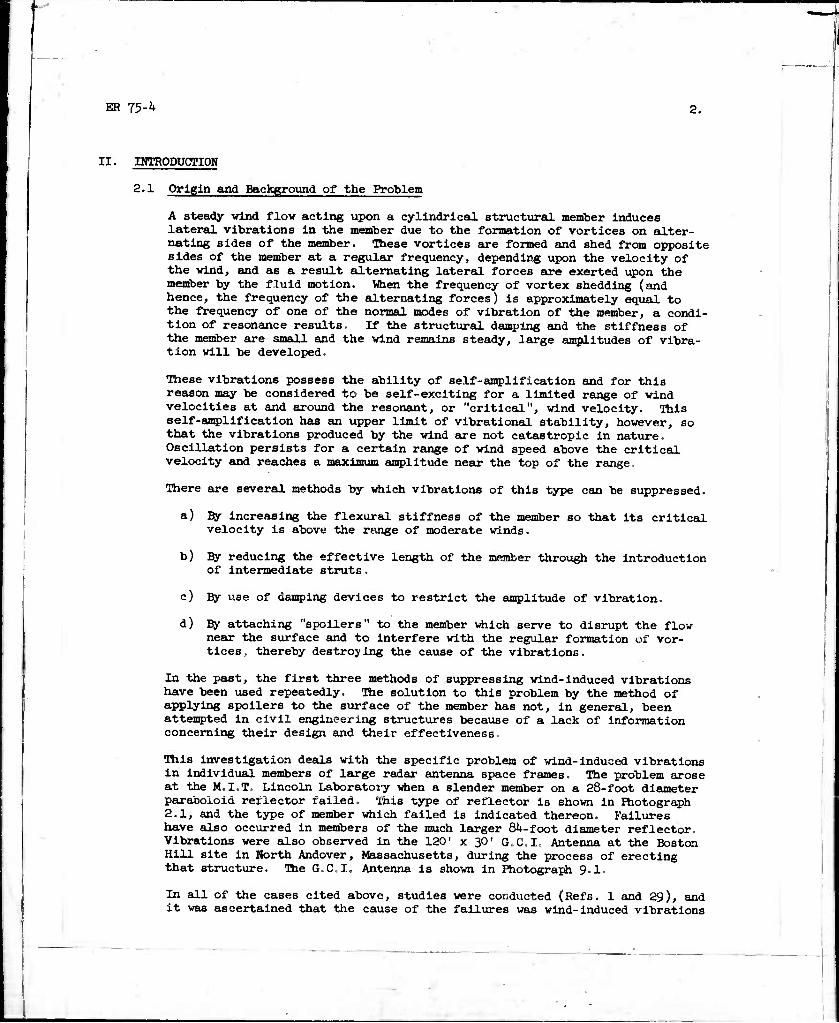
Bxis investigation deals with the specific problem of wind-induced vibrations in individual members of large radar antenna space frames. The problem arose at the M.I.T. Lincoln Laboratory when a slender member on a 28-foot diameter paraboloid reflector failed. This type of reflector is shown in Fhotograph 2.1, and the type of member which failed is indicated thereon^ Failures have also occurred in members of the much larger 84-foot diameter reflector. Vibrations were also observed in the 120' x 30' G.C.I. Antenna at the Boston Hill site in North Andover, Massachusetts, during the process of erecting that structure. The GoCI« Antenna is shown in Photograph 9.1.
In all of the cases cited above, studies were conducted (Refs. 1 and 29), and it was ascertained that the cause of the failures WEIS wind-induced vibrations
Photograph 2.1» 28 ft, Kennedy Paraboloid Reflector
ER 75-'+ 4,
due to von Karman vortex forces The failures occurred in slender tubular members subjected to moderate winds, and they appeared to be fatigue type failures in weld-heated areas at points of maximum flexural stress» In each case the problem was remedied by adding additional bracing pieces for the purpose of restraining lateral vibrations in the more flexible members of the structures.
A preliminary wind tunnel test was carried out (Ref, 30) on a small diameter flexural specimen of the type in which failures have occurred. The purposes of the pilot experiment were to test the effectiveness of an arbitrary arrange- ment of spiral spoilers and to determine the feasibility of conducting a mo^-e extensive wind tunnel investigation of this nature As a result of the pre- liminary test, the present experimental project was initiated. A fully de- tailed report of this investigation was presented In the form of an Sc. D. thesis (Ref. 31) in the Department of Civil and Sanitary Engineering at M.I.T. and the present report represents a condensed summary of that thesis.
2.2 Object
One of the primary objectives in the current investigation is to evaluate an experimental curve for the variation of the Karman coefficient, CL., with Reynolds number. The range of Reynolds numbers of interest in this experi- ment is approximately from 10 to 10 , A continuous curve for CL. in the re- gion of interest is a basic necessity for the establishment of dlsign criteria for wind-Induced vibrations
A second objective of this project is to study the self-amplification aspect which characterizes wind-induced vibrations of this type Wzh sufficient experimental data, involving variations in all of the parameters affecting the semi-empirical solution to the problem can be developed.
Strouhal numbers are evaluated In this investigation for the purpose of com- paring with well-established values previously published in engineering and scientific literature. The extent of agreement of Strouhal numbers with pub- lished values may be considered to be a measure of the validity of other aspects of these experiments.
Another primary purpose for these experiments is to test and optimize a system Of spoilers attached to the surfaces of a variety of member sizes. The func- tion of these spoilers is to interfere with the periodic circulation and forma- tion of vortices around the periphery of a circular cylinder. The measure of their effectiveness is ^the ratio of the Karman coefficient for the cylinder with spoilers to the Karman coefficient for the bare member.
Spoiler effectiveness = CL^/O—
Finally, the ultimate objective in this project is to evolve design criteria and procedures for analysis of antenna structures with resrae^t to the ^pno-^ of severe and frequent vibrations due to wind. Optimum spoiler designs axe" specified, and their application to members of new and existing structures is delineated. It is intended that the criteria and procedures developed in this paper shall be applicable for all or most of the practical member sizes vhich are used in the design of antenna space frames.
2.3 Scope
This investigation is limited to a study of tubular aluminum members in the

1 ER 75-4
form of circular cylinders, follows:
The types of test members considered are as
a) Stationary rigid 'body cylinders.
b) Spring-supported rigid body cylinders.
c) End-supported flexural members - fixed.
d) Knd-supported flexural members - partially fixed.
e) End-supported flexural members - pinned.
f) Cantilever flexural members.
The cylinder and member diameters range from l^V to 10"^,
The spoiler configuration selected for these experiments consists of staall diameter tubing attached to the surface of the member and wund in a helical pattern over all or part of the length of the member. This particular'con- figuration was chosen because of the ease with which windings can be installed on a cylindrical member and because of the fact that a helical pattern of spoilers is not sensitive to the direction of the wind. The variable param- eters for optimization of spoilers of this kind were the following:
a) Number of windings.
b) Size of windings.
c) Pitch of windings.
d) Portion of length over which windings are applied.
The appropriate range of Reynolds numbers was obtained by means of subjectin« standard diaaeter test members and cylinders to the full range of wind speeds m a wind tunnel with a velocity range of 10 to 100 raph.
In tests on vibrating members, stiffnesses and structural damping were varied
^aluated."13111161' ^ ^ ^^ 0f theSe parameters uPon toe response may be
The test program was divided into three main phases. Phase A consisted of tests on stationary cylinders mounted in the wind tunnel with a sensitive
n^hf^^1" lnt0 ^e suPPorts in such a manner that direct measurements ™e lift forces on the cylinders were obtained. Spoiler optimization was
carried out on the stationary cylinders. Phase B dealt with the response of spring-supported cylinders oscillating as rigid bodies in the wind stream- The third phase was a study of the response of flexural members vibrating'in :T:Z^^T Unrfr the influence of a steady wind. Each of these phases con- ™ *£ ^formation on the lift coefficient, the self-amplification phenom- enon, the Strouhal number, and the spoiler optimization.
ER 73-k
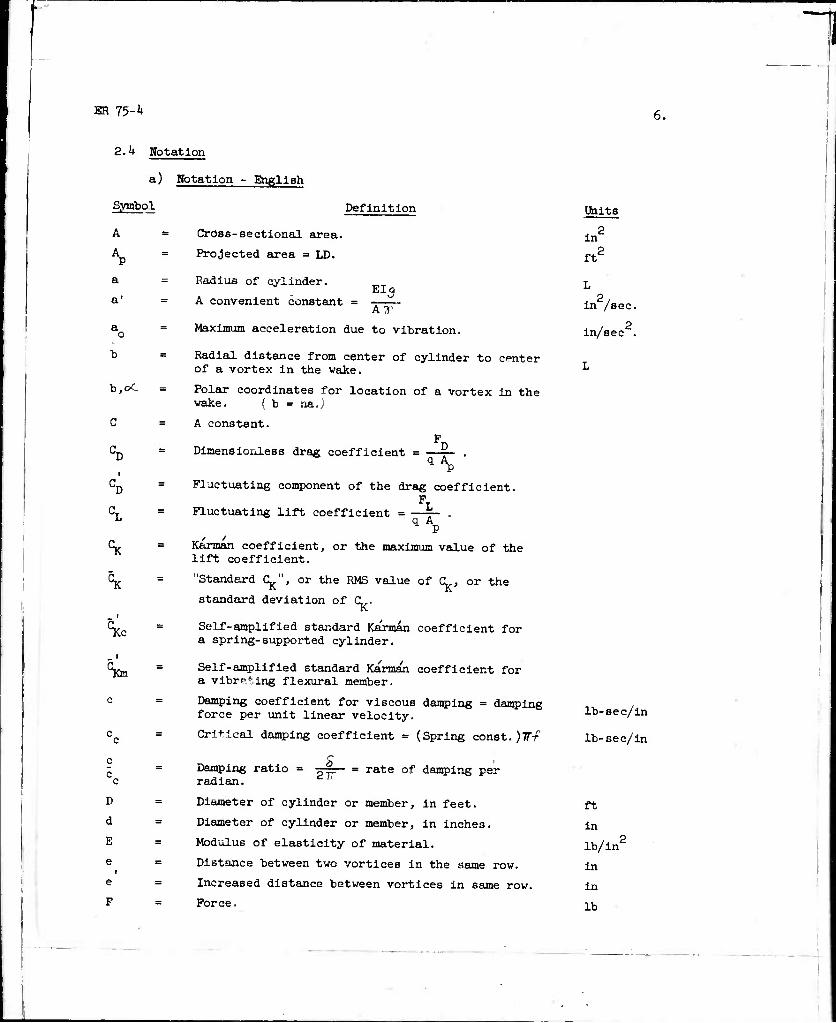
2.k Notation
a) Notation
Symbol
English
b
b,oC
C
CD
i
CD
CL
_ i
Son
c
°c D
d
E
e i
e
F
Definition
Cross-sectional area.
Projected area = LD.
Badlus of cylinder.
A convenient constant = AT
Maximum acceleration due to vibration.
Radial distance from center of cylinder to center of a vortex in the wake.
Polar coordinates for location of a vortex in the wake. ( b = na.}
A constant. F
Dimensionless drag coefficient = —=— . qAp
Fluctuating component of the drag coefficient. P
Fluctuating lift coefficient 1 A,
Karman coefficient, or the maximum value of the lift coefficient.
"Standard C^", or the RMS value of CL., or the
standard deviation of CL..
Self-amplified standard Karman coefficient for a spring-supported cylinder.
Self-amplified standard Karman coefficient for a vibrating flexural member.
Damping coefficient for viscous damping = damping force per unit linear velocity.
Critical damping coefficient = (Spring const. )7r-f
Damping ratio = radian. 27r = rate of damping per
Diameter of cylinder or member, in feet.
Diameter of cylinder or member, in inches.
Modulus of elasticity of material.
Distance between two vortices in the same row.
Increased distance between vortices in same row.
Force.
units
m2
ft2
L
in /sec.
in/sec .
L
lb-sec/in
lb-sec/in
ft
in
lb/lnS
in
in
lb
I
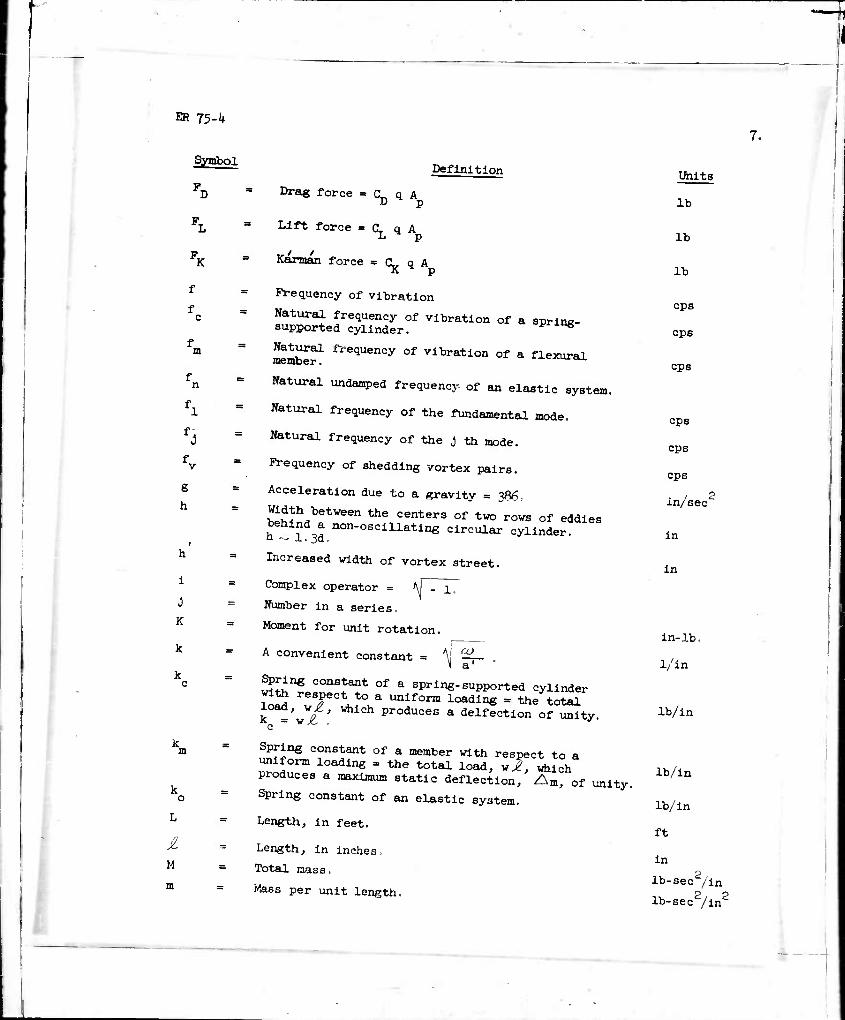
ER 75-4
Symbol Definition
f
f
n
g h
i
J
K
k
k
m
L
M
m
Drag force = CL q A -Ö - "p
Lift force » CL q A
Kannan force = c q A
Frequency of vibration
Natural frequency of vibration of a sprin«- supported cylinder. »i'-fing
mertbl?1 ri'equency of nitration of a flexural
Natural undaaiped frequency of an elastic system.
Natural frequency of the fundamental mode.
Natural frequency of the J th mode.
Frequency of shedding vortex pairs.
Acceleration due to a gravity = 386.
hih^betWeen the centers o* two rows of eddies behind a non-oscillating circular cylinder. Q — J.. ja.
Increased width of vortex street.
Complex operator = AJ r~i7
Number in a series.
Moment for unit rotation.
A convenient constant A fJj
Spring constaiat of a spring-supported cylinder with respect to a uniform loading = the total k = w£ ' Which Produ=es a delfectlon of unity.
Spring constant of a member with respect to a uniform loading = the total load, wi, which produces a maximum static deflection. Am, of unity.
Spring constant of an elastic system.
Length, in feet.
Length, in inches.
Total mass.
Mass per unit length.
Units
lb
lb
lb
cps
cps
cps
cps
cps
cps
. / 2 in/sec
in
in
in-lb.
l/in
lb/in
lb/in
lb/in
ft
in
lb-sec2/in
lb-sec2/in2
-I

ER 75-4
Symbol
m m
&,
N
n
P
P
r
r,e t
V
v
V er
Definition
SlLSer."11" leaeth 0f a sPrln«-^PPorted
Mass per unit length of a flexural member.
Beynolds number = ^5 = JQQ vd
fD fd v -1775^'
Self-reduced Strouhal number.
Strouhal number = — =
A dimensional ratio.
Concentrated load.
Sn^r'6 = alr PreS8Ure »bore or belov S^SS C pressure actin8 on a surface or a projected area.
Stagnation pressure = - P v2
2 a '
Modulus of the complex number re10 .
Polar coordinates of any point In a region. Time.
Uniform velocity of undisturbed flow.
Velocity in miles per hour.
Critical wind velocity.
vlirawJn?0rreSPOndlng t0 ^^ ^^^ Of
Velocity of vortices In street.
Weight of spring-supported cylinder.
Load per unit length.
w magnified by (DLF) at resonance.
Effective lateral loading per unit length due
Sth0v !Xv ^ ^ a 8t*tion«y cyjfnder " vp-
Orthogonal coordinate denoting deflection at any point, x, along a member
Amplitude of vibration.
Amplitude of vibration at point of maxUnum deflection on a flexural member.
Uhlts
lb-sec2/in2
lb-sec2/in2
lb
lb/ft2
lb/ft2
L
sec
fps
mph
mph
mph
LT-1
lb
lb/in
lb/in
lb/in
in
in
in
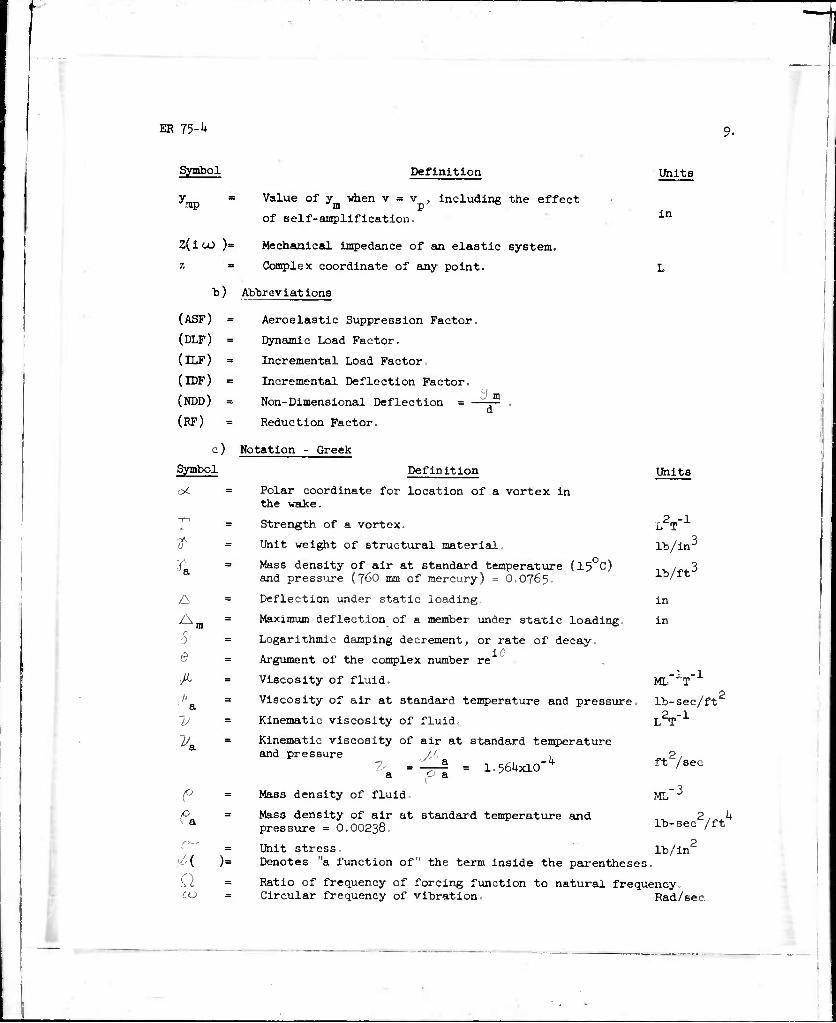
ER 75-^
Symbol
.•ap
Definition
Value of y when v = v. , Including the effect
of self-ainpllficatlon.
Z(lcü )= Mechanical Impedance of an elastic system.
z = Complex coordinate of any point.
b) Abbreviations
(ASF) .
(DLF) =
(ILF) ■ (IDF) =
(NDD) ■ (RF) =
c)
Symbol
T-I i '
A o
m
(5
A /' > a
ly *
V* -
1° fa = /- y-. ^
Q CO »
Aeroelastlc Suppression Factor.
Dynamic Load Factor.
Incremental Load Factor.
Incremental Deflection Factor.
Non-Dimensional Deflection = -
Reduction Factor.
y_m d
Notation - Greek
Definition
Polar coordinate for location of a vortex in the wake.
Strength of a vortex.
Unit weight of structural material,
Mass density of air at standard temperature (150C) and pressure (760 mm of mercury) = 0.0765-
Deflection under static loading
Maximum deflection of a member under staxic loading.
Logarithmic damping decrement, or rate of decay. 16
Argument of the complex number re
Viscosity of fluid.
Viscosity of air at standard temperature and pressure.
Kinematic viscosity of fluid,
Kinematic viscosity of air at standard temperature and pressure
2' J-'-
1.564x10 -h
Mass density of fluid
Units
in
Units
LV1
lb/in •;
lb/ft"'
m
in
ML. T -1
lb-sec/ft'
LV1
ft2/sec
ML ■J
lb-sec2/ft
2
Mass density of air at standard temperature and pressure = O.OO238.
Unit stress. Ib/in^ Denotes "a function of" the term inside the parentheses.
Ratio of frequency of forcing function to natural frequency. Circular frequency of vibration. Rad/see

»»*»■;*'
ER 75-4 10.
III. AERODYWAMIC ASPECTS
3-1 Fundamental Considerations
a) Definitions
Lift and dra« forces on a bluff obstacle may be defined In terms of the stagnation pressure, q , vhlch represents the velocity pressure head In the
q = iev2
Form factors, called non-dimensional lift and drag coefficients, relate the lift and drag forces acting on the body to the stagnation pressure and the surface area (or a projected area) of the body. suriace
Non-dimensional drag coefficient = CL «3*,
Non-dimensional lift coefficient = C = 1J lA.
The Reynolds number is a dimensionless number expressing the ratio, or relative
Sc2a^f'v10f ^e^nerial f0rCeS (0r velocity Pressure forces) to the frlctional forces vhlch a fluid stream exerts upon a body.
Reynolds number = N TO 7^
The Strouhal number is a dimensionless number vhlch represents the fact that a flov phenomenon is unsteady and periodic in its nature.
Strouhal number = N = fD
h) Dynamic Similarity
The method of dimensional analysis (Ref. 3) may be used to obtain model relation- ships for the problem of wind-induced vibrations. For a model (denoted by sub- script 2) which is geometrically similar to a prototype (denoted by subscript l) and constructed of the same material, the following expressions may be obtained
L2=nL1
I2 = n ^ MOB
n2F,
= n Mo: ,inl
1 la o2 n ol
f -if 2 n II
E2 = E1
A2 = nA;,
m2 = n »1
S2 =5!
ER 75-k 11.
It is evident that for the conditions determining the foregoing relationships the Strouhal numbers for model and prototype will be the same. The Reynolds number will "be the same only if a fluid medium is used which has a kinematic viscosity of
V2 = n -Uv
Therefore, in testing the resonant response of geometrically similar models in air, equal Reynolds numbers cannot be practically attained. "Incomplete dynamic similarity" may be obtained, however, by testing models in air in the range of Reynolds numbers where the Strouhal number is fairly constant and where the value of CL. Involved may be corrected for the influence of the Reynolds number.
3.2 Circular Cylinder in a Fluid Stream
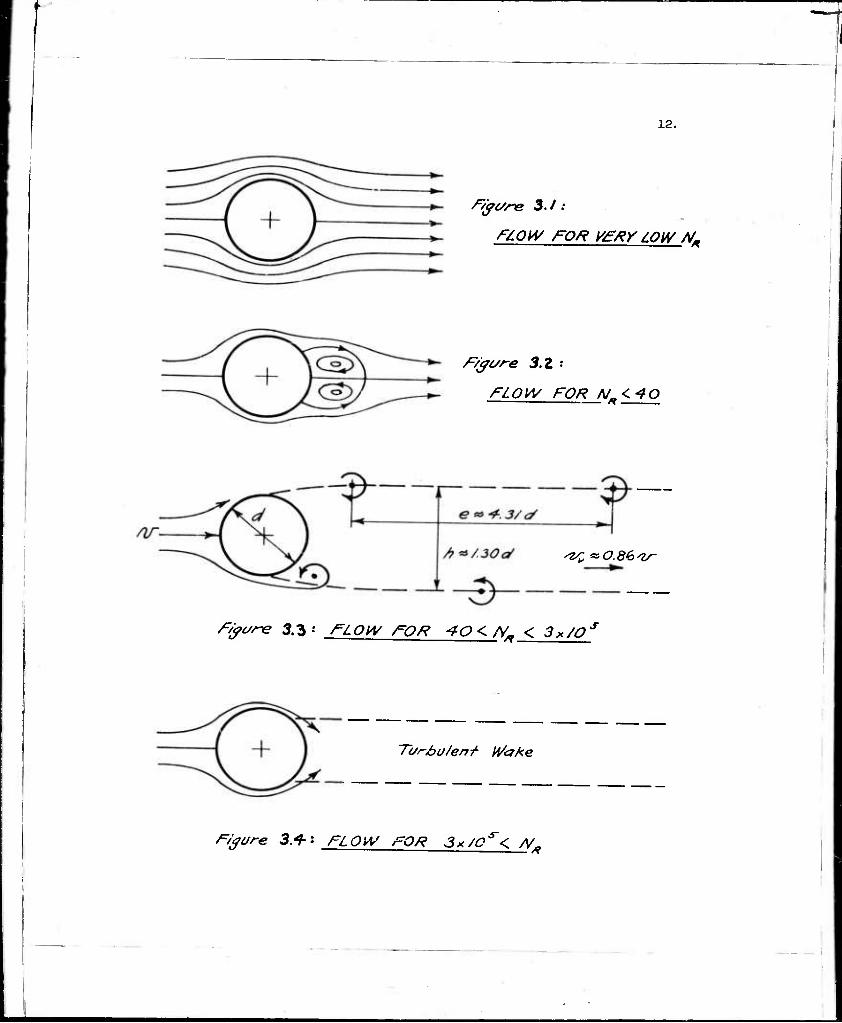
The fluid flow in the inmediate vicinity of a circular cylinder in the stream takes a variety of forms, depending upon the value of the Reynolds number. At extremely small Reynolds numbers the flow picture is very much like ideal flow, as shown in Figure 3'1" At somewhat higher values, up to N_ = kOj the flow separ- ates from the surface, as In Figure 3.2, and forms two symmetrical, stationary vortices (Refs. 11 and 15)= Above N = J+0, however, the stationary vortices be- come distorted and unstable, and an asymmetrical flow condition develops wherein vortices are formed at opposite sides of the cylinder. Tfeese vortices grow in strength in the vicinity of the cylinder, are detached from the cylinder, and move down stream with the flow in an alternating pattern. The flow in -the vortex street is viscous from N_ = kO to approximately 150, and the vertices decay by viscous diffusion (Ref, 20). The range from FT = 150 to 300 is a transition range in which the flow changes from laminar to turbulent in tne free vortex layer which separates from each side of the cylinder (Ref. 20). Above iL = 300, the flow be- comes turbulent at the point of separation. In this range, called the irregular range, the vortex shedding is periodic, but the velocities fluctuate in an irregu- lar fashion because of the turbulence in the flow. Hie result of these fluctua- tions is that the amplitudes of the lift forces are more or less random^ and the randomness becomes more pronounced with Increasing Reynolds numbers.
The vortex street behind a cylinder is commonly idealized as in Figure 3.3* which incorporates the stability criteria derived by Th. von Karman 'Ref. 13-)o This configuration is applicable from IL. - 40 to approximateiy N_ = 3 x 10 . At or near the latter Reynolds number the flow in the boundary layer on the forward portion of the cylinder changes from laminar to turbulent, and the separation points move rear- ward on the cylinder. There follows an abrupt drop in the drag coefficient, a sharp rise in the Strouhal number, and the wake becomes narrower and apparently aperiodic. Regular vortex formation is no longer visible, and the flow is highly turbulent. The flow picture is Indicated in Figure 3A, and the variations in the drag coefficient and the Strouhal number are shown in Figure 3.5. It is reasonable to suppose that the unknown plot of C— would also undergo a rapid change in the vicinity of NR= 3 x 10''. This value of 1L is referred to as the "critical" Reynolds number. Values of NR below this number will be called "subcritlcal Reynolds numbers" in this paper, and those above will be termed "super-critical Reynolds numbers".
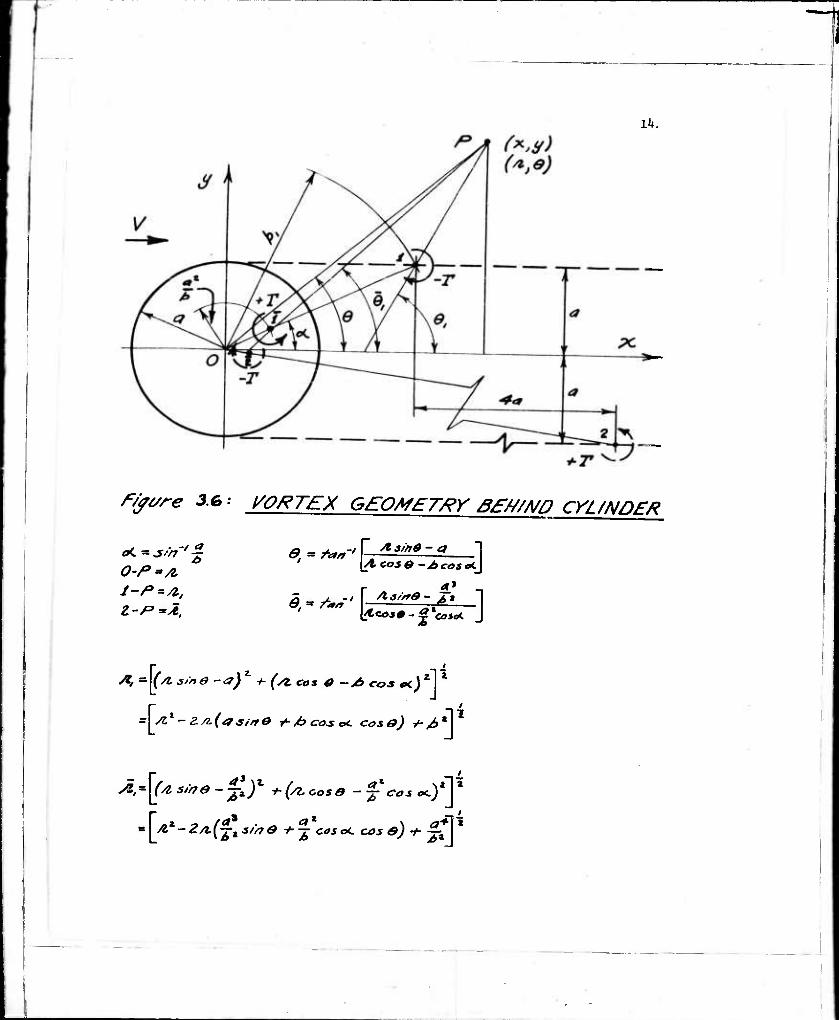
Ifcder the assumptions of ideal flow and the vortex geometry behind the cylinder shown in Figure 3.6, it can be shown (Ref. 31) that the perimeter of the cylinder is a streamline and that the pressure distribution at the surface is given by:
12,
/yge/re 3J
F/LOW FOR HEXY LOW A^
F/gtsre 3.Z ••
FIOVVFOR N0<40 ' «• '< rt mm
sir ezO.S&lr
F/for-e 3.3 : FLOW FOR 40 < AL < 3*/0
Tt/rbu/enf H/aMe
F/yore 3.+ s FLOW FOR 3x/0S'< /V.

13.
--4
1h.
Ftyvre 3.6: i/QXTEX GEOMETXY ߣH/A/D crUNDEX
9, - fa/, 'l /t sin 6 - a
0' /a
A.cos& -AcoscCJ
r £.*
A, =-[(/l s/*0 -a)* +■ (/t cos a -jb cos tx) zl *
= I/«*-2/t(-£, s/rte y- j c«oc cos *} •*• Ti I
ER T?-2* 15-
(using n = b/a)
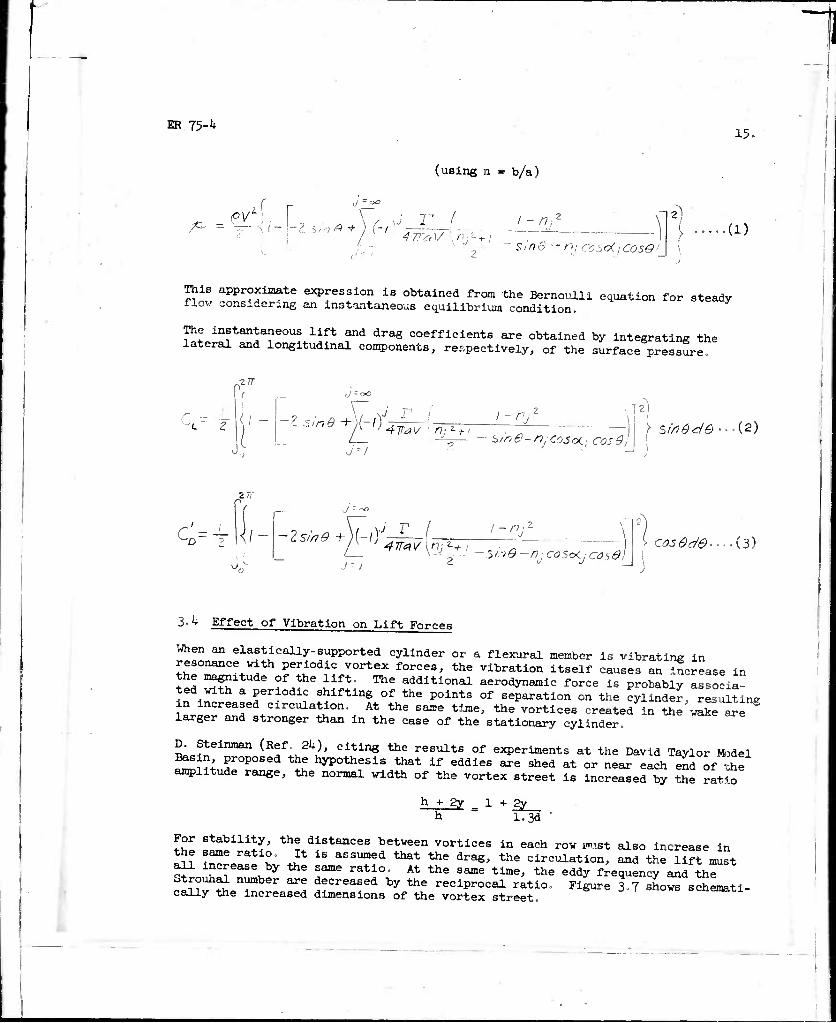
/G- = PM ■ r r ; T' ( -^ i\-\-l sin* + ) (-^j^—i-. I -/?/■
sin 6 - - n; coscK.- iTöjö1' (1)
This approximate expression Is obtained from the Bernoulli equation for steady flow considering an instantaneous equilibrium condition.
The instantaneous lift and drag coefficients are obtained by integrating the lateral and longitudinal components, respectively, of the surface pressure.
t7 -oo
CL-= flil Zs/nd-h)(-l)
K
J 1
4TraV n^ + t
d^l
1 - n, • 1?- J'
- s/r>$~n:cosc*.- cosOj ) sfr7dd&-'-(2)
C
ZTf
11 iw^tl-^ö A J ■-1
-njcosoCjcosol^ Cos&de-'-'i'i)
3.1* Effect of Vibration on Lift Forces
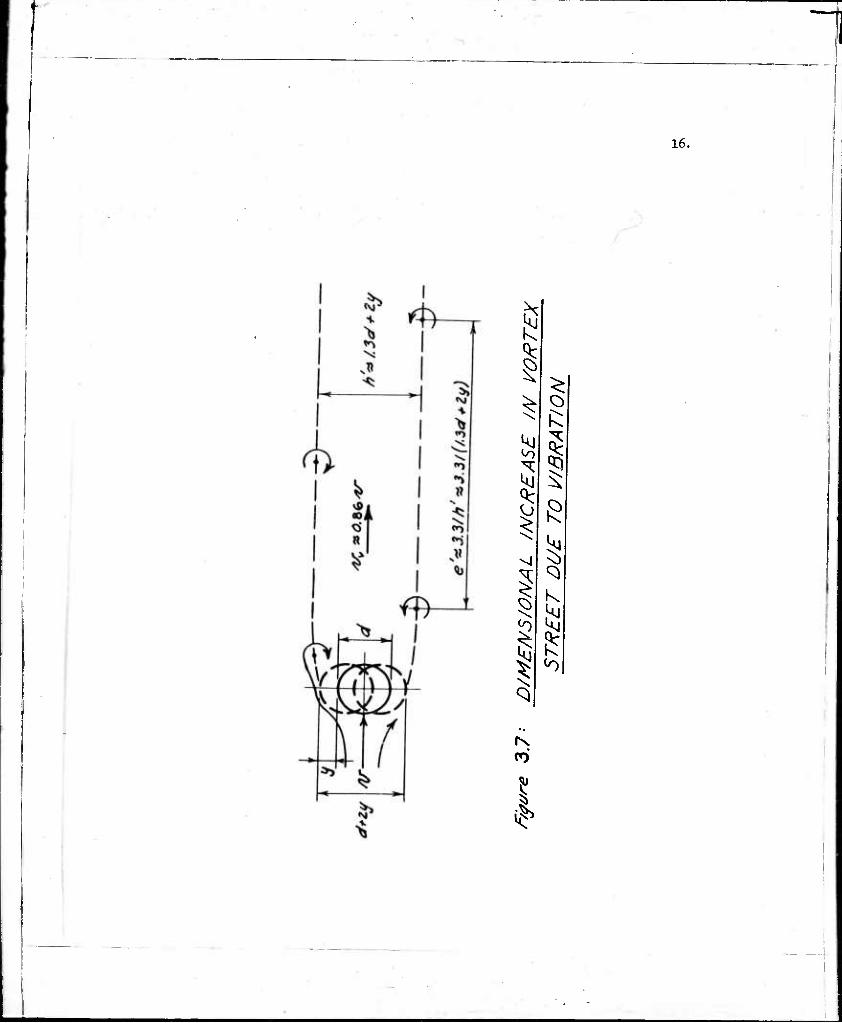
When an elastically-supported cylinder or a flexural member is vibrating in resonance with periodic vortex forces, the vibration itself causes an Increase in the magnxtude of the lift. The additional aerodynamic force is probably associa- ted vxth a periodic shifting of the points of separation on the Cylinder, JesuUin^ in increased circulation. At the same time, the vortices created in the wSTare larger and stronger than in the case of the stationary cylinder.
D. Steinman (Rf; 2^), citing the results of experiments at the David Taylor Model Basm proposed the hypothesis that if eddies are shed at or near each end of 'he amplitude range, the normal vidth of the vortex street is Increased by the ratio
h + 2y = 1 + gy h 1.3d c
For stability, the distances between vortices in each row jmst also increase in
^ S,ZIJ Z' i* iB assumeä that the dra«. the circulation, and the lift must all increase by the same ratio. At the same time, the eddy frequency and the c^fS.T ^ *frea*ed ^ «* reciprocal ratio. Figure 3-7 shows schemati- cally the Increased dimensions of the vortex street.
16.
i ft:
~l
ER 75-^ 17.
It Is important to realize that resonant vibrations of large amplitude cannot be attained when the Strouhal frequency for a stationary cylinder exactly equals the natural frequency of an elastic body. In this instance, as soon as oscillation begins, the Strouhal frequency decreases and goes out of phase from the natural frequency. When oscillation occurs at some higher stream velocity, however, the Strouhal frequency decreases to the point where it matches the natural frequency of the body, and the vibration stabilizes at the corresponding amplitude.
There is an upper limit of stream velocity beyond which this self-controlling action cannot occur. At this point the amplitude drops abruptly to a lower value determined by the dynamic load factor of the forcing function. For the case of zero damping, Steinman deduced an upper limit of velocity for peak amplitude of
v w 1.^5 v p cr
The ratio of v to v^ must be the same as the ratio of dimensional increase in the vortex street.
. "1- . ltä- v fd N ' 1.3d cr — s
3.5 Effect of Protuberances
One may expect, from the experiments of Fage and Warsap (Ref. 9)* that not only the drag coefficient but also the Strouhal number may become insensitive to Reynolds number for a cylinder with many small windings attached to the surface. Also, the use of a few small diameter spoilers would not serve to reduce lift forces appreciably except in the vicinity of the critical Reynolds number., where the boundary layer may easily be tripped into turbulent flow. It appears more promising to approach the problem from the point of view of disturbing the flow picture drastically through the use of windings which are of significant size com- pared to the diameter of the cylinder. If the regular formation of vortices can be prevented or interrupted by this means, an irregularity will be imparted to the lift forces which will inhibit the occurrence of resonant vibrations. In addition, if the windings are attached in a helical pattern, their three-dimensional charac- ter should bp additionally advantageous for the purpose of disturbing a two- dimensional flow.
IV. VIBRATION ASPECTS
h.l Preliminary Considerations
a) Damped Vibrations
The equation of motion for the forced, damped vibration for a single-degree-of- freedom system having viscous type damping and subjected to a harmonic forcing function of constant amplitude is
„ i■<^t i - Nty- + cy + koy = Foe ........................(4)
ER 75-4 18.
from which the response is found to be
Feiajt Feiwt
o o 7 " Z (Ico )
^(k -MOJ2)2 + c2^
The real part of equation (5) may be written
2x2 (1- a^)^ + (2S n r c
lo which, fl = ^ / ^ = f/f .
(5)
(6)
b) Free Lateral Vibration of Members
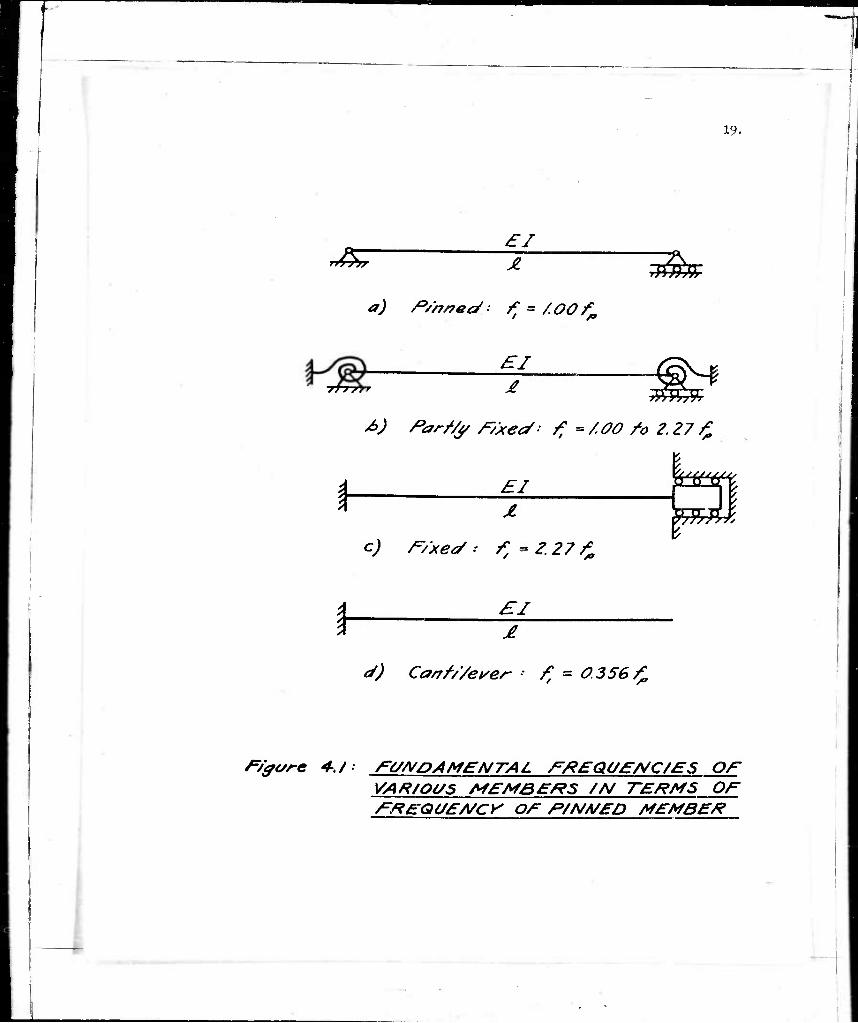
^.^S1"*1 !fe(iuency of ^ free lateral vibration of a flexural member of constant section may be written (Ref. 28): «»«uu«- ux
^2 ' k a 27r (7)
i^^S theJ;ei^ ^ depends upon the conditions of end support and the mode of
Figure 4.1 are the following;
Fixed:
Partly Fixed:
Pinned:
3-56 A £2 ^ I? " 2-27fp (8)
T 2 to 3.56
£2 ^A, (1.00 to 2.27) f ....(9)
77
2/ /\ Ay p • do)
Cantilever: O.560
Z2 ^ I? = 0-356f (11)
JÜO V^rati"« mfn*er is carrying an axial load (as in the case of a space ZTtk the ^^fregency of the member is a function of the load as well as the properties of the member. For a member with pinned ends, for example the L-
llTC£r£l0TlZf. Sr^of the J ^ mode diff^from s ---
r£Z £1
a) /O/h/recJ: ^ = AGO f
19.
SAB:
El /> J r. ^^
£1
c) r/xec/ - f, ~ 2.27 /L
&&L
F ?J, rrrrrr.
I £1
cf) Carrf/Vei/er- ■' f, = 0.356/^
F/gare 4-J: ^a/VQ A MENTAL r/tEqaffi/C/ES 0£ VAR/OVS MEMBERS /N TERMS OF FREQOEA/Cy OE F/NA/ED MEMBER
ER 75-4
1 i
20.
F£2
J^I w
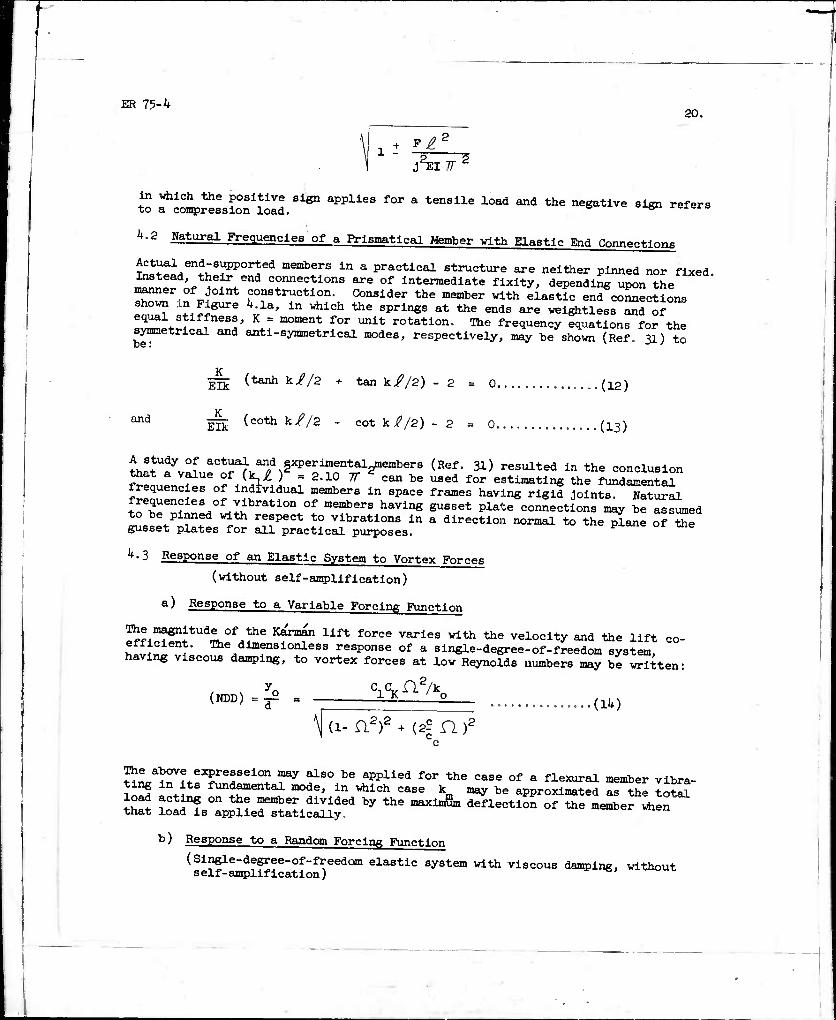
in vhich the positive sign applies for a tensile load and the negative sign refers to a conipression load. 6" J.CJ.ci a
k'2 »attiral Frequencies of a Prismatical Member with Elastic End Connections
Actual end-supported members in a practical structure are neither pinned nor fixed Instead, their end connections are of intermediate fixity, depending upon the manner of Joint construction. Consider the member with elastic end coLections shown in Figure 4.1a, in vhich the springs at the ends are weightless and of equal stiffness, K = moment for unit rotation. The frequency equations for the symmetrical and anti-symmetrical modes, respectively, may be shown (Ref. 31) to
K if
g^ (tanh k//2 + tan k//2) - 2 = 0... ....(12)
XT
g^: (coth k//2 - cotk//2)-2 = 0 (13)
tJj fyv f
act"al af .i^ei-imental^embers (Ref. 31) resulted in the conclusion frel^Ue f/Mi : 2-10 ^ Can be "•*» for ^timating the fundamental frequencies of individual members in space frames having rigid Joints. Natural
to6^611?eL0Lr.ibrati0n 0f men,berS having gusset Plate connections may S «Led to be pinned with respect to vibrations in a direction normal to the plane of toe gusset plates for all practical purposes.
^•3 Response of an Elastic System to Vortex Forces
(without self-amplification)
a) Response to a Variable Forcing Function
The magnitude of the K^rm^n lift force varies with the velocity and the lift co- hI5J«i^: ^dlmfneionle83 response of a single-degree-of-freedom system, having viscous damping, to vortex forces at low Reynolds numbers may be written:
(NDD)=^ . 1 K '_o .......(14)
\(1- a2)2 + (2snr c
The above e^resseion may also be applied for the case of a flexural member vibra-
SS M fun^entai ,n0de' in ^^ Case km «•* be approximated as the tol™ th«J ? .'f ^ *?! fmber dlVi&eä by the maxi^m ^flection of the member when that load is applied statically. «»•«"■ «uen
b) Response to a Random Forcing Function
(Single-degree-of-freedom elastic system with viscous damping, without self-amplification)
~1
ER 75-4 21.
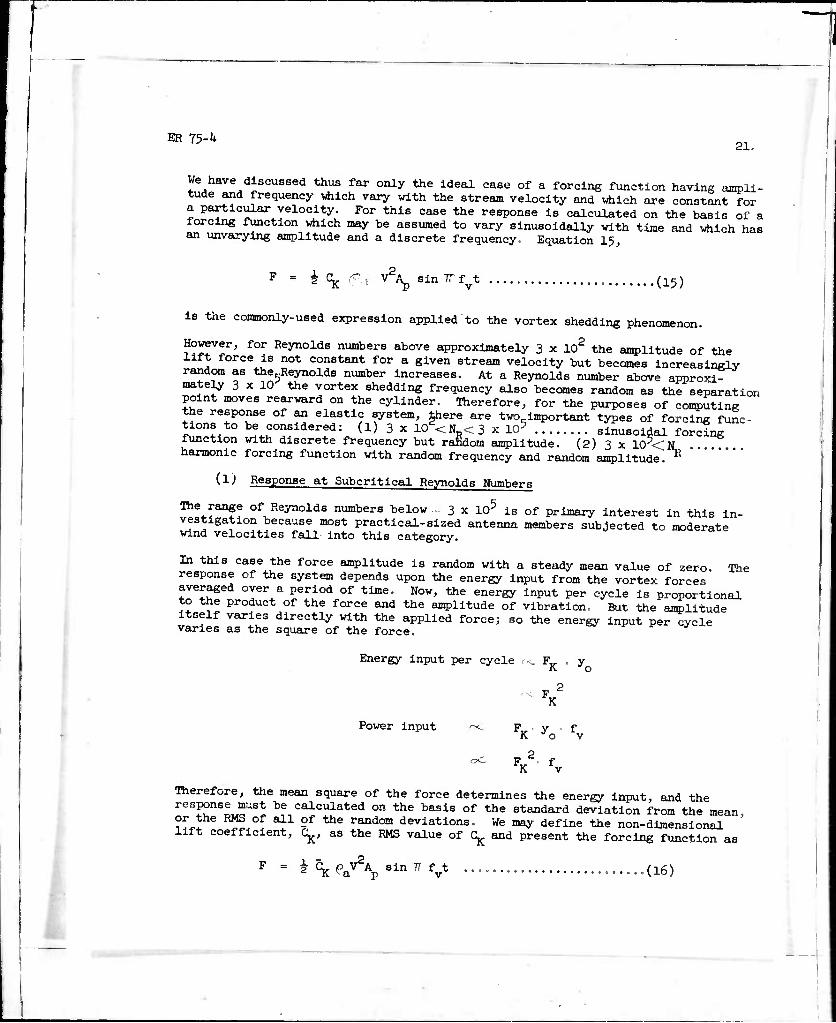
We have discussed thus far only the Ideal case of a forcing function having ampli- tude and frequency vhich vary with the stream velocity and which are constant for a particular velocity. For this case the response is calculated on the basis of a lorcing function which may be assumed to vary sinusoidally with time and which has an unvarying amplitude and a discrete frequency. Equation 15,
" *<* '^ V^sinTT^t (15)
is the commonly-used expression applied to the vortex shedding phenomenon.
However, for Reynolds numbers above approximately 3 x 10² the amplitude of the lift force is not constant for a given stream velocity but becomes increasingly random as the^eynolds number increases. At a Reynolds number above approxi- mately 3 x 10 the vortex shedding frequency also becomes random as the separation point moves rearward on the cylinder. Therefore, for the purposes of computing the response of an elastic system, there are two.important types of forcing func- tions to be considered: (l) 3 x lO^N <3 x 10⁵ sinusoidal forcing function with discrete frequency but random amplitude. (2) 3 x 10<<N harmonic forcing function with random frequency and random amplitude. P, '
(l) Response at Subcritical Reynolds Numbers
The range of Reynolds numbers below 3 x 10⁵ is of primary Interest in this in- vestigation because most practical-sized antenna members subjected to moderate wind velocities fall into this category.
In this case the force amplitude is random with a steady mean value of zero The response of the system depends upon the energy input from the vortex forces' averaged over a period of tine. Now, the energy input per cycle is proportional to the product of the force and the amplitude of vibration. But the amplitude itself varies directly with the applied force; so the energy input per cycle varies as the square of the force. =« *■ *- ./
Energy input per cycle oc p . y K o
Power input K "'o v
2 F„ f K v
Therefore, the mean square of the force determines the energy input, and the response must be calculated on the basis of the standard deviation from the mean, ?f~ ^S a11 -f the random deviations. We may define the non-dimensional lift coefficient, C^, as the RMS value of C^ and present the forcing function as
F = ^ V
2. A sin Tf f t v ..(16)

1 ER 75-4
and compute the response from
22.
(ADD) - j2 - CA ^2AC
^j (i-n2)2 + (2| nr (17)
(2) Response at Supercritical Reynolds g^gr.
Supercritical Reynolds numbers are of secondary 1^^^+ ir, +>,. *
of th. *ole spectra o? f JeSclef i^.f ? 'S* "^ '" "^»t« 1» "™
reliance. ^^^ 0f ^ ^^ *™^ ^ P^-e a^hl^rS^e'at 27'
For the stochastic process under consideration -t-p 4.«.. ^„ as a function of the non-dlmenslo^sJroS fre^rr/56 ^ iS ^^^
and Is normalized so that
i
(PSD) = 0 (N ) s
0 (N ) d N = 1,
then the mean square an^lltude of the forcing funo+inn ™o„ v„ of the mean square lift coefficl^nt «niT^irf fmct*on "^ be expressed in terms (Ref. 10). coefficient and the integral of the power spectral densit
F -(i^V^)^2 0(Ns)dNs .US) Jo
The mean square yalue of the response may then be calculated from
(HDD)9 =(^2) 2 ci2^n!
0 (Ns)dNs
k (i-n2)2 + (25 n)9
.(19)
Iftider the assumption that there are no phase differences «inn^ t-v,» i ^ * ^
ER 75-4 23-
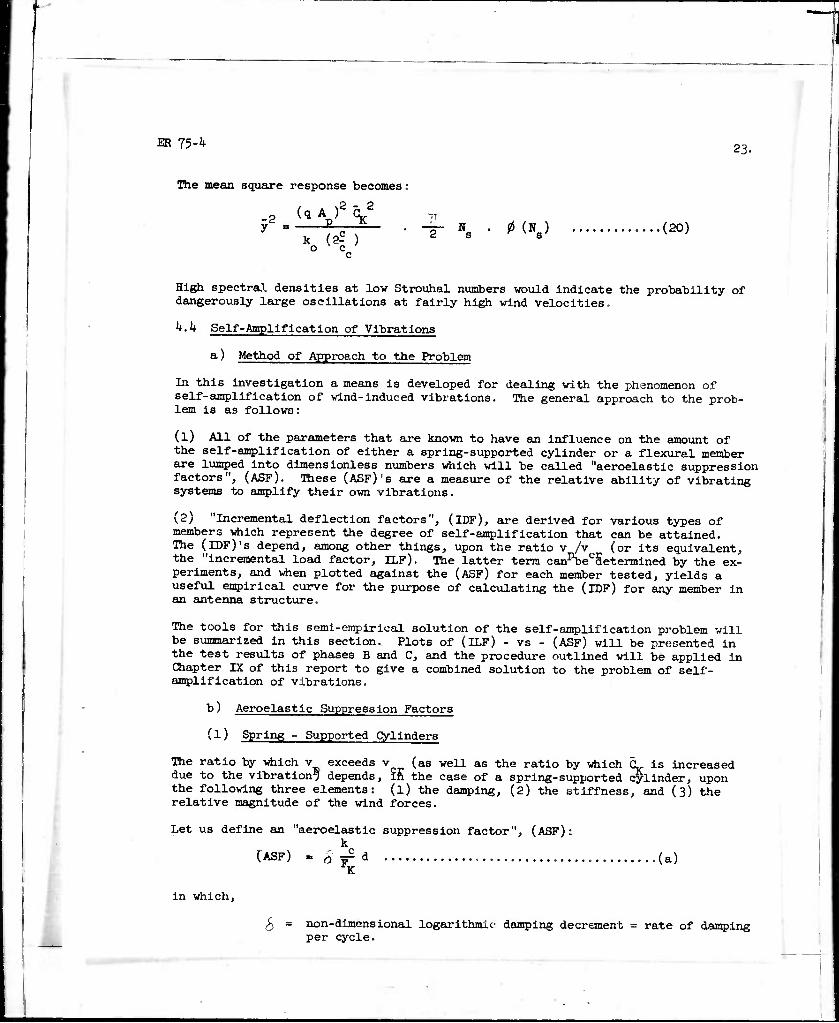
The mean .square response becomes;
-2 v ■ K (2; )
77
"2" N 0 (Ns) (20)
High spectral densities at low Strouhal numbers would indicate the probability of dangerously large oscillations at fairly high wind velocities.
h.k Self-Amplification of Vibrations
a) Method of Approach to the Problem
In this investigation a means is developed for dealing with the phenomenon of self-amplification of wind-induced vibrations. The general approach to the prob- lem is as follows:
(1) All of the parameters that are known to have an influence on the amount of the self-amplification of either a spring-supported cylinder or a flexural member are lumped into dimensionless numbers which will be called "aeroelastic suppression factors", (ASF). Ibese (ASF)'8 are a measure of the relative ability of vibrating systems to amplify their own vibrations.
(2) "Incremental deflection factors", (IDF), are derived for various types of members which represent the degree of self-amplification that can be attained. The (IDFVS depend, among other things, upon the ratio v /▼ (or its equivalent, the "incremental load factor, ILF). The latter term canpbecSetermined by the ex- periments, and when plotted against the (ASF) for each member tested, yields a useful empirical curve for the purpose of calculating the (IDF) for any member in an antenna structure.
The tools for this semi-empirical solution of the self-amplification problem will be sunmiarized in this section. Plots of (ILF) - vs - (ASF) will be presented in the test results of phases B and C, and the procedure outlined will be applied in Chapter IX of this report to give a combined solution to the problem of self- amplification of vibrations.
b) Aeroelastic Suppression Factors
(1) Spring - Supported Cylinders
Ihe ratio by which v exceeds v (as well as the ratio by which CL. is increased due to the vibration^ depends, in the case of a spring-supported cylinder, upon the following three elements: (l) the damping, (2) the stiffness, and (3) the relative magnitude of the wind forces.
Let us define an "aeroelastic suppression factor", (ASF), k
in which.
(ASF)
8 =
K (a)
non-dimensional logarithmic damping decrement = rate of damping per cycle.
ER 75-4 24.
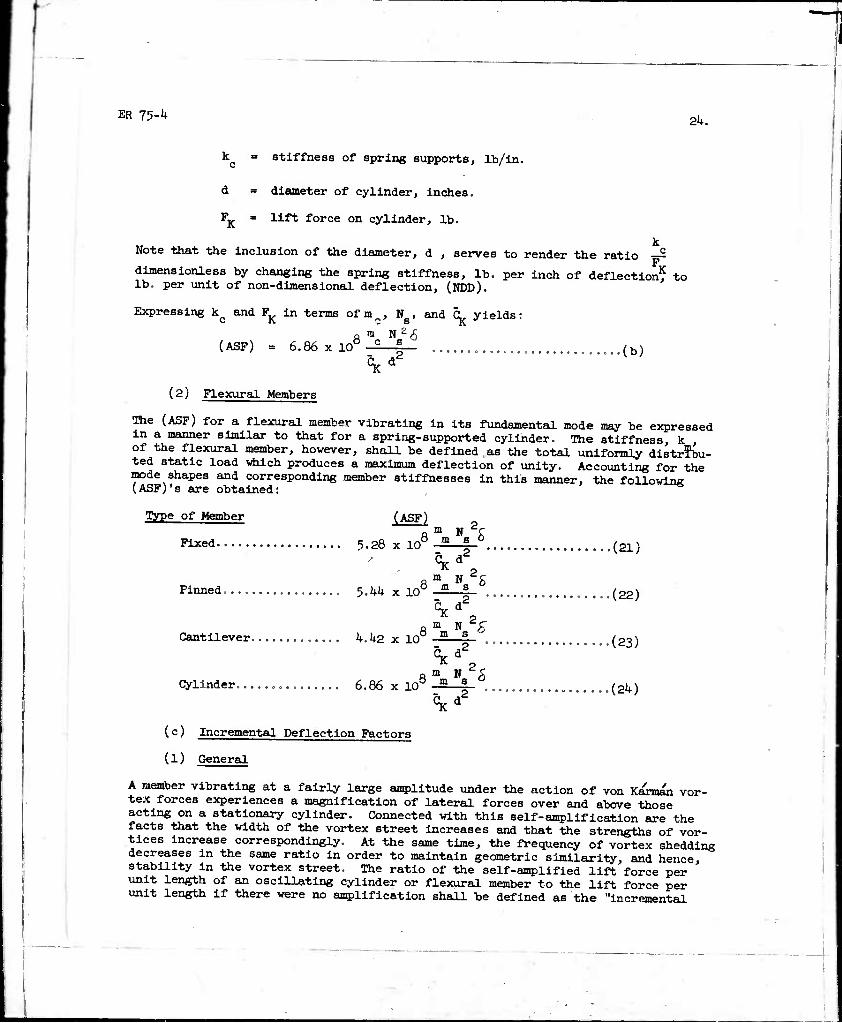
K
stiffness of spring supports, lb/in.
diameter of cylinder, inches,
lift force on cylinder, lb.
Note that the inclusion of the diameter, d , serves to render the ratio —
dimensionless by changing the spring stiffness, lb. per inch of deflection^ to lb. per unit of non-dimensional deflection, (NDD).
Expressing k, and FK in terms of m^, Ns, and C^. yields:
(ASF) = 6.86 x 10£ a W N 2 6 ,o c s
^ .(b)
(2) Flexural Members
The (ASF) for a flexural member vibrating in its fundamental mode may be expressed in a manner similar to that for a spring-supported cylinder. The stiffness, k , of the flexural member, however, shall be defined as the total uniformly distr?bu- ted static load which produces a maximum deflection of unity. Accounting for the mode shapes and corresponding member stiffnesses in this manner, the following (ASF^s are obtained: ^
Type of Member
Fixed 5-28 x 10'
(ASF)
oms0
Finned. , 5,44 x 10' A m N 5 o m s u
% ^ ■
8 mm K & Cantilever 4.42 x 10 m s
A m N 5 0 m a "
2 ° Sc3
...(21)
,..(22)
••(23)
..(24) Cylinder . 6.86x10
(c) Incremental Deflection Factors
(l) General
A member vibrating at a fairly large amplitude under the action of von Karman vor- tex forces experiences a magnification of lateral forces over and above those acting on a stationary cylinder. Connected with this self-amplification are the facts that the width of the vortex street Increases and that the strengths of vor- tices increase correspondingly. At the same time, the frequency of vortex shedding decreases in the same ratio in order to maintain geometric similarity, and hence, stability in the vortex street. The ratio of the self-amplified lift force per unit length of an oscillating cylinder or flexural member to the lift force per unit length if there were no amplification shall be defined as the "incremental
ER 75-^ 25-
load factor", (ILF).
(ILF) = 1 +^05 - 1 +1.5^ (HDD)
For an oscillating cylinder the (ILF) is equal to v/v . For a vibrating member the (ILF) at the point of maximum delfection is also assumed to be equal- to v/v
When a cylinder or a flexural member is vibrating under the influence of a wind velocity somevhat greater than the critical velocity, the aerodynamic forces exceed those acting at the critical velocity for two reasons. First, the forces increase in proportion to the velocity pressure head increase, (v/v ) . Second, the forces Increase due to the self-magnification show by the increased width of the vortex street. There is an upper limit of amplitude and velocity where the vibration becomes unstable and breaks down abruptly. Thus, the amplitude rises gradually to a peak at a velocity somewhat above the critical velocity and then drops suddenly to a low value.
Let us define a term which will account not only for the increase In forces due to the self-amplification but also for the increase due to the velocity increment. This term shall be called the "incremental deflection factor", (IDF). The ^IDF) is the ratio of the peak amplitude to the hypothetical amplitude at the critical velocity. Tixe latter amplitude must be recognized as tiypothefclcal because reson- ant vibrations of large amplitude cannot be attained when the Strouhal frequency for a stationary cylinder exactly equals the natural frequency of the body. In this instance, as soon as oscillation begins, the Strouhal frequency decrease- and goes out of phase from the natural, frequency, and a pulsating response resolts. For the purpose of computing the (IDF), however we shall Imagine that there is no inter-action between the calculated forces and the response at the critical velocity.
For a cylinder oscillating as a rigid body the (ILF) and the (IDF) are determined by the damping, the spring stiffness, and the lift coefficient. For a vibrating flexural member, however, the (ILF) varies along the length of the member, and the (IDF) is a function of the shape of the dynamic deflection curve and the phase relationships of the forces acting over the total lengths
D. Bo Stelnman (Ref. 2K) evaluated for a specific case the effect of the self- amplifioation, (ILF), of an oscillating cylinder, simultaneously with the dynamic amplification equation, (DLF), for an elastic system, by means of a two-part graphical interpretation substituted for the solution of a 6 th degree equation. It will be more convenient for design purposes, however, to consider the elastic vibrational amplification, (DLF), and the aerodynamic type of amplification, (IDF), separately.
In this Investigation there are two different situations for which amplification implements must be developed:
A. Design or Analysis; Knowing the member characteristics, the damping, the lift coefficient, and the Strouhal number, calculate the maximum possible amplitude of vibration.
3. Wind Tunnel Tests; Having measured the member characteristics, the damping,,, the Tpay^™'"' amplitude, and the corresponding wind velocity, calculate the lift co- efficient and the Strouhal number for a stationary cylinder of the same diameter and at the same wind velocity.

ER 75-4 26.
These two approaches will he taken up Individually. The factors for the former case have already been defined. Bae factors for the latter case will be defined simply as the "reduction factors", (RF).
(2) (IDF)'S for Design or Analysis
In the case of design or analysis the member characteristics, the damping, the lift coefficient, and the Strouhal number are known. The problem is to calculate the maximum possible amplitude of vibration. The method to be used Is to calcu- late the hypothetical anqplitude ^f vibration at the critical velocity and then to increase this amplitude by the (IDF). Since the (IDF) is a function of the velocity ratio v Ar = (iU) , the latter term must also be known. The ex- perimental curve for (ILF), obf§tned from the laboratory tests in this investiga- tion, may be used for this purpose.
The (IDF) will be developed in detail for the case of a simply-supported member. Expressions for the (IDF)'s for other cases of interest will also be written.
For a simply-supported member vibrating under the influence of the wind velocity which causes peak amplitude,
k
ymp 3H5 J>1 El
2y
1.3d 0.01025 £
El (DLF)
Solving for y , mp
mp
5 355 El (DLF)
2/^o 0.01025 71 ~r 1 " Tod —iT ^DLF) (25)
By definition,
(IDF) = mp
El (DLF)
2.Our 0.01025 Jl (26)
1.3d El (DLF)
But,
yUT -o = SC^VP)-3& (35)
kk.2 30 ;
= 1.779 x lO"^ C^ v d (lb/in) (a)
* Deflections of all vibrating members are approximated by fourth desgree para- bolas. The incremental loading on a member will therefore be assumed to vary as a fourth degree parabola.
[ 1
ER ll-k 27>
Also, vp = vcr ^ (V*)^ .....^... ......(t)
fld
tod, r^-^p = 96^00 ^2 ......(c)
Substituting (a)., (b), and (c) into equation (26) and writing similar equations for other types of members results in the following:
A. Pinned Members: (Defl. assumed 4 th degree parabola)
(IDF) = i _ -...........(27a)
1 - 2.41 x 10⁻⁴ ^ | (DLF) (ILF)2
B. Fixed Members: (Defl. assumed 4 th degree parabola)
(IDF) = — .(27b)
1 - 2.64 x 10~k (* | (DLF) (ILF)2
C. Cantilever Members: (Defl. assumed 4 th degree parabola)
(IDF) = i ........... ..(27c)
1 - 2.46 x 10~k CK | (DLF) (ILF)2
D. Spring-Supported Cylinders: (Defl. uniform)
(IDF) = i _ ............(27a)
1 - 2.44 x 10'k CL | 'DLF) (ILF)2
It must be noted that in the derivation of the (IDF^s a discrepancy arises in the case of a flexural member. At large amplitudes of vibration the vortex shedding in the region of maximum deflection will tend to be slower than in regions of lesser deflection near the supports. The acting forces will tend to lose some phase homogeneity, and a limit of self-amplification will be reached which is less than that indicated by the calculations discussed above. Qualitatively speaking, a flexural member will have less self-amplification than an oscillating cylinder not only because of the mode shape but also because of the phase differences which arise. The experimental plot of (ILF) from the member tests in this investigation will be assumed to account for these phase differences, (it will be seen from the results of the experiments of Hiases B and C that the (ILF) curve for members is somewhat lower than that for spring-supported cylinders because of the phase differ- ences discussed here. )
(3) (RF)'3 for Reducing Wind Tunnel Tests
The second situation of interest involves the transformation of the wind tunnel test data into useful information. In order to have some basis of comparison, dynamic values of CJ and N ' must be referred to the case of the stationary cylinder. The experimental values of C ' and N ' are to be multiplied and divided, respectively, by the appropriate reduction factors, (RF).
ER 75-^ 28.
In the process of reducing the test data for a flexural member, an "apparent^ dynamic (^ is computed which refers to a uniformly distributed lateral loading ^ . .?n the member' Then the Proper reduction factor is calculated by equating the deflection of the member with a statically-applied, uniformly-distributed apparent C^ i loading to the delfection obtained with a statically-applied standard CL loading properly modified by the effect of self-amplification. In
ttiis manner, the following expressions for (RF) are obtained:
A. Pinned Members: (Defl. assumed k th degree parabola)
(RF) = 1 + 1.21 (NDD) .......(28a)
B. Fixed Members; (Defl. assumed k th degree parabola)
(RF) = 1 + 1.26 (NDD) •■' ................(28b)
C Cantilever Members: (Defl. assumed k th degree parabola)
(RF) = 1 + 1.09 (NDD) ....(28o)
D- Spring-Supported Cylinders: (Defl. uniform)
(RF) = 1 +1.5'* (NDD) ••••••••••••..•••....•...........(26d)
v- TEST PROGRAM AMD DESIGN OF COMPONENTS
5.1 Basic Afisumptlone
The following basic assumptions apply to the wind tunnel experiments in this investigation:
a) Spanwise correlation is assumed for the vortex-shedding mechanism. That is the flow picture is assumed to be two-dimensional, and the vortex-shedding is ' assumed to be in phase at all sections of a cylinder (at sub-critical Reynolds numbers) at all times. Very little experliaental evidence exists to support this assumption, but Roshko (Ref. 20) found good spanwise correlation at low Reynolds numbers.
b) Spoiler configurations optimized on stationary cylinders are assumed to be optimum for vibrating cylinders also. Ttxl» assumption permits the results of sta- tionary tests to be extrapolated to vibration tests for the purpose of checking spoiler effectiveness without having to repeat the optimization process.
c) Short, spring-supported cylinders are assumed to simulate the behavior of structural members which are too large to test in the wind tunnel. For this pur- pose, stiffnesses and mass ratios of cylinders and members must be adjusted.
d) It is assumed that the fundamental mode of vibration of practical members is of much more common occurrence than the higher modes of vibration. For this reason the design of spoilers for flexural members shall be directed toward sup- pressing the first mode efficiently, without regard to higher modes.

ER 75-4 29.
5-2 Fhases of Test Program
The following three phases constituted the test program;
a) Phase A: The first phase consisted of tests on stationary cylinders mounted vertically in the wind tunnel. These cylinders ranged in size from 3" <j> to 10" ^ in increments of 1 inch. The variation of the lift force on a cylinder, with respect to time., was measured by means of a small force transducer at the lower end of the cylinder. The output of the force transducer provided information for calculating lift coefficients and Strouhal numbers for the range of wind tunnel velocities available as well as for optimizing spoiler designs.
b) Phase B; The second phase Involved mounting the' cylinders from Phase A on cantilever spring supports at top and bottom. The response of these spring- supported cylinders to the vortex action of the wind was measured indirectly by accelerometers mounted on each end. These response measurements permit the calcu- lation of the magnitude and frequency of the forcing function for both bare cylin- ders and cylinders with spoilers and also provide comparisons between the two. A second parameter, the damping coefficient, was not subject to control, but the fact that It varied proved to be useful in the final analysis.
c) Phase C: In the last phase a series of flexural members was tested. These members were of fairly small diameter { 1 \" <f), 2" ^, 3" ^, and 4" ^) and had various conditions cf end support. The members tested were selected on the basis of a feasibility study which determined the sizes and methods of supports which could be used In the wind tunnel available and which could be expected to attain resonance within the speed range of the tunnel. Hie response of these full-size test members was measured In terms of fiber strains by means of SR-4 gages ap- plied at points of maximum stress. This phase provides: (l) values for the lift coefficient and Strouhal number at lower Reynolds numbers, (2) correlation with spring-supported cylinders, (3) Information on the effect of varying the length of spoilers over the length of the member, and (1+) verification of model rela- tionships for the vortex shedding phenomenon.
Phases B and C also yield useful Information on the degree of self-amplification In vibrating members.
5•3 Design of Test Members and Support Systems
a) Stationary Cylinders
Photograph 5.1 shows the base layout and the force transducer connection for the Phase A tests (with one of the plywood guide plates removed). A "dummy" connec- tion of similar construction was provided at the upper end of the cylinder so that the force reactions at the top and bottom connections would be approximately equal.
b) Spring-Supported Cylinders
The same cylinders were used in Phase B that were used in Phase A. The support system was transformed by removing the lateral restraints top and bottom so that the cylinders could swing freely on their spring siipports. Twin accelerometers were attached at both ends of the test cylinder to complete the Phase B set-up. Variable spring constants for the supports were obtained using different lengths and thicknesses of the cantilever support strips. These strips were clamped to

30.
2
a
I H ö
O
Si
o

1
ER 75-4 31-
heavy base plates with rigid connectors and high strength bolts uniformly tensioned Sase^ ^VTf1 ^°toeraPh 5-2 shows the h" j spring-supported cylinder of •triase B witn optimum spoilers attached.
c) Flexural Members
:ypes of members tested were the following:
Number Designation
Ml
End Connections Dl
4"^ nmeters
3 Fixed to 3" ^
3 M2 Partly Fixed li"^ to 3" fi If M3 Pinned li"^ to k" j 6 Mk Cantilever li"^ to 3" t
S oi ir rT * ^ //d = 30 ^ £/d = 20 were obtained by sawing off one Safofl/^? ^l^ fter ^ ^ teStS had been dieted. L thi^mLner a total of 16 different members were tested using only 10 shop specimens.
2f ?Et™h f rV ^ membefS " ^^ *•" fabri^ted previous to testing, and Photograph 5.^ shows an example end connection for ML as it was mounted in the wind tunnel. The bolted connections were tightened unifomly ^h^ torque Zl^' r' the gUide Plates ^ of ^^ !■ -moved) were cut to^SaJ th^mem-
VI MATERIALS AHD APPARATUS
6.1 Materials
a) Test Members
All test members were fabricated from structural aluminum stock 6o6] T6, which ia the material commonly employed for the construction of antenna structures oupport members and stationary connectors were made up from structural g^d!
b) Spoilers
The spoilers used in wind tunnel testing consisted of flexible plastic tubin« of varxous diameters and wall thicknesses. The criteria for selec^ij Sll thtok nesses were (l) that the tubing had to be flexible enough to wind ar^nd the test cylinders without applying appreciable force and (2) that the tubirw had to retain Its round shape without appreciable deformation w4n it w2 Sunfin place. The tubing was wound about the test member or cylinder with sufficient tension to assure that it remained in place when subjected to a stro^ wind L it was fastened at each end with narrow strips of electrical adhes^tS"
5,2 Test Apparatus
a) Wind Tunnel ——___^
The experiments in this Investigation were conducted in the low speed wind tun- nel in the Aeroelastic Laboratory of M.I.T. This tunnel is of the clo^S-cSuit
—

1
32.
Photograph j.2 : V'^ Spring-Supported Cylinder (Looking Upetream)

f o
-p o &
3h.
ü H d o
•H
o
|
o +> o

ER 75-4 35-
S^-Sr^ a 5*, f t' rectanSul^ test section and a velocity range of 10 to 100 Bffh. Screens in front of the transition section served to reduce tL «,.-?.. of turbulence at the test section to approximately oJIT ale
t) Pltot-Static Equipment
Pitot-static equipment vas used for measuring wind velocities for the purDOBe of calibrating the tunnel controls and for determining the blockade e^Lf/S^^
rS6^ ±Trdtl [^l^ ^ K™ tube v?fh^ SstSLf cS?iSent of of^.S? S S SS!i0n ^ ^ alCOh01 ^^ haV^ —^r divisions0'
c) Oscillographs
Two types of oscillographs were used for recording the signals from +hP »1.«+-« i
d) RMS Equipment
511 ^^/«/f1*"**^ Tf yzer arrangement was used to obtain standard values of CL,. This set-up consisted of an AC Ballantine electronic voltmeter in W^Mn! tibn with a DC voltmeter shunted across the recording gaJvSSer! She SS^
StL W^^rSor^ ValUeS ^ ^ ^ ^ ^^ — P-idSeaf= of
e) Force Transducer
S^hTps ^^f used ln f*1^6 A is basically a compression force load cell
f) Accelerometers
The twin accelerometers used in Phase B tests were ~ 50 g units havin« natural frequencies of 650 cps. Both the accelerometers arid the lo^d cen c^tSn^Sr arm balanced bridges consisting of unbonded strain gages. contain four-
g) Bonded Strain Gages
SR-4 Bonded Strain Gages, type A-7, were used in the tests of Phase C to measu^
?actSsT2f?!: StralnS- ^eSe ^^ ^ -dances of l^L^Jt^
h) Mi.scellaneous Apparatus
A S TSToTJtJT^ S,?!"'""1 "lth a 't~*** *- ^ •"" A torque wrench having interchangeable sockets and a torque range of ~ ISO ft i^ was utilized for tightening bolted connections in Phases B LdTcf
ER 75-^ 36.
Joint rotations of fixed-end connections were checked in the static load tests of Phase C using a surveyor's transit and a mirror-scale arrangement for magnifying readings.
VII TESTING PROCEDURES
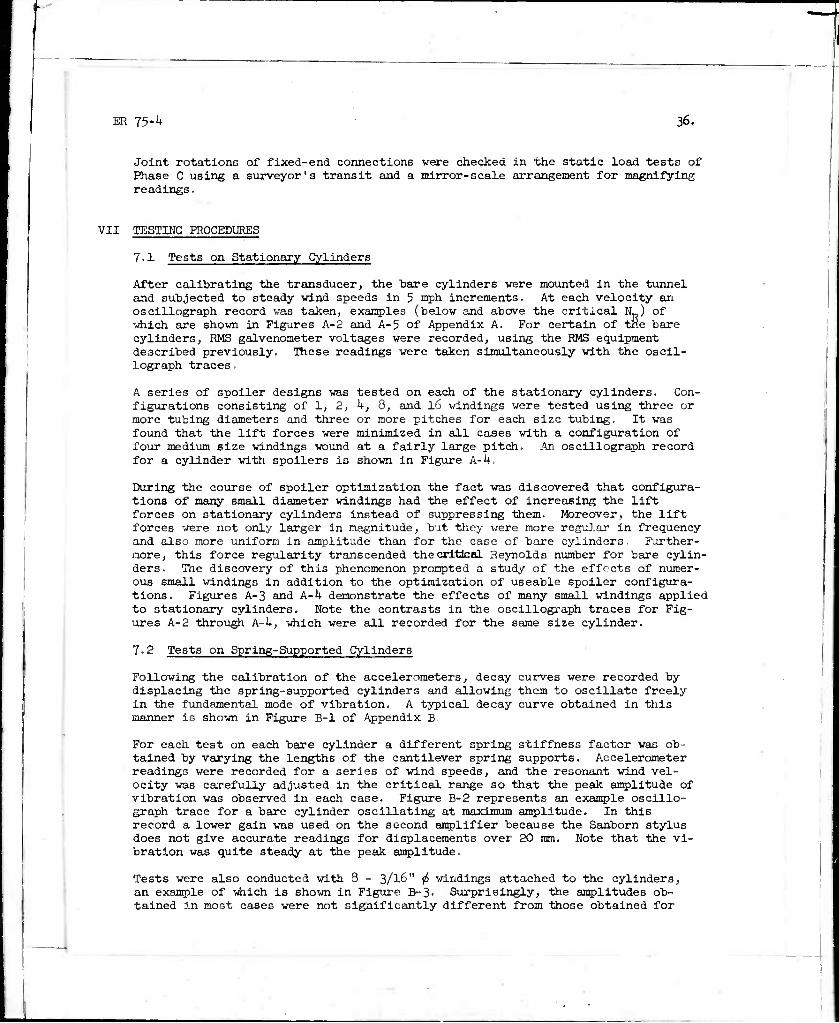
7.1 Tests on Stationary Cylinders
After calibrating the transducer, the hare cylinders were mounted in the tunnel and subjected to steady wind speeds in 5 mph increments. At each velocity an oscillograph record was taken, examples (below and above the critical N_) of which are shown in Figures A-2 and A-5 of Appendix A. For certain of tne bare cylinders, RMS galvenometer voltages were recorded, using the RMS equipment described previously. These readings were taken simultaneously with the oscil- lograph traces.
A series of spoiler designs was tested on each of the stationary cylinders. Con- figurations consisting of 1, 2, k, Ö, and 16 windings were tested using three or more tubing diameters and three or more pitches for each size tubing. It was found that the lift forces were minimized in all cases with a configuration of four medium size windings wound at a fairly large pitch. An oscillograph record for a cylinder with spoilers is shown in Figure A-4.
During the course of spoiler optimization the fact was discovered that configura- tions of many small diameter windings had the effect of increasing the lift forces on stationary cylinders Instead of suppressing them. Moreover, the lift forces were not only larger in magnitude, but they were more regular in frequency and also more uniform in amplitude than for the case of bare cylinders. Further- more, this force regularity transcended the critical Reynolds number for bare cylin- ders. The discovery of this phenomenon prompted a study of the effects of numer- ous small windings in addition to the optimization of useable spoiler configura- tions. Figures A-3 and A-h demonstrate the effects of many small windings applied to stationary cylinders. Note the contrasts in the oscillograph traces for Fig- ures A-2 through A-k, which were all recorded for the same size cylinder.
7.2 Tests on Spring-Supported Cylinders
Following the calibration of the accelerometers, decay curves were recorded by displacing the spring-supported cylinders and allowing them to oscillate freely in the fundamental mode of vibration. A typical decay curve obtained in this manner Is shown In Figure B-l of Appendix B
For each test on each bare cylinder a different spring stiffness factor was ob- tained by varying the lengths of the cantilever spring supports. Accelerometer readings were recorded for a series of wind speeds, and the resonant wind vel- ocity was carefully adjusted In the critical range so that the peak amplitude of vibration was observed in each case. Figure B-2 represents an example oscillo- graph trace for a bare cylinder oscillating at maximum amplitude. In this record a lower gain was used on the second amplifier because the Sanborn stylus does not give accurate readings for displacements over 20 mm. Note that the vi- bration was quite steady at the peak amplitude.
Tests were also conducted with 8 - 3/l6" ^ windings attached to the cylinders, an example of which is shown in Figure B-3' Surprisingly, the amplitudes ob- tained in most cases were not significantly different from those obtained for
ER 75-^ 37.
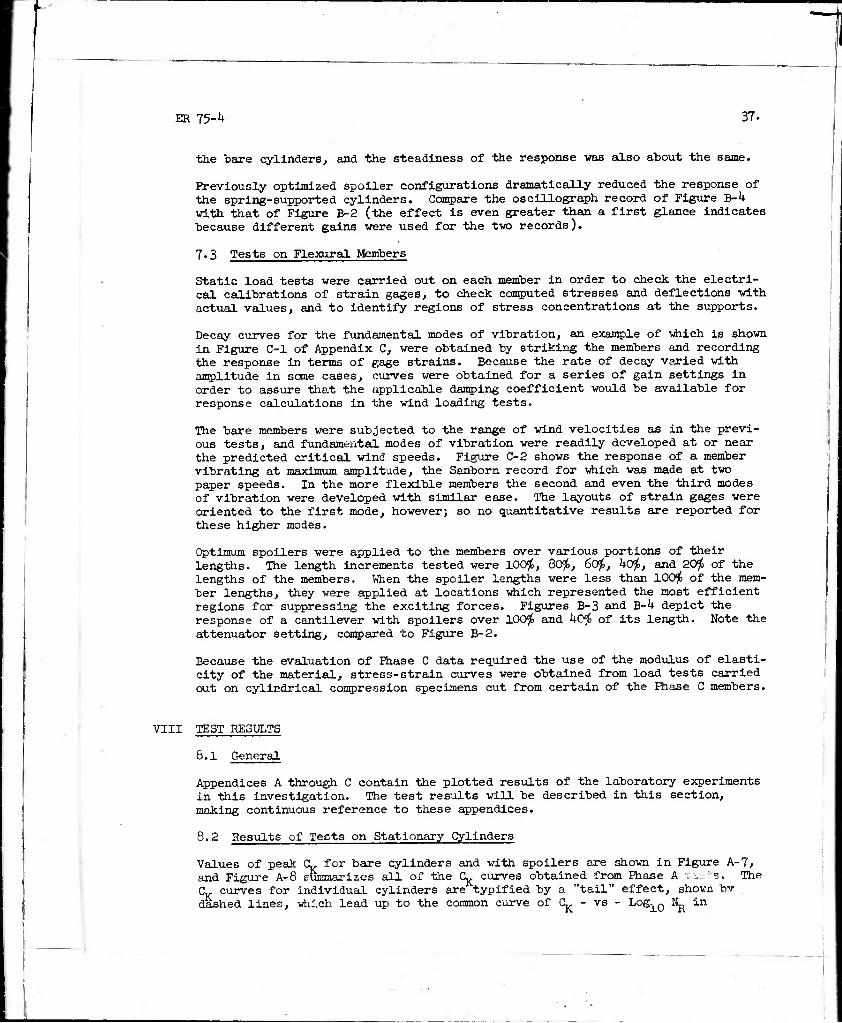
the bare cylinders, and the steadiness of the response was also about the same.
Previously optimized spoiler configurations dramatically reduced the response of the spring-supported cylinders. Compare the oscillograph record of Figure B-U id-th that of Figure B-2 (the effect Is even greater than a first glance indicates because different gains were used for the two records).
7.3 Tests on Flexural Members
Static load tests were carried out on each member in order to check the electri- cal calibrations of strain gages, to check computed stresses and deflections with actual values, and to identify regions of stress concentrations at the supports.
Decay curves for the fundamental modes of vibration, an example of which is shown in Figure C-l of Appendix C, were obtained by striking the members and recording the response in terms of gage strains. Because the rate of decay varied with amplitude in some cases, curves were obtained for a series of gain settings in order to assure that the applicable damping coefficient would be available for response calculations in the wind loading tests.
The bare members were subjected to the range of wind velocities as in the previ- ous tests, and fundamental modes of vibration were readily developed at or near the predicted critical wind speeds. Figure C-2 shows the response of a member vibrating at nmrirmim amplitude, the Sanborn record for which was made at two paper speeds. In the more flexible members the second and even the third modes of vibration were developed with similar ease. The layouts of strain gages were oriented to the first mode, however; so no quantitative results are reported for these higher modes.
Optimum spoilers were applied to the members over various portions of their lengths. The length Increments tested were 100^, 80^, 60^, hofr, and 20^ of the lengths of the members. When the spoiler lengths were less than lOOjt of the mem- ber lengths, they were applied at locations which represented the most efficient regions for suppressing the exciting forces. Figures B-3 and B-h depict the response of a cantilever with spoilers over 100^ and 40^ of its length. Note the attenuator setting, compared to Figure B-2.
Because the evaluation of Phase C data required the use of the modulus of elasti- city of the material, stress-strain curves were obtained from load tests carried out on cylindrical conrpression specimens cut from certain of the Riase C members.
VIII TEST RESULTS
8.1 General
Appendices A through C contain the plotted results of the laboratory experiments In this investigation. The test results will be described in this section, making continuous reference to these appendices.
8.2 Results of Tests on Stationary Cylinders
Values of peak CL. for bare cylinders and with spoilers are shown in Figure A-7, and Figure A-8 Eunmarlzes all of the CL. curves obtained from Phase A te^tat The C^ curves for individual cylinders are typified by a "tall" effect, shown bv dashed lines, which lead up to the common curve of CK - vs - Log10 N^ xn

ER 75-h 38.
Figure A-7« These "tails" are apparently due to the fact that the vortex shed- ding phenomenon is not strong and stable at low wind velocities.
The C^ curve for optimum spoilers is quite low and fairly flat. On the other hand, the curves for 8 and 16 small windings stand well above the curve for bare cylinders, but all have somewhat similar shapes. The plot of standard CL^ shown in Figure A-8 appears to level off at approximately 0.10. ^
Strouhal numbers are plotted for all members in Figures A-9 and A-10. The com- bined plot of Ns - vs - Log10 IL for bare cylinders is found to rise abruptly at a Reynolds number of approximately 3.6 x 10⁵. In contrast, the N curve for cylinders with numerous windings continues horizontally through the critical re- gion of IL.
Figure A-11 demonstrates in a general manner the influence of the number of windings on spoiler effectiveness. Cocfigurations with four windings repeatedly gave maximum suppression of lift forces.
Figure A-12 illustrates the influence of winding diameter on spoiler effective- ness for the 3" j^ cylinder. The knee of this type of curve occurs consistently at a spoiler diameter of roughly d/l2 to 3d/32. The curves rise toward C 1 for small diameter windings and appear to rise only slowly for large si windings.
,./C. KB
The relative insensitivity of the phenomenon to spoiler pitch is shown in Figure A-13 for the 6" ^ cylinder, A wide effective range exists from a pitch of approximately 8d to about l6d. The most effective pitch appears to be at about 12a.
Thus, optimum spoilers may be assumed to be 4 windings of size d/l6 or larger at a pitch of 12d.
3.3 Results of Tests on Spring-Supported Qylinders
An example plot of the response of the 5" $ cylinder is presented in Figure B-5 in the form of (HDD) - vs - wind velocity. The plot compares the response of the bare cylinder to the response with both spoilers and anti-spoilers attached. In all cases the resonant response was reduced dramatically by the addition of spoilers.
Values of the standard CL. at resonance are plotted - vs - Login N for bare cylinders in Figure B-6 and for cylinders with 8 - 3/l6" ^ windings in Figure B-7- The resulting plots of C for these two cases are not significantly dif- ferent from each other. The curve of C for bare cylinders is lower than that for CK in Phase A, and the data is rath&r scattered. The "tail" effect is again apparent for resonance at low velocities. The general trend of the CL, curve is to decrease to a rather low value in the vicinity of the critical Reynolds num- ber of 3.6 x 10-'.
Figures B-8 and B-9 represent plots of Strouhal numbers calculated from the resonant response of bare cylinders and of cylinders with numerous windings, respectively. There appears to be no difference between the two plots for the vibrating cylinders. In both cases there does not seem to be a rise in N at the critical N^ but Instead, there appears to be some tendency to continue horizontally. ^There are not enough points at high Reynolds numbers to draw a definite conclusion, but there is at least an indication of a trend. The fact

ER 75-4 39>
that the data is more scattered than for the stationary cylinders may be due to the ability of the vibrating cylinders to control the shedding frequencies at resonance to some degree.
The (iLFVs calculated for the cylinders at resonance are plotted - vs - (ASF) in Figure B-10. A similar curve for v /v is practically identical to Figure B-10. Tims, the supposition that (ILF^ =C^ /▼ is verified, and the (ASF) proves itself to be a valid basis for deterSinSSg the degree of self-amplifica- tion.
8.4 Results of Tests on Flexural Members
Example response curves for a bare test member and for the member with spoilers over varying portions of its length are exhibited in Figure C-5. For most of the members tested, vibration amplitudes were suppressed to approximately IO56 by optimum spoilers wound over portions as short as 20^ of the member lengths. A spoiler length of O.kOJ?^ gave the best results in most cases. It must be pointed out, however, that spoilers were not as effective for the small diameter members as for the larger diameter members, and they were not as effective on cantilever members as they were on members supported at both ends. Thus, it appears that the larger the (NDD) the less the effectiveness of the spoilers. Therefore, spoilers should be most efficient on fixed-end members, as shown by the results of the Phase C tests.
Figure C-6 shows calculated values of the standard CL. at resonance for bare mem- bers. A smooth curve is drawn through the predominant pattern. It is difficult to say whether this curve should continue to drop or -whether it should level off in the vicinity of N = 10?. The CL, at lower Reynolds numbers appears to level off at a value of 0.Q8. K-
The Phase C Strouhal numbers appear in Figure C-7. It is readily apparent that these values check very well with the plot of N obtained from stationary cylin- ders in Phase A. b
The curve for (ILF) for the vibrating members is shown in Figure C-8. The data is some-what more scattered, and the curve is definitely lower than for the cylin- der tests (shown by dashed lines) discussed above. The latter discrepancy is probably due to phase differences along the lengths of the members vhich do not arise along the lengths of cylinders oscillating as rigid bodies.
From load tests on compression specimens a value of 10.72 ksl was obtained for the modulus of elasticity of 6o6l T6 aluminum tubing.
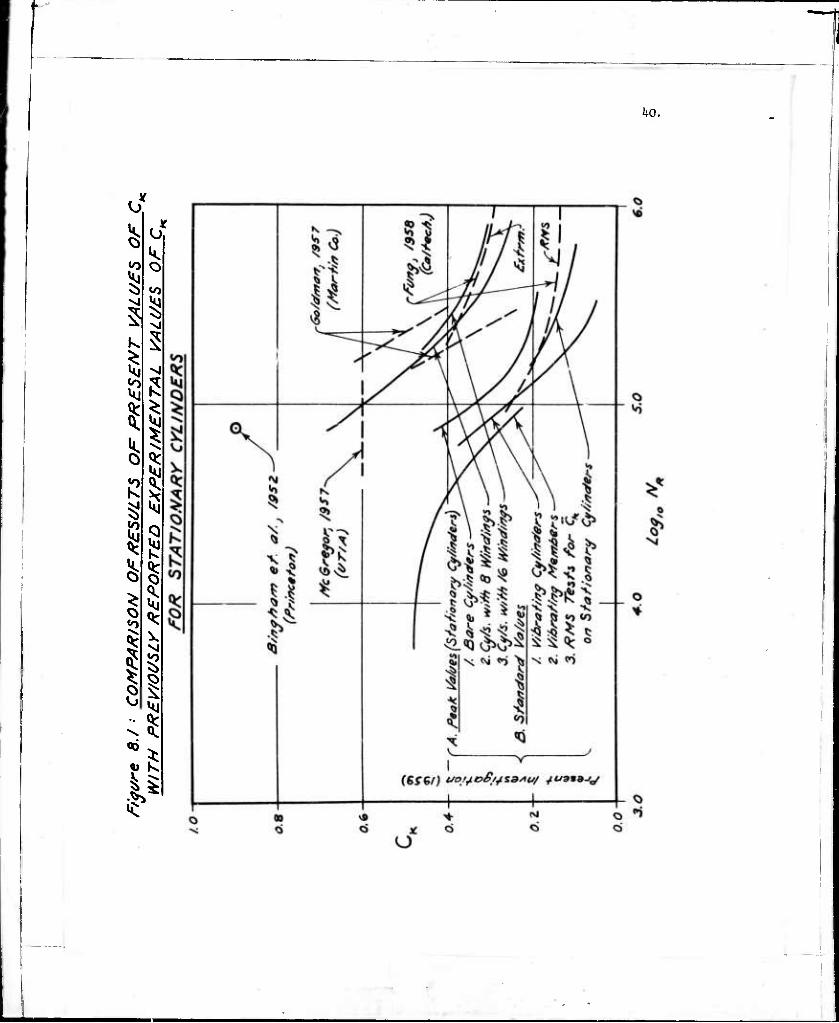
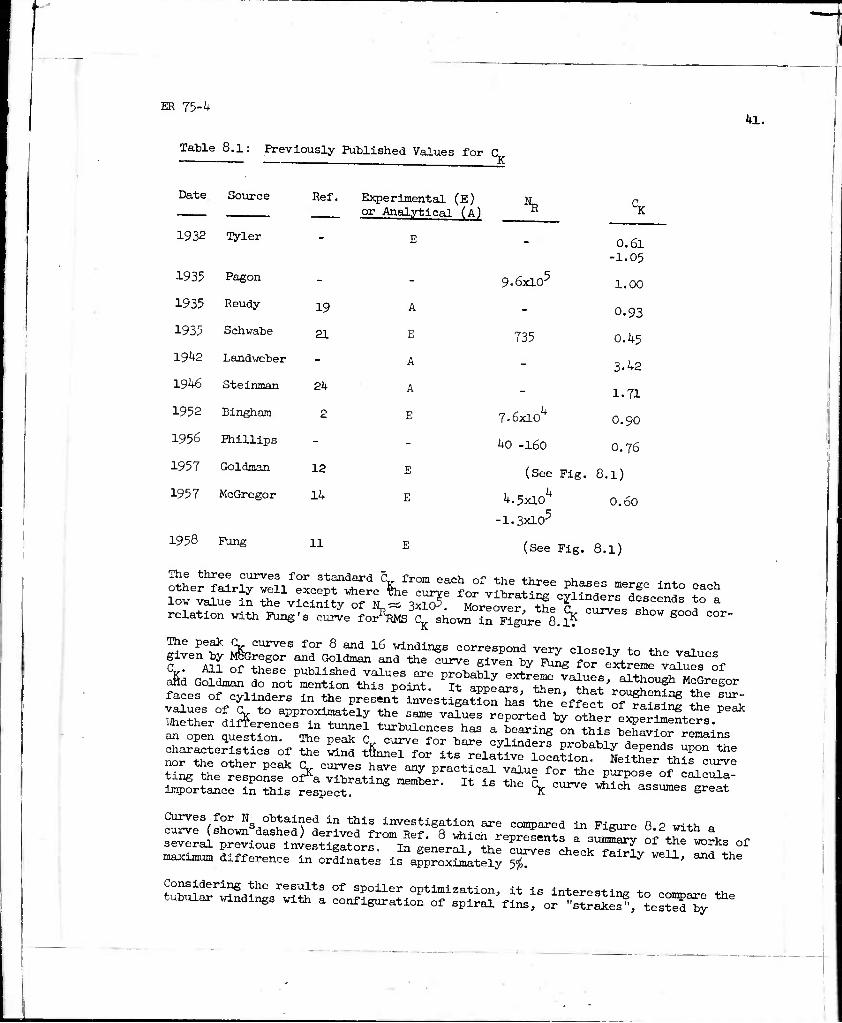
8.5 Correlations among the Results of the Three Phases and Comparisons with Previously Published Information
In Figure 8.1 all of the C and C curves determined in this investigation are represented by the solid lines. Isolated points and dashed lines denote the values of CK reported by previous investigators, and Table 8.1 summariaes pub- lished values for CK and notes -whether they are experimental or analytical.
lb
I 8
co
I I IS
IS
ho.
-1
ER 75-4
Table 8.1: Previously Putlished Values for C K
41.
Date Source Ref. Experimental (E) or Analytical (A) ^
1932 Tyler -
1935 Pagon _
1935 Reudy 19
1935 Schvabe 21
1942 Landveber -
1946 Steinman 2h
1952 Bingham 2
1956 Phillips -
1957 Goldman 12
1957 McGregor 14
1958 Fung 11
- 0.61 -1.05
9.6xl05 1.00
- 0.93
735 0.45
- 3-42
- 1.71
7-6x10^ O.90
40 -160 O.76
(See Fig. 8 •D 4.5x10^ 0.60
-1.3X10⁵
(See Fig. 8 1)
A
E
A
A
E
E
E
The three curves for standard C from ear-h nr +v,o 4-v.«—. u
ration «1th Pas's eurv. for^EMS (^ Äo™ 1^^.* SLSf SOOa COr_
tte pes*. r curves for 8 «na 16 vlndlngs correspond verv eloaelv »„ «,. „ ,
fee. of oyllndere in the pre.en? Iwesttg.?"^ SfirSS o?^SS Si '^
importance in this respect. r. xt i8 tue (^ curve vhich assumes great
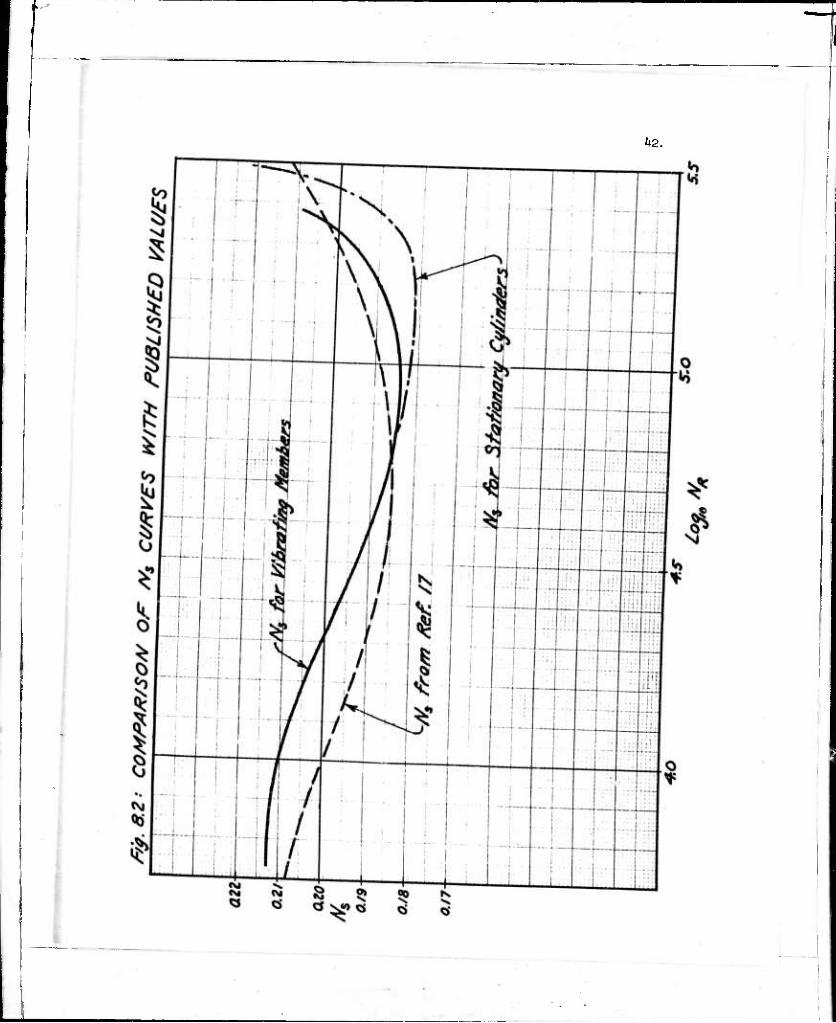
Curves for N obtained in this investigation are compared in Figure 8 2 with .
maxxmum difference in ordinates Is approximately 5^ y 11' ^ the
k2.
ER 75-4 ,,
C. Scruton and D. Walshe (Ref. 23). Scruton introduced a design consisting of three helical strakes of height up to d/8 and set at a pitch of 15d. He states that the strakes must be of sufficient height and number and that their helical foraation is an essential feature. He further states that their effectiveness increases with size but that they need be no larger than l/8d. In addition, he reports that the result is not sensitive to pitch and that a single strake is not effective because of the opposite-side characteristic of vortices. Scruton also states that any number of strakes can be used, but he does not support this remark with experimental evidence. It is apparent that the tubular windings op- timized in the present investigation show characteristics similar to Scruton's strakes, with some reservations.
IX DESIGN CRITERIA. PROCEDURES. AMD APPLICATIONS
9-1 General
The general approach to presenting design and/or analysis tools for tubular alu- minum members of antenna space frames is as follows:
a) Design criteria, drawn from the resulrs of the laboratory experiments, are summarized and applied.
b) The members are separated into categories of end fixities pinned, fixed, and selected conditions of intermediate elastic supports.
0) A specific wall thickness of l/l6 th of the outside diameter is chosen for each tube size from 2"<f> to 8"^ In Increments of one inch. This selection of mem- ber sizes is representative of proportions used In practical design and has also the convenient property of geometric similarity. The exception to this rule is the 7 'p x 3/8" tube, which was chosen because the 7/l6" thickness is not manufac- tured. The sizes selected, then, are the following;
2" i x 1/8" 6" i x 3/8"
3" i x 3/16" 7" i x 3/8"
h" £ x l/V 8" i x 1/2"
5" ^ x 5/16"
Behavior of members of other diameters and wall thicknesses may also be interpo- lated from the charts presented herein.
d; Charts are constructed which can be used to obtain natural frequencies, criti- cal velocities for resonance, Reynolds numbers at resonance, applicable values of C^, and resulting maximum flexural stresses in terms of Incremental deflection fkctors, (IDF), for any practical-sized bare member. The manner of constructing the charts is described, and examples for use of the chartt, are given.
e) A second set of charts provide a graphical means of determining the effect of self-amplification due to the vibration itself. These charts give the values for the aeroelastic suppression factor, (ASF), the incremental load factor, (ILF), and the Incremental deflection factor, (IDF), for various conditions of end fixity. In addition, the values of (IDF) are applied to the values of CT = 0 (IDF) ob- tained from the first set of charts, producing values of inaxlmumlnfjexural stress

ER 75-^ 44.
in kips per sq. in. as the end result,
f) A recommended method of approach is given for the design of antenna members against lateral vibrations due to wind. The use of spoilers is discussed, and effective configurations are specified.
g) Applications to existing structures are also considered, and an example study of an actual structure is hriefly outlined.
9.2 Design Criteria
a) Strouhal Number
The range of Reynolds, numbers of interest for the members of antenna structures is approximately from 10 to 10 . Within this range the Strouhal number varies, but design procedures are simplified somewhat assinning N to be constant. The average value of N = 0.19 will be used as a design criterioR in this report (see Figure C-7). S
b) Lift Coefficient
A curve for standard Karman lift coefficient, C , must be specified for design purposes. Of the plots shown in Figure 8.1, the CK curves from the vibration tests of Phases B and 0 represent the appropriate values. The fact that the Phase B curve descends to a low value in the vicinity of the critical Reynolds numbers conforms to the stochastic response calculations presented previously in Section 4.3. However, Figure C-6 shows some deviation of flexural members from this trend. Therefore, in order to provide conservatism in the design, a combina- tion of the Phase C curve for CL. and Fung's RMS curve at super-critical Reynolds numbers will be used in the graphical analysis charts of this section.
o) Self-Amplification
The (TLF) curve from member tests shown In Figure C-8 will be used for predicting the degree of self-amplification of actual structural members. An upper limit of (ILF) = 1.40 will be selected for the case of zero damping. This value is set somewhat below Steinman's limit of 1.45 (see Section 3.4) because of the phase differences discussed previously.
9.3 Analysis Charts
a) Charts for Resonant Frequencies, Velocities, and Stresses (AC-al to AC-a.k)
(l) Oongtouctlon of Charts (AC-a)
A-Lines are plots of fundamental frequencies of vibration, f = 0 (r,L), - vs - length of member for various member sizes.
V B-Lines are plots of vortex shedding frequencies, f = N =, using N =0.19 deter- mined from the experiments. The shedding frequencies anä natural frlquencies are matched on scale 2 to give the critical velocities directly on scale 3.
C-Lines represent the corresponding Reynolds numbers, N = 780 v d, at resonance - vs - critical velocities. The experimentally-determined plot or the standard lift coefficient, CL., is plotted - vs - Reynolds numbers with ordinates shown by scale 5«
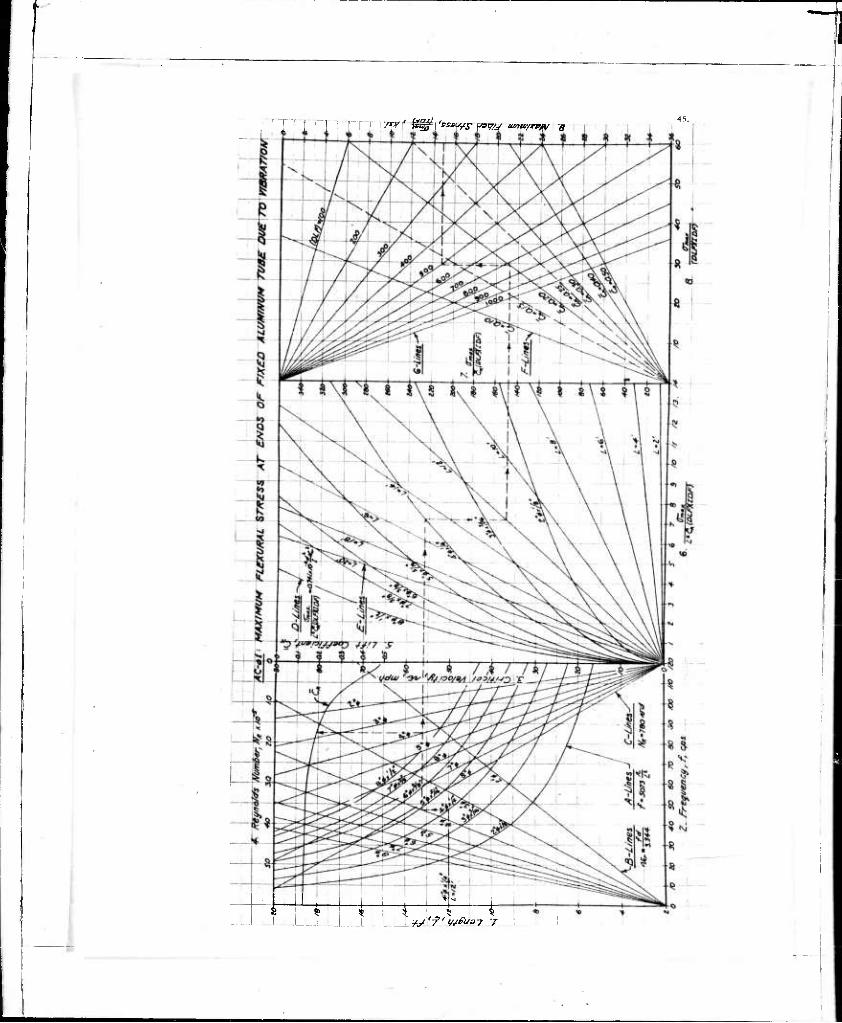
__..L | ' { ! i ' T—r _LI_LL_L_1 IjylT'JJvMey. i

-t t i M I t r -t

r f j i \k j I %

r '■'*? e~&*jg\ **"*-'/r ^»«5/ mmf/t»w e
ER 75-lf ^9.
D"Llnes ^e Partial solutions for the maximum fiber stress, in the form of
max
L^ (DLF) (IDF) cr'
vs - the critical wind velocity.
cr max by L for various E-Lines constitute a multiplication of —* -
L^ (ULF) (IDF)
lengths to obtain the expression (Tmax
CK (DLF) (IDF;
Z^Lines continue the process by mltiplying the last expression by various values ot ;=, xo obtain U max on scale 9.
Tt TDLFTJTDF)
G^Lines represent a final graphical multiplication for a variety of dynamic load factors to give (Tmax on scale 9. J J a^
(IDF)
Thus, the charts provide a direct solution for the maximum flexural stress in a
tion'forthr^ t0 ? CrltiCe1 ^ ^lodty ...... and a semi-automatic solu- ^ i?ti«i S?^ a ^^ sutJected t0 a wind velocity, somevhat greatar than the critical, vhich causes the maximum stable amplitude of vibration. If the mem- ber is very stiff the amplitude will be small, and the tvc cases will be aimroxl- mately the same. In general, however, the effect of self^lification must be evaluated by making use of the second set, of charts, (AC-b). Ite lat+er charts yield the applicable values of (lDF);s and increase the output of charts (AC-a') accordingly, v aj
(2) Procedure for Using Charts (AC-ä)
In order to use the analysis charts it is necessary to know (or to estimate 1 the ^f™*12^ -ength condition of support, and the logarithms damping decrement. The following steps describe the procedure for using the charts;
a. Select the appropriate chart (depending upon the conditions of support) and enter scale 1 with the member length, in feet. Draw a horizontal line to the A- Line corresponding to the appropriate member size. The abscissa of this point is the natural frequency of the fundamental mode cf vibration (scale 2).
b. Draw a vertical line to intersect the B-Llne representing the outside diameter (scSe '-J)11106^ Kle critic:al **** velocity is given by the ordinate of this point
t^^ !friz°f ^ liae to meet the C-Elne also representing the outside diam- eter. The Reynolds number at resonance may then be read on scale 4S and the corresponding von K^rman lift coefficient may be found by projecting a vertical line to the C^ curve and reading the value en scale 5. vwsicaj.
d. Extend the horizontal, line of step c to the D-Line for the member size,
e Draw a vertical to the E-Line for the know span, length. The ordinate of this point is given on scale 7 as the fiber stress for a statically applied load with

ER 75-^ 50.
f, Draw a horizontal line to the F-Llne -which corresponds to the value of C found in step c. The ahscissa of this point is the fiber stress (scale 8) f§r a statically applied load determined by the indicated value of C .
K
g. Draw a vertical line to the G-Line of the dynamic load factor corresponding to the logarithmic damping decrement for the structure. The ordinate of this point is found on scale 9 to be the maximum flexural stress, magnified by the (DLF), but not yet modified by the incremental deflection factor, (IDF).
h. A separate calculation for the (IDF) may be made 1'or each member in the fol- lowing manner:
(1) Compute the aeroelastic suppression factor, (ASF), for the member, using the expressions developed previously.
(2) Obtain the (ILF) from the experimental plot from member tests. HlctX
(3) Compute the (IDF) for the member using the expressions developed for this application.
An alternative procedure for finding the (IDF) is to make use of the second set of charts, (AC-b), constructed for this purpose. The latter charts are explained in the next section.
b) Charts for Determining Effects of Self-Amplification (AC-bl to"ÄC-b4)
(l) Construction of Charts (AC-b)
A-Lines represent a partial calculation of the aeroelastic suppression factor, (ASF), for various wall thickness-diameter ratios. The partial product, given on scale 2, does not Include the effect of the lift coefficient, (L.
B-Lines serve to divide the abscissae on scale 2 by the indicated values of C to give (ASF) on scale 3. The experimental plot of the corresponding incremental load factor for a vibrating member then provides (ILF) on scale k. The (ILF) is then squared graphically as shown by the (ILF) curve and scale 5.
C-Llnes constitute a partial solution for the second denominator term in the appro- priate expression for the incremental deflection factor, (IDF), depending upon the thickness-diameter ratio of the member.
D-Lines multiply the C-Lines by various values of dynamic load factors, (DLF).
E-Llnes bring in the additional effect of cL and give the second denominator term on scale 8. The curve for (IDF) converts scale 8 to scale 9 by means of" the equa- tion.
(Scale 9) (Scale 8)
(T, max F-Llnes perform the function of multiplying the (iDF^s by the values of —1 r- (AC-a). The end results of the operation are the values of the maximum flöJufll stress, 0^rr,~v> in kips per sq.. in., given on scale 10.
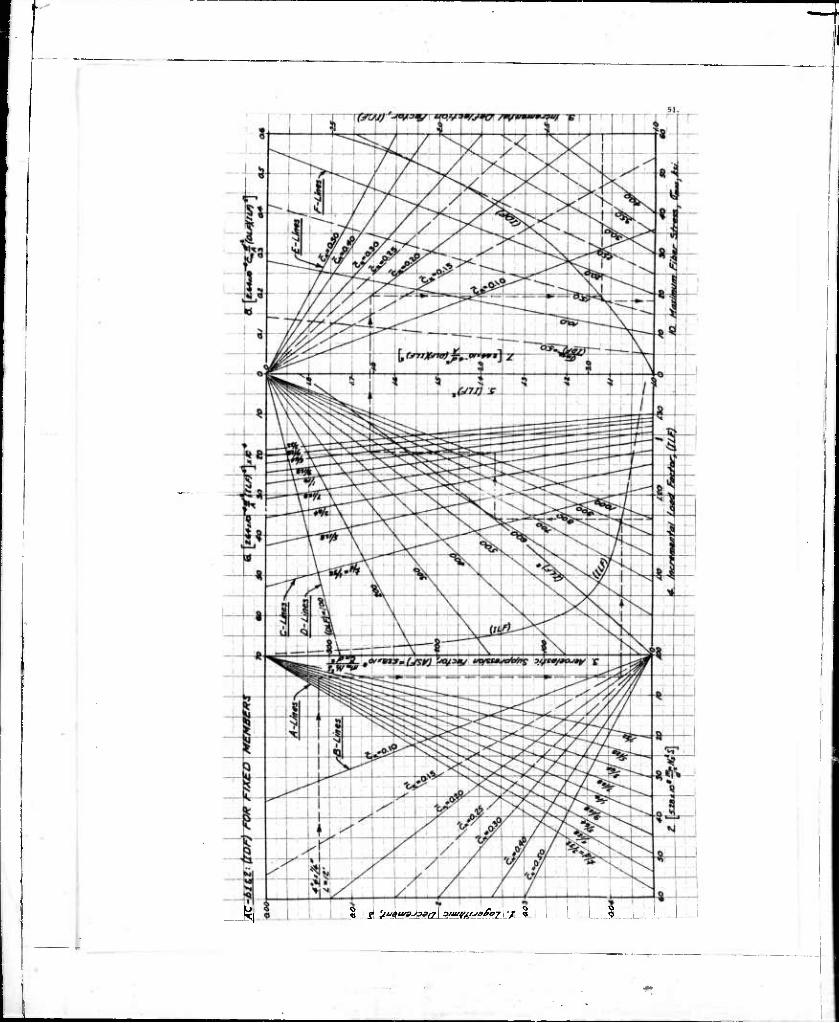
J K «. *l iumumJa»ii7\ »JtftM^frl •/ < i I ■ I . I
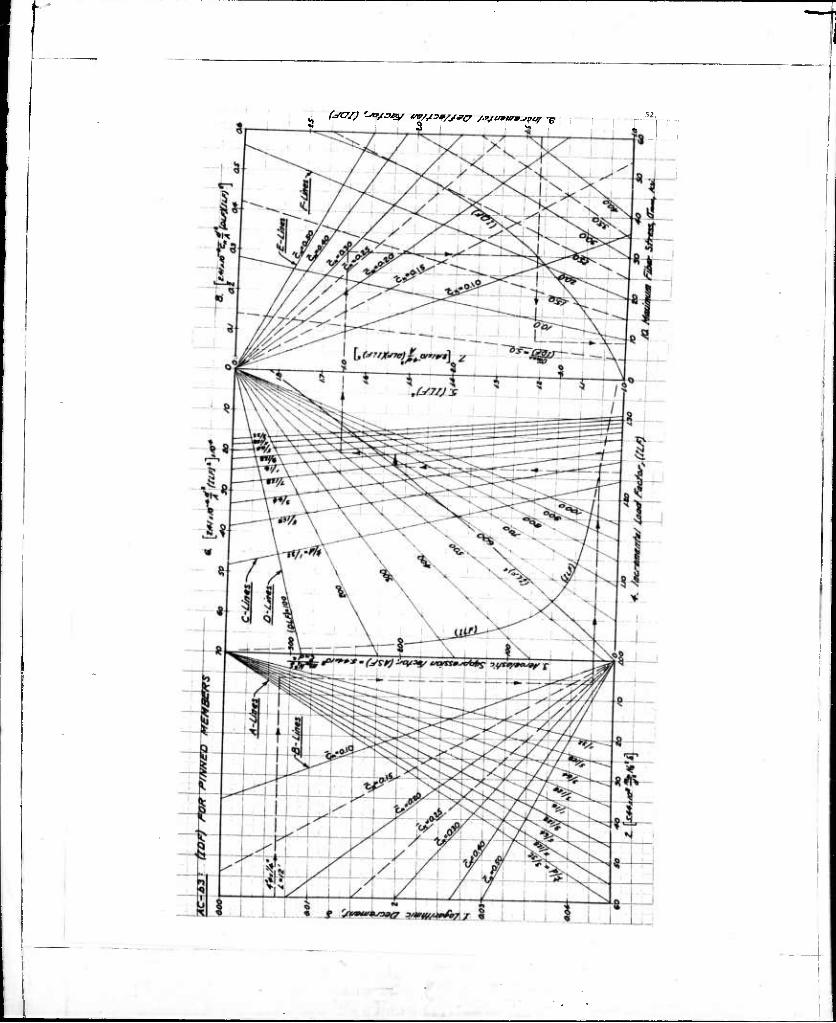
I
_

f
§ $ 'jiiiuuBjsac?^ o,/itw:.'-"r£oA7 % ..1
ER 7^ ^
(2) Procedure for Using Charts (AC-b)
The use of the second set of charts requires the same information as is necessary for the first set. The following steps delineate the procedure for using charts (AC-b):
a. Select the chart corresponding to the support condition of the member. Enter scale 1 with the logarithmic damping decrement, 6 , and draw a Horizontal line to the A-Line labelled with the thickness-diameter ratio of interest.
b. Next, draw a vertical line to intersect the B-Line for the previously- determined value of CK. The ordinate of this intersection is the (ASF) on scale 3.
c. Project a horizontal line to the experimental (ILF) curve and read the value of (ILF) on scale k if desired.
d. Draw a vertical line to the (ILF)2 curve.
e. The next step is to draw a horizontal line to meet the C-Line of the appro- priate thickness-diameter ratio.
f. Draw a vertical line to the D-Line of (DLF) corresponding to <S .
g. Trace a horizontal line to the E-Llne of the known (L.
h. Next, draw a vertical line to the (IDF) curve and read the value of (IDF) on scale 9. * '
i. Finally, project a horizontal line to the proper F-Line (or interpolated F- Lme) for the value of CTinax obtained previously from charts (AC-a). The value
of (Tmax on scale 9 ls4fiPmaxiraum vibratlonal fiber stress for the member under consideration.
Analysis chart (AC-bl,2) is intended for use with both the case of fixed ends and the case of semi-fixed ends with f = 2.10 f . This procedure is an approximation involving very little error because of the fact, that the mode shape for the semi- fixed case is almost the same as for the fully fixed case.
When many members are to be analyzed for wind-induced vibratlonal stresses, it is recommended that a tabular method for organizing the results be adopted. The fol- lowing items should be included in the table:
InjDut: Size, length, condition of support, £ , and (DLF).
Output of (AC-a): f, vcr, N , and ^"max . cr (IDF)
Output of (AG-b): (ASF), (ILF), (IDF), and Crmax.
c) Quantitative Examples
The following examples are analyzed graphically by the methods described, and the solutions are traced with dashed lines on the charts.
•
ER 75-h 55-
(l) Fixed Members : (V frf x l/h" x 12,-0"; DLF = 500)
(Analysis Chart (AC-al):
Natural frequency, f = h'J.O cps.
Critical velocity, v = 56.0 mph.
Reynolds number, N0 = 1.75 * 10
Lift coefficient, C^ = 0.20
Fiber stress, ^•'max = ih.d ksi TTDFT
Analysis Chart (AC-bl):
(ASF) = 5.28 x 10⁸ min Ns & = 28.05
(HF)
(IDF)
1.168
1 - 2.6ij. x 10'h K. d2 (DLF) (HF)2
max = 14.80 x 1.241
= 1.241
= 18.37 ksi.
/„x Semi-Fixed Members: (h" <f> x l/h" x IS'-O"; DLF = 500)
(kj£. )2 = 2.10 (kj2 )2 pinned
Analysis Chart (AC-a2):
Natural frequency, f = ^3.5 cps.
Critical velocity, v = 52.0 mph.
Reynolds number, N_ = I.63 x 10
Lift coefficient, (L = 0.20
Fiber stress. CTmax - 12.20 ksi. (mF)
Analysis Chart (AC-b2);
(ASF)
(HI')
(IDF)
Thus, (T
Assumed to be same as for fixed case.
12.20 x 1.2kl = 15.1^ ksi. max

ER 75-4
(3) Pinned Member: (4" jrf x 1/4" x ^'-O"; DLF = 500)
Analysis Chart (AC-a3):
Natural frequency, f = 20.5 ops.
Critical velocity, v =24.5 mph. er r
Reynolds number, ND = 7.5 x lO1' R
Lift coefficient, C= 0.30
Fiber stress, ^max = 6.20 ksi.
Analysis Chart (AC-b3):
(ASF) = 5.44 x 10° '% Ns
(IDF)
m N 2 C m s O
(ILF)
(IDF)
%.
19.25
1.235
1 " 2.4l x 10"4 C d^ (DLF) (ILF)2
Ä
1.422
Thus,
<K.*V = 1^22 x 6.20 = 8.82 ksl
(4) Cantilever Member; (4" ^ x 1/4" x 6'-0"; DLF = 500)
Analysis Chart (AC-a4):
Natural frequency, f = 29.0 cps.
Critical velocity, v^ = 35.0 mph.
NR = 1.10 x 10 Reynolds number.
Lift coefficient, CL. = 0. 25
Fiber stress.
5
Umax = 11,00 ksi. (IDF)
Analysis Chart (AC-b4) :
(ASF) = 4.42 x 108 mm Ns S = 18.85
C^d2
(ILF)
(IDF)
= 1.246
Thus,
1 " 2.46 x IG"4 C d2 (DLF) (ILF)2
Ä
1.35
max = 11.00 x I.35 = 14.85 ksl
56.
ER 75-4 57.
9.4 Procedure for Design. Agalnst Lateral Vibrations
The charts presented In Section 9-3 are intended for use in the design of antenna space frames consisting of tubular aluminum members. The procedure for design against lateral vibrations due to von Kann£n vortex forces is outlined in the fol- lowing steps:
1. -Make a preliminary design of members on the usual basis of working loads.
2. Estimate damping and conditions of end fixity for all members.
3. Obtain the critical wind velocity for each member from the charts. Select an arbitrary wind velocity (depending upon prevailing wind conditions at the site where the structure will be located) below which fatigue will be a primary con- sideration due to the likelihood of frequent winds causing a large number of stress repetitions.
k. Obtain values of stresses at resonance from the charts for each member. Com- bine these stresses with working stresses and compare the totals with allowable values. For members with critical velocities below the arbitrarily selected velo- city, the allowable stress should be based on fatigue considerations. For members with higher critical velocities, the allowable stress may be based on dynamic yield Jrt-resgth considerations.
5. The foregoing stress analysis will show which members will be endangered by the possibility of wind-induced vibrations and to what degree. A new design should then be executed using larger members and/or Intermediate braces in order to in- crease the natural frequencies of the members concerned.
6. If in step 5 the members are found to be excessively large compared to their working load requirements, or if the structure as a whole is Judged to be unduly complex and redundant because of the addition of bracing members, the use of spoilers should be considered. The spoiler configuration to be used, as deter- mined by the present experimental investigation, is four helical windings symmet- rically spaced 90° apart with respect to the axis of the member. The spoilers should be wound at a pitch (number of cylinder diameters per turn of a single winding) of 12 diameters. The diameter of the windings should be 3d/32i where d is the outside diameter of the member. The spoilers should extend over the cen- tral kOfi of the member to which they applied.
7. Another alternative solution to the problem is the use of rolled or extruded shapes other than structural tubing. The primary disadvantage in the use of rolled sections for space frames is the inherent difficulty in making three- dimensional connections. The circular tube possesses the advantage that any pair of perpendicular axes are principal axes, and the section properties are indepen- dent of rotation about the longitudinal axis.
9.5 Analysis of Existing Structures
a) General
The charts are also useful for the purpose of making a vibration analysis of an existing structure. The procedure to be followed is the same as for design. In this case, however, member sizes cannot be changed; so only the two alternatives of addijig braces or of adding spoilers are available. The latter alternative is much more desirable than the former because of (l) the ease and speed of
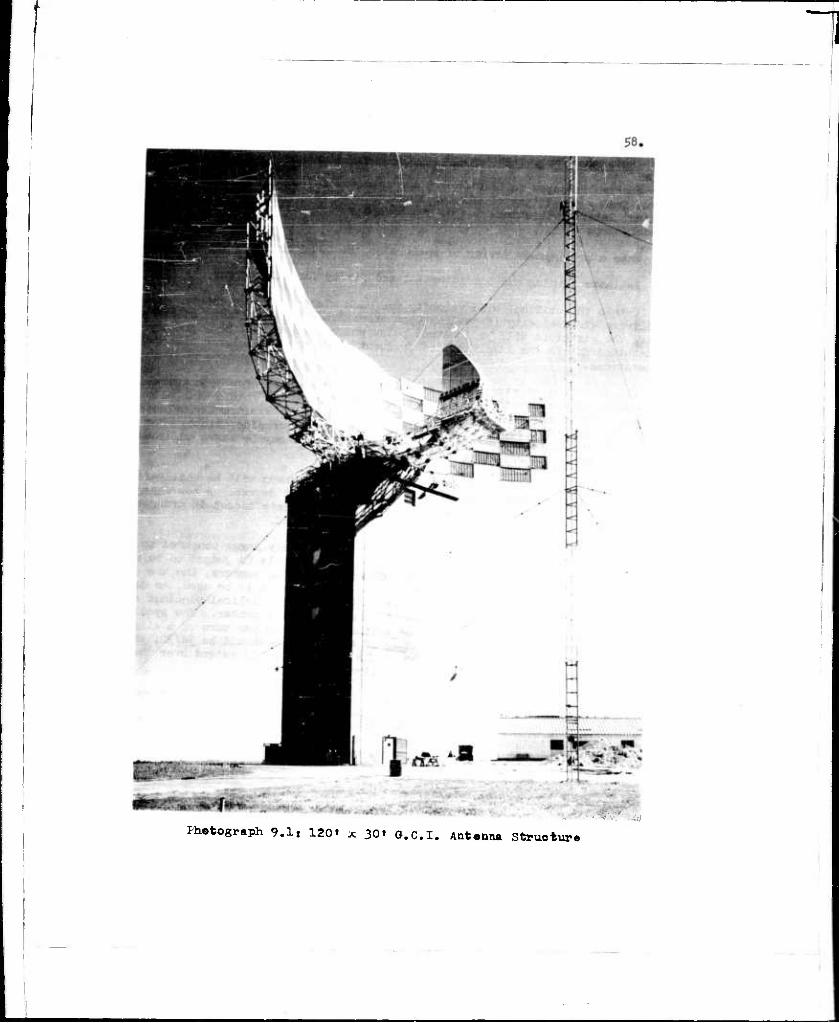
Photograph 9.1t 120t j, 301 O.C.I. Antonna Structure ■ ^^ ■■'. ■.;'

59.
JO «a t» «> /« /a a *
Symm*/:. tn&t £
ao1
TO/» /»/^Z> BOTTOM
ffft//-* 3./- SCHEMATIC D/AGRAM OF GX.l. ANTENNA
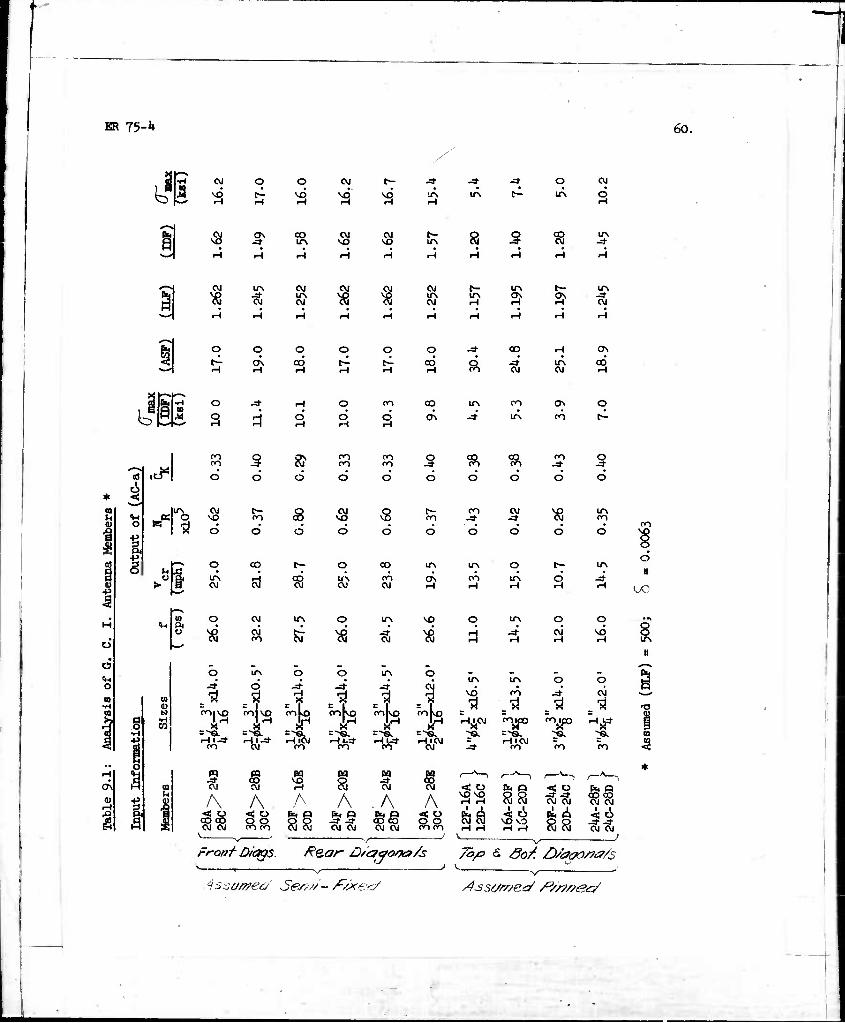
ER 75-b 60.
IP CVJ
iH
o -4- -* t^
o cvi
d
(M $ » cvi 8 3 CO cy
cu CM CXJ
ON t- ON
o o ON
o oq
o o
(4 o
ft
CO
CVI ITN OJ
o\ cö
bs o d CO
ON
en ITN
ON O
OJ ■<?\
o
I _« O
I
CVJ VO
CVJ
d
co
d
s d
co CVJ
00 no
CVJ NO
UN C\J
s d
00
CVJ
s d
t— m
ITN
ON
d
ro -3-
ITN
rö
d
CVJ
o ITN
d
d
s d
l/N
O I
^3 CVJ
CVJ co & « CVJ «
o rH
ITN o cvj
o M3 8
ITN
ON
(U
I
g
I
w
O IfN
-^ d
CO|Np COJ
Hl-* CO
CVJ
< o OO CO CVI CVJ
co
o o CO OO
o
rH
COlNO CoL)
rHlCVJ CO
V£l
A A A 8S
^ s bs 00
x rHi^t
co
-*
T ^
o cvj
i 1 5
OJ 8 A .A A
CVJ CVJ ÖS CVJ CVJ
MD
NO NO
cö .^
co
<5ic!> NO VD
-COjp
co
O
OJ
W CVI
SS ^6
Froni- D/ags. Rear D/'&aooo/s Top <S ^ö/f ö&toO/fa/s
*
as3ü/??ec/ Se/9u-/•/Jxe^ /4ssc/meaf /ty/f/tea?

ER 75-4 61.
installation, (2) the lov cost of material, equipment, and labor involved, and (3) the preservation of the integrity of the structural framing. The slight in- crease in drag and dead weight of the structure due to the addition of spoilers is inconsequential compared to the alternative of adding bracing members.
b) Example Analysis of the G.C.I. Antenna
The 120* x 30' G.C.I. Antenna Is a large radar antenna constructed in 1958 at the Boston Hill site in North Andover, Massachusetts. This structure was analyzed for wxnd-induced vibrations in a preliminary manner by the writer (Ref. 29). The antenna is shown in Photograph 9.1, and a schematic diagram of the space frame appears in Figure 9.1. Properties and characteristics of the more flexible mem- bers of this space frame are summarized in Table 9.1. Analysis charts (AC-a) and (AC-b) are used to obtain the vibrational information and the flexural stresses which are also presented in Table 9.1.
In this antenna a system of intermediate braces was tional stresses.
added to alleviate the vibra-
X DISCUSSION
10.1 Validity of Initial Assumptions
The basic assumptions stated in Section 5.1 were substantiated in a satisfactory manner by the results of the experiments.
Spanwise correlation of the vortex shedding mechanism appears to have been a fairly valid assumption for stationary cylinders. Otherwise, a continuous cui-ve for C would not have been obtained for various size cylinders having different aspect ratios. For vibrating cylinders and members, spanwise correlation is insured to a great extent by the vibration itself. The ability of vortices to conform to the motion of flexural members is demonstrated by the ease with which higher modes of vibration are developed. In these higher modes, vortices must be shed simultane- ously from opposite sides of the member along different portions of the span, and yet the flow picture readily adjusts Itself to accomplish this complex feat.
The assumption that spoiler configurations optimized on stationary cylinders are optimum for vibrating cylinders has also proved to be Justified. The reduction of the response amplitudes in Fhase B speaks for itself in this respect. There was no opportunity to optimize spoilers on cylinders smaller than. 3" ^ because the re- sulting aspect ratios would have been too large for the cylinders to behave as rigid bodies in the standardized set-up of Phase A. Therefore, the optimum spoilers for larger diameters were extrapolated to the 1 l/2" ^ and 2" ^ members by geometric ratio. In some cases these spoilers were not too effective, but this short-coming is probably due to factors other than the method of extrapola- tion.
The fact that the standard (L curves of Phases B and C merge into each other veri- fies the assumption that short, spring-supported cylinders may be used to simulate the behavior of structural members which are too large to test in the wind tunnel. Since the plotted values of C are independent of the self-amplification phenome- non, this result is to be expected.
Directing this project toward studying first modes of vibration for all types of members had the advantage of simplifying the laboratory instrumentation problems

ER 75-4 62.
as well as covering the consideration of primary interest in most structrual mem bers. However, disregarding the higher modeTo? vibration fo^verj SeSS mZ- bers can be unconservative where the vortex-shedding problem is i^olv^d 5he higher modes can cause high stresses in a member evfn whence C is low beS^e
v^ s-tSir.^gr^oiStSd veiocitie8' "* ** -^ "«-— 10.2 Vibrations in Subcritlcal Ran^e
This investigation shows that wind-induced vibrations in the subcritlcal r-™**
iL^LT^L^^f* Vith •«•^«^ S adSer^'o ae'cSc^of the standard n as a basis for all response calculations. The g. not onlv alnTl* f0^the ^«^ess in the amplitude of <>, but It alsfpro^ides Sepen- S ^^JXlJ^SLt^T^^*** - the varLus^herl^rs dence from the mode shape of a particular vibrat! vrtiich affect the degree of self-aiaplification.
10-3 Vibrations in Supercritical Range
a) Antenna Members
Since the supercritical range was of secondary interest to this project insuf
ASZ fV definite conclusions regarding the stochastic response of larae cvlln-
SSsTSSS TSrain1^' there ^^ t0 te -mrincons'lsSSyT^She o^ R^ ?5 "^es B and C In this respect. A study directed toward this reelon of Reynolds numbers Is necessary for the solution of the problem, but toe b£e?lts would be marginal where antenna members are concerned. benefits
b) Large Diameter Structures
coping with past and present difficulties on the subject.
10.4 Discussion on Use of Spoilers
The first mode optimum spoiler design described in Section 9.4 is suitable for th. suppression of vibrations except for the following reservations: SUitable for the
^x S11^^^110* rf 0Tfnded for Reynolds numbers below 1 x 10⁴ or above t, <l ll ? " VaS in thl8 ran«e th»t spoiler optimization was carried out Fluid flow has ^eater ability to override protuberances at ?hrio^ReioldS numbers. At high Reynolds numbers the lift forces on bare cylinde^ are^ui^e erratic without the addition of spoilers, and Phase A tests reveSed ^ d?ffe?
o^rs^ler:.0801110^1111 reCOrdS f0r -P—"i^ Reynolds'Srs ^toSd^th-
b) Spoilers are not recommended for members with diameters smaller than 2" 4 or for cantilevers with £/* greater than 20. This statement is^aied oHhe fact vibration ^er\havin« snall diameters and large non-dimensional aSlitudes of 2^SfJ^fi?!^ ^«demonstrated an ability to persist in fairly large am- plitudes of oscillation with spoilers attached, whereas vibrations In other tvpes of members were readily suppressed with spoilers. ^
KR 75-^ 63-
c) When it is necessary or desirable to suppress modes of vibration higher than the first mode, windings muat be applied over the full length of the member under consideration rather than over only a portion of its length.
XI CONCLUSIONS AND RECOMMENDATIONS
11.1 Conclusions
a) Information Obtained from Tests
•Die experiments conducted in this investigation have provided a continuous curve for Sc in the ran6e of Reynolds numbers of interest for antenna members. This curve represents the basic tool with which the problem of wind-induced vibrations may be solved.
The second essential experimental plot which has been developed is the curve for incremental load factors, (ILF), - vs - aeroelastic suppression factors, (ASF), from the member tests of Phase C. The use of (iLF)'s in conjunction with the ex- pressions for incremental deflection factors, (IDF), permits the calculation of the degree of self-amplification for any of the types of members considered in this project. Moreover, the method can be extended to other types of members by writing appropriate expressions for (ASP) and (IDF) for the particular mode shapes involved.
Experimental plots of Strouhal numbers check well with previously published infor- mation. The accuracy of this agreement (within 5^) is deemed to be sufficient for engineering purposes. Considering all of the possibilities for experimental error involved in the laboratory tests, this discrepancy is reasonable.
b) Effectiveness of Spoilers
Spoiler tests show that a configuration of four helical windings is most effective in suppressing lift forces. A spoiler diameter of d/l6 to d/8 is necessary for good suppression, and a diameter of 3d/32 reduces the lift forces to a minimum. Although the pitch of windings is an essential property of the spoilers, the phe- nomenon is not particularly sensitive to the pitch. The most effective pitch in the wide range of choice (8d to l6d) was determined to be 12d.
11.2 Recommendations
a) Design Criteria, Procedures, and Applications
The design criteria and the methods of analysis and design against vibrations described in detail in Section 9 are recommended for the solution of the problem of wind-induced vibrations in antenna members. Analysis charts contained in Section 9.3 provide complete and automatic solutions for all of the factors in- volved, and the complete range of practical member types and sizes is covered. These charts can also be applied to aluminum structures other than antenna space frames, of course.
b) Use of Spoilers
It is recommended that spiral spoilers of the optimum design described in Section 9.1+ be used wherever this method of suppression is deemed suitable compared to the other choices available. This recommendation is subject to the reservations
ER 75-4 6h.
enumerated in Section 10.4. Disruption of the aerodynamic forces causing vibra- tions represents the basic scientific approach to the problem compared to the usual engineering approach of altering the structure to avoid the difficulties However, both approaches have their merit, and it is the responsibility of the designer to Judge which method is suitable for a given situation.
11•3 Recommendations for Further Research
a) Field Tests in Atmosphere
One of the essential tools lacking in the problem of vibrations in antenna mem- bers is information concerning the structural damping. This parameter varies from one structure to another depending upon the method of fabrication, the type of field connections, and the design of support systems. A series of field tests should be conducted to obtain sufficient information on the damping characteris- tics of existing antenna structures so that the designer will have some basis for estimating the damping coefficients to be expected in new antennae. Without this information the designer is severely handicapped with respect to carrying out vi- bration analyses of his proposed structures.
Within the same series of field tests can be included a study of the response of actual antenna members to prevailing winds. This type of an investigation lacks the velocity control feature of the wind tunnel, but it possesses the advantage of reality with respect to atmospheric conditions at the site. Moreover, in those members in which vibrations are observed, the effect of adding spoilers can also be observed directly.
^) Laboratory Investigations of a Similar Nature
Experiments of a nature similar to the present investigation may be carried out to determine the following information if warranted by necessity:
(1) The effects of axial forces on the response of various types of members may be determined. Of particular interest would be the manner in which axial forces determine the resonant velocity with respect to Reynolds numbers and the manner in which the axial forces affect the self-amplification phenomenon.
(2) Other types of members may be studied. One important aeries of end-supported members is that in which fixities are not the same at both ends.
(3) Higher modes of vibration may be studied to ascertain the relative importance of the various modes with respect to the fiber stresses developed in the members.
c) Laboratory Investigations of a Different Nature
Eiere are two experiments of a different nature from this investigation which should, and without doubt will, be performed at some time in the near future.
(1) A series of tests with elastically-supported cylinders may be conducted in a water channel in order to. obtain a continuous curve for CL. in the range of Reynolds numbers below 10 . "■
(2) Studies similar to Y. C Fung's experiments on a large diameter stationary cylinder should be carried out using large, light-weight spring-supported cylin- ders in order to obtain Information on the stochastic response of Important cyl- indrical structures.
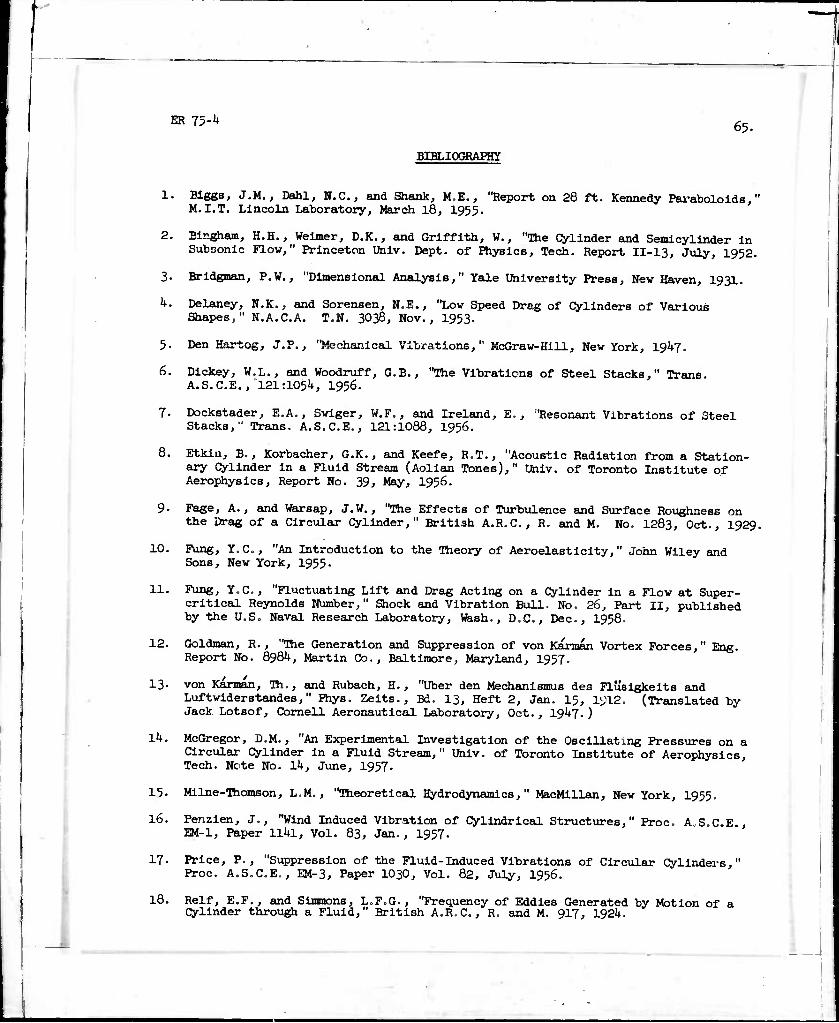
KR 75-4 65.
BIBLIOGRAPHY
3-
h.
Biggs, J.M., Dahl, N.C., and Shank, M.E., "Report on 28 ft. Kennedy Paraboloids," M.I.T. Lincoln Laboratory, March l8, 1955-
Bingham, H.H., Weimer, D.K., and Griffith, W., "The Cylinder and Semicylinder in Subsonic Flow," Princeton Univ. Dept. of Physics, Tech. Report 11-13, July, 1952.
Bridgman, P.W., "Dimensional Analysis," Yale Utaiversity Press, New Haven, 1931.
Delaney, U.K., and Sorensen, N.E., "Low Speed Drag of Cylinders of Various Shapes," N.A.C.A. T.N. 3038, Nov., 1953.
5- Den Hartog, J.P., "Mechanical Vibrations," McGraw-Hill, New York, 19^7.
6. Dickey, W.L., and Woodruff, G.B., "The Vibrations of Steel Stacks," Trans. A.S.C.E.,"121:1054, 1956.
7- Dockstader, E.A., Swiger, W.F., and Ireland, E., "Resonant Vibrations of Steel Stacks," Trans. A.S.C.E., 121:1088, 1956.
8. Etkin, B., Korbacher, G.K., and Keefe, R.T., "Acoustic Radiation from a Station- ary Cylinder in a Fluid Stream (Aolian Tones)," TJhiv. of Toronto Institute of Aerophysics, Report No. 39, May, 1956.
10.
11.
12.
13.
14.
Fage, A., and Warsap, J.W., "The Effects of Turbulence and Surface Roughness on the Drag of a Circular Cylinder," British A.R.C., R. and M. No. 1283, Oct., 1929.
Fung, Y.C., "An Introduction to the Theory of Aeroelasticity," John Wiley and Sons, New York, 1955.
Fung, Y.C., "Fluctuating Lift and Drag Acting on a Cylinder in a Flow at Super- critical Reynolds Number," Shock and Vibration Bull. No. 26, Part II, published by the U.S. Naval Research Laboratory, Wash., D.C., Dec, 1958.
Goldman, R., "The Generation and Suppression of von Karman Vortex Forces," Eng. Report No. 8984, Martin Co., Baltimore, Maryland, 1957.
von Karman, Tin., and Rubach, H., "Über den Mechanismus des Flusigkeits and Luftwiderstandes," Phys. Zeits., Bd. 13, Heft 2, Jan. 15, 1912, (Translated by Jack Lotsof, Cornell Aeronautical Laboratory, Oct., 1947.)
McGregor, D.M., "An Experimental Investigation of the Oscillating Pressures on a Circular Cylinder in a Fluid Stream," Univ. of Toronto Institute of Aerophysics, Tech. Note No. 14, June, 1957.
15.
16.
17.
18.
Milne-Thomson, L.M., "Theoretical Hydrodynamics," MacMillan, New York, 1955.
Penzien, J., "Wind Induced Vibration of Cylindrical Structures," Proc. A.S.C.E EM-1, Paper ll4l. Vol. 83, Jan., 1957.
Price, P., "Suppression of the Fluid-Induced Vibrations of Circular Cylinders," Proc. A.S.C.E., EM-3, Paper 1030, Vol. 82, July, 1956.
Reif, E.F., and Simmons, L.F.G., "Frequency of Eddies Generated by Motion of a Cylinder through a Fluid," British A.R.C,, R. and M. 917, 1924.

ER 75-4 66.
19. Reudy, R., 'Vibrations of Power Lines in a Steady Wind," Canadian Journal of Research, Oct., 1935.
20. Roshko, A., "On the Development of Turbulent Wakes from Vortex Streets." N A c A Technical Notes 2913, 1953. ».ä.W.A.
21. Schwabe, M., Ingenieur-Archiv 6:34-50, 1935.
22' ?99?806; J-5',Wlnd-Exclted Oscillations of Tall Stacks," Die Engineer, London,
23. Scruton, C, and Walshe, D.E.J,, "A Means for Avoiding Wind-Excited OscillationB of Structures with Circular or Nearly Circular Cross-Section," N.P.L. Aero ^ns Oct., 1957- ' -'J^,
2k. Stelnman, D.B., "Problems of Aerodynamic and Hydrodynamic Stability," Proceedimrs £,1?^ HydraUliCS ^«^ence, Univ. of Iowa Sidles in EngineeringrSl^
25. Streeter, V.L., "Fluid Dynamics," McGraw-Hill, New York, 19^8.
26. Strouhal, V., "Über eine besondere Art der Ttonerregung," Annalen der Riysik und Chemie, Bd. 5, Heft 10, Oct., 1878, pp. 216-251. «»«•« a« «y«l* und
27. aomBon W.T., and Barton, M.V., "The Response of Mechanical Systems to Random Excitation, Journal of Applied Mechanics, 24:248-251, 1957.
28. Timoshenko, S., 'Vibration Problems in Engineering," D. Van Nostrand Co., New York, 3 rd Ed., 1955.
29. Weaver, Williom Jr., "Investigation of Vibration of Tubular Members in 120' x 30'
15 1958,t*nna StrUCture'" M-I-T' Lincoln Laboratoiy Group Report 75-2, August
30. Weaver, William Jr., "Preliminary Wind Tunnel Test on Effect of Spiral Spoilers in Reducing Wind-Induced Vibrations of Qylindrical Structural Members," M.I T Lincoln Laboratory Group Report 75-3, August 19, 1958.
31. Weaver, Wiliiam Jr., "Experünental Investigation of Wind-Induced Vibrations in
SSe^rSS' S0' D* nae8lS' DePt" ^ C1Vil ^ ^"^ E^eering, M.I.T.,
APPENDIX A
Phase A Test Results
67.
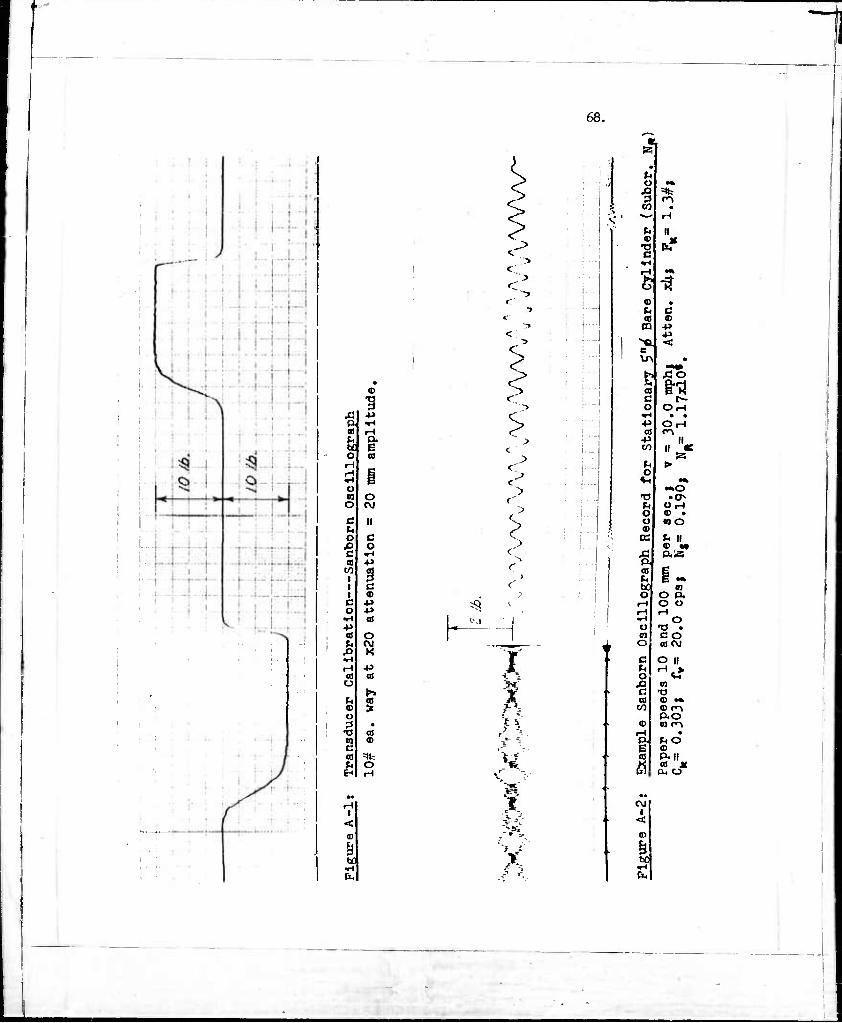
68.
4 at
CO
o 0] o c o
a) CO I I I c o
^1 4J 01
n 0) o
<D O
I
hC
1
P-
O CM
C O
9 c
-p a o CO K
•P a)
a)
a) <D
% O H
r"
X t V 1 »,
JD •fe SJ m, M • —• H
fc N <D K •o ptT C
*H c-H •» a-t <D • u d a 6 m ■p
43 "«a •< c \n •
315 c r- o OH
•H • • +» OH « ro -p II C/l li '
SS ^ t> o
Vt •* -»o
T3 .Qx P OH o © • Ü WO <D C b 11
<D «t Xi P.ä a m P Fi E ** b( a O O P. r-t O o iH H •H O O ■a • CJ CO O arvj
C o || ^ H > ü «4
X> n C •o CO <D ••
CO 0) CO P-O
<D wr^ .-1 • P- FiO K o <d a ii ä PL, u
CO I
PL.
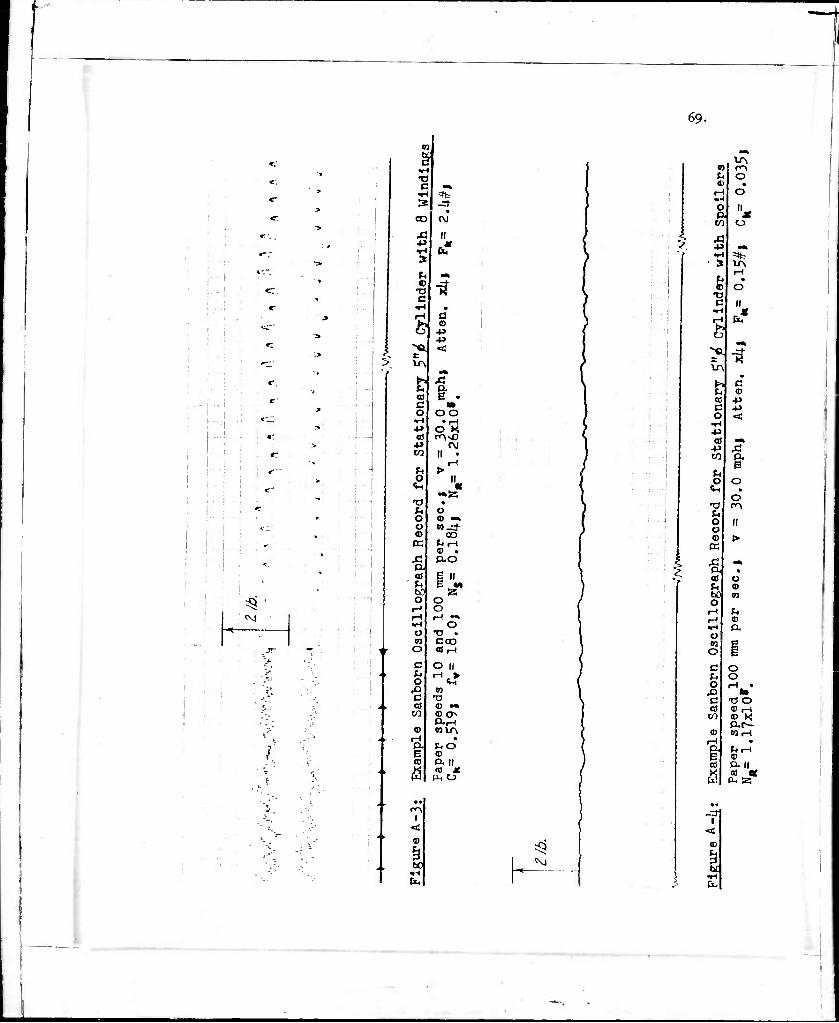
69-
m
SI
c-.
[••-I i '-
«r I ! ; ;
4 j <;
^ N
c •r-l »
CO
4J
<D X( C
A ^
CO C o
^-<
«0
CO
o
•o o o (C
CK
o-l cd
' f-, to o
o
O
d
o x> c 03
CO
P. B H
f Ö
I <
ii
c o ■p -p
■» oo •H
O K
(\l II •
II «
o (D ~»
oo <D .
o o o
•o • coo «H O ||
n •O <D •* «) 0s
P.iH
a P- II at J(
bO
'■ I
. ^ 03 r-\ JH O 4) • H O «-t O II ^ & X
CO o
Ä -p •* •H =«:- s u>
rH
fe O T) c II
«H x l-l PtT h o
^
dg a: ■P C P o <»:
1-1 -p 0) M^
-p Ä t/J P. i ^ Ü o
<M • o
T3 ro Pt O II o « >
03
X •% a . eu o J* « bf in a H L> H (D f-i a o 01 g o E c O n, o o l-l •
^J to c T3 O cd ®|-H
C/J <D K P.!^-
<D «iH r-l • P- Pr-I i 0) td a n
Ö cd « PL. iz.
< <D
bC

70.
hfl Bin .L-L.^
/-+ -,j-_t._.i:. .
:t !
.l..-^l....,....r
i .■ • i
i j v; ■
'I-'! vl''['
I-
■i
C
ö
a c o
^1
a -p CO
o
^ O o <D K
O
o X
fl.
a
l
c o ß
C8
£
o
p.
o o
■a <D <D a. w
© n. CO
PL,
:' I
1 I T !
to
c •o c 3:
vO
o
© o T OJ C X
^r- •
W c c_ •
■p "«a -P t < a i- •
Mt
c vO o a^o Ti • • ■p rOvO m r-
■p II W || 'W
a IU P» o
s-. •^ «m
•a •o ^ OrH o ID . o wo <D
CE b II <D M
Ä P.Ä P. CO P i •« Ec n o O P, r-l o o i-H rH •H O Ü •O s 03 C-cJ- O COCVI
c O II JU H > o <M XI a c •a CO ® •«
C/J «H P<CÜ
v wr^v
'4 feO t* 0) CO ft II K (0 * W| PL. O
^ 1A I <
hO
I
•rH
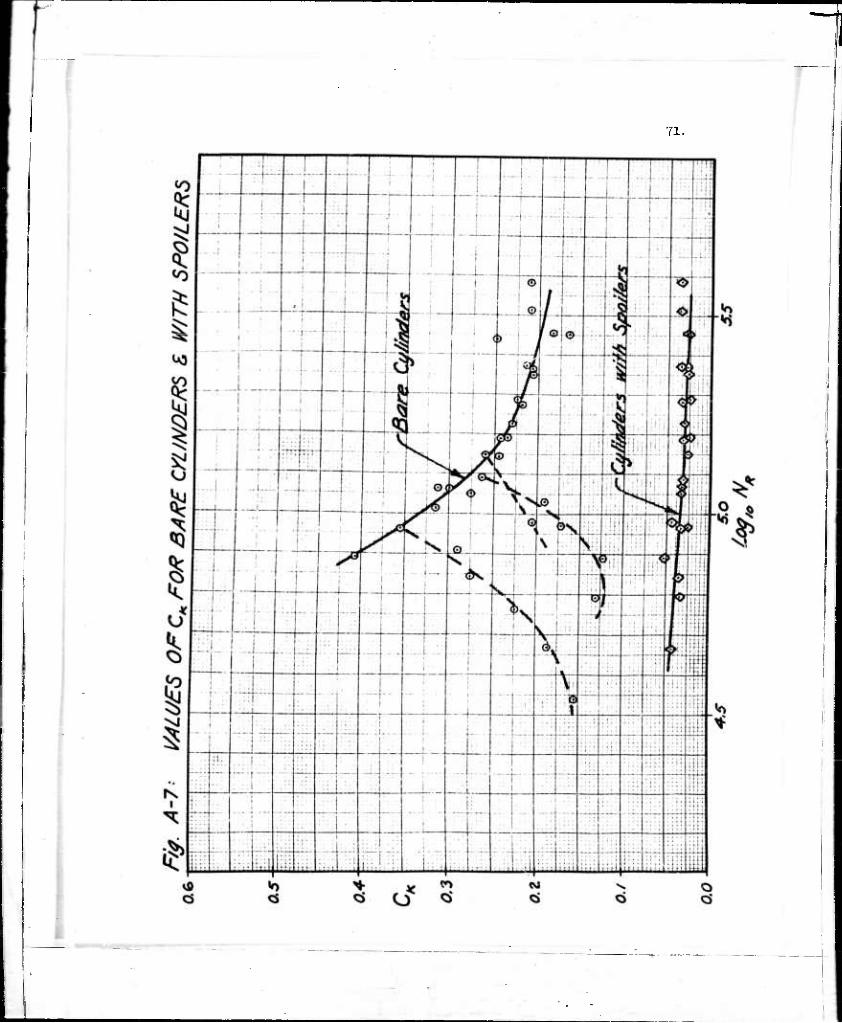
71.

72-
_

73-
0.3Z
03/-
■■'■■{■'■■■
# 4- $: LCQkBJA ...1:..,
1 I' — •■-1- • --
O SO-
1 . ■ i i ■
.;: i..:: ■■■;]■■•
' i
SAJ? i 'Z/A' OgA 5
■* ! 1 : I"-
■ 1 j :i
/i 9a -
H- i
i ■
i
i .,., j; ..
O 7R-
--■'
— i
i ::::■•
j... j- • :":
! ■
O 2.7 -
■ i
: 1. ..:. :,.. i
i ■
...j ... ■
.;.;.
j 1 • i i
:...|.:..
(0 76, ! :: . 1 ! |;-
•:-: ;-r ... j... i
: j. . ii- Sit *-
....j....
O 9A.. ■
■ ■
— — 1
....y . •::;
S) ?* -
~ r— ■••-
, -- -~ ~;~ —: : 1
i
r f S) 9 7 -
!' .... 1 - ■ 1 ■ L: (
i s ■
1
/> 7./ -
i
-: \. . - i
.
i i
OZO- —i— —i i
1 i 1 i
-— -:-; 4 k — ••-
/ Z -4-
'> _|_
M —r- ■
O /<* - A
/7 /Ä-
-,..i\. ir i* 1 ̂
-44 11 ■ 1 —1
'—':
o ty -
j | —i ■— --• —-
i £ ■,..,:....;,
j i A A^: A'-
4A A A
rr- —-—i- : — — ■
j ■ —j—
i
i -■- ■■--—-- --'-
Q /&- . ■ i '; 1
OIS-
~ |_ ....1: : !
1 — L_ — 1 ....j....:
| ■'
. j..... 1 : ■:
^lz :..:]_.:_ i
__1
::. i ,. ' 1; ■
1
• t •
—- .__:..
O.I4- 'iiul -J i— 1 imbm
4.S S.O LoS,c %
JT.S
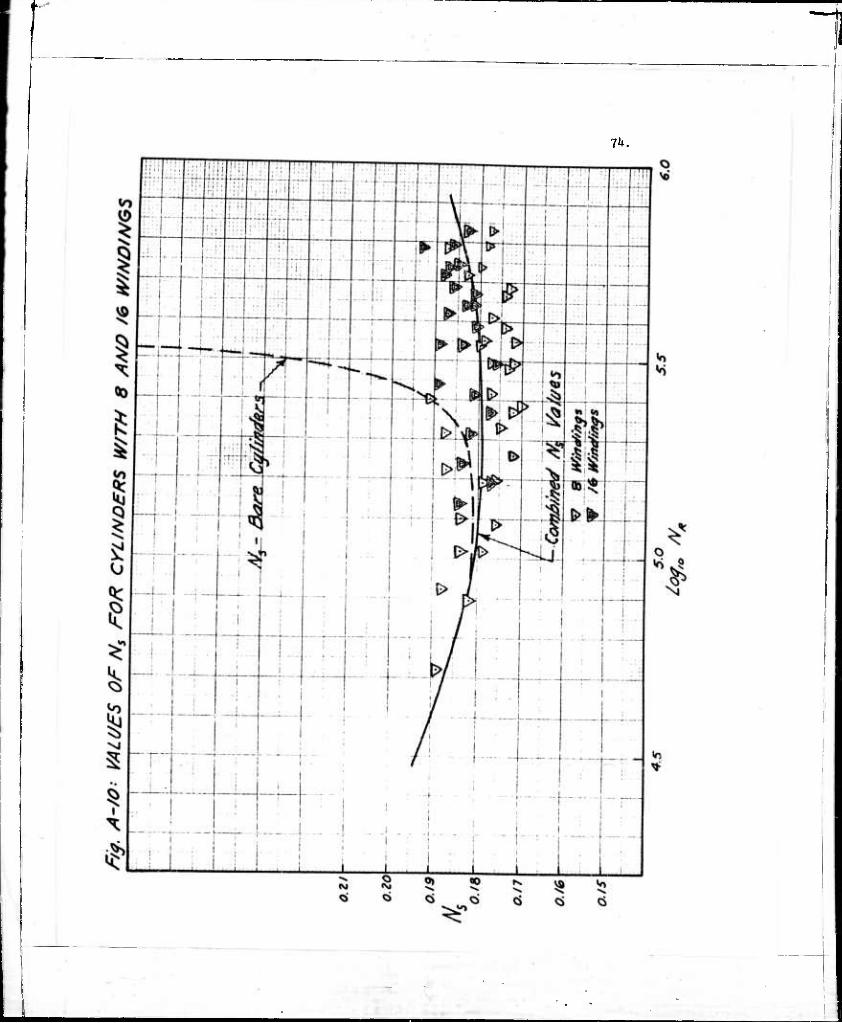
7*).
_ .

75-
O «si
«0 y> «§
1 li II
^1 V ?:f: •-\ kj u >s «Q .^ >*•
If)
0 Hj s . ^4 ssj
3^ 1 ^ >
^ ^ Js •5 As
-$
v. ^ >s
1 ^ v)
^
m m
o d
\
\
\ I o V.
I

76.
«0 N Ö
^1
«n K
( ■D
u
<5
I
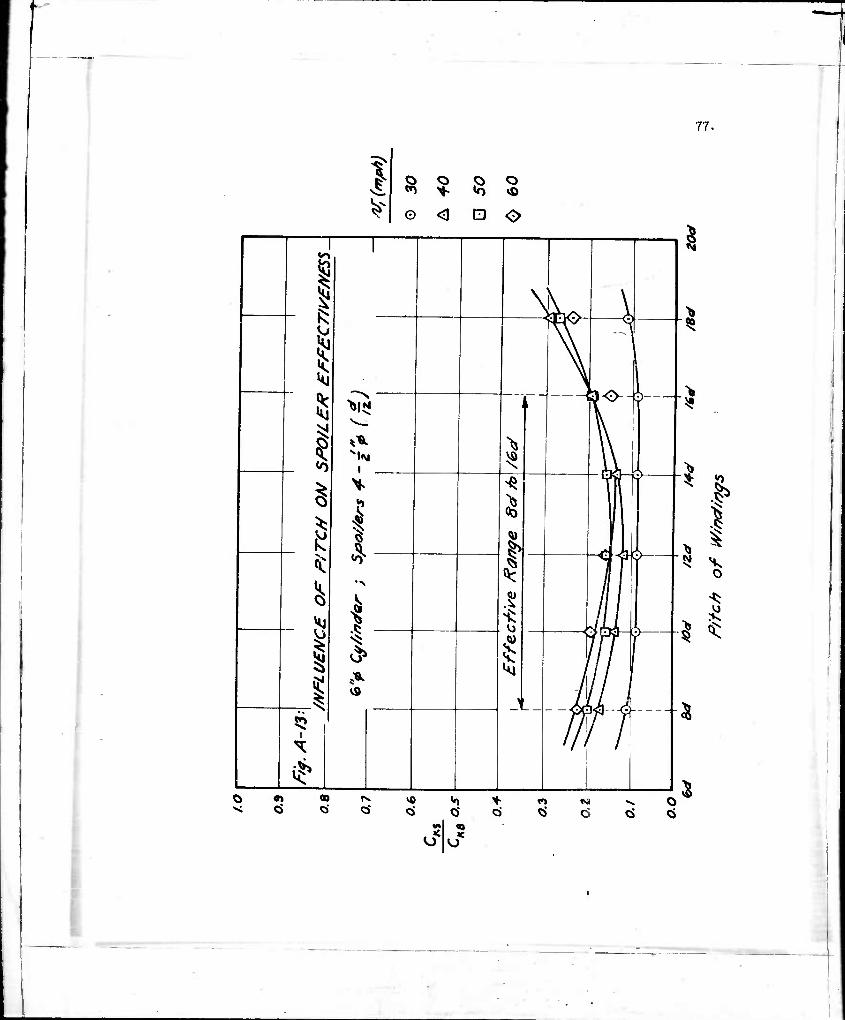
77.
I 0 <J D O
_ /b
J. 1 s s i \K \ ^ WHrs- 1 K vCKy^ © Jo r\\ Jl K« \v K N\ s W kj L 1 5 '«»it;
1 *y<o--
§ ^ > \ ^ NlM VÖ \ \
_ <o 1 s iA^
^ ^ \\ T
d s 5 ^ « 1
Ü 1 1 i- - ^ "^ r
^ .s ///
^ i w )
^ ^
1 V9 1 L
5? WJ ^ '/ i ^ !
§
I
s -
> ^ «0 "N
^ 1 > s 5J V
o
^ (J %
1 ^
- ^
ff> 00 t^ v« «o * «n MI o 0 Ö o- 0 Ö Ö 6
«A «0 . < K o O
o ^

78.
APPENDIX B
Phase B Test Results
■

I 79.
<D
h O P. P. 0
CO 1 to a tl P. w
"«. c o
o
cd o a) P
n o
O
II
II
CO
o
•JO
<M ** o
^ <o (H ö o 4> Ü 4^ (D +» K < ^ O, •% ai • U O u <D O n H rH U ^ v O P. n O B C ^ !H o O rH ^i C •a 0! © (/) 4)
P< «) n H a FH e <D 0) a ß 03
PL.
rH I
pq
b0
ft,
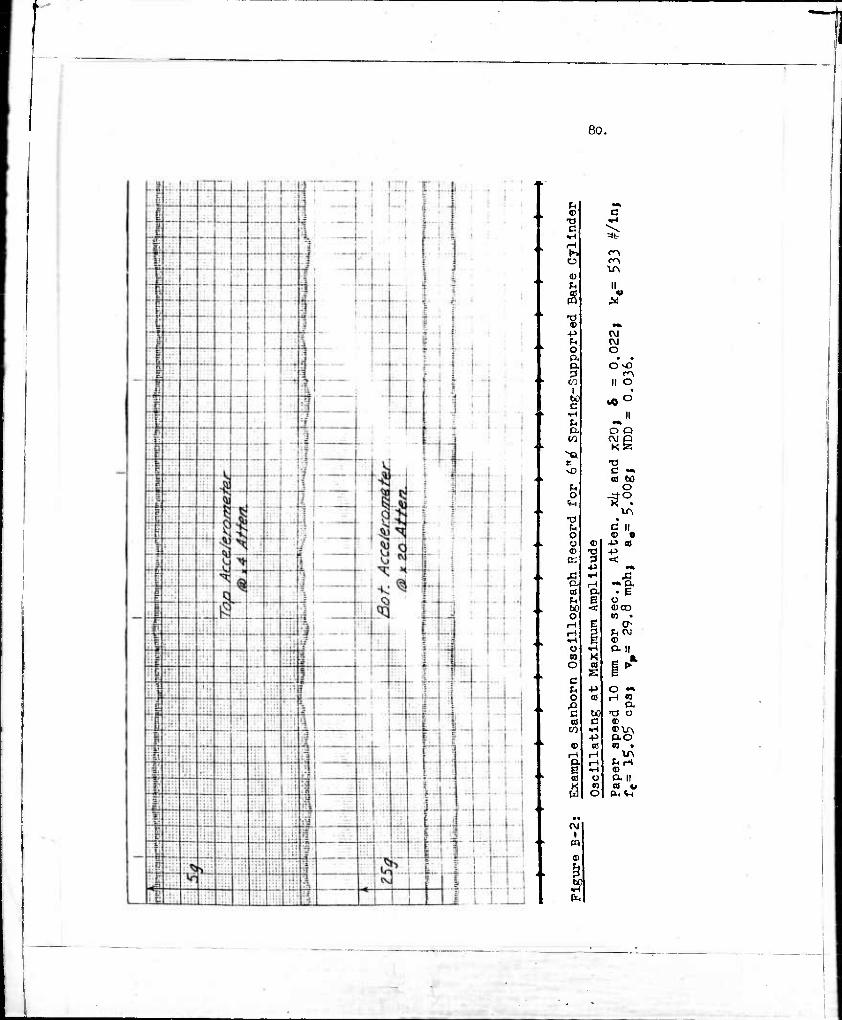
80.
f- M|
« a T) •H c. ^v^
•H =«s H 1» f-* O
XA 0) u II
2 -o 0) •*.
■p CM ^ OJ Ü O p. • • p. OvO 3 rn to II o bp c ^0
•H n p ^* p- O Q w VIZ XI e X) vD
a) 60 U O O
XA IT • b C II o 0) 0 O <D OJ a) <D "O ■P
cr: 0 < ■P •«
A *-l Xi C H -.p. * P. • e P B o hO < (UOO O m • H E O- t-l ^.cv •H ^ <D O •H P. II 0J K _ n o
E i c >H +> o •» o 0) in m
43 a a u: "0 o as c «
(Tl Ti «)\r\ +5 P-O
(D <c n • H H XA P- H t.H i ^-4 © * O P. II s 03 a) o
o fL. V(
•• C\J
1 w <D
| bf i-l (x.

81.
... j.
: i .... . 3 ....
"■**"■;
.:: 7 -•--
-•■;
—- 1 -: - - r ;. j — — r ..
:- ^ i irr-r- P i- '
- 1 f
... ■ i.f- i
i K: •:-: — — :. .:.. — .... i
! \ ! • :lli ■ —..
c T
T' W. ! T T'
...j... i ■ 1
.... "[' k...
1 fi 1 i ..!...
-if - -M .... .... .... .: —
l-f It 1 - 1 .... ... 4-- :1
- ' : 1 : 1 i ...... :.„...
x 1 F. i
... , . .::
"l _.•.!. J
1
rt rrr" ■ i i 1 ...L.i...
i
j. .
.1..
; ' 1 if 1 r i ■ i ". - - -- • - ■ t- ...j...!..
|
■ --•-
■ •■1
t : : t> i ■ ^ ' : S ;- ..) ;i ., , « . -■•■ ri
1 l-r J | H* i ■irr i^ ..t.|.. ^ ...... •-■I- . ..
■—
... ,. 4......:%. :..,..^.......i. ■ ■ r <i\ — ■1 t i i^.-.i -^■4- - ■ - ■4 b
i ± i i
... ilJ
1
■L 1 -, 1 ...
■ ■ - 1- .h. ■"'!
\ h ! . Mil I ! i
Mi if ! i 1 :" ■■-hH'-rl-i ••■!•:■ ,...,. |..... i..... p. -t-l III- .... 1 i ■lii -i H-i j : i
[. 1... i . ...
-j ■■ .. j...". 1
......
1 ......
j.-.. j... i
1 3
! ; ■ ■ ! ' i i • -:- ... ... . .;. i
.. .(.,.... i ..; ... -f-
hi.{::rii:::T:.i::,.:..:: ' T-
i ■
i
1 i1:i1.:.t; ::ii:i:l:::: V- -pi : u;:; i
! ■ ; ! .;.'L.; j J-i^il i -t- . i„.
....;.... 1 i l^; — H?n- ; 1 h 1 1 1
i : 1 • > 1 i | ..!.. _:..
<D ■V a
•V (D
•♦3 »H O P.
I bÜ er
■H
P. CO
c vO
o
t( o Ü
bO O
rH
i 3
vD
bO c
OD
p. o
o UN
%r
xn n
CVJ O • O
II
o • • do ©
+» ll ■p < o
5s
<D bO oi O
fn • © CO P. ^ II
T) P. (D 0 © P^-d" m •
© P II
■? ••
i
©
bC
-
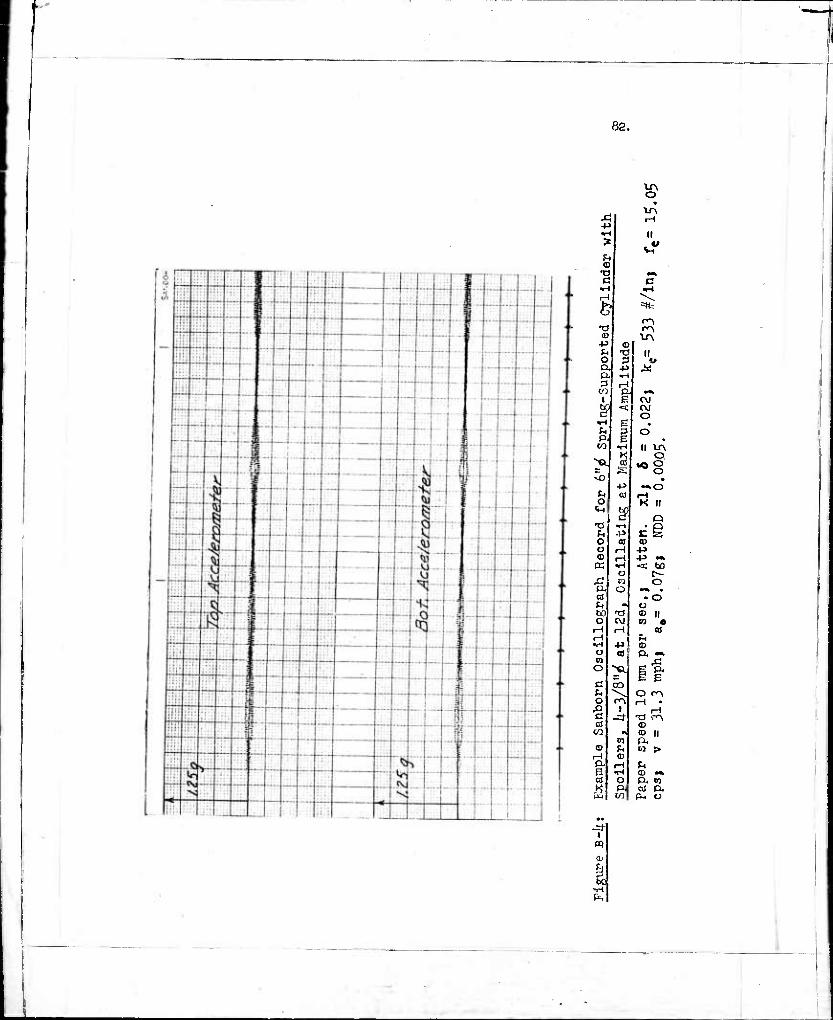
82.
1A
<J
a«s
ro •o rn (U XA
•4J «5 FH V II Ü 3 «» D. +J ^i P «M P rH
C'J P. •• 1 e CVJ
§1^ CVJ o
^1 g • ^ p o f4 E • t/j •H II XA
K o 3 *%
M.> • +> ~.o u cd rH o K II ■n 3 O
-o •rt f^ 4» C g Ü a) <D o iH +> t) H 4J «» ir. •r-l «H 00
O t^ £ P3 O p. o •«* • as • o JH •t o bC T> © il ü t\J ei e
rH r-i at H •H +> <D Ü a! P. •• ra ,0 O ^e. it C CO P O cr\ O ro rH •
JO 1 rH a -rt ■a rA a (D (/j w © ||
tn P. o f-, ra > H <D (.1. H fn B •H <D •* cd o P. OJ
ö p. CO p. C/) p^ Ü
fc
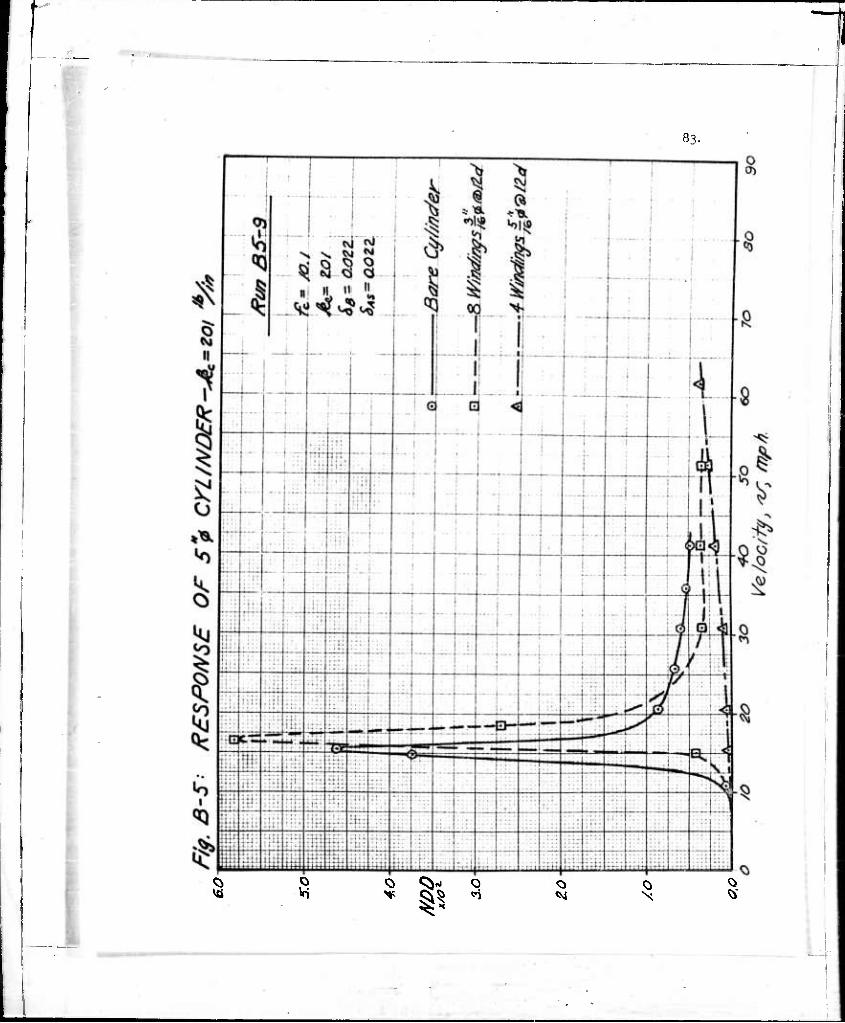
83-
VÖ Q> ^■x O o 0 Q ^ ^? «1 «M X «
-

84.
•

■
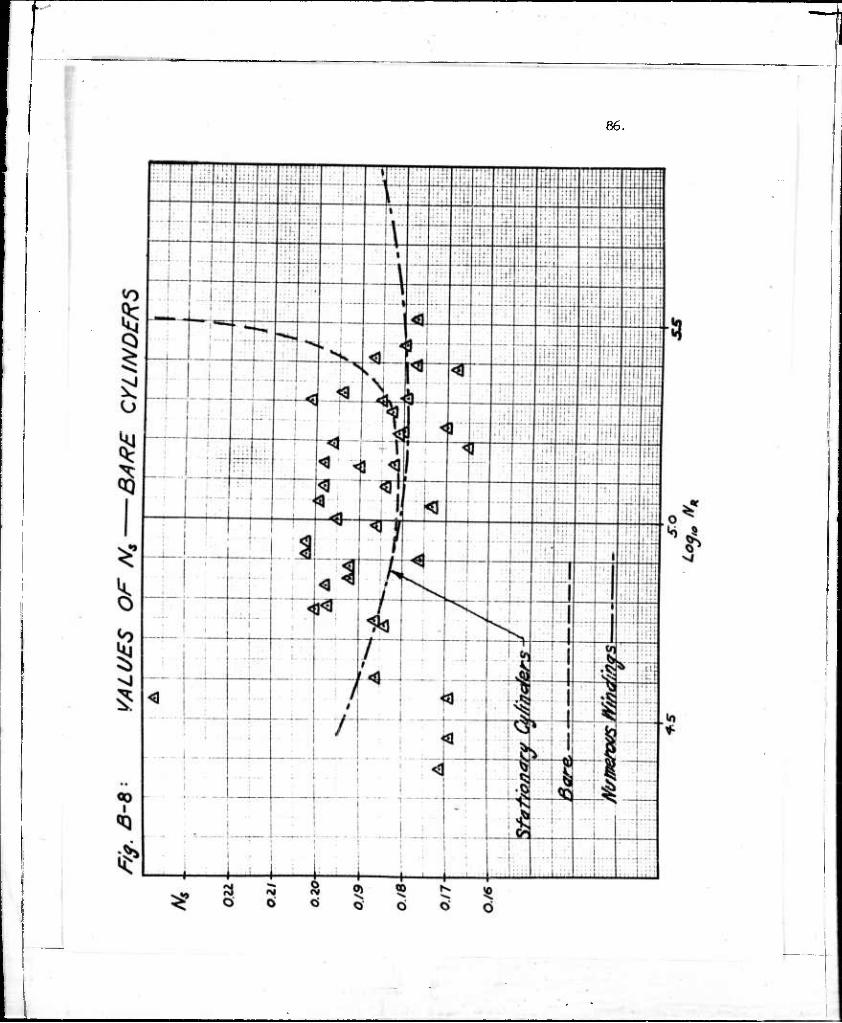
86.
-

87.

:
APFEHDIX C
Hiaae C Test Results
80.
1
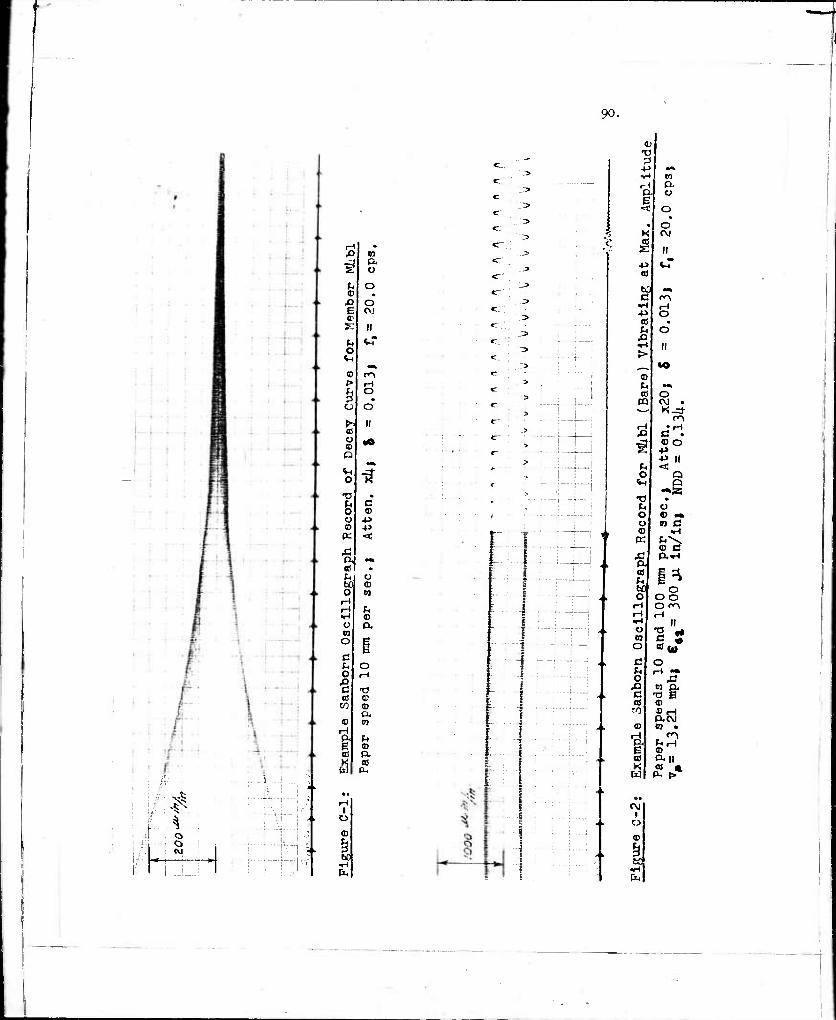
90.
; /!• :
ifi^
lli.i -.i o
a , r 1
j ..-L_
..JIJ i
M • J3 ra ^
(X 0
U 0 <D •
.O 0 E CV! fl) X n U vT O
VH •*
<D r^v !> 1-1
H O • O O
^ II « 0 «0
a •* 0 n -a • f, c 0 9) o -M (ü +3 « < Ä p. Mk
w • ^l O s (0 0 m H H (U •H ® Ü a 07 O B c
L
^ 0 Ü H ,0 c T) « c to a)
a. ® Kl
re tl E <D CO Q. K a) W PL,
o (D
I.
• ■
..l_J
<u -ol Z-
4- •* %- m r- P. (U 0 E «t O
O K rv/ cr £ n ̂
m +J %4
CD
td —• c rr\ •H H 4J O « • U O
XI •H II > «O <0 Li Mt
od O m OJ .
K^t ro
i-i •t-t x> a . ^
©0
■^> 11 ^ < 0 Q
<iH •*JE5
•O • t( O O O •* O n c QJ <«H K ^\.
<D C Ä P.^ P,
i^ s 0 Ü 00
i-H O n-\ iH H •H II O 'S ** n c « o co m
c 0 u H «• 0 ^ & n a. c -a E to <D
CO OiH P. CM
(0 0) * H «^ ft ^rH y O cd an K a a W (IH p.*
«• CJ
1 0
<D
| td

91.
i
o p.
4->
O
o II
o
M
" $
m P. t>
<D «Ö O 3
■4J o n-1 rj
'a II i •5 «H
•i c
(:< O
<B
O o ®
Q o
K as s
-p
O
c
a CO
cd
.1
o
bü
O
o
«o
a <D
O
m
<D P.
(D
O
+> a)
13 <D <D P oi
(D P. CO
PL,
41,. r. t
v. t :
b
..l-.J
o "« * r; O sC H It V ro o
-M y OT t. •« <U <n H P .»-1 o O m P- T1 o Oi ^ •
+> o Ä •H w +J rH ^1 P II 5 e
»— «ü «M
rH g ^D rj M^
^ H « O ^ «t © £ O P B +> II (U al S
btl »0
(n C o ^ —k
<M +> H at K -a )H
p JO • o 1-1 C O > (D (U ■P tc ,»—^ +>
Ä < A +> P. a) g •* (^ <D O be t-J <D o n l-i n H -P SH H-( •H © o P to <M O o ß c
o o o -St H
X! c f-< •0 M « ©
CO r> © o p
(D PI H -o P o p K rH © S ft e ■P
cö a)
••
o
QJ
§ « ^i P-H
J

92. /^/y. C-5-.- /?ES/=>0/V3e 0/^A?£W3tr/r Afe<:
—
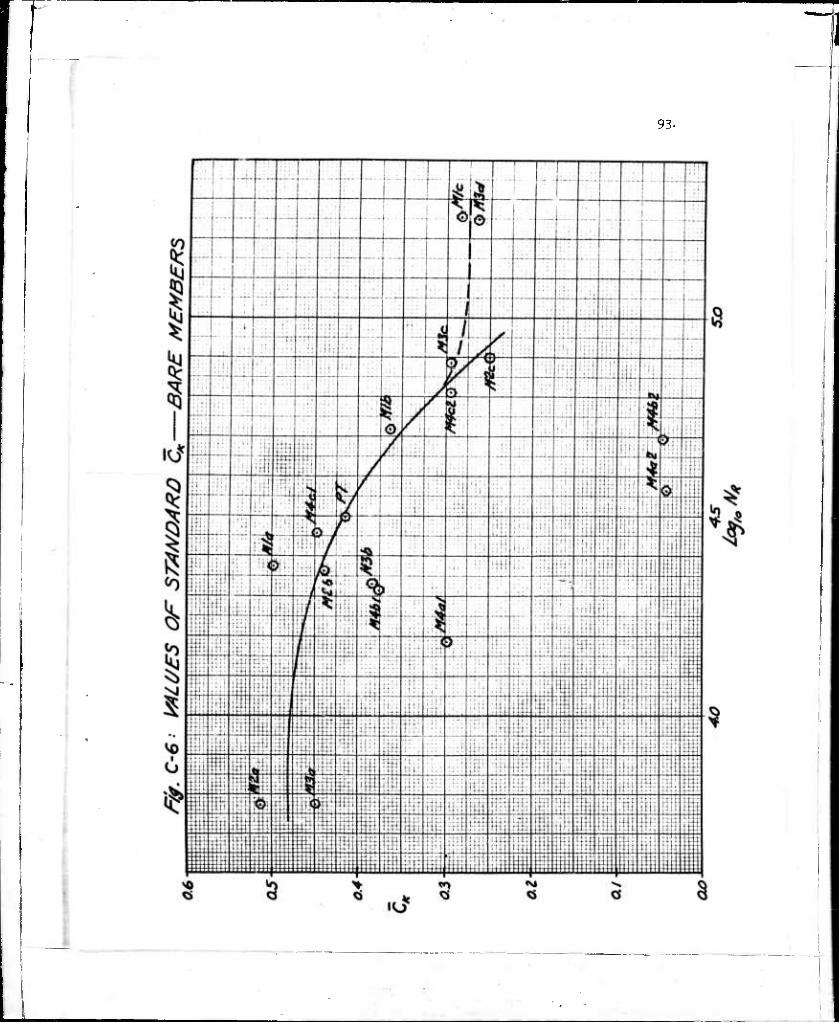
n*
93-

94.
I—

95.
I
/=&. C-8 (iLrt rO* l//&/?AT//VG Af^A-S&jE/^S
/so J—
/20+
(Uf)
/./o- -
/.oo -
MO 2 zoo
■