to climatic and commercial changes Annual Report 2015 reports/INEA Annual... · to climatic and...
127
1 Contract Number: DCI-FOOD/2010/230-267 SPC Adapting clonally propagated crops to climatic and commercial changes Annual Report 2015 INEA: The International Network for Edible Aroids www.EdibleAroids.org
-
Upload
truongkhanh -
Category
Documents
-
view
218 -
download
3
Transcript of to climatic and commercial changes Annual Report 2015 reports/INEA Annual... · to climatic and...

1
Contract Number: DCI-FOOD/2010/230-267 SPC
Adapting clonally propagated crops to climatic and commercial changes
Annual Report 2015 INEA: The International Network for Edible Aroids
www.EdibleAroids.org

2
3
Contents
1. Summary of activities and context of INEA in 2015 .................................................................... 7
2. Country and partners reports .............................................................................................. 19
2.1. Costa Rica, University of Costa Rica (Francisco Saborio) ................................. 19 2.2. Nicaragua, Universidad National Agraria (Guillermo Reyes) ............................ 27 2.3. Cuba, INIVIT (Yadelys Figueroa Aguila et al.) .................................................. 28 2.4. CARDI, St Vincent and the Grenadines (Gregory Robin) .................................. 33 2.5. Ghana, CSIR (Lawrence Misa Aboagye) ............................................................ 36 2.6. Burkina Faso, Université de Ouagadougou (Renan Traoré) ............................... 41 2.7. Nigeria, NRCRI (Joe Onyeka)............................................................................. 44 2.8. South Africa (Willem Jansen van Rensburg) ...................................................... 48
2.9. Madagascar, FOFIFA (V. Andrianavalona, A. Rakotondravao) ......................... 55 2.10. India, CTCRI (A. Mukherjee, M. Unnikrishnan, J. Sreekumar) ....................... 62 2.11. The Philippines, PhilRootcrops (Dilberto Ferraren) ......................................... 67 2.12. Vanuatu, VARTC (Floriane Lawac, Roger Malapa) ......................................... 78 2.13. Papua New Guinea, NARI (C. Atung, J. Waki, B. Komolong) ........................ 82 2.14. CIRAD, 3rd clonal generation (A. Lequeux-Sauvage) ...................................... 98 2.15. CIRAD, DNA fingerprinting (Hana Chaïr, Laurent Soulard) ......................... 106 2.16. University of Maribor (Janja Kristl, Anton Ivancic) ....................................... 112 2.17. University of Madeira (Miguel de Carvalho) .................................................. 117 2.18. DSMZ, Germany (Stephan Winter)................................................................. 122
3. Appendix .............................................................................................................................. 127
3.1. INEA Newsletters (6) ........................................................................................ 127 3.2. Variation of nitrate content among randomly selected taro (Colocasia esculenta (L.) Schott) genotypes and the distribution of nitrate within a corm. Kristl, A. Ivancic, A. Mergedus, V. Sem, M. Kolar, V. Lebot. 2016. Journal of Food Composition and Analysis. ................................................................................................................... 127 3.3. Evaluation of vegetative growth, yield and quality related traits in taro (Colocasia esculenta [L.] Schott). L. Soulard, P. Letourmy, TV Cao, F. Lawac, H. Chaïr, V. Lebot. 2016. Crop Science, Vol. 56. ........................................................................ 127 3.4. Characterization of taro [Colocasia esculenta (L.) Schott] germplasm for improved flavonoid composition and content V. Lebot, F. Lawac, S. Michalet, L. Legendre. Plant Genetic Resources Characterisation and Utilisation. 2015. ........... 127 3.5. Optimizing the utilization of plant genetic resources for climatic changes adaptation in the Pacific: the need for a new approach. V. Lebot. Acta Hortic. 1101. ISHS 2015. Proc. XXIX IHC – IV Intl. Symp. on Plant Genetic Resources, Brisbane, Australia. .................................................................................................................. 127

4

5
List of acronyms
ABVC: alomae bobone virus complex ACIAR: Australian Centre for International Agricultural Research AFLP: Amplified fragment length polymorphism APAARI: Asia Pacific Association of Agricultural Research ARC: Agricultural Research Council CARDI: Caribbean Agricultural Research and Development Institute CBD: Convention on Biological Diversity CBDV: Colocasia bobone disease virus CePACT: Centre for Pacific Crops and Trees CFW: Constant Factor Weight CGIAR: Consultative Group on international Agricultural Research CIRAD: Centre de Coopération Internationale de Recherches Agronomiques pour le Développement CSIR: Council for Industrial and Industrial Research CTCRI: Central Tuber Crops Research Institute C1: first clonal generation C2: second clonal generation C3: third clonal generation DNA: Deoxyribonucleic acid DSMZ: Leibniz Institute DSMZ-German Collection of Microorganisms and Cell Cultures DsMV: Dasheen mosaic potyvirus EQS: Eating Quality Score ELISA: Enzyme linked immunosorbent assay EU: European Union F1: first generation (seminal generation) FAO: Food and Agriculture Organization of the United Nations FOFIFA : Centre National de la Recherche Appliquée au Développement Rural FSM: Federate States of Micronesia GA: Gibberellic acid GC: Gaz Chromatography GCMCC: German Collection of Microorganisms and Cell Cultures HPLC: High Performance Liquid Chromatography HP TLC: High Performance Thin Layer Chromatography HR: Human Resources ICAR: Indian Council of Agricultural Research INEA: International Network for Edible Aroids INIVIT: Instituto Nacional de Investigaciones de Viandas Tropicales LIPI: Indonesian Institute of Sciences (Lembaga Ilmu Pengetahuan Indonesia) MOU: Memorandum of Understanding MS: Murashige and Skoog (medium) NARI: National Agricultural Research Institute NIRS: Near InfraRed Spectroscopy NRCRI: National Root Crops Research Institute PhilRootCrops: Philippine Root Crop Research and Training Center PPB: Participatory Plant Breeding PPM: Plant Preservative Mixture PRA: Participatory Rural Appraisals PT clones: pathogen tested clones
6
QTL: Quantitative Trait Loci RAPD: random amplification of polymorphic DNA RT-PCR: Reverse transcriptase polymerase chain reaction SPC: Secretariat of the Pacific Community SMTA: Standard Material Transfer Agreement SSR: Single Sequence Repeats TaBV: Taro bacilliform virus TaRV: Taro reovirus TANSAO: Taro Network for South Asia and Oceania Tarogen: Taro Genetic Resources Conservation and Utilization Project TaVCV: Taro vein chlorosis virus TLB: Taro Leaf Blight TTS: True taro Seeds UPMGA: Unweighted Pairwise Method VARTC: Vanuatu Agricultural Research and Technical Centre VGI: Vegetative Growth Index

7
1. Summary of activities and context of INEA in 2015 INEA (the International Network for Edible Aorids: www.EdibleAroids.org) brings together a global team of scientists, working directly with local growers, to develop a model for the adaptation of clonally propagated crops to climatic and commercial changes. To produce plants adapted to new environments - climate change, pest and disease outbreaks, market needs - it is necessary to broaden the genetic base. To do that successfully, requires cooperation between countries, the use of modern biotechnologies, and development of a network of scientists exchanging information and germplasm. INEA uses taro (Colocasia esculenta) and cocoyam (Xanthosoma sagittifolium) to construct a climatic adaptation model which can be transferable to other clonally propagated plant species. INEA main activities are:
International network sharing resources and helping farmers with participatory breeding.
International distribution of selected in vitro clones (virus indexed) and true taro seeds.
Selection of genotypes from diverse crop gene pools and adapted to local conditions.
National distribution of elite cultivars to smallholders.
Participatory breeding for wide environmental and cropping systems adaptability.
Characterization of physico-chemical properties and potential uses. The countries participating in INEA are: Burkina Faso, Costa Rica, Cuba, Germany, Ghana, India, Indonesia, Madagascar, Nicaragua, Nigeria, Philippines, Papua New Guinea, Portugal, Samoa, Slovenia, South Africa and Vanuatu. Also participating are two regional organisations, SPC and CARDI (Trinidad), and one international agricultural research organisations, CIRAD, (Vanuatu and France). INEA work plan has been implemented without delays from 2011 to 2014 (see previous annual reports). Unfortunately, on February 13th 2015, cyclone Pam, one of the most violent cyclone ever recorded in the South West Pacific (with winds up to 320 km/h) stroke Vanuatu where the project coordination is based, along with an important breeding programme and field experiments hosted by one of the partners (VARTC). This unexpected event had a very serious impact on project activities and considerably delayed the work programme but partners did their best to cope with these constraints. The situation was closely monitored but the EU office in Suva, Fiji, and after in-depth review of the achievements done so far (and the proposed work plan to complete the initial objectives of the project), it was decided to extend the project (at no cost) to December 2016. Producing crops ready for change - changes to climate, pest and disease outbreaks or a need for processing – is particularly difficult for those that are vegetatively propagated. As demonstrated in 2015 with molecular markers, genetic diversity is constrained by geographical isolation; it is based on a few chance mutations or the occasional result of sexual reproduction; either way, genetic diversity is narrow, and this limits their usefulness as environments change rapidly. To create the diversity required, the genetic bases of taro and cocoyam need to be broadened. INEA has successfully achieved this in 2015. In 2015, several partners have successfully conducted the first crosses and generated thousands of true botanical seeds which will be screened and evaluated, representing an exceptional resource of genetic diversity. Also, and for the first time since the beginning of this project, INEA partners started in 2015 to exchange internationally true botanical seeds of taro. This is a major breakthrough as it is the first time in the history of Aroids research that it is done on such a large scale. This process is presently injecting tremendous allelic diversity in different countries, broadening the genetic base of breeding programmes. The present report summarizes INEA results and achievements in 2015 and describes the work plan for 2016.

8
The work plan of INEA is broken down into eight work packages (WP), each presenting clearly identified outputs. The main results obtained in 2015 are presented, hereafter, for each WP:
WP 1.1. Project management activities Partner in charge of WP 1.1: SPC Expected outputs: 1. Development of a website to support INEA. 2. Fulfilment of financial, administrative and coordination obligations. INEA has developed an efficient communication strategy to improve visibility. The Website is a repository of information (www.ediblearoids.org) and it serves as a “library” where all publications, reports and presentations are preserved and can be downloaded freely by the international community. For faster communication, Yahoogroups email is used to exchange information rapidly to all members at the same time ([email protected]). Finally, a Newsletter exists for progress, alerts, for sharing between partners. So far, thanks to Grahame V.H. Jackson, INEA has successfully published and already distributed internationally, not less than six newsletters summarizing the network achievements. The front pages of these newsletters are presented in Appendix 1. In 2015, INEA continued to update the website (GVH Jackson) with international information on Aroids, either published in international journals or in grey literature. Partners have been invited to send more photos, reports/papers/protocols. Also, INEA has considered using social media – Facebook page; Twitter to “advertise” the project to wider audience (output no. 1). The feedback received so far is very positive. The project is managed by LRD-SPC, Suva, Fiji, under the direct financial supervision of Mrs Azaria Lesa - Ah Kau, Finance and Administration Adviser, Land Resources Division. The financial report for 2014 was officially submitted to the EU and accepted. SPC proceeded with transfer of funds to partners during the first semester of 2015 (output no 2). All partners met in Santo, Vanuatu, February 3-6th 2015, to refine the strategic plan and formulate an Action Plan for 2015. However, in the field, the project work plan implementation suffered from two major catastrophes: The super typhoon Haiyan was one of the strongest cyclone in World’s history. According to satellite data peak wind gusts were 380 kmph. Haiyan made landfall shortly after peak intensity and hit the central Philippines on November 7-8th 2013. With maximum wind speed around 300 kmph the cyclone devastated the city of Tacloban and the Province of Leyte where PhilRootCrops, the INEA partner, is located. Propagation plots were devastated. In Vanuatu, Pam, one of the strongest cyclone ever (rated 5) went through the archipelago, from North to South, on March-13-14th 2015 destroying crops and propagation plots. The professional activities of the project coordinator (V. Lebot) were seriously impacted, delaying further the project proper implementation. The original work plan has been considerably delayed. In September 2015, the EU officially granted a “no cost extension” to INEA, now ending in December 2016. It is expected that the 47 deliverables of the project will be reached before December 2016. Table 1, summarises the achievements made in 2011-2015 and the work left to be completed in 2016.

9
Table 1. Time table of activities and indicators of project progress (done= deliverable completed; on track= on going): Work Package : 2011-2015 2016 Semesters : WP1. Project coordination and management : 1. Development of a web site done 2. Financial and administrative reporting done 3. Production and circulation of annual reports) done 4. Monitoring of project activities (annual meetings) done WP2. In vitro distribution and field propagation : 5. In vitro propagation and distribution of 50 varieties to all country partners done 6. Field propagation of introduced varieties done 7. Distribution of 30 selected varieties to farmers in participating countries on track WP3. Breeding & on-farm participatory selection: 8. Conduct controlled crosses in participating countries done 9. Raise F1 hybrids in nurseries on track 10. Distribute C1s for on farm evaluation in all participating countries on track 11. One PhD on breeding (South Africa) done WP4. DNA (SSRs & SNP) fingerprinting: 12. Fingerprinting of elite cultivars selected by partners done 13. Determine genetic distances between parents for future crosses done 14. Study segregations of F1s and C1s (first clonal generation) done 15. New markers developed done 16. Establish and harvest first heritability trial (F1s) done 17. Establish and harvest second heritability trial (C1s) done 18. Identify potential major genes and genome mapping on track 19. One PhD on genetic diversity (Burkina Faso) 1. One Phd defended on genetic studies of association between markers
and physico-chemical characteristics.
done 20. One PhD on association studies (France) on track 21. Four papers published in international journals on track WP5. Drought resistance studies : 22. Establishment of field experiments for drought tolerance studies done 23. Evaluation of morpho-agronomic traits on selected varieties done 24. Physiological and biochemical markers analysis not reachable 25. Corms from cultivars stressed analysed for major compounds done 26. Traits and markers association with drought on track 27. One MSc on drought tolerance (Portugal) done 28. Two papers published on track WP6. Physico chemical characterisation : 29. Intra clonal variation of major compounds done 30. Variation between selected cultivars done 31. Variation within and between full-sibs families on track 32. Drought effect on corm characteristics done 33. One PhD defended (Slovenia) on track 34. Two papers published in international journals done WP7. Viruses detection and identification : 35. Diversity of viruses and strains done 36. Develop and optimize virus testing protocols done 37. Raise parents and seedlings for viruses studies done 38. Detect viruses in parents and seedlings done 39. One PhD defended (Germany) on track 40. Formulate guidelines for exchange of seeds on track 41. Two papers published in international journals on track WP8. On-farm trials and participatory activities : 42. Selected genotypes distributed to farmers in countries
done 43. Selected genotypes evaluated by farmers done 44. C1s propagated and distributed to farmers on track 45. On-farm trial harvested and quality tests conducted on track 46. One MSc defended (Papua New Guinea) done 47. Two papers published in international journals on track

10
WP 1.2. Scientific coordination activities Partner in charge of WP 1.2: CIRAD Expected outputs: 3. Production and circulation of annual reports. 4. Monitoring of project activities. CIRAD is responsible for the day-to-day scientific coordination of the project. CIRAD is also responsible for the circulation of information and the collation of scientific annual reports from the partners. The technical reports have been produced in time, each year, in February 2012, 2013, 2014 and 2015, and circulated to all partners (output no 3). Formal publications of information generated by the project are done in international journals. Results from genetic and breeding studies, physiology, virology and the physico-chemical characterisation of the corms are being published in international journals with high impact factors. Except for WP1 and WP2, all WPs produce university degrees. Cyril. Atung defended his MSc in Lae, PNG, in 2014. V. Rodrigues defended his MSC in Funchal, Madeira (Portugal) in 2014. Aurélie Lequeux Sauvage defended her MSc in Cergy-Pontoise in September 2015. Renan Traoré from Burkina Faso defended his PhD in 2014 in Ouagadougou. Four PhD candidates will defend in 2016: Willem Jansen van Rensburg in South Africa, Marion Liebrecht in Germany, Andrej Mergudus in Slovenia and Laurent Soulard in France. Progress is being monitored regularly by CIRAD to avoid partners failing to deliver their project inputs. Research progress is evaluated in comparison with the planned delivery list and the timetable (see table 1). In order to conform to the work plan, to achieve the initial objectives and to obtain the agreement of all partners involved in the different tasks, work packages and protocols, the annual meeting provides the opportunity to discuss activities for the next period. The project Steering Committee (SC) is composed of one representative of each participant institution and is chaired by the project scientific co-ordinator (CIRAD). Each SC member has the empowerment from his institution to commit staff and other resources required by the project. Each country partner has a contact person liaising with the scientific coordinator. The SC meets annually to discuss WPs progress and plan for the coming year. Because of the limited budget and the expensive long distances flights, the SC is combined with the annual technical meeting. This has been done thrice already: during the launching meeting in Kuala Lumpur, then in Montpellier (Dec. 2013) and in Santo (Feb. 2015). Each time, the EU offices in Kuala Lumpur, Brussels and Suva were invited to attend these annual meetings. It is planned that the final meeting of the project will be organised in Cuba, but details are still under discussion with INIVIT (output no. 4). Scientific coordination is eased by the project website where scientific news, photos, newsletters, papers and reports are posted on a regular basis (output no 3). A monitoring form has been devised for quarterly assessment of activities. Even though there is now the ITPGRFA under the auspices of FAO, there are still problems in making germplasm transfers and some countries are reluctant to share. One way to circumvent the administrative hurdles involved in transferring germplasm internationally is to introduce true taro seeds. True botanical seeds offer an attractive alternative strategy. They are easy to transfer, and as far as is known, it can be done without a threat from seed borne viruses (work done by DSMZ in Germany). CIRAD is promoting the exchange of true seeds among partners. In 2015, true taro seeds (TTS) were collected in Vanuatu on open pollinated hybrids in their third clonal generation (see CIRAD’s report here attached). The parents were genotypes obtained from TANSAO, and/or local landraces from Vanuatu, and/or hybrids between both genepools (see Table 2 hereafter). Crosses were made between December 2010 and January

11
2011 (see Soulard et al., 2016). These parents are genotypes used in the recurrent selection strategy of the VARTC breeding programme. Table 2. Parents used to generate full sib hybrids on which OP seeds were collected for transfer to partners.
Crosses Family
no code
Total hybrids
per family
No of plots with 30 plants
plants in
plots
Reps in Blocks (plots)
HLB 01 x (VU 370 x ID 316) 12 32 347 11 330 9 HLB 11 x VU 1104 31 319 10 300 9 HLB 33 x (VU 370 x ID 316) 4 35 306 10 300 9 (VU 370 x ID 316) 4 x (ID 316 x VU HYB) 3 33 146 4 120 5 (VU 370 x ID 316) 1 x 1859 34 163 5 150 5 (VU 370 x ID 316) 3 x 1765 36 161 5 150 5 HLB 01 x (VU 370 x ID 316) 6 37 119 3 90 5 (VU 370 x ID 316) 7 x HLB 06 38 125 4 120 5 ID 311 x VU 006 21 105 3 90 3 VU 190 x HLB 01 1 89 2 60 2 VU 006 x (ID 311 x NC/PNG) 3 3 85 2 60 2 VU 144 x (VU 370 x ID 316) 1 4 66 2 60 2 VU 1439 x (VU 370 x ID 316) 1 5 60 2 60 2 VU 158 x HLB 20 2 52 1 30 1 (VU 370 x ID 316) 9 x HLB 04 39 53 1 30 1 HLB 11 x HLB 01 40 40 1 30 1 (VU 370 x ID 316) 10 x VU 65 41 37 1 30 1 (VU 370 x ID 316) 12 x HLB 19 42 46 1 30 1
These OP seeds were sent to:
Albert T Modi, School of Agricultural, Earth and Environmental Sciences, University of KwaZulu-Natal, Scottsville, Pietermaritzburg 3209, South Africa.
Lawrence Misa Aboagye, Council for Scientific and Industrial Research, Plant Genetic Resources Research Institute, PO Box M 32, Accra, Ghana.
Godwin O. Chukwu, Department of Soil Science and Meteorology, Michael Okpara University of Agriculture, Umudike, Nigeria.
Dilberto Ferraren. PhilRootCrops, BayBay, Visayas, Leyte, The Philippines. Willem Jansen van Rensburg, ARD, Pretoria, South Africa. Walter Leke, Institute of Agricultural Research for Development (IRAD), PO Box 2123
Messa, Yaoundé, Cameroon. Gregory Robin, CARDI Representative, Technical Coordinator, CARDI Roots and Tuber
Crops Programme, PO Box 549 Kingstown, St. Vincent, West Indies. Charles Ahmadi, Plant Breeder and Geneticist, National Root Crops Research Institute,
Umudike. PMB 7006, Umuahia, Nigeria. Joseph Adomako, CSIR-Crops Research Institute, Plant Health Division, PO Box 3785,
Kumasi, Ghana. Arsène Rakotondravao, FOFIFA, Centre Régional de Recherches Est, Station Niarovana
Caroline, Vatomandry-517, Toamasina, Madagascar. Damigou Bammite, Laboratoire de Physiologie et Biotechnologies Végétales,
Département de Botanique, Faculté des Sciences, Université de Lomé, Togo.

12
True taro seeds were also sent from NARI, Papua New Guinea (in Lae, Morobe, prepared by Jeffrey Waki) to: Charles Ahmadi, Nigeria Gregory Robin, St Vincent Walter Leke, Cameroon Lawrence Misa Aboagye, Ghana Albert Modi, South Africa Miguel Carvalho, Portugal Divine Tarla, Cameroon Reports received from partners indicate that these seeds were successfully germinated and seedlings are now being raised in nurseries for further selection. In the future, selected plants will be used for cross pollination with local varieties or even directly cloned, if interesting, for direct transfer to producers.
WP 2: In vitro propagation of selected varieties for distribution to farmers Partner in charge of WP2: SPC Expected outputs: 5. International distribution of 50 selected genotypes to all country partners. 6. Field propagation of introduced genotypes, evaluation, comparison with local ones. 7. Distribution of 30 selected genotypes to 10 villages per country (5 farmers per village). During the first three years of the project, partners have successfully raised in nurseries and propagated in the field, the varieties received in vitro from SPC. Output no. 6 was successfully delivered in 2012 (see 2011 and 2012 annual reports). Outputs no. 7 and 8 have been delayed due to financial constraints during the first two years of the project (2011 & 2012) but partners are now doing their best to speed up the field propagation work. Field evaluation of introduced varieties in partners’ countries are summarised in Table 2. Table 3. Best introduced varieties in farmers’ fields (2nd year of evaluation).
Country Ranked 1st 2nd 3rd 4th 5th
Costa Rica HW 37 CR 54 PNG 09 PNG 03 SM 80
Nicaragua
Cuba HW 37 SM 143 C3-12 SM 128 SM 80
St Vincent IND 24 SM 80 PNG 10 SM 83 SM 13
Burkina Faso SM 80 SM 135 PNG 11 HW 05 SM 120
Ghana HW 37 SM 151 SM 10 IND 24 SM 134
Nigeria
South Africa
Madagascar Soagnara Mavo SM 132 SM 115 SM 80
India IND 06 TH 10 TH 07 SM 116 SM 151
Indonesia THA 05 Mentega SM 135 SM 157 SM 134
Philippines SM 132 SM 51 SM 80 SM 151 MAL 112
Papua New Guinea C4-150 C4-153 SM 143 SM 148 SM 43
Vanuatu SM 13 SM 138 PNG 11 SM 149 SM 120
One of the most remarkable results of this field evaluation is the fact that in different countries, the varieties ranked first are different and it seems that genotype x environment

13
interactions are important. HW 37 is, however, performing well in three countries, in Costa Rica, Cuba and Ghana. WP 3: Breeding and on- farm participatory selection and evaluation Partner in charge of WP 3: University of Maribor Expected outputs: 8. Controlled crosses conducted in each participating country. 9. Hybrid seeds generated and F1 hybrids raised. 10. Hybrid clones distributed to 5 farmers in 10 villages (total of 50 farmers per country). 11. One PhD defended on taro breeding in South Africa (Mr WS Jansen van Rensburg). The overall objective of the breeding programme is to produce different varieties tolerant to TLB, with drought resistance and good quality corms, to exchange them internationally and to distribute them to farmers to make adaptation to climatic changes possible. Papua New Guinea, India, Vanuatu and Samoa are presently developing protocols for other countries to follow where there is breeding expertise. Seeds from the Vanuatu and Papua New Guinea programmes have been distributed to partners. Regarding outputs no. 9 and 10, Samoa, Vanuatu, Papua New Guinea, the Philippines, Indonesia, India, Madagascar, Nigeria, Ghana, and Costa Rica have successfully started their breeding programmes and are now raising F1 seedlings. It is hoped that Cuba, CARDI, Nicaragua and Burkina Faso will be involved soon in breeding activities. The 2015 meeting in Santo was an opportunity for partners to learn breeding techniques. The University of Maribor (Anton Ivancic) is collaborating with all countries to develop a breeding scheme adapted to each partner, according to the characteristics and constraints of the local germplasm. Maribor is also developing protocols using visual tools which can be used on-farm with growers to select genotypes and training local scientists in breeding techniques. During the 2015 annual meeting in Santo, Vanuatu, A. Ivancic gave presentations on breeding strategies and demonstrated the techniques in the field at VARTC. It is hoped that all country partners will exchange TTS in 2016 in order to initiate an international convergent-divergent breeding scheme (exchange of TTS and recurrent selection), introduce allelic diversity and strengthen the position of taro towards forthcoming climatic changes. CIRAD and Maribor will liaise with all country partners to organize the exchange of TTS between partners. In Vanuatu, hybrids resulting from crosses between Asian and Vanuatu parents are now in their third clonal generation. An MSc student from France (Aurélie Lequeux-Sauvage) conducted a full morpho-agro characterisation of these hybrids in VARTC (approx. 2000 genotypes) to see if it is possible to correlate them with the F1s (measured in 2012). The idea is to speed up and optimise the breeding scheme with an early selection process. The results presented in the CIRAD annual report therein, indicate that such an approach is feasible. Mr Willem Jansen van Rensburg will defend his PhD in South Africa in 2016 (output no. 12).
WP 4: DNA fingerprinting of varieties and full-sib families and heritability studies Partner in charge of WP 4: CIRAD Expected outputs: 12. DNA fingerprints of elite varieties used as parents in crosses. 13. Genetic distances determined between parents. 14. Segregation of molecular markers studied within and between seven full-sib progenies.

14
15. Markers associated to major genes, if any, identified. 16. First heritability trial established and harvested. 17. Second heritability trial established and harvested. 18. Potential major genes controlling corm quality identified (e.g. starch, sugars) 19. One PhD defended on the genetic diversity of taro (from Burkina Faso (R. Traoré) 20. One PhD defended on genetic studies related to physico-chemical characteristics (L. Soulard). 21. Four papers published in international journals. All partners, except Cuba and Nicaragua, sent their samples to CIRAD for DNA fingerprinting. Nigeria sent only one sample. Overall, CIRAD fingerprinted 374 taro accessions (output no. 13). Data analysis of the SSRs results allowed the determination of genetic distances between these varieties under the form of a Neighbour joing tree (output no. 14). These results are useful for partners as they now have a good assessment of the genetic distances existing between the parents (local varieties) used in their breeding programmes. In order to measure the impact of the INEA approach in farmers’ fields, all varieties introduced from SPC should also be fingerprinted with SSR markers to assess the genetic diversity sent to country partners for distribution to farmers. This work will be completed in 2016. CIRAD (in Vanuatu and in France) is conducting genetic analysis studies involving: correlation between morphological traits, heritabilty of phenotypic traits (morphological and chemical traits), additions to the genetic map, and the identification of Quantitative Traits Loci related to traits of agronomic importance. The study on segregations of F1s and correlations between F1 and C1s has been published in Crop Science (Soulard et al. 2016). The same plants have been morphologically described in order to identify markers associated to major gene (outputs no 15 and 16). This work is on track and will be completed towards the end of 2016. A heritability trial has been planted with these 13 full sibs families (output no. 17). Vegetative Growth Iindexes (VGIs) have been measured for F1s (seminal generation), C1s (first clonal generation), C2s (second clonal generation) and C3s (third clonal generation) and correlations made between them. We observe a close correlation for major phenotypic characteristics, eg fresh corm weight, plant height, leaf length. Correlations are also high when individual plant comparisons are made between F1 and C3s’ VGIs and genetic data for dry matter, corm weight and no. of stolons. C3 data have been analysed and are presented in this report (output no. 18) (MSc Aurélie Lequeux-Sauvage). Stolons are considered as deleterious traits and it is easy to eliminate plants producing them as early as the seminal generation. The number of suckers is also a trait fairly easy to select in F1. Surprisingly, it appears that the number of inflorescences per plant doesn’t decrease with successive clonal generations. F1 seedlings producing inflorescences should therefore be eliminated as this trait deforming the corms of dasheen type genotypes is preserved in successive clonal generations. The VGI (vegetative growth index) is a suitable multi-trait index for the selection of dasheen type genotypes at an early stage and can be used to speed up the selection process. The experimental field design used in this study (subplots of 30 plants) and randomized incomplete blocks offer a good control of the environment and a good assessment of the genetic variance, within and between families. CIRAD has developed new markers for taro called SNPs (Single Nucleotide Polymorphism). These are powerful markers that will be added to the existing SSRs to saturate the genetic map (output 19 planned for 2016). Laurent Soulard will defend his PhD in Montpellier, France, in

15
2016 (output no. 21). Out of four planned in this WP, two have been produced (output no. 22 on track).
WP 5: Drought resistance of elite varieties and seedlings Partner in charge of WP 5: University of Madeira Expected outputs: 22. Field assays for drought tolerance studies established. 23. Morpho-agronomic traits associated with drought tolerance accurately identified and evaluated. 24. Physiological and biochemical markers analysed and correlation studies completed. 25. Chemical analysis of drought stressed plants, or showing drought tolerance. 26. Association of different traits and markers with drought tolerance studied. 27. One MSc defended on taro drought tolerance. 28. Two papers published in international journals. Taro water requirements are between 2 and 16 L/m2, and therefore its drought tolerance is of concern, especially in relation to climate change. However, in the absence of a model for water requirements, crop traits and markers to determine drought tolerance, there is a need to develop a standard experimental protocol. So far, four experiments have been conducted in Madeira leading to the screening of 34 accessions for drought tolerance (output no. 23). These trials include varieties from the Canary Islands, Madeira and SPC. The plants were given either a full amount of water or 56% and 45% of their need. Unfortunately, the Drought Tolerance (DTI) and Drought Sensitivity Indices (DSI) are not as discriminatory as needed to differentiate accurately varieties performances (ouput no. 24 not reachable). The Chemical analysis of drought stressed plants, or showing drought tolerance was conducted by the University of Maribor (output 25). The Association of different traits and markers with drought tolerance has been studied and the results are presented in this report (see University of Madeira) (output 26). A master (MSc) thesis (output 27) has been defended at the University of Madeira in Funchal. The objective was to analyse the results of the 1st taro drought experiment with the objective of modelling taro response to drought. Rodrigues, V. (2014). Modelação das condições de stress hídrico no inhame (Colocasia esculenta (L) Schott) e avaliação da variação em caracteres associados à tolerância. Universidade da Madeira. Funchal. Pp 93 In 2015, a new full drought experiment was performed, aiming to confirm results obtained from previous ones, and to validate used parameters. Dried and fresh samples were obtained for further analysis. Data was obtained for biochemical and nutritional parameters from previous assays samples. Although the proposed work was done in 2015, data treatment will only be done in 2016, and confirmation of the classification for 12 accessions in relation to their drought tolerance will be dependent upon these new results and their analyses. Output 28 will be reached in 2016 before the end of the project.
WP 6: Physico-chemical characterisation of corms of selected genotypes Partner in charge of WP 6: University of Maribor Expected outputs: 29. Intra-clonal variation of chemotypes studied and determined.

16
30. Physico-chemical characteristics/variation of varieties correlated with molecular markers. 31. Variation between and within full-sib families studied and correlated with molecular markers. 32. Assessment of variation due to drought and correlation with molecular markers analysed. 33. One PhD thesis defended on the influence of stress on corm quality (A. Mergudus). 34. Two papers published in international journals. The intra clonal variation of chemotypes study has been completed and published (output 29). The physico-chemical characteristics of varieties have also been analysed (output 30). In 2015, the analysis of total starch and nitrogen (and calculated crude proteins) content in taro samples from Madeira was completed (output 32). The results were sent to Madeira for further evaluation. The nitrate content in taro corms and its distribution within corms of selected taro genotypes from Vanuatu was also studied and the results were published. J. Kristl, A. Ivancic, A. Mergedus, V. Sem, M. Kolar, V. Lebot. 2016. Variation of nitrate content among randomly selected taro (Colocasia esculenta (L.) Schott) genotypes and the distribution of nitrate within a corm. Journal of Food Composition and Analysis. The PhD candidate Andrej Mergedus has finalized his thesis. A written thesis has to be approved by the 4 members commission before the candidate can defend it. The commission will prepare the final report before mid-March 2016 (output 33).
WP 7: Virus detection and identification on seedlings from true taro seeds Partner in charge of WP 7: DSMZ Expected outputs: 35. Virus diversity study conducted on viruses/virus strains in each of the participating countries. 36. Protocols for virus indexing seedling populations of taro fully optimised. 37. Parents and seedlings are raised successfully. 38. Information on the rate of transmission of viruses in true seeds. 39. Guidelines for the safe movement/exchange of true taro seeds. 40. One PhD defended on viruses identification/indexation studies (Ms Marion Liebrecht) 41. Two papers published in international journals. The virus diversity study has been conducted but with a sample smaller than what was anticipated because many partners failed to send their samples to DSMZ for viruses detection and identification (output no. 35). Protocols for detection of CBDV and TaVCV have been revised on the basis of new sequences of complete virus genomes. Tests will be validated in 2016 and made available to partners and the international community (outputs 36, 37). Positive controls for all viruses and reference samples are now available. Virus transmission by T. colocasae confirmed that this insect is the vector for the rhabdoviruses. Virus transmission assays will continue in 2016 to confirm these results. Also, new attempts will be made to produce virus specific antisera for TaVCV and CBDV to facilitate laboratory testing. All shall be delivered before the end of the INEA project (outputs 38-39). True botanical seeds were sent from CIRAD to DSMZ and tests on seeds are being done to determine if viruses will be present in seedlings (outputs nos. 38 and 39 on track). It is suggested that the FAO guidelines that were written in the early 80s should be revised to take into consideration the latest research findings (output no. 40). Marion Liebrecht will defend her PhD in 2016 (output no. 41) and two papers will be submitted to international journals (output no. 42 on track).

17
WP 8: On-farm participatory selection of elite varieties and hybrids in C1 generation Partners in charge of WP8: CIRAD and Maribor Expected outputs: 42. Introduced elite genotypes distributed to farmers and propagated in their plots. 43. Introduced elite genotypes harvested and assessed by farmers 44. C1s (first clonal generation) propagated and distributed to farmers. 45. On-farm trials harvested and participatory evaluation of C1 quality conducted. 46. On MSc defended in Papua New Guinea (Mr Jeffrey Waki). 47. Two papers published in international journals. In all country partners varieties introduced from SPC have been distributed to growers (output no. 43) and in most countries harvests have been conducted and assessed by farmers (output no. 44). In Costa Rica, in addition to the plantation at the Research Station, selected accessions were planted on 17 farms with the help of farmers for further evaluation. The work on the molecular characterisation of Xanthosoma sagittifolium continues using SSRs. In Nicaragua, At harvest in Matagalpa 15 local farmers participated in the workshop for taro field management and eating quality score test of all genotypes. Not all the genotypes were tasted. The EQS test will be replicated in two other zones and with different farmers. In Cuba, the work focused on the characterisation of introduced accessions for their flowering performances. Accessions were classified as early or late maturing. 20 % (19 accessions) produced inflorescences naturally and among these 69.2% (10 accessions) were early maturing and 30.8% (6 acc.) were late maturing. The morpho-agronomic characterisation of the introduced varieties also continued. In the West Indies (CARDI), the work under INEA is being done in St Lucia and St Vincent. The SPC introductions have been described and multiplied and those with stolons were eliminated. After multiplication, the 45 varieties that survived introduction were distributed. The market wants, low suckering plants, and corms that are compact with white flesh. After field evaluation trials, it appears that IND/24 had the least amount of suckers; that coupled with high yields and good taste, is an indicator that it has good export potential. In Ghana, the SPC introductions were propagated and when the plants had reached the 4-5 leaf stage farmers were given five varieties, five of each genotype. A total of 280 crosses were made of which 32 representing 14% were successful and seeds collected. The seeds from the crosses are being raised for distribution for on-farm evaluation of the F1.
In Burkina Faso, 20 introduced varieties were selected according to taste, yield, stolons number and flowering. From the results of the cultivation of the second clonal generation of the germplasm bank at the research station and the evaluation of the taste of each of the varieties, 20 varieties were selected during 2014. In 2015, during the third clonal generation cycle, agromorphological characterization of these 20 selected varieties shows that eight varieties could be adapted to the climate of Burkina Faso. In Nigeria, varieties cannot go directly to farmers. To accelerate the evaluation of taro for TLB tolerance, the SPC genotypes were evaluated for resistance to TLB in four locations, to compare them with the local ones and to evaluate farmers’ acceptability of the SPC varieties. In South Africa, the eddoe type is preferred. The SPC dasheens have a long growth cycle and

18
the farmers are not as enthusiastic as might be as their local varieties are doing better than the SPC introductions because of their shorter growing cycle. However, there is a good indication that the participatory selection of the amadumbi germplasm will be successful. The use of true botanical seed to exchange germplasm also proves to be successful as one of the foreign lines that the farmers prefer is a seedling from seed received from Vanuatu five years ago. In Madagascar, INEA works with farmers in the Northeast, Southeast, South highlands and Middle West zones. Introduced varieties were planted with local varieties for field evaluation. In 2014 and 2015, numerous crosses were conducted between introduced varieties and between local and introduced varieties. Seeds were introduced from Vanuatu and successfully germinated. In India, many successful hybridisations have been made between local and introduced varieties, including those from Samoa and Indonesia. A major scientific breakthrough was achieved: the cryopreservation of taro pollen and its subsequent use to pollinate successfully. In Indonesia, the director of LIPI decided that this project was not a priority anymore for the institution and the team (Dr Made Sri Prana, Dr Maria Imelda and S. Tatang) have resigned. However, on farm trials have been done in two villages in the Bogor District, namely Tajur Halang and Tanjung Sari. But because of the extreme dry period (July to October2015) the trials in both villages did not perform so well. Similar trials have started in the Sumedang District (about 200 km south-east of Bogor) in the following villages: Caringin, Mekarjaya, and Warungnangka. Meanwhile seeds were obtained from controlled pollination between HW 05 x THA 05, Burkok x THA 05, and HW 26 x THA 05 and open pollination of THA 05, SM 116, HW 05, HW 26, PNG 09 and Burkok. In Papua New Guinea, on farm evaluation trials were conducted in two different locations. Farmers were encouraged to make their own selection based on observation on the growth performance on farm of a particular variety and give names to NARI team. Also during culinary tests, farmers were also encouraged to take note of the names of the best eating quality varieties and rank them accordingly. It was noted that PNG advance breeding line C4-150, C4-153 and BL/SM/143, BL/SM/148, BL/SM/43 and NT01 and NT02 were highly rated by farmers In the Philippines, Genotypes with high yield potential and higher though not significantly different from the current national check variety (i.e., NSIC G10) are BLSM 132, BLSM 151 and BLSM 80. Basing on the average weight of five sample tubers, BLSM 115, BLSM 128, BLSM 132, BLSM 143 and BLSM 151 could surpass NSIC G10. These genotypes possess capacity for high corm dry matter content. In Vanuatu, Xanthosoma sagittifolium hybrids are still undergoing evaluation. From the results of the progeny evaluations seven of the original parents have been selected for further crossing. New information gained from molecular genetic diversity study conducted with SSRs on the Vanuatu national collection (VARTC) has re-oriented the breeding strategy of Xanthosoma sagittifolium in 2015. This study was undertaken by CIRAD in 2014 and revelead the existence of two distinct genetic backgrounds within X. sagittifolium. The first group is represented by 7 accessions that are classified into 4 groups of related morphotypes (pop1). Such group includes dwarves and tall plants that produce yellow, white or red cormel flesh colour, characterized by a medium to low dry matter content. The group includes 3 accessions that are distinguished by very tall vigorous and erected plants that produce blue whitish (waxy) stem colour. Cormels are white or red-fleshed and dry matter content is very high.

19
2. Country and partners reports 2.1. Costa Rica, University of Costa Rica (Francisco Saborio) A video was produced during 2015 describing the work of the project. You can visit this video at https://www.youtube.com/watch?v=zB6VdXYXeRA WP2 In vitro distribution and field propagation The 50 genotypes received from SPC and the 10 genotypes collected from Costa Rica have been maintained in vitro during 2015. This collection has also been maintained in the greenhouse, 4 copies of each accession, and in the field, 8 plants of each accession at the Research Station in Alajuela, EEFBM.
Figure 1. Germplasm bank of Colocasia sp. maintained in vitro, in the greenhouse and at the field. WP3. Breeding and on farm participatory selection Third planting generation at the Research Station of the University of Costa Rica EEFBM On May 2014 a third generation of the bank germplasm was planted at the Research Station of the University of Costa Rica (EEFBM). Twelve plants of each accession were planted.
Figure 2. Third generation of Colocasia bank germplasm cultivated at the EEFBM in Alajuela,
Costa Rica. Picture at 5 month after planting.
20
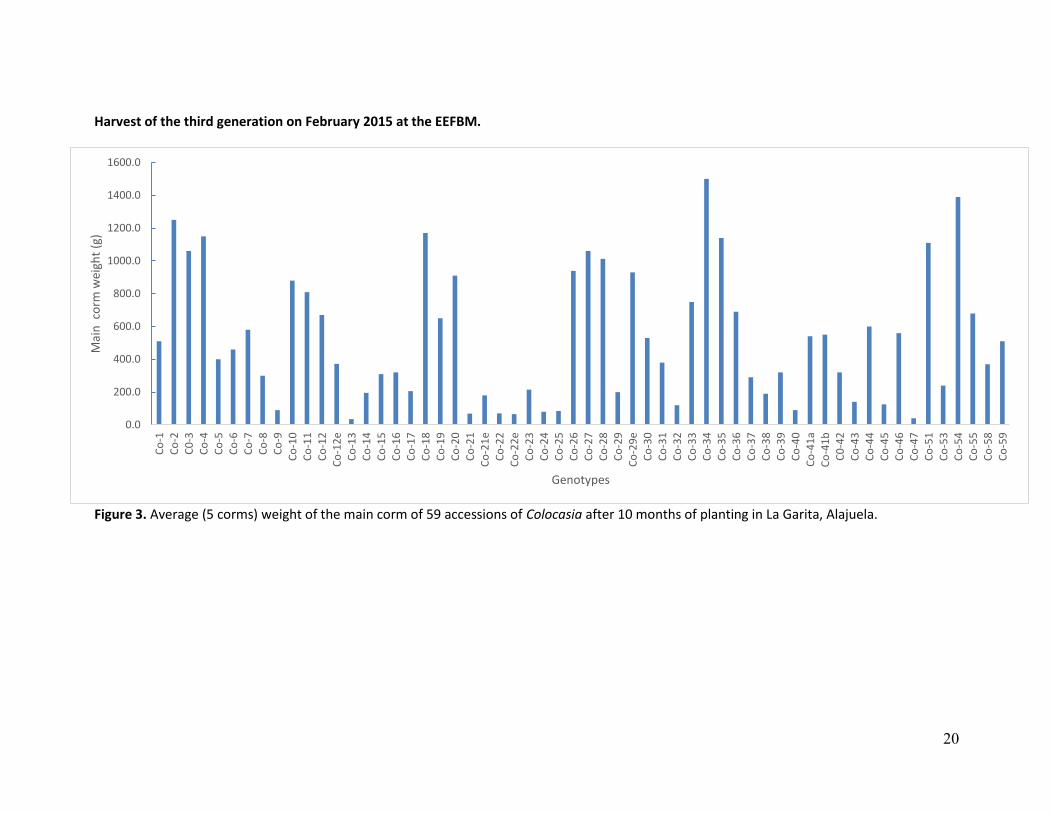
Harvest of the third generation on February 2015 at the EEFBM.
Figure 3. Average (5 corms) weight of the main corm of 59 accessions of Colocasia after 10 months of planting in La Garita, Alajuela.
0.0
200.0
400.0
600.0
800.0
1000.0
1200.0
1400.0
1600.0C
o-1
Co
-2C
0-3
Co
-4C
o-5
Co
-6C
o-7
Co
-8C
o-9
Co
-10
Co
-11
Co
-12
Co
-12
eC
o-1
3C
o-1
4C
o-1
5C
o-1
6C
o-1
7C
o-1
8C
o-1
9C
o-2
0C
o-2
1C
o-2
1e
Co
-22
Co
-22
eC
o-2
3C
o-2
4C
o-2
5C
o-2
6C
o-2
7C
o-2
8C
o-2
9C
o-2
9e
Co
-30
Co
-31
Co
-32
Co
-33
Co
-34
Co
-35
Co
-36
Co
-37
Co
-38
Co
-39
Co
-40
Co
-41
aC
o-4
1b
C0
-42
Co
-43
Co
-44
Co
-45
Co
-46
Co
-47
Co
-51
Co
-53
Co
-54
Co
-55
Co
-58
Co
-59
Mai
n c
orm
wei
ght
(g)
Genotypes

21
a. Field evaluation at Farmer´s site. Reproduction of selected accessions 2014-2015. In addition to the plantation at the Research Station, the selected accessions were planted at 17 farms with the help of the farmers. The sites, farmer, date of planting and accessions planted are shown in table 2. Some of the yield results are summarized in figure 4. Table 2. List of the site, farmer, date of planting and genotypes planted during 2014-2015 growth
cycle.
Site Farmer Date of planting
Accessions planted. See annex 1 for SPC codes
Cóbano Daniel Rodríguez Esquivel 07/07/2014 Co-11, Co-26,Co-28, Co-29, Co-34, Co-37, Co-44, Co-48
Cóbano María Fermina Cruz Sibaja 07/07/2014 Co-11, Co-26,Co-28, Co-29,
Co-34, Co-37, Co-44
Jiménez Juan Felix Contreras 24/06/2014 Co-11, Co-26, Co-28, Co29,
Co-37, Co-44
Jiménez Mario Villafuerte 23/06/2014 Co-8, Co-11, Co-26,Co-28,
Co-29, Co-34, Co-37, Co-44
Jiménez Luis Hernández Jiménez 20/06/2014 Co-11, Co-26,Co-28, Co-29,
Co-34, Co-37, Co-44
Jiménez Yamileth Espinoza Vega 26/06/2014 Co-11, Co-26, Co-28, Co29,
Co-37, Co-44
Turrubares Douglas Rojas 05/04/2014 Co-8, Co-11, Co-26,Co-28,
Co-29, Co-34, Co-37, Co-44
San Carlos Octavio Benavides Rojas 07/08/2014 Co-8, Co-11, Co-26,Co-28,
Co-29, Co-34, Co-37, Co-44
San Carlos Dagoberto Arrieta Vega 15/06/2014 Co-11, Co-26,Co-28, Co-29,
Co-37, Co-44 San Carlos Wilberth Benavides Araya 25/06/2014
San Carlos Carmelino Chichilla Elizondo 15/06/2014 Co-4, Co-2, Co-8, Co-11, Co-26,Co-28, Co-29, Co-34, Co-
37, Co-44, Co-48,
San Carlos Carlos Oviedo Alfaro 15/06/2014 Co-8, Co-11, Co-26 Co-29, Co-
44
San Carlos Rogelio Solano Delgado 28/08/2014 Co-8, Co-11, Co-26,Co-28,
Co-29, Co-34, Co-37, Co-44
Bijagual Gerardo Vega 30/05/2014 Co-4, Co-8, Co-11, Co-26,Co-28, Co-29, Co-34, Co-37, Co-
44,
Bijagual Huber Agüero 30/05/2014 Co-4, Co-8, Co-11, Co-26,Co-28, Co-29, Co-34, Co-37, Co-
44, Co-48
Bijagual Jose Salazar Pérez 14/06/2014 Co-11, Co-26,Co-28, Co-29,
Co-37, Co-44, Co-51
Bijagual Marcos Vindas 13/08/2014 Co-8, Co-11, Co-26,Co-28,
Co-29, Co-37, Co-44, Co-51

22
Farm: Douglas Rojas, Turrubares Farm: Carmelino Chinchilla, Fortuna
Farm: Daniel Rodríguez,Còbano, Puntarenas Farm: Huber Agüero, Bijagual, Turrubares
Figure 4. Average weight of main corm at four different localities.
b. Field evaluation at Farmer´s site. Reproduction of selected accessions 2015-2016.
Table 3. List of the site, farmer, date of planting and genotypes planted during 2015-16 growth cycle.
Site Farmer Planting Date
San Carlos, Alajuela
Carmelino Chinchilla
Basilio Rodríguez April
Carlos Oviedo April
Alejandro Mejia
Daboberto Arrieta March
0.0
500.0
1000.0
1500.0
2000.0P
eso
co
rmo
(g)
Genotipos
0
500
1000
1500
2000
Co
-2
Co
-4
C0
-8
Co
-11
Co
-26
Co
-28
Co
-29
Co
-34
Co
-44
Co
-48
Pes
o d
e h
ijos
(g)
Genotipo
0.0
500.0
1000.0
1500.0
2000.0
Co-11 Co-28 C0-29
Pes
o c
orm
o (
g)
Genotipos
0.00
500.00
1000.00
1500.00
2000.00
Co
-4
Co
-8
Co
-11
Co
-26
Co
-28
Co
-29
Co
-37
Co
-44
Co
-48
Co
-51P
eso
co
rmo
(g)
Genotipos

23
Juan Sostheim
Rogelio Solano
Salomón Benavides April
Octavio Benavides
Bijagual, San Josè
Huber Agüero May
Hecto Ulate May
Tomás Aguilar May
Jimenez, Limón
Carlos Espinoza May
Luis Hernández May
Felix Contreras January
EEFBM, Alajuela
Genotipos malanga May
Genotipos tiquizque May
Genotipos seleccionados May
Hìbridos F1 June
c. Evaluation of asexual seed (side shoots) survival from harvest to the following planting season
Sprouts or side shoot of the selected genotypes were collected at harvest (December 2014) and stored for three months under dry, shaded and aerated conditions with an average temperature of 25 degrees Celcius. The objective was to evaluate this storage method to maintain asexual seed for the following planting season. Shoots were classified according to their size as: small (pequeñas), medium-small (Peq-Med), medium (medianas) and large (grandes). It was found that in general medium and large size shoot maintain their viability better than smaller sideshoot and that there is a loss of around 50 % of the weight of these shoot during storage.
Fresh weight of stored side shoots of different sizes after 30, 60 and 90 days of storage
0
20
40
60
80
100
30 d 60 d 90 d 30 d 60 d 90 d 30 d 60 d 90 d 30 d 60 d 90 d
Pequeño Peq-Med Mediano Grande
Pes
o s
emill
a (g
)
Co-44

24
Germination percentage. Shoos were classified according to their size as: small (pequeñas), medium-small (Peq-Med), medium (medianas) and large (grandes).
Germination of side shoots after 3 months of storage.
Figure 5. Evaluation of storage method of taro side shoots.
d. Industrial evaluation of selected accessions.
Between June and August 2015 we evaluated 6 accessions Co2, Co4, Co26, Co28, Co29 and Co48 (See annex 1 for SPC codes) at a food processing factory, Alimentos Bermúdez (see link below) that sells fried chips of tropical root crops. This was done in order to test the selected accession as possible marketable products. % Pulp humidity, % oil content, Salt % and % Humidity content fried with or without flavour In this report we only include the results of % Pulp humidity, % oil content (Table 4). During 2016 other selected accessions and larger samples will be carried out. http://www.bermudezgroupltd.com/companies/alimentos-bermudez
Table 4.
Date: 08/06/2015 Product: Colocasia
#2 #4 #26 #28 #29 #48
% Pulp humidity 71.40% 57.72% 63.10% 64.84% 64.08% 74.40%
% Oil content 11.12% 13.96% 7.78% 11.71% - 17.23%
0
20
40
60
80
100
Co-11 Co-26 Co-28 Co-29 Co-37 Co-44
% g
erm
inac
ión
Genotipos
Pequeñas Peq-Med Medianas Grandes

25
e. Genetic crosses.
During 2015 67 crosses were made among the following Colocasia accessions received from SPC (Co2, Co 4, Co 8, Co 11, Co 27, Co 28 and Co 34 and the Costa Rican accessions Co55, Co57, Co59, Co60, Co61 and Co62.
Figure 6. Seeds obtained from crosses between SPC accessions and Costa Rica accessions.
f. Hybrid evaluation. On July 8th, 2015 the following 18 hybrids were selected for a second year evaluation based on their yield (main corm weight) and number of side shoots. Their yield will be evaluated in February 2016.
WP 4. Genetic Analysis. Molecular characterization of Xanthosoma species with microsatellites.
We have continued working on the molecular characterization of the accessions of Xanthosoma. We evaluated 30 accessions and compared them using the SSR primers. In the following figure primers mXsCIR10_F+R are used. We are in the process of analyzing the data. We already tested al 17 primers.
Hybrid number Number of the progeny
2 6 4 1 5 6 6 2, 5, 7
11 5, 6 13 6 14 3, 4 25 1, 3, 4, 5, 6, 7 26 4

26
Primer: mXsCIR10_F+R
Figure 7. PCR amplification using SSR primer mXsCIR10_F+R en 30 accessions of Xanthosoma spp.
1=Ta-01. 2=Ta-03. 3=Ta6F. 4=Tb-12. 5=Tb-01. 6=Tb-13. 7=Tb-14. 8=Tb-17. 9=Tb-19. 10=Tb-26. 11=Tb-51. 12=Tb-53. 13=tm-01. 14=Tm-03. 15=Tm-13. 16=Tm-15. 17=Tm-17. 18=Tm-18. 19=Tm-21. 20=Tm-23. 21=Ts-02. 22=Ts-03. 23=Ts-13. 24=Ts-14. 25=Ts-15. 26=Ts-24. 27=Ts-29. 28=Ts-30. 29=Ts-40. 30=Mut 2-2 y (-)=negative.
Annex 1. Costa Rican and corresponding SPC codes of Colocasia accessions.
Costa Rican code SPC code Costa Rican code SPC code
Co-1 BL/SM 120 Co-26 BL/SM 46 Co-2 BL/SM 80 Co-27 BL/SM 111 Co-3 BL/SM 136 Co-28 BL/SM 116 Co-4 BL/SM 147 Co-29 BL/SM 128 Co-5 BL/SM 152 Co-30 BL/SM 135 Co-6 BL/SM 132 Co-31 BL/SM 138 Co-7 BL/SM 149 Co-32 BL/SM 148 Co-8 BL/SM 158 Co-33 BL/HW 08 Co-9 BL/SM 157 Co-34 BL/HW 37
Co-10 BL/SM 143 Co-35 BL/PNG 09 Co-11 BL/SM 151 Co-36 BL/PNG 11 Co-12 BL/SM 43 Co-37 BL/PNG 13 Co-13 CE/THA 09 Co-38 CE/THA 05 Co-14 CE/THA 10 Co-39 CE/THA 07 Co-15 CE/THA 24 Co-40 CE/THA 21 Co-16 CE/MAL 12 Co-41 CE/THA 30 Co-17 CE/MAL 14 Co-42 CE/MAL 13 Co-18 BL/PNG 03 Co-43 CE/IND 06 Co-19 BL/PNG 08 Co-44 CE/IND 10 Co-20 BL/PNG 10 Co-45 CE/IND 12 Co-21 CE/IND 08 Co-46 CE/IND14 Co-22 CE/IND 20 Co-47 CE/IND 19 Co-23 BL/HW 12 Co-48 CE/IND 31 Co-24 BL/HW 26 Co-49 CA/JP 01 Co-25 CA/JP 03 Co-50 CA/JP 08
Co-51 to Co-60 Costa Rican Accessions

27
2.2. Nicaragua, Universidad National Agraria (Guillermo Reyes) The collection established in Matagalpa was harvested in September 30th. The climate condition of the zone favoured the development of most genotypes. All genotypes were multiplied at green house. At harvest in Matagalpa 15 local farmers participated in the workshop for taro field management and eating quality score test of all genotypes. Not all the genotypes were tasted. The EQS test will be replicated in two other zones and with different farmers. The EQS test will be replicated in two other zones and with different farmers. Controlled hybridization Six genotypes were included in the study. Two genotypes were selected for their performance in dry conditions, two for their yields in optimal conditions and two for being the best national genotypes. The trial was stablished in pots at the green house of UNA (January 2016) Previously, two hybridization trials were established in the field and the climate conditions did not allowed the pollen production. The experiment was carried out under shade and controlled watering. Two field trials were established in Matagalpa (December 2015) and Boaco (January 2016) with the 10 genotypes with the highest yield and The collection is now introduced in vitro for conservation at UNA tissue culture lab. Work with Xanthosoma In July, in collaboration with INTA, a cocoyam national collection was carried out. 33 Xanthosoma genotypes are established at CNIA-INTA for morphological and molecular characterization. December. Field trail in cocoyam in Río San Juan, a producer area. Root rot disease management using Trichoderma + mycorrhiza. May-Dec. Isolation of root rot causing agents in lab.
Table 1. EQS of genotypes grown in Matagalpa 2015.
Acc. No. Texture Taste Colour Smell EQS Acc. No. Texture Taste Colour Smell EQS
SM 158 1.86 0.86 0.34 0.36 3.41 SM 157 1.36 0.64 0.29 0.24 2.53 THA 03 1.67 1.00 0.37 0.37 3.40 León 2 1.17 0.65 0.28 0.28 2.38 HW 26 1.50 1.10 0.37 0.40 3.37 SM 148 1.29 0.56 0.27 0.23 2.34 SM 151 1.50 1.10 0.33 0.32 3.25 IND 16 1.21 0.64 0.21 0.27 2.34 THA 14 1.36 1.03 0.36 0.37 3.11 Santo
Tomás 1.08 0.70 0.25 0.25 2.28
PNG 03 1.50 0.90 0.32 0.28 3.00 SM 128 1.50 0.43 0.16 0.17 2.26 THA 24 1.63 0.79 0.24 0.25 2.90 CAJP 04 1.21 0.47 0.19 0.17 2.04 León 1 1.67 0.70 0.27 0.25 2.88 MAL 14 1.00 0.50 0.23 0.23 1.97 Villa Sandino 1
1.36 0.90 0.31 0.27 2.84 IND 01 0.93 0.60 0.23 0.20 1.96
León 3 1.42 0.80 0.27 0.32 2.80 Nueva Guinea
1.08 0.45 0.23 0.17 1.93
SM 132 1.50 0.69 0.30 0.27 2.76 THA 0.93 0.60 0.20 0.20 1.93 SM 1.29 0.77 0.29 0.29 2.63 IND10 1.33 0.30 0.13 0.13 1.90 PNG 10 1.33 0.70 0.25 0.28 2.57 THA 08 1.13 0.41 0.16 0.16 1.86

28
2.3. Cuba, INIVIT (Yadelys Figueroa Aguila et al.) FLORACIÓN DEL GERMOPLASMA DE MALANGA ISLEÑA (Colocasia esculenta (L.) Scott.) EN CUBA. Yadelys Figueroa Aguila, Sergio Rodríguez Morales, Marilys D. Milián Jiménez, Yuniel Rodríguez García, Manuel Lima Díaz. Resumen Dentro del banco de germoplasma cubano existe una amplia variabilidad genética, en las condiciones climáticas de Cuba es muy difícil encontrar semillas viables, además puede estar determinado por la viabilidad y cantidad de polen producido. Con el objetivo de evaluar la emisión de inflorescencias en el germoplasma de malanga isleña en Cuba, se desarrolló una investigación en el Instituto de Investigaciones de Viandas Tropicales (INIVIT). Para su desarrollo se realizaron muestreos cada 7 días y se determinaron las accesiones que emiten inflorescencia, con el empleo de los descriptores, también el mes en el que se produce la emisión de las inflorescencias y el tipo de flores presentes, por un período de dos años. Las evaluaciones realizada permitieron caracterizar las accesiones que emitien inflorescencia en el banco de germoplasma de malanga Colocasia esculenta de Cuba, las accesiones que emiten inflorescencias naturalmente es el 20 % (19 accesiones) de las evaluadas, de este el 69.23% (18 accesiones) tienen un florecimiento precoz y el 30.76 (8 accesiones) es tardío y lograron emitir inflorescencias en los meses de julio hasta noviembre etapa en la que termina el proceso de floración del cultivo. Palabras Clave: Colocasia esculenta, floración, malanga isleña, taro Introducción La malanga (Colocasia esculenta (L.) Schott) se utiliza ampliamente en Cuba y el Mundo como un alimento muy conveniente para los niños y ancianos. También para las personas con enfermedades digestivas, además de ser un alimento de uso común en la cocina cubana. Los tubérculos de la malanga representan una importante fuente de carbohidratos cuando son consumidos con carne u otros vegetales (Agama et al., 2011). También se pueden consumir indistintamente cormos y cormelos en la alimentación humana. Los trabajos de mejoramiento genético encuentran limitaciones en determinadas zonas por el número también limitado de genotipos existentes; problema que se resuelve con los bancos de germoplasma. Algunos cultivares constituyen ecotipos locales de gran valor, gracias a su rusticidad natural, lo cual representa una ventaja con relación a otros, propios de distintas zonas (Gómez, 1983). La malanga (C. esculenta Schott.) como cultivo en Cuba presenta una composición clonal limitada debido a las escasas fuentes de variabilidad, tanto natural como inducida. La emisión de inflorescencia es esporádica y poco productiva, con escasos agentes polinizadores y dependiente de las condiciones ambientales, todo lo cual dificulta el mejoramiento genético de esta especie. En muchos casos, la floración puede ser inducida sucesivamente por pulverización a las plantas con ácido giberélico (GA3) (Ivancic, 2011). Esta es una especie termogénica, ya que varios estudios indican que la actividad termogénica es significativa en la formación de la inflorescencias, la actividad se relaciona con la protógina de esta especie y la polinización de insectos en las primeras horas de la mañana (Ivancic, et al., 2008). La búsqueda de nuevas fuentes de variabilidad genética que posibiliten el incremento y la diversificación clonal para el desarrollo del cultivo en el país resulta fundamental, razón por la que se

29
realizó el presente trabajo con el objetivo de evaluar la floración en el germoplasma de malanga isleña (Colocasia esculenta (L.) Schott.) bajo las condiciones de Cuba. Materiales y Métodos El trabajo se realizó en áreas del Instituto de Investigaciones en Viandas Tropicales (INIVIT) situado a 22,35’ de latitud; 80,18’ de altitud y 45,35 msnm, Municipio Santo Domingo, provincia Villa Clara, Cuba, se plantaron las accesiones de malanga Colocasia esculenta en un suelo pardo mullido medianamente lavado, (Hernández et. al. 2015), las accesiones se evaluaron en los años comprendidos entre 2013 y 2014 en parcelas de 60 plantas a una distancia de 0.30 x 0.90 m, las atenciones al cultivo se realizaron según Instructivo Técnico vigente para plantaciones de malanga (2010), se realizaron muestreos cada 7 días se caracterizaron las accesiones que emitieron inflorescencias con el empleo de los descriptores del IPGRI, (1999) y Milian et al., (2008), el mes en el que se produce la emisión de las inflorescencias y el tipo de flores presentes. Resultados y Discusión El inicio de la floración se asocia generalmente con la emisión de un olor fuerte, principalmente de la espata con el objetivo principal de atraer a los insectos polinizadores (Ivancic 2011), una planta puede tener entre 2-4 flores que brotan del meristema apical del cormo, entre los peciolos y las hojas se forma una hoja envolvente, la espata que rodea la columna florecida, el espádice que se enrolla en una lámina amarilla formando un ángulo, en 16 de las accesiones evaluadas la espádice permanece dentro de la espata y en 5 casos emerge hacia arriba. El espádice está formado por flores sésiles, en la parte inferior las Flores femeninas (pistiladas) que pueden ser funcionales o estériles. Las últimas no se desarrollan, se secan y desaparecen. Las fértiles tienen en el ápice un estigma y en la parte interna seis placentas, cada una con numerosos óvulos. La sección siguiente está compuesta por flores estériles con una longitud de 1.5-2.5 cm. La parte más arriba de la espata tiene flores estaminadas, con sinandrios con seis anteras dobles que se abren por un poro apical por el cual salen los granos de polen, siendo esta la primera parte de la inflorescencia en secarse y desprenderse, estos resultados coinciden en su totalidad con los planteados por Ivancic, (2011). Los datos obtenidos nos da la posibilidad de tener un punto de partida para establecer futuros programas de mejoramiento genético teniendo en cuenta los caracteres presentes en aquellas accesiones que lograron florecer, fundamentalmente basado en las exigencias de los productores y consumidores mejorando así la diversificación de clones dentro de nuestros sistemas de producción locales e incrementando la variabilidad en el cultivo, donde es indispensable un mejor conocimiento de las accesiones para poder superar las diversas limitaciones en las producciones de malanga. La floración de la malanga Colocasia esculenta es posible siempre que el cultivo sea capaz de emitir y formar los primordios florales, además de contar con factores internos y factores externos que condicionan la inducción o estimulación floral (Souza et al., 2002). En la tabla 1 se muestran las accesiones que emiten inflorescencias naturalmente el 20 % (19 accesiones), de este el 69.23% (10 accesiones) tienen un florecimiento precoz y el 30.76 (6 accesiones) es tardío. En estudios realizados en 2298 clones en Filipina, Vietnam, Tailandia, Malasia, Indonesia, Papua Nueva Guinea y Vanuatu solo el 38% de los clones emitieron inflorescencias (Lebot et al., 2000).
30
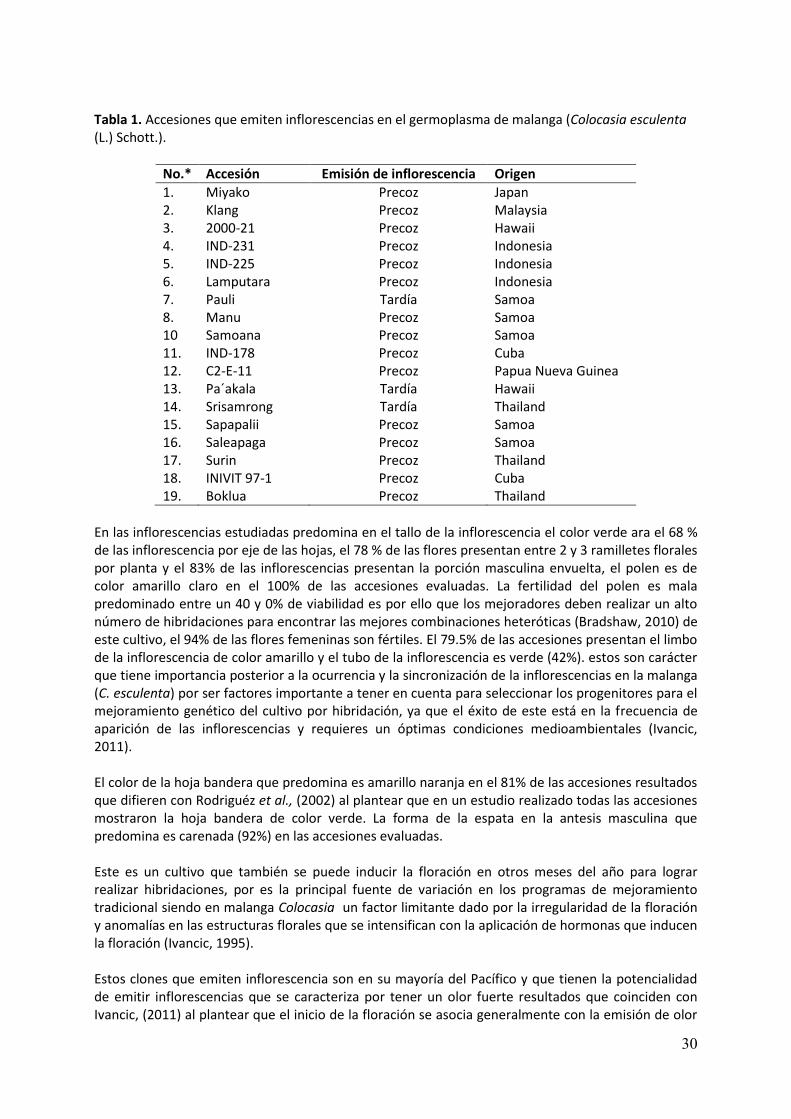
Tabla 1. Accesiones que emiten inflorescencias en el germoplasma de malanga (Colocasia esculenta (L.) Schott.).
No.* Accesión Emisión de inflorescencia Origen
1. Miyako Precoz Japan 2. Klang Precoz Malaysia 3. 2000-21 Precoz Hawaii 4. IND-231 Precoz Indonesia 5. IND-225 Precoz Indonesia 6. Lamputara Precoz Indonesia 7. Pauli Tardía Samoa 8. Manu Precoz Samoa 10 Samoana Precoz Samoa 11. IND-178 Precoz Cuba 12. C2-E-11 Precoz Papua Nueva Guinea 13. Pa´akala Tardía Hawaii 14. Srisamrong Tardía Thailand 15. Sapapalii Precoz Samoa 16. Saleapaga Precoz Samoa 17. Surin Precoz Thailand 18. INIVIT 97-1 Precoz Cuba 19. Boklua Precoz Thailand
En las inflorescencias estudiadas predomina en el tallo de la inflorescencia el color verde ara el 68 % de las inflorescencia por eje de las hojas, el 78 % de las flores presentan entre 2 y 3 ramilletes florales por planta y el 83% de las inflorescencias presentan la porción masculina envuelta, el polen es de color amarillo claro en el 100% de las accesiones evaluadas. La fertilidad del polen es mala predominado entre un 40 y 0% de viabilidad es por ello que los mejoradores deben realizar un alto número de hibridaciones para encontrar las mejores combinaciones heteróticas (Bradshaw, 2010) de este cultivo, el 94% de las flores femeninas son fértiles. El 79.5% de las accesiones presentan el limbo de la inflorescencia de color amarillo y el tubo de la inflorescencia es verde (42%). estos son carácter que tiene importancia posterior a la ocurrencia y la sincronización de la inflorescencias en la malanga (C. esculenta) por ser factores importante a tener en cuenta para seleccionar los progenitores para el mejoramiento genético del cultivo por hibridación, ya que el éxito de este está en la frecuencia de aparición de las inflorescencias y requieres un óptimas condiciones medioambientales (Ivancic, 2011). El color de la hoja bandera que predomina es amarillo naranja en el 81% de las accesiones resultados que difieren con Rodriguéz et al., (2002) al plantear que en un estudio realizado todas las accesiones mostraron la hoja bandera de color verde. La forma de la espata en la antesis masculina que predomina es carenada (92%) en las accesiones evaluadas. Este es un cultivo que también se puede inducir la floración en otros meses del año para lograr realizar hibridaciones, por es la principal fuente de variación en los programas de mejoramiento tradicional siendo en malanga Colocasia un factor limitante dado por la irregularidad de la floración y anomalías en las estructuras florales que se intensifican con la aplicación de hormonas que inducen la floración (Ivancic, 1995). Estos clones que emiten inflorescencia son en su mayoría del Pacífico y que tienen la potencialidad de emitir inflorescencias que se caracteriza por tener un olor fuerte resultados que coinciden con Ivancic, (2011) al plantear que el inicio de la floración se asocia generalmente con la emisión de olor

31
fuerte, principalmente de la espata. Su principal objetivo es atraer a los insectos polinizadores. Una inflorescencia es olorosa generalmente erecta y su espata está suelto, también hay otro grupo de variedades que rara vez (o nunca) producen inflorescencias. En muchos casos, la floración puede ser inducida sucesivamente por pulverización a las plantas con ácido giberélico (GA3). La malanga C. sculenta no florece naturalmente en todas las condiciones ambientales y ni todos los años de la misma manera, la inflorescencia se desarrolla sólo cuando las condiciones ambiental y fisiológica, satisfacen las necesidades de la planta. En condiciones de alta temperatura y humedad, se ha observado que algunas accesiones de taro florecen espontáneamente y de forma esporádica (Puiatti, 2002). No todas las accesiones preservadas en el germoplasma logran alcanzar la fase de floración, rasgo fundamental a tener en cuenta en los programas de hibridación, al permitir la incorporación de caracteres deseados que puedan dar respuesta a las demandas crecientes de productores y consumidores. Amadi et al., (2012) plantea que el desarrollo de nuevas variedades de taro en Nigeria por mejoramiento convencional se han visto obstaculizados por: el florecimiento errática y la falta de semillas. Conclusiones Se logró caracterizar las accesiones que emitieron inflorescencia en el banco de germoplasma de malanga Colocasia esculenta de Cuba. Las accesiones que emiten inflorescencias naturalmente es el 20 % (19 accesiones) de las evaluadas, de este el 69,23% (10 accesiones) tienen un florecimiento precoz y el 30,76 (6 accesiones) es tardío. Solo 19 accesiones de del total evaluado lograron emitir inflorescencias en los meses de julio hasta noviembre. Recomendación Continuar estudios de la inflorescencia ya que los resultados obtenidos son un punto de partida para establecer futuros programas de mejoramiento genético basado en las exigencias de los productores y consumidores. Comenzar estudios con el AG3 para inducir floración en clones que no emiten inflorescencias. Bibliografía Agama, E., García, F., Gutiérrez, F., Sánchez, M., San Artin, E. and Bello, L. 2011. Isolation and partial
characterization of Mexican taro (Colocasia esculenta (L.) Schott. Starch/Stärke, 63(3), p. 139. Amadi, C. O., E. N. A. Mbanaso, and G. O. Chukwu. 2012. A review of cocoyam breeding in Nigeria:
Achievements, challenges and prospects. Niger. Agric. J. 43:72. Bradshaw, J. E. (ed.), 2010. Root and Tuber Crops. Handbook of Plant Breeding, 295. Springer,
London. Figueroa, Yadelys, et al. 2014. Plegable: La floración en el cultivo de la malanga Colocasia esculenta
(L.) Shott. Biblioteca INIVIT. Hernández, J. A.; Pérez, J. J. M.; Bosch, I. D. y Castro, S. N. 2015. Clasificación de los suelos de Cuba
2015. Ediciones INCA, Cuba, 93 p. ISBN: 978-959-7023-77-7 http://ediciones.inca.edu.cu/ y http://www.inca.edu.cu.
International Board for Plant Genetic Resources (IBPGR).Descriptors for Colocasia. Rome. 1999. Ivancic, A. 2011. INEA hybridization protocols. www.ediblearoids.org/PROJECTS/WP3Breeding.
Downloaded on 9/7/2011.

32
Ivancic, A. Abnormal and unusual inflorescences of taro, Colocasia esculenta (Araceae). Australian Journal Botany, v. 43, p. 475, 1995.
Ivancic, A., Roupsard, O., Quero-García, J. 2008. Thermogenesis and flowering biology of Colocasia gigantea (Araceae). J. Plant Res. 121: 73.
Ivancic, A.; Lebot, V. 2000. The genetics and breeding of taro. Series Repères. Montpellier, France, Centre de Coopération Internationale en Recherche Agronomique pour le Développement (CIRAD).
Libro "Instructivo Técnico del Cultivo de la Malanga", editora Agroecológica, Cuarta Edición, Junio – 2010, Cuba, Biblioteca ACTAF, Asociación Cubana de Técnicos Agricultores y Forestales, Instituto de Investigaciones de Viandas Tropicales.
Milián Jiménez, M., 2008. Caracterización de la variabilidad de los cultivares de la colección cubana de germoplama del género Xanthosoma (Araceae). Tesis presentada en opción al grado científico de Doctor en Ciencias Biológicas. Fac. de Biología, Universidad de La Habana - Instituto de Investigaciones en Viandas Tropicales (INIVIT), Cuba, 122 p.
Pereira, F.H.F.; Puiatti, M.; Miranda, G.V. 2003. Divergencia genética entre araceaes de taro utilizando caracteres morfo-cualitativos de inflorescencia. Horticultura Brasileira, Brasilia, v. 21, n. 3, p. 520, julio-septiembre.
Puiatti, M. 2002. Uso de nombres populares para as especies de Araceae e Dioscoreaceae no Brasil. Horticultura Brasileira, Brasília, v. 20, n. 4, p. 530.
Rodríguez Manzano, A., & Rodríguez Nodals, A., 2002. Diversidad de la malanga isleña Colocasia esculenta (L.) Schott en Cuba. III Inflorescencias. Revista Jard. Bot. Univ. Habana. 23 , 119-126.
Souza, M. M., de Pereira, T. N. S., and Martins, E. R., 2002. Microsporogênes e microgametogênese associadas ao tamanho do botáo floral e da antera e viabilidade polínica em maracujazeiro-amarelo (Passijlora edulis Sims f. jlavicarpa Degener). Ciênc. Agrotec. 26(6): 1209.

33
2.4. CARDI, St Vincent and the Grenadines (Gregory Robin) Analysis of results from the on farm participatory trials The main criteria use for assessing the genotypes on the 25 farms were weight (2 lb and above - export market requirement), shape (oval type shape preferred), flesh colour (white to off-white), number of suckers (for the export market: suckers removed after harvest are a source of corm infection and affects corm presentation), plant height (assessment of vigour) and most importantly taste. Data was collected from 13 of the 25 farms; 2 farms were unsuccessful, 3 farms mixed the genotypes and the remaining 7 farms were weedy and unmanaged. Table 1 shows data collected from six farms where yields of 2 lb and over were recorded. On 5 of the 6 farms, both the IND/24 and the SM/80 genotypes yield 2 lb and above. The genotypes SM/83 and PNG/10, had yields of 2.0 lb and above recorded on 2 of the 6 farms. Table 1 Corm characteristics recorded from the genotypes yielding two pounds and over from the farmer participatory trial in St. Vincent and the Grenadines
Farm Genotype Weight (lb) Shape Flesh colour
Number of
suckers
Plant height (cm)
1 SM/83 SM/80 IND/24 PNG/10
3.6 3.3 2.1 2.1
Bell Bell Bell
White White White Yellow
12 4 1 5
173 127 102 127
2 IND/24 SM/80
2.0 2.1
Bell Bell
Pink Pink
3 4
102 96
3 SM/83 IND/24 PNG/10 SM/80
3.1 2.1 2.1 2.0
Bell Ellipt Ellipt Ellipt
White White Yellow White
7 3
23 3
160 127 149 103
4 IND/24 SM/80
SM/152
4.3 3.9 2.3
Bell Ellipt Ellipt
White White White
10 11 4
167 140 138
5 IND/24 2.8 Bell White 2 135 6 SM/80
SM/13 2.1 2.2
Bell Bell
White White
6 7
68 76
On the 7 farms where yields were under 2 lb; the IND/24 gave the highest yields on 4 out of the 7 farms. This was followed by the SM/80 which gave the highest yields on 3 out of the 7 farms. Though the yields were not over 2 lb the genotypes IND/24 and SM/80 were consistently the higher yielding genotypes. The lower yields may have been due to inadequate crop management. The IND/24 also had the least amount of suckers; that coupled with high yields and good taste, is an indicator that it has good export potential. Randomized complete block experiment In order to have a better understanding of the performan of the 25 genotypes distributed to the 25 farms. A randomized complete block experiment was conducted at the CARDI Research Station in Rabacca, located in Domain IVa, in the North Eastern part of the Island. Annual rainfall is below 2150

34
mm, numbers of dry months are 3 – 6, altitude is below 180 meters and the soils are characterized as rent volcanic ash soils. The experiment consisted of 3 blocks and 25 treatments (genotypes selected from previous evaluation activities). Management of the experiment was according to the CD-ROM: Guide in producing and handling Export Quality Dasheen in the Caribbean (Robin and Pilgrim 2003).
Photos 1 & 2: Taro experiment at CARDI’s Research Station in Rabacca, St. Vincent and
the Grenadines Results from the experiment (Table 2), showed that yield differences were very significant. The overall poor yields recorded were due to the free draining sandy loam soil and the prolonged dry period experienced during crop development. However, the higher yielding genotypes were the IND/24 (1.4 lb), SM/83 (1.2 lb), SM/114 (1.2 lb), PNG/11 (1.2 lb); SM/134 (1.1 lb), SM/143 (1.1 lb), SM/151 (1.1 lb); and the SM/80 (1.0 lb), SM/132 (1.0 lb), SM/13 (1.0 lb), HW/26 (1.0 lb). Corm shapes were generally acceptable. The genotypes highlighted (yellow) gave high yields on farm and will form the core genotypes for conducting crosses in 2016.

35
Table 2 Mean yield and growth characteristics of 25 taro genotypes, grown at the CARDI Research Station in Rabacca, St. Vincent and the Grenadines
Parameters Measured
Genotypes F Pr SM/13 SM/132 SM/134 SM/135 SM/143 SM/149 SM/151 SM/152 SM/80 SM/83
Weight (lb) 1.0 1.0 1.1 0.5 1.1 0.9 1.1 0.8 1.0 1.2 <0.001 Shape Ellipt /
Cylind Ellipt Ellipt Conical
/ Ellipt Ellipt Ellipt Conical /
Branched / Ellipt
Ellipt / Cylind
Ellipt Ellipt -
Flesh colour White White Pink White Pink Yellow White White White White - Number of suckers
1.0 4.8 1.2 1.5 0 6.1 5.8 8.1 4.5 5.8 0.022
Plant height (cm)
61.0 76.3 69.3 53.6 50.0 87.0 83.6 72.3 72.6 91.6 0.010
The experiment for the evaluation of the 25 genotypes was repeated in 2015 and harvest of the first block has been completed. Harvest of Blocks 2 and 3 will continue in 2016.
Parameters Measured
Genotypes F Pr HW/08 HW/26 PNG/09 PNG/10 PNG/11 PNG/13 SM/111 SM/114 SM/116 SM/120
Weight (lb) 0.8 1.0 0.9 0.9 1.2 0.8 0.9 1.2 0.4 0.6 <0.001 Shape
Ellipt Ellipt / Cylind
Ellipt Ellipt Ellipt Ellipt Ellipt / Cylind
Ellipt Ellipt / Conical
Conical / Ellipt
-
Flesh colour White Pink White Yellow White White White White Yellow White - Number of suckers
9.8 6.5 5.0 5.5 8.0 9.0 3.5 2.5 3.2 6.8 0.022
Plant height (cm)
87.0 77.6 73.3 70.6 79.0 82.0 76.0 91.0 52.4 71.0 0.010
Parameters Measured
Genotypes F Pr IND/14 IND/24 MAL/12 MAL/14 MAL/09
Weight (lb) 0.6 1.4 0.7 0.5 0.3 <0.001 Shape Ellipt Ellipt /
Branched Ellipt Ellipt Ellipt
-
Flesh colour
Yellow White (Pinkish)
Yellow White White -
Number of suckers
6.4 4.1 8.5 4.4 9.8 0.022
Plant height (cm)
55.8 70.3 57.3 65.8 52.0 0.010

36
2.5. Ghana, CSIR (Lawrence Misa Aboagye)
Introduction: The report highlights progress made in the activities undertaken on : WP 3 - breeding and on-farm participatory selection and WP 8 - on farm trials and participatory selection in the INEA Taro project in Ghana. WP 8 On-farm trials and Participatory Selection
i. On-farm evaluation A total of 1585 plantlets were distributed to farmers for on-farm evaluation. Each farmer was given one local and 4 exotic accessions (5 stands plants each). Materials and methods (1): Field Management and data collection - Materials distributed were maintained by farmers on their farms with the assistance and advice from staff of Agriculture Extension Agents (AEA) and Scientists. Monthly records were taken on the following: plant height, plant spread, number of suckers, degree of infection and yield at harvest. Results (1) Mean plant height ranged from 20.5 cm (KA 39) to 103.43 cm (BLSM 135). The number of leaves ranged from 2.2 (BLSM 80) to 9.9 (BLSM 115). Plant spread ranged from 25.7 cm (ELO 5) to 134.3 cm (BLSM 135). The number of suckers ranged from 0.3 (KA 14 and BLSM 152) to 23.9 cm (BLSM 116). Percent leaf infection ranged from zero (BLSM 80 and CEIND 10) to 100% (KA 35). The corm yield ranged from 130g (SAO12) to 1033g (BLSM 80).
ii. Participatory selection of plant characteristics Materials and methods (2): Fifty farmers, extension agents and market women and food vendors were involved in the exercise: Agro-morphological evaluation: Participants evaluated the materials with respect to the following traits: Number of leaves (Few leaves/many leaves); Plant height (Tall/short); Suckers (Many/Few/None); diseases (TLB Free); Pests (Free); Colour of plant (Green/Black petiole); Maturity (Early/Medium/Late). Yield and its components: Yield (High); Size of corms (Big/Small); Shape of corms (Oval/Cylindrical/ ovate); Diseases (corm rot free); Colour of skin and flesh (Pink/white/yellow). Sensory evaluation and palatability test; Colour, taste and aroma were scored as acceptable or not acceptable and the cumulative effect rated as Excellent (3); Very good (4); Good (5) and Poor (6). Results (2) The number of leaves/plant: Sixty eight percent of the participants selected plants with many leaves as against 32% for few leaves. High leaves, according to the participants, gives high yields, big corms, big suckers. Participants who selected few leaves linked it to corm development/formation.

37
Fig. 1. Shows participants evaluating the accessions on-farm. Plant height: Sixty percent of the participants selected tall pants as against 40% farmers who preferred shorter plants. The farmers pointed out that taller plant height gave higher yield and bigger corms than shorter plants, whereas shorter plant according to the farmers provide ease of maintaining weeds and also control weeds on taro farms. Suckers: Eighty percent of the farmers prefer varieties with many suckers and compared with 20% who prefer few suckering genotypes. The farmers were of the view that genotypes with many suckers ensure rapid multiplication of planting materials to expand their farms and excess planting materials can be sold to generate income. In the case of farmers preferring few suckers, reasons assigned included intercropping in upland areas. Diseases: All the farmers alluded to the fact that diseases and pests reduce their crop yields and pests problems encountered in Ghana according to the farmers except that in marshy areas, crabs and millipedes are threats to taro production. Farmers preferred corms free from rot since it last in storage and has high marketability. Colour of plants stalks: Forty percent of the farmers prefer green colour and 60% black. According to them, the green colour produces bigger corms and the plants are healthier and can be used to distinguish accessions. The black petiole genotypes in general, produce many suckers. It was the consensus of the farmers that the pink/violet corms are good for fufu (a local delicacy in Ghana) and for starch. Maturity: In general 80% prefer early maturing genotypes with the following reasons: for food security, quick monetary returns and harvesting twice in a year. Twenty percent prefer late maturing types since they are ready for harvesting in the dry season and when cooked they are of high quality and texture. Corm size: Big corms are preferred (84% of the farmers), portraying high yielding and very attractive to buyers and improves marketability of the product. Corm shape: Eighty preferred the cylindrical shape since it is easy to peel and can withstand rotten since most part is above the soil, avoiding microbes.

38
Colour of corms (skin and flesh): The farmers asserted that yellow skin colour corms are big and very attractive, whereas the pink skin ones are sticky when pounded and tastes better. Yield: In general the participants preferred high yielding varieties because it reduces hunger, high yield obtain per unit area and a higher income.
iii. Organoleptic characterization Materials and methods (3). The accessions were evaluated using 3 main criteria: colour, taste and aroma and whether the trait is acceptable (1) or not acceptable (2) and summing up the cumulative effect on the scale of: 3-excellent; 4-very good; 5-good and 6-poor. Results (3)
Fig. 2a Food preparations and testing by participants Fig. 2b shows the boiled and fried taro corm and tasting and scoring of the accessions by participants. Table 1 Scores, description and grouping of accessions
Score Description Accessions
3 Excellent Ex-Bunso 1; BLSM 10; Ex-Bunso 2; KA 19; CEMAL 32; KA 22; BLSM 116; KA 21; BLSM 158
4 Very good BLSM 32; BLHW 37; Tumfa local 5 Good BLSM 151, CEIND 12; KA 35 6 Poor Ex-Bunso 3; BLSM 80; CEMAL 14; KA 24 and BLSM115
Table 1 shows the summary scores and description of the organoleptic properties. The participants scored nine accessions as excellent, 3 as very good, three as good and five as poor. At least one local variety was scored in each category. The farmers also classified 12 of the accessions as soft and 8 as hard. Five were sticky and 15 non-sticky. Two were fibrous and 18 were non-fibrous.

39
WP 3 Hybridization (Breeding and on-farm participatory selection (Controlled crosses and Raising of F1 hybrids) Materials and methods (4): Breeding blocks comprising 32 accessions were established on-station for hybridization.
Fig. 3a Crossing, Seed development, processed seeds and nursed seeds Fig 3b shows crossing being made, developing seeds, processed seeds and seeds being raised Results (4) Table 2 shows the crossings that set seeds. A total of 280 crosses were made of which 32 representing 14% were successful and seeds collected. The percent success ranged from 10% in BLSM /115 X CEMAL 32 to 100% in KA 35 X BLSM 115, BLSM 80XBLSM 16, CEMAL 32 X BLSM 116, CEMAL 32 X BLSM 16, CEMAL 32 X BLSM 151 and BLSM 16 X Tumfa local. The seeds from the crosses are being raised for distribution for on-farm evaluation of the F1.
Conclusions: Few crossings were successful which may be due to genetic and environmental conditions which need to overcome in future studies.

40
Table 2. Collected seeds from Crossed/ pollinated Taro lines.
Female Male No.
Pollinated No.
Successful % Success
BL/SM/151 BL/SM/16 7 2 28.6 CE/MAL/32 6 1 16.7
BL/SM/132 BL/SM/116 5 1 20.0
KA 035 BL/SM/16 2 1 50.0 BL/SM/115 2 2 100.0
No Label CE/IND/16 3 1 33.3 BL/SM/80 BL/SM/16 1 1 100.0
CE/MAL/14
BL/SM/16 2 1 50.0 CE/MAL/32 6 1 16.7 BL/SM/132 3 1 33.3 BL/SM/116 2 1 50.0
CE/MAL/32
BL/SM/116 5 1 20.0 BL/SM/16 2 2 100.0 BL/SM/151 3 3 100.0
BL/SM/116 CE/MAL/32 2 2 100.0 BL/SM/16 3 2 66.7
BL/SM/115
BL/SM/132 10 1 10.0 CE/MA/32 3 1 33.3 BL/SM/16 11 2 18.2
BL/SM/16
TUMFA LOCAL 1 1 100.0 BL/SM/115 6 2 33.3 BL/SM/132 6 1 16.7 KA 035 2 1 50.0

41
2.6. Burkina Faso, Université de Ouagadougou (Renan Traoré) This report summarizes the main activities of the project during the year 2015. These are:
- Evaluation of selected varieties introduced; - Multiplication and distribution of varieties to producers; -Awareness of farmers and of some actors of the Ministry of Agriculture; - Implementation of fields’ trials for the production of hybrid
1. Evaluation of selected varieties introduced
From the results of the cultivation of the second generation of the germplasm bank at the research station and the evaluation of the taste of each of the varieties, 20 varieties were selected during 2014. During the third cultivation cycle, agromorphological characterization during 2015 of these 20 selected varieties shows that eight varieties could well adapted to climate Burkina Faso which is characterized by a rainy season that lasts approximately four months. These varieties have attractive yields after a six-month development cycle. The table 1 shows these varieties. Table 1: Yields of eight varieties introduced after a 6-month development cycle
Varieties Origins Yields (t/Ha)
BL/SM/80 Samoa 50 BL/SM/135 Samoa 29.7 BL/SM/120 Samoa 21.1 BL/SM/136 Samoa 20.2 BL/PNG/11 PNG 27.4 BL/PNG/10 PNG 21.7 BL/HW/05 Hawai 23.4 CE/IND/09 Indonesia 19.1
2. Germplasm multiplication and distribution
In Burkina Faso, major taro production areas are remote from our institution. Thus some villages chosen to distribute the varieties are remote from research station. The difficulty about of adoption of new varieties is that some farmers are not able to maintain the plants because of the length of their development cycle. An awareness of farmers must be made to learn them some cultural practices adapted to certain varieties introduced. For example, in some areas in Burkina Faso, farmers use only cormelles as propagated material and not the headsets. Table 2 shows the varieties distributed in four villages during year 2015. Table 2: Varieties multiplied and distributed to farmers from 4 villages.
Villages Varieties Number of Farmers
Nobéré BL/SM/13 ;BL/SM/05 ;CE/IND/16; CE/IND/31;BL/SM/132
05
Baporo BL/HW/05;CE/IND/12;CE/IND/14; BL/SM/120;BL/SM/135
05
Bérégadougou Ouest BL/HW/05;BL/SM/120;CE/THA/12;BL/SM/116;BL/SM/138 05 Séréfédougou BL/HW/05;BL/SM/120;CE/THA/12;BL/SM/116;BL/SM/138 05

42
Photo 1: Germplasm multiplication
3. Awareness of farmers and of some actors of Ministry of Agriculture Since some villages where varieties have been distributed have moved away from our institution, we need the collaboration of actors of the Ministry of Agriculture that are present in all 45 provinces of the country. These will help us to regularly oversee plants in farmers' fields. So we meet the actors of the Ministry of Agriculture in selected villages to exchange. Farmers were also sensitized to increase the survival rate of distributed varieties. Photo 2: Awareness of farmers and of some actors of Ministry of Agriculture
4. Implementation of fields trials for the production of hybrids For the production of hybrids, we have planned three attempts to increase the success rate. We have already implemented the first test in November 2015 at the station. This test is set up in the dry season and it will be irrigated. Table 3 lists the varieties concerned. Photo 3: plants in the station for hybridization
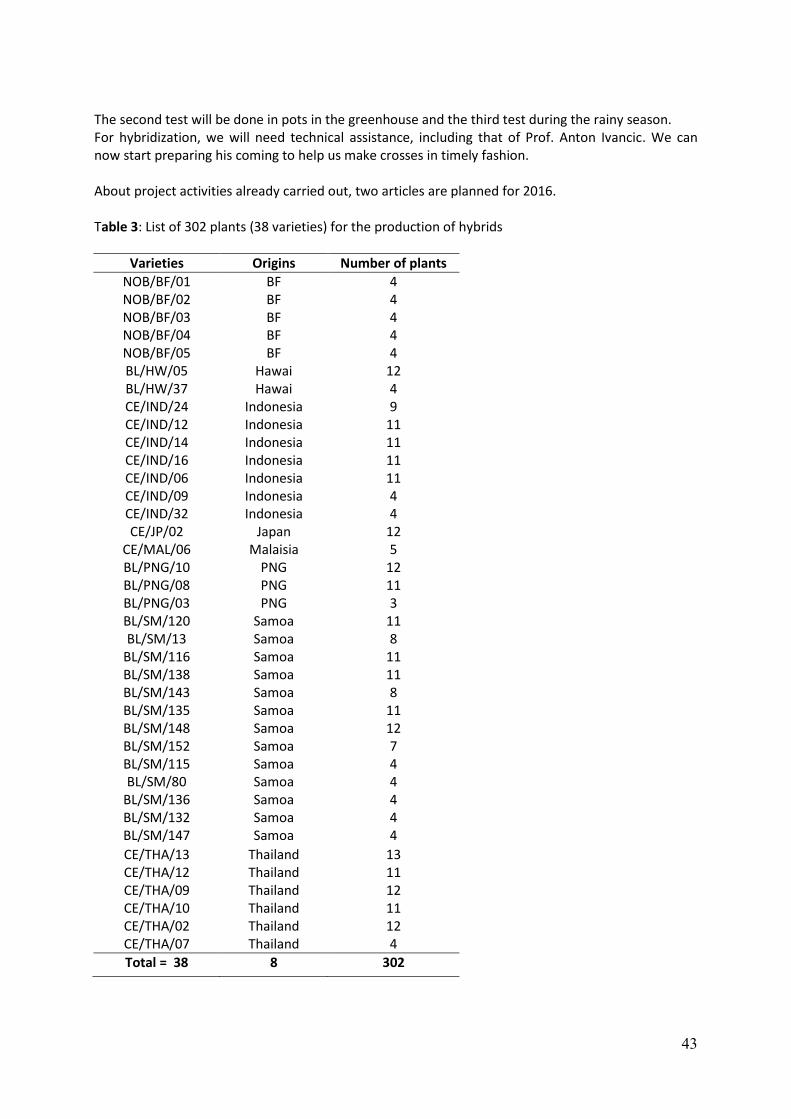
43
The second test will be done in pots in the greenhouse and the third test during the rainy season. For hybridization, we will need technical assistance, including that of Prof. Anton Ivancic. We can now start preparing his coming to help us make crosses in timely fashion. About project activities already carried out, two articles are planned for 2016. Table 3: List of 302 plants (38 varieties) for the production of hybrids
Varieties Origins Number of plants
NOB/BF/01 BF 4 NOB/BF/02 BF 4 NOB/BF/03 BF 4 NOB/BF/04 BF 4 NOB/BF/05 BF 4 BL/HW/05 Hawai 12 BL/HW/37 Hawai 4 CE/IND/24 Indonesia 9 CE/IND/12 Indonesia 11 CE/IND/14 Indonesia 11 CE/IND/16 Indonesia 11 CE/IND/06 Indonesia 11 CE/IND/09 Indonesia 4 CE/IND/32 Indonesia 4 CE/JP/02 Japan 12
CE/MAL/06 Malaisia 5 BL/PNG/10 PNG 12 BL/PNG/08 PNG 11 BL/PNG/03 PNG 3 BL/SM/120 Samoa 11 BL/SM/13 Samoa 8
BL/SM/116 Samoa 11 BL/SM/138 Samoa 11 BL/SM/143 Samoa 8 BL/SM/135 Samoa 11 BL/SM/148 Samoa 12 BL/SM/152 Samoa 7 BL/SM/115 Samoa 4 BL/SM/80 Samoa 4
BL/SM/136 Samoa 4 BL/SM/132 Samoa 4 BL/SM/147 Samoa 4
CE/THA/13 Thailand 13 CE/THA/12 Thailand 11 CE/THA/09 Thailand 12 CE/THA/10 Thailand 11 CE/THA/02 Thailand 12 CE/THA/07 Thailand 4
Total = 38 8 302

44
2.7. Nigeria, NRCRI (Joe Onyeka) Introduction: The priority focus of NRCRI INEA project for the year 2015 based on the previous year’s success was to expand the involvement of farmers to meet the project objective of reaching more farmers, and to ensure that we successfully raised seedlings from the true seeds derived from 2014 crosses and carry out seedling evaluation. Farmers Managed Multi-location multiplication: Farmers managed community base multiplication was established in 4 different communities from 3 states of South Eastern Nigeria. The communities include Isiukwuato and Olokoro communities in Abia State, Ihitte-Uboma community in Imo State and Igbariam community in Anambra State. In each of the communities, four of the SPC introduced lines (BL/PNG/03, CE/THA/05, BL/SM/158 and CE/IND/12) identified as most preferred by farmers in the previous year were planted along with a local landrace as control. The planting was conducted on 19th May in Isiukwuato, 24th May in Ihite-Uboma, 3rd June in Igbariam and 17th June in Olokoro. The key target was community based multiplication and comparing of the yield of the introduced accession to farmers’ popular landrace in each location. Generally, yields were higher in the Isiukwuato community compared to all the locations. The introduced INEA accessions however compared favorably with the farmers’ landraces in all the locations (Figure 1).
Figure 1: Comparison of four INEA accessions with farmers preferred landraces in four communities in Nigeria under farmers managed trial.
0
10
20
30
40
50
60
70
Igbariam Ihite-Uboma Isiukwuato Olokoro
BL/PNG/03 BL/SM/158 CE/IND/12 CE/THA/05 CONTROL

45
Hybridization and seedling evaluation: Effort was made in 2015 to generate seedling from the hybrid seed derived in 2014 and in addition carry out some new targeted crosses. The germination and successful establishment of seedling from the 2014 crosses was significantly low, however the success of establishing seedlings in the field from the germinated seeds range from 44 – 100% (Table 1). The successful seedlings were established in the field and evaluated as F1 generation. This seedling has also been transferred to in-vitro culture for further multiplication. Three successful targeted crosses were made in 2015 with a total of 2393 seed derived (Table 2). Table 1: Germination and number of seedling transplanted from seed obtained from 2014 crosses
Female Male Number of seeds
Number germinated
Seedling established
% established
BL/PNG/13 BL/SM/152 680 2 2 100.00
BL/SM/152 BL/PNG/13 52 0 0 .
BL/PNG/13 NCE 012 540 58 48 82.76
BL/SM/152 NCE 012 241 0 0 .
BL/SM/152 BL/SM/136 403 0 0 .
BL/SM/152 CE/THA/19 108 52 40 76.92
BL/SM/152 NCE 004 920 18 8 44.44
BL/SM/152 CE/IND/12 1401 67 47 70.15
BL/SM/152 CA/JP/01 83 2 0
CE/IND/10 NCE 012 281 3 2 66.67
CE/IND/12 BL/SM/152 1501 34 28 82.35
CE/IND/19 BL/SM/152 324 0 0
CE/THA/19 CA/JP/08 782 23 17 73.91
TOTAL 7316 259 192
Table 2: Successful crosses and true taro seeds derived in 2015
Female Male Number of Seed
BL/SM/152 NCE 012 1230
CE/IND/12 NCE 012 381
NCE 012 BL/PNG/13 782
TOTAL 2393
In vitro establishment & multiplication of F1: The 192 hybrids from our seedling evaluation were initiated into tissue culture for rapid multiplication and maintenance. The hybrids were transferred from the field and planted unto sterile soil in the screen house to reduce to microbial load from the field and generate clean corms or cormels for tissue culture initiation. After a period of two months in the screen house very few cormels were developed by these plantlets even though the aerial growth was vigorous. As an alternative strategy to the use of corms and cormels as explants we used the shoot of the plantlets as explants by removing the outer layers of the shoots to expose the very tender shoots which were then introduced into media. This method showed that contamination rate was greatly reduced in

46
comparison to the use of corms and cormels. This in-vitro method is being used to rapidly multiply the hybrids for further evaluation and distribution of promising candidates to farmers. INEA Field Day: The NRCRI INEA project show cased the success and potential of the project in alleviating the diverse challenging militating against genetic improvement of Taro during a project field in NRCRI (Plate 1). The event saw the NRCRI management and scientific staff visiting the INEA Project plots, during which it was seen that most of the hybrids derived from crosses between adapted Nigeria cultivars and Taro leaf blight resistant genotypes introduced from SPC Fiji under the INEA Project showed good resistance to TLB in the field. The Executive Director and his management team great applaud the NRCRI-INEA team and the INEA Project for the remarkable breakthrough in successful getting locally developed taro hybrid to the field (Plate 2).
Plate 2: NRCRI breeder Dr Charles Amadi showcasing the new hybrids

47
Plate 3: TLB resistant INEA derived taro hybrids well established in the field

48
2.8. South Africa (Willem Jansen van Rensburg)
1. Introduction Taro (Colocasia esculenta) is known as Amadumbi in South Africa. In South Africa, Amadumbi is a lesser known starch crop. Potatoes and maize are the main starch staples. Taro is cultivated in the sub-tropical coastal areas of KwaZulu-Natal and the Eastern Cape Province and the eastern areas of Maphumalanga. Most producers are small holder farmers that use traditional cultivation methods. No cultivars are available, however, the farmers due distinguish between various morphotypes. Eddoe typed are preferred by the local community, but the farmers said that the Indian market also like the dasheen type. 2. Materials and Methods 2.1. Germplasm acquisitions, characterization and distribution: A core collection of 50 lines was received from the Centre for Pacific Crops and Trees (CePaCT) during 2012. Additional germplasm can be acquired when the need arises. All foreign and local germplasm wre characterized morphologically and with microsatellite markers. Selected lines were planted in the field for multiplication at ARC-VOPI using standard cultivation practices. True botanical amadumbi seed were also obtained from Dr Lebot at the annual report back meeting in Vanuatu in February 2015. The seed has been sown in moisture chambers. 2.2. Participatory Evaluation: Pre-sprouted corms of ten lines (local lines and foreign germplasm) were planted during October 2014. Planting materials were delivered directly to the Umbumbulu farmers, bit the planting material were left with the extension officer at Richmond as it was imposable to reach the Richmond farmers due to poor service delivery strikes. All demonstrations were planted in a complete random design in ten gardens around Umbumbulu and Richmond (figure 2.1). The gardens were chosen from farmers in farmers groups that show commitment the previous year. The layout of the design depends on the space available in the garden. Furrows were prepared manually by the community members with hand hoes. The spacing between the furrows was one meter. The amadumbi corms were planted in the furrows with spacing of 60 cm between the plants depending on the space available in the garden. Well decomposed manure was added in the furrows at planting at a rate of 250ml per plant. The plants were then covered manually.
Figure 2.1: Location of the demonstration trials during 12/13 seasons left and during the 2013/14 season. Evaluation trials 1-4 is part of project 040508.
1
2
4
3
1-4 Evaluation trials O Umbumbulu O Richmond

49
2.3. Hybridization Local lines did not flower freely but it is easy to induce flowering using the application of 500ppm GA3. Many of the foreign germplasm flower freely. Pollinations were done in random manner depending on the availability of pollen and receptacle female flowers. 3. RESULTS 3.1. Germplasm acquisitions, characterization and distribution: ARC has received 50 lines from CePaCT in 2012. Of these lines 49 are still maintained in vivo. Problems were also encountered with endogenous contamination and the decision was made to transplant all in vitro cultures from some lines to pots. Plant preservative mixture (PPM™: a broad-spectrum preservative/biocide, which effectively prevents or reduces microbial contamination in plant tissue culture) will now be used included in all the cultures to minimize the danger of endogenous contamination. Lines maintained in vitro were lost due to mite infestation while building was renovated. All the lines as well as the local germplasm will be established in vitro during 2014 and 2015. All foreign and local germplasm has been characterized with microsatellite markers during 2012 and 2013. Very low genetic diversity was observed for the local germplasm. All local material has been characterized morphologically during 2013. Foreign material grew very slowly and was not phenotypically characterized during 2013/14 season. The second generation field plants will be characterized during 2014/15 and then again during 2015/16 seasons. The true botanical seed germinated very well in the moisture chambers (figure 3.1). Seedlings grow rather slow during the winter due to the low temperatures but were transferred to seed trays when big enough (figure 3.2). One thousand and twenty four seedlings were transplanted to seed trays.
Figure 3.1: Amadumbi seedlings germinating in a moisture chamber. The seed trays were placed in a polystyrene bucket. Water is poured in the polystyrene bucket to increase the humidity around the seedlings.

50
Figure 3.2: Amadumbi seedlings transplanted on a seed tray
3.2. Demonstration trial The farmers are very keen to try new germplasm. They are especially interested in “coloured” flesh. The “orange fleshed sweet potatoes” were strongly promoted in KwaZulu Natal. Therefore the farmers have good knowledge on health benefits of yellow and orange flesh. The importance of the selection of beneficiaries was also clearly illustrated in this project. Based on experience from previous year farmers from two community gardens were chosen to plant the lines in their home gardens. These were farmers in Richmond (figure 3.3) and Umbumbulu (Figure 3.4). All farmers selected this year look very well after the trails. The farmers in Richmond were: Name ID number Ms. Thandiwe Ndlovo 570304 0841 086 Ms. Zumekile Dlamini 570222 0622 084 Ms. Mangqafava Shezi 530622 0362 087 Ms. Landeni Pungula 450312 0480 081
Figure 3.3: The four Richmond farmers with Ms Lindiwe Zulu (ARC technician).

51
The farmers in Umbumbulu were: Name ID number Ms. Ngafungi Nene 810701 0729 080 Ms. Zandile Mbili 680125 0749 087 Ms. Fikelephi Msomi 531016 0654 081 Ms. Lungeleni Mkhize 561115 0595 089 Ms. Doris Mkhize 820221 0676 080 Ms. Lindiwe Mkhize 640905 0567 087
Figure 3.4: Three of the six Umbumbulu farmers with Ms Lindiwe Zulu (ARC technician).
All farmers prefer the eddoe type of material. At harvest, they retain the original central corm for planting in the following season, while the side corms are used for own consumption or to sell. They prefer to plant as early as possible after the first rain. Both areas are in a summer rainfall areas close to the coast. The local farmers and consumer prefer a long oval corm of about 7 - 10cm long. They also prefer a dry texture. The said that the Indian consumers prefer smaller more watery corms at the market. The farmers still prefer the local material. However, both farmers like a line obtain from seed received from Dr Lebot about four years ago. They like the texture and taste but feel unsure about the yield as they only planted a small area. This is a good indication that it is possible to share allelic diversity with seed. All farmers prefer lines with shorter growing seasons. At Richmond the farmers feel that their local material performs better than the 10 South African and 10 SPC lines that were included in the four demonstration trials. They are, however, still keen to continue with the project. Very little pest and diseases were observed in the trials. The symptoms seen in figure 3.5 were widespread on all the older leaves. However, it seems that it did not influence the plants. One plant with Dasheen Mosaic Virus like symptoms were observed (Figure 3.6).

52
3.3 Hybridization Local lines did not flower freely but it was easy to induce flowering. Many of the foreign germplasm flower freely, but no berries were observed. Presumably no natural pollinators occur. No success was obtained with pollinations. In process to try pollinations at higher ambient humidity, and will also try pollination at different times during the day.
Figure 3.5: Symptoms on the older leaves. The early stages on the adaxial side (top left). Later stage on the adaxial side of the leaves (top right). c) The early stages on the abaxial
side (bottom left). d) Later stage on the abaxial side of the leaves (bottom right).
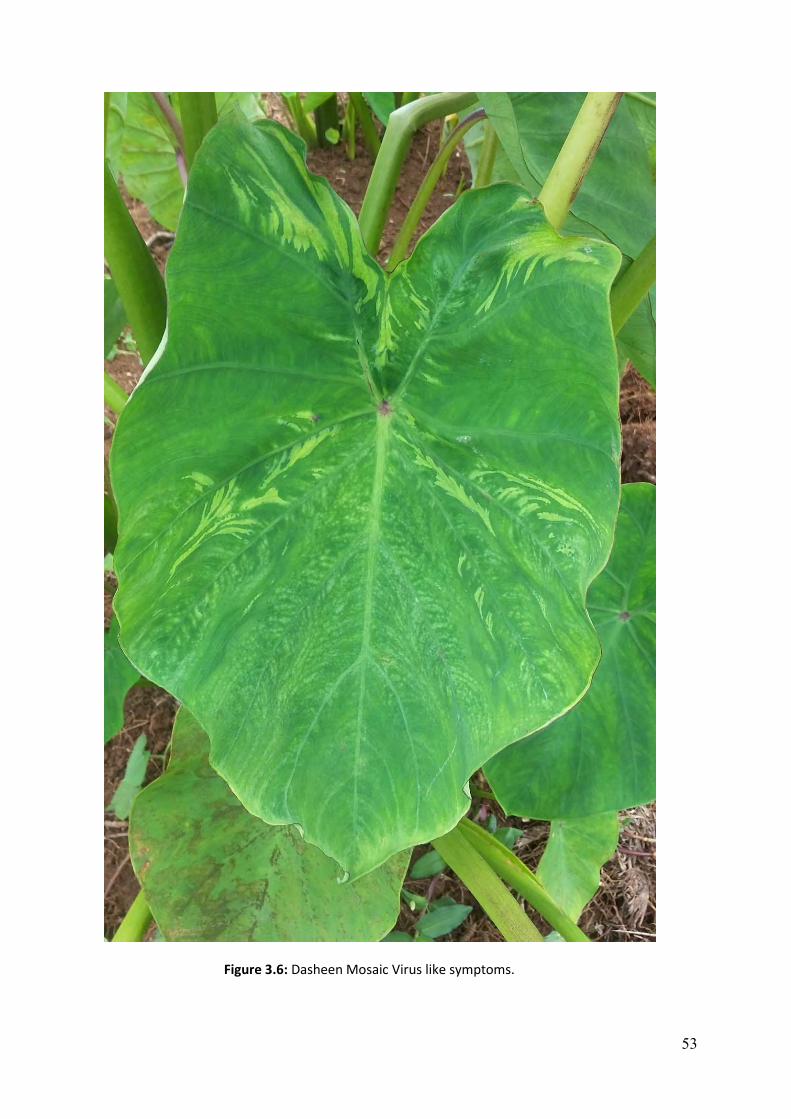
53
Figure 3.6: Dasheen Mosaic Virus like symptoms.

54
4. Conclusions and recommendations
There is a good indication that the participatory selection of the amadumbi germplasm will be successful. The farmers that have shown their commitment are very keen to see and taste the foreign germplasm. The use of true botanical seed to exchange germplasm also proves to be successful as one of the foreign lines that the farmers prefer is a seedling from seed received from Dr Lebot five years ago. The importance of the selection of the beneficiary was clear in this project. Some of the farmers groups was very enthusiastic and tend to the trials, while other just left the trials unattended or start to harvest before data collection. All beneficiaries were subsistence farmers and do not always all the resources. Water for irrigation is seldom available. Farmers use small leftover corms for propagation. There is a need of establishment of a “healthy” planting material scheme.

55
2.9. Madagascar, FOFIFA (V. Andrianavalona, A. Rakotondravao)
1. Introduction 2015 was characterized by the decrease of rainfall quantity and hot weather for all agroecological zones of Madagascar. It was very important for the highland and the south of Madagascar. It had a bad influence on the successful of the hybridization, on the rate of seeds germination, on the farm trials (low rate of plants survival, poor harvest) and the planting date was delayed in December 2015. 2. Germplasm Introduced and local varieties field maintenance is continuing at Ilaka FOFIFA station. Due to the performance of many introduced varieties, many new farmers are interested to plant them and request the new materials. In March 2015, taro seeds from open pollination at Vanuatu were brought by Mr Arsene during his mission. They were sown at 2 locations: at Ilaka Est (lowlands) and at Ambatobe (highlands). Due to the bad condition weather very hot and insufficient rainfall, low ambient humidity, rate seeds germination recorded is low. However, 5000 plantlets were transplanted in pots. 3. Germplasm distribution
- 2014-2015 farm trial => 23 introduced genotypes were redistributed to 74 new farmers (16 villages) at 4
agroecological sites in collaboration with BIMTT (NGO). - 2015-2016
=> One training center requested the new materials and established a model farm for all visitors and students at Mahanoro. (Soeur Marotsiriry).
=> Vanuatu plantlets Among the 5000 plantlets potted, 1790 plantlets were distributed to 10 farmers and 800 planted at the station. Highlands : 6 farmers and lowlands 4 Farmers. Planting was performed in December 2015. 4. Participatory evaluation For this year 2015, the redistribution of the selected materials was done for new farmers. It is very important to confirm 2014 results. The main constraints recorded during this season are: - maintenance of trial not done correctly - harvest done before maturity - no weighting of corm and cormel but only visual evaluation - no labelling of plants after harvest (mixture of all plants at one plot) - no identification of the best genotype for the next plantation - harvest not done for each plant but per genotypes - best and big plant stolen before data collection

56
Performance of introduced genotypes
-
200.0
400.0
600.0
800.0
1,000.0
1,200.0
1,400.0
1,600.0
1,800.0
Wt corm/plant (g)
Nb cormel
Wt cormel/plant (g)
Wt (Corme +cormel)/plant (g)
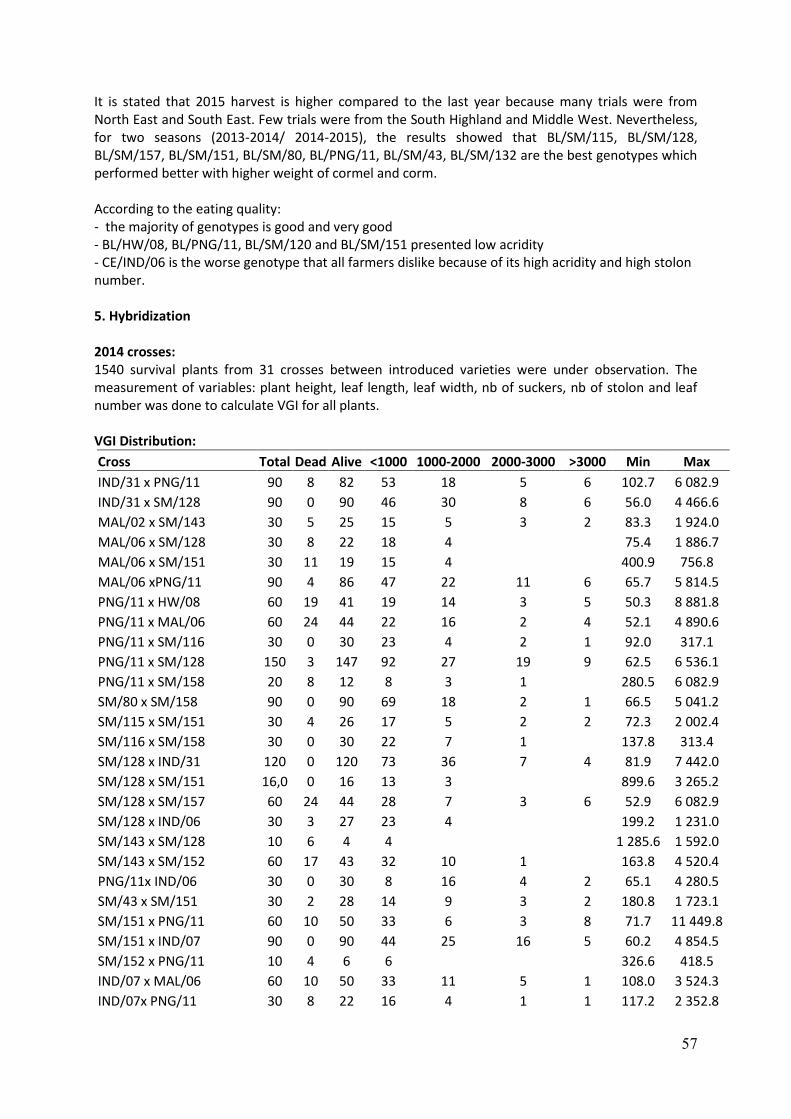
57
It is stated that 2015 harvest is higher compared to the last year because many trials were from North East and South East. Few trials were from the South Highland and Middle West. Nevertheless, for two seasons (2013-2014/ 2014-2015), the results showed that BL/SM/115, BL/SM/128, BL/SM/157, BL/SM/151, BL/SM/80, BL/PNG/11, BL/SM/43, BL/SM/132 are the best genotypes which performed better with higher weight of cormel and corm. According to the eating quality: - the majority of genotypes is good and very good - BL/HW/08, BL/PNG/11, BL/SM/120 and BL/SM/151 presented low acridity - CE/IND/06 is the worse genotype that all farmers dislike because of its high acridity and high stolon number. 5. Hybridization 2014 crosses: 1540 survival plants from 31 crosses between introduced varieties were under observation. The measurement of variables: plant height, leaf length, leaf width, nb of suckers, nb of stolon and leaf number was done to calculate VGI for all plants. VGI Distribution:
Cross Total Dead Alive <1000 1000-2000 2000-3000 >3000 Min Max
IND/31 x PNG/11 90 8 82 53 18 5 6 102.7 6 082.9
IND/31 x SM/128 90 0 90 46 30 8 6 56.0 4 466.6
MAL/02 x SM/143 30 5 25 15 5 3 2 83.3 1 924.0
MAL/06 x SM/128 30 8 22 18 4
75.4 1 886.7
MAL/06 x SM/151 30 11 19 15 4
400.9 756.8
MAL/06 xPNG/11 90 4 86 47 22 11 6 65.7 5 814.5
PNG/11 x HW/08 60 19 41 19 14 3 5 50.3 8 881.8
PNG/11 x MAL/06 60 24 44 22 16 2 4 52.1 4 890.6
PNG/11 x SM/116 30 0 30 23 4 2 1 92.0 317.1
PNG/11 x SM/128 150 3 147 92 27 19 9 62.5 6 536.1
PNG/11 x SM/158 20 8 12 8 3 1
280.5 6 082.9
SM/80 x SM/158 90 0 90 69 18 2 1 66.5 5 041.2
SM/115 x SM/151 30 4 26 17 5 2 2 72.3 2 002.4
SM/116 x SM/158 30 0 30 22 7 1
137.8 313.4
SM/128 x IND/31 120 0 120 73 36 7 4 81.9 7 442.0
SM/128 x SM/151 16,0 0 16 13 3
899.6 3 265.2
SM/128 x SM/157 60 24 44 28 7 3 6 52.9 6 082.9
SM/128 x IND/06 30 3 27 23 4
199.2 1 231.0
SM/143 x SM/128 10 6 4 4
1 285.6 1 592.0
SM/143 x SM/152 60 17 43 32 10 1
163.8 4 520.4
PNG/11x IND/06 30 0 30 8 16 4 2 65.1 4 280.5
SM/43 x SM/151 30 2 28 14 9 3 2 180.8 1 723.1
SM/151 x PNG/11 60 10 50 33 6 3 8 71.7 11 449.8
SM/151 x IND/07 90 0 90 44 25 16 5 60.2 4 854.5
SM/152 x PNG/11 10 4 6 6
326.6 418.5
IND/07 x MAL/06 60 10 50 33 11 5 1 108.0 3 524.3
IND/07x PNG/11 30 8 22 16 4 1 1 117.2 2 352.8

58
SM/147 x SM/151 30 0 30 17 11 2
279.8 2 973.6
SM/147 x IND/07 60 34 26 20 4 2
1 345.9 2 283.6
SM/158 x HW/08 60 0 60 6 27 14 13 403.4 7 658.2
SM/158 x IND/31 150 0 150 47 38 19 46 882.8 11 248.9
Identification of best crosses :
N°
Cro
ss
Nb
of
pla
nts
un
der
ob
serv
atio
n
Min
imu
m
Max
imu
m
Nb
of
min
imu
m
Nb
of
max
imu
m
Ave
rage
of
corm
w
eig
ht
(g)
Var
ian
ce (
n-1
) St
and
ard
dev
itio
n
(n-1
)
Co
effi
cien
t o
f va
riat
ion
(C
V)
% o
f p
roge
nie
s >
aver
age
of
corm
we
igh
t
1 SM/152 x PNG/11 4 10 60 1 2 38.8 639.6 25.3 0.6 50.0
2 IND/07x PNG/11 22 20 200 2 1 60.2 2 091.6 45.7 0.7 22.7
3 SM/128 x IND/06 24 40 250 2 1 69.6 1 943.3 44.1 0.6 25.0
4 MAL/06 x SM/128 21 20 240 2 1 77.6 3 644.0 60.4 0.8 38.1
5 MAL/06 x SM/151 18 25 240 5 1 80.8 3 906.6 62.5 0.8 33.3
6 IND/07 x MAL/06 49 20 300 1 1 80.9 3 604.9 60.0 0.7 34.7
7 SM/147 x SM/151 28 25 200 6 1 84.6 2 531.3 50.3 0.6 46.4
8 SM/147 x IND/07 26 25 600 1 1 96.3 13 539.1 116.4 1.2 26.9
9 PNG/11 x MAL/06 44 20 350 1 1 98.4 4 417.2 66.5 0.7 47.7
10 PNG/11x IND/06 29 50 250 5 1 101.7 2 129.1 46.1 0.4 31.0
11 PNG/11 x SM/158 13 50 250 5 1 103.8 4 209.0 64.9 0.6 46.2
12 SM/143 x SM/128 4 60 150 1 1 107.5 1 425.0 37.7 0.3 50.0
13 SM/151 x PNG/11 46 25 550 4 1 108.5 13 686.5 117.0 1.1 26.1
14 MAL/06 x PNG/11 75 25 550 2 1 108.5 6 081.2 78.0 0.7 30.7
15 SM/115 x SM/151 25 25 400 3 1 110.6 7 806.9 88.4 0.8 36.0
16 SM/43 x SM/151 33 25 400 2 1 115.5 6 580.3 81.1 0.7 45.5
17 PNG/11 x HW/08 29 25 450 1 1 119.1 7 118.0 84.4 0.7 48.3
18 SM/116 x SM/158 30 25 300 2 2 127.0 6 095.9 78.1 0.6 46.7
19 IND/31 x PNG/11 80 15 650 1 1 130.9 16 684.2 129.2 1.0 30.0
20 SM/80 x SM/158 104 25 450 4 1 133.8 7 362.5 85.8 0.6 48.1
21 SM/128 x SM/151 13 150 400 2 1 246.2 6 442.3 80.3 0.3 46.2
22 MAL/02 x SM/143 19 20 650 1 1 167.9 42 889.8 207.1 1.2 26.3
23 SM/128 x SM/157 43 50 900 6 1 217.4 39 971.9 199.9 0.9 27.9
24 IND/31 x SM/128 79 40 960 2 1 162.2 19 278.6 138.8 0.9 30.4
25 PNG/11 x SM/116 30 50 520 3 1 172.7 14 778.9 121.6 0.7 33.3
26 PNG/11 x SM/128 65 25 650 1 1 178.7 21 056.5 145.1 0.8 36.9
27 SM/158 x IND/31 72 25 780 1 1 283.0 33 201.2 182.2 0.6 38.9
28 SM/158 x HW/08 67 50 670 5 1 182.7 11 604.8 107.7 0.6 40.3
29 SM/143 x SM/152 42 25 450 2 1 173.1 13 049.9 114.2 0.7 40.5
30 SM/151 x IND/07 75 20 450 1 2 184.6 11 940.4 109.3 0.6 46.7
31 SM/128 x IND/31 50 10 430 1 1 171.3 11 167.2 105.7 0.6 48.0
Red: best crosses Among 31 crosses done and planted in field in 2014 and under observation and harvested in 2015, 10 best crosses were identified: high average of corm weight (162,2g-282g) with high CV (0,58-1) and high percentage (26% -48%) of progenies having a corm weight superior to their average.

59
Performance of progenies of all crosses 2014
0
50
100
150
200
250
300
350
400
450
500
Wt of corm/plant (g)
Total wt of corm+cormel/plant (g)
Nb of cormels/plant
Wt of cormel/plant (g)

60
2015 crosses The following genotypes (2 local varieties and 13 introduced genotypes) were selected as parents according to the results of on-farm participatory selection and evaluation for 2015 crosses. List of selected parents for 2015 hybridization
CEPACT code Origin
BL/HW/37 Hawaii
CE/IND/31 Indonesia
CE/IND/07 Indonesia
CE/MAL/02 Malaysia
CE/MAL/06 Malaysia
BL/SM/43 Samoa
BL/SM/147 Samoa
BL/SM/157 Samoa
BL/SM/158 Samoa
BL/SM/80 Samoa
BL/SM/115 Samoa
BL/SM/128 Samoa
BL/SM/152 Samoa
Soampotsy Local variety
Ramandady mavo Local variety
19 reciprocal crosses and 13 simple crosses were done. Among of 184 inflorescences hybridized, only 46 of them were successful (25%) and developed to maturity. BL/SM/115, CE/IND/31 and BL/SM/128 seemed to be very good female parent and were the genotype most successfully used in crossing. BL/SM/157 and BL/SM/158 seemed to be very good male parent and were the genotype most successfully used in crossing. 18916 seeds were sown. The data recorded showed that the majority of 31 types of 2015 crosses have low seed germination. The crosses with 2 local varieties (Soampotsy and Ramandady mavo) have also the same results. The main reason may be the bad conditions (low ambient humidity) from hybridization to harvest of seeds (insufficient rainfall and very hot weather). Only 460 healthy and vigour plants from 9 crosses were planted in field in the end of December 2015. Work Plan for 2016 - Continuing hybridization especially for the best local varieties with introduced varieties - Evaluation of plants from Vanuatu open pollinated seeds - Second year of hybrids evaluation (hybrids from 2014 crosses)

61
- Evaluation of hybrids from 2015 crosses.
Sowing of seeds from open pollination Taro bed water in green house at Ambatobe
Plantlets after 2 months after sowing
Preparation before transplanting Transplanting before planting in field at Ilaka
Potting at Ambatobe

62
2.10. India, CTCRI (A. Mukherjee, M. Unnikrishnan, J. Sreekumar)
I. Maintenance and multiplication of exotic taro
• The fifty exotic taro genotypes are maintained in vitro as well as in field at both the Centres of ICAR-CTCRI (Bhubaneswar and Thiruvananthapuram, India). Out of which 32 lines multiplied and distributed to farmers’ of 7 different locations of (Khorda-2, Cuttack-3, Puri-2) of Odisha. The plantations of different locations have grown well.
• Tubers/ Suckers of 50 exotic lines established in field were multiplied to generate more than 5000 plants within two years to distribute taro growers of Odisha, India.
II. Morphological characterization, monitoring for diseases- pests Morphology:
• Of the 50 lines, 3 from Hawaii, 9 from Indonesia, 3 from Malaysia, 5 from Papua New Guinea,18 from Samoa,7 from Thailand and 5 from Japan.
• Among 50 lines, morphotypes varied such as eddoes- 10 lines, dasheens-35 lines and intermediate-5 lines.
• Out of 50 exotics, 11 lines stoloniferous showing slender, elongated, short stolons. Based on petiole colour, all the exotic genotypes are grouped into six (Table 1).
• Flowering recorded in 18 accessions had set fruits & seeds. Seed viability varied among the lines.
Edibility:
• Of the 50 lines, only five lines found to have non edible parts. • Tuber Yield ranged from 30g/plant to 1000g/plant. • 37 potential lines selected for participatory evaluation and breeding.
Table 1. Grouping of accessions based on petiole colour
Petiole colour Lines Lines in the group
Petiole colour with purple shade/ lines/
spots
BL/HW/26, BL/SM/116, CE/THA/05, CE/THA/09, CE/THA/24, CE/THA/12, CA/JP/01, CA/JP/02, CA/JP/04
9
Petiole cream colour CE/IND/20, CE/IND/31, CE/IND/24,CE/MAL/12 4
Petiole dark purple BL/HW/08, BL/IND/14, BL/PNG/13, BL/SM/132, BL/SM/147, BL/SM/157, BL/SM116
7
Petiole dark or light green with purple tip
BL/HW/37, BL/IND/32, CE/IND/06, CEIND/07, CE/IND/12, BL/PNG/11, BL/SM/111, BL/SM/151, BL/SM/152,
CE/THA/03, CE/THA/10, CE/THA/07, BL/SM/120, CA/JP/06
14
Petiole dark or light green
CE/MAL/14, BL/PNG/10, BL/SM/134, BL/SM/149, BL/SM/43, BL/SM/114, BL/SM/115, CA/JP/08
8
Petiole dark, light or purplish green
CE/MAL/06, BL/PNG/09, CE/IND/10, BL/PNG/12, BL/SM/135, BL/SM/158, BL/SM/128, BL/SM/143
8

63
Blight Resistance:
• Incidence of Taro Leaf Blight (TLB) varied with rainfall followed by warm, humid condition. • The lines identified as tolerant and resistant to TLB in 2012 continued to show the same
reactions till 2015 confirming the stability of this character. • All the breeding lines from Samoa continued to show the disease tolerance character. • BL/SM/116,151(Samoa), BL/PNG/09, 11 (Papua New Guinea) and CE/MAL/12 (Malaysia)
showed better expression of tolerance with no symptom development at all.
III. Molecular analysis (DNA Fingerprinting) of indigenous germplasm The molecular analysis carried out at CIRAD, France (UMR-AGAP) revealed that maximum genetic diversity in taro exist in India among the 16 participatory countries.
• Two distinct gene pools. Gene pool 1 with 26 accessions and gene pool 2 with 18 accessions, out of the 44 accessions (Fig.1).
• Gene pool 1 contained accessions from states of North Eastern& South India. • Gene pool 2 had accessions from North Eastern India only. • The divergent genetic variability available in the North Eastern states of India.
Work Plan (WP6) Gene pool 1 - 26 lines with 18 triploids and 8 diploids Gene pool 2 - 18 lines with 14 triploids and 4 diploids Source: (UMR-AGAP, France)

64
IV. Physico-chemical characterization (Univ. Maribor, Slovenia) :
• Triploids and diploids did not show much variation in starch contents. • Diploid taros are rich in Mg, K, P & Ca. • Triploid taros are rich in Cu, Mn, Zn & Fe micronutrients. • K values were also higher (1.44 to 3.24%) in Indian accessions.
V. Participatory evaluation for yield and other quality attributes:
• On-Farm participatory trials laid out with the selected 37 exotic accessions along with 3 indigenous cultivars in 12 villages involving 32 farmers in Odisha, India.
• Based on edibility, disease resistance, good tuber yield (0.2-1kg/plant) during participatory evaluation, 35 potential lines were identified (Table 2). Trials were laid out with selected 28 lines in 5 villages involving 14 farmers for participatory breeding activities.
Table 2. Performance and selection of exotic INEA lines in India
Group Country No. of lines
received
Performance Selection Yield Edibility Reaction to
TLB
1. Hawaii 3 500g & > 500g /plant
Corms and leaves
2 tolerant 1 less
tolerant (BL/HW/08)
3 lines BL/HW/08, 26 & 37
2. Indonesia 9 200g & < 200g/plant
7(Corms and leaves)
All tolerant 7 lines CE/IND/06,07,10, 20,
24,31 & BL/IND/14 3. Malaysia 3 200-400g/plant Corms and
leaves tolerant
and resistant
3lines CE/MAL/06,12 & 14
CE/MAL/06 (TLB symptoms in 2013)
4. Papua New
Guinea
5 100- 400 g/ plant
Corms and leaves
4 lines tolerant
4 lines BL/PNG/9,11,12 & 13
5. Samoa 18 7 lines Good
yield 400g-1kg/plant
All edible except BL/SM/
149
All 18 lines tolerant
17 lines BL/SM/43,80,111,114,
115,116,120,128,132,134,135,143,147,151, 152,157 & 158
6. Thailand 7 300-600g/plant All lines edible, 3with edible tubers
4 tolerant 6 lines CE/THA/05, 07, 09, 10, 12 &
24. 7. Japan 5 200-400g/plant Tubers and
leaves (4) Tolerant (4) 4 lines
CA/JP/01,02,06 & 08
INEA lines for participatory trials (35lines):
(1) BL/HW/08, 26, 37 (3 lines), (2) CE/IND/ 06, 07, 10, 20, 24 & BL/IND/14 (6 lines) (3) CE/MAL/ 06, 12, 14 (3 lines), (4). BL/PNG/ 09, 11, 12 (3 lines) (5) BL/SM/43, 80, 111, 115, 116, 120, 128, 134, 151, 152, 158 (11 lines)

65
(6) CE/THA/ 05, 07, 09, 10, 12, 24 (6 lines), (7). CA/ JP/ 02, 04, 06 (3 lines) VI. Participatory breeding for allelic diversity:
Hybridization was done among exotics, between exotics and indigenous.
Developed hybrid taro seeds.
Seeds germinated in vivo, in vitro & transplanted in field.
Seedlings of 25 different combinations are under evaluation.
VII. Planned hybridization By maintaining perennial plot to synchronize flowering.
Cryostorage of pollen.
Hybrid seeds of desirable lines developed both by maintenance of perennial plants and also using cryostored pollen.
The fruiting, seed characteristics of cryostored hybridized pollen observed to be on par with conventionally bred fruits, seeds.
Table 3: Seeds extracted from cryostored pollen- hybridized fruits of different combinations
Sl. No.
Accession Name Shape of the seeds
Colour of the seeds
Paternal/ Maternal
dominance Female Male
1. BL/SM/158 CE/MAL/06 Elliptic with Bottle neck
notch
Mix of yellowish and brown
Intermediate
2. CE/THA/10 CE/MAL/06 Elliptic Brown Paternal
3. CE/IND/10 CE/MAL/06 Conical Light brown Maternal
4. CE/MAL/06 BL/SM/158 Elliptic Mix of brown and light brown
Intermediate

66
Photos : Successful hybridization with cryopreserved pollen: 10 days after pollination (a), 20 days after pollination (b), 1 month mature fruit (c) Overall outcomes :
• Potential of taro as source of food-nutrition and livelihood in fragile areas. • Farmers-participatory breeding ensured allelic diversity in taro to combat the consequences
of climatic and commercial changes. • Potential of commercial visibility widened across the globe. • Wide diversity of indigenous taro through DNA analysis of CIRAD. • Taros are enriched with zinc, iron & calcium as found from elemental analysis (Univ. Maribor,
Slovenia). • Accessibility of high valued true seeds of biofortified climate adaptive taro across the globe. • Opportunities to continue collaboration with International and National agricultural
organizations involving 22 countries to help taro growers globally. • Revalidation of neglected ‘Taro’ as socio culturally, eco-friendly high value crop.
New information gained:
• Wide diversity in Indian taro through DNA fingerprinting and high valued micro nutrients in triploid taro through elemental analysis are ‘boon’ to taro growers to address burning issues of food, nutrition & livelihood security.
• Hybrid taros could be generated through planned hybridization using cryo tools (India) • Identification of “petiole colour- key characters” to group genetic resources of taro across
the Globe (India).

67
2.11. The Philippines, PhilRootcrops (Dilberto Ferraren) Genetic variability and heritability of selected genotypes as possible parental lines for improvement Introduction In 2012 to 2013, the INEA project at PhilRootcrops, devoted most of its effort in the mass propagation or multiplication of the 50 genotypes received from SPC, Suva, Fiji. This was coupled by the initial distribution of planting materials to farmers for adoption and selection of preferred genotypes by farmers in barangays (barrios) of Guadalupe, Badiang and Hanginan in Maasin City and in the barangays of Rawis, Cabarasan, Alegre in Dulag, Leyte. In barangay Badiang, Maasin, farmers were very interested in evaluating the materials as part of the farmed area could be intruded by seawater, and thus their rice crops often suffer from effects of seawater salinity. A local genotype, taken from PhilRootcrops in the 1980’s had been grown in the area and was found to tolerate seawater intrusion. Thus, there was a need to further introduce new genotypes for this area. In 2014, an arrangement was made with one of the farmers to evaluate the INEA genotypes and some national collections. But with the release of several genotypes of the green super rice for evaluation in 2015, the farmer pulled out of the agreement and thus the evaluation for salinity tolerance is postponed indefinitely. Follow up activities on the distribution of planting materials was done in 2014 and 2015. However, most of the farmers who had planted the genotypes had selected only one or two, but they failed to identify the genotypes they had kept. They had shared planting materials to other farmers who were not recipients of the first distribution. However, the names of the genotypes had changed so a “tracer study” may have to be conducted. Usually, the source farmer gets the honor of local nomenclature. The distribution of taro in Dulag, Leyte was intentional. First, Dulag is known to be a source of taro for commercial purposes. Second, taro cultivation is practiced either in the upland or in lowland conditions. The original distribution of INEA taro genotypes was done months before typhoon Haiyan. Only few of the original recipient farmers were able to propagate the different genotypes. After typhoon Haiyan, the distributed genotypes could no longer be identified; some farmers claimed to have cooked the corms of the distributed taro. They reported that both corm and vegetative parts were palatable. However, one farmer was able to rescue some materials but could no longer identify the names, and yet still propagated the materials. Distribution of planting materials among farmers was also practiced.
Although Dulag is a prime source of commercial taro, in 2015 survey, it was found that not one of the INEA genotypes had reached the market yet. One important reason is that traders of taro look for the usual varieties such as Kahislot, VG-1 and VG -2. Secondly, usual consumers of taro in the area and neighboring towns look for the locally known varieties, as some introduced varieties could confer acrid after-taste. There is a need to demonstrate to them the palatability and commercial viability of these genotypes. The distribution done in Giporlos, Eastern Samar needs further follow up and assessment. Giporlos, Eastern Samar was also along the path of typhoon Haiyan. The distribution of planting materials was done three months after the typhoon at the request of the local municipal government unit. However, at that time the farmers were busy restoring their houses and were also involved in cooperative works in the relief programs. Thus the two of the three nurseries that were set-up failed. Only a few farmers who were recipients of planting materials were able to grow them. A “tracer study” will be interesting here as the successful nursery in barangay Coticot became a source of planting materials. Re- distribution of propagules will be done upon termination of the relief and restoration efforts and farmers could then focus on their farm work.

68
For this specific report, only two trials that have been set-up will be reported; the main goal of the evaluation was to verify the performance of selected genotypes based on the result of an earlier trial. These two trials are part of a series of trial to assess the adaptability and stability of the genotypes in different areas of cultivation/production. These two trials were done in upland conditions, and were repeated in 2015-2016, and an ongoing trial was set up under lowland condition. The saline tolerance evaluation was not pursued, as the farmer tenanted the field affected by sea water intrusion pulled out from the agreement. After the limited replicated trials in Cebu and Leyte, a national cooperative testing (NCT) trials will be set up in Benguet Province, Northern Luzon; Albay – Bicol Region, Bohol Province – Central Visayas and in Bukidnon Province, Northern Mindanao Region. Results of these NCT trials will be used to finally recommend a “superior” genotype(s) as new variety and registered in the National Seed Industry Council List of Varieties. Taro farmers can use this registration as proof for an agricultural credit from recognized banks. Specific Objectives of the Current Two Location Trials:
1. Assess the adaptability of taro in Asturias, Cebu and compare the performance with those grown in Baybay, Leyte
2. Determine the stability of genotypes grown in both upland and lowland conditions 3. Demonstrate to farmers in Asturias, Cebu the feasibility of taro production in semi-
commercial scale 4. Assess the similarity of genetic parameters derived from the selected genotypes
Materials and Methods Site Description – Asturias, Cebu: Asturias-Cebu was selected as an evaluation, demonstration and a distribution site for taro as it is not known for taro production. Although some taro corms are traded in the local market, farmers were not able to expand their crops due to the unavailability of planting materials and proper training in taro crop production. (Although this is also true to cultivation of other rootcrops such as sweetpotato, cassava, yams, Xanthosoma and Alocasia.)
A farmer’s field was selected by the Agricultural Technician of the Municipal Agriculture Office of Asturias, Cebu. The farm is located in Brgy. Magcalape, about 20 km from the provincial highway and the site is found in the interior part of town. It was selected as the farmer-tenant was willing to spare the area for nursery, evaluation and demonstration of taro cropping. The mode of transport in this area is a motorbike, which is also true in all cases where taro (other rootcrops) is grown. The selected area was previously grown to corn and sweetpotato and is historically an area planted to upland rice. However, the farmer-tenant complained about the low productivity due to inaccessibility of farm inputs. Some taro wildlings were found around the periphery, but the farmer claimed that he planted them before. The area is clayey with a soil pH of 5 (highly acidic) with 2.20 % organic carbon content and 0.257 % total N. Available P was 0.793 mg/kg and exchangeable K and Mg of 305.25 mg/kg and 684.00 mg/kg, respectively. Other extractable ions were Fe, Cu, Zn and Mn at 163.90, 950, 8.32 and 93.65 mg/kg, respectively. Land preparation was first done using a tractor; however, the second plowing was done using a carabao-drawn implement. Final harrowing was done by the same carabao-drawn implement. The area was plowed twice at two weeks interval to kill the weeds. Organic fertilizer was applied at second plowing time at the rate of 20 tons/ha of poultry litter from the neighboring poultry farm. The area was divided into three blocks of 14 plots; each plot measured 4 m x 4 m. with four rows, 1 m apart and 8 hills of 0.4 m spacing. Planting was done by hand, after digging holes, a

69
single headsett was planted. Ammonium phosphate was further added at the rate of 58 kg/ha or 0.g kg/plot, two weeks after planting. The trial was laid out in RCBD with three replicates. Planting was done in October 30 – 31, 2014, and harvesting was done on May7-10, 2015 (i.e. 7 MAP). The crop was harvested earlier than 8 months or even earlier than the local harvesting time, which could reach up to 10 – 12 months depending on the standing of the crop. The early harvest was triggered by the early signs of senescence due to the prolonged dry spell that occurred from early February 2015 to May 2015. (Climatic data has not been gathered yet, but shall be incorporated later in the final report.) Site Description – Baybay, Leyte: An upland area in the experimental station in Brgy. Pangasugan, Baybay, Leyte was selected. The area was prepared after a one-year fallow, though this was previously planted to taro. Soil chemical analysis showed that the soil is moderately acidic with soil pH of 6.2, also having an organic carbon content of 1.014% and a total N of 0.142%. The other nutrient elements were P (31.51 mg/kg), K (332.945 mg/kg), Mg (480.8 mg/kg), Ca (2464.75 mg/kg) and Na (57.35 mg/kg).
To compensate for the law organic carbon commercial organic fertilizer was applied at the rate of 12 tons/ha and a rate of 60-60- 45 kg/ha of N – P2O5 – K2O. The organic fertilizer was applied prior to the second plowing so as to ensure it became incorporated into the soil. Land preparation was done using a tractor. Two plowing and two harrowing were done. The area was divided into three blocks (as replication) and further divided into plots measuring 4 m x 4 m. Each plot had 32 hills, with 4 m spacing between rows and 8 hills spaced at 0.4 m. The headsetts were then planted in a hole of 15 cm deep located on the furrow. Harvest was done at 9 MAP.
Computed values include the leaf area index (LAI), harvest index dry weight basis (HI), vegetative growth index (VGI), predicted VGI was computed for crops in both sites, but the observed VGI was computed only in the Pangasugan, Baybay cropping since the number of leaves was recorded in the Pangasugan, Baybay-Leyte trial. The computation of the VGI was done using the formula reported by Soulard et al. (2016).
Estimates of the genotypic and phenotypic variances adapted the formula of Burton and Devane (1953), broad sense heritability was the ratio of the genotypic variance and phenotypic variance as described by Allard (1960). Gentoypic and phenotypic correlation coefficients were estimated using the concept of Kwon and Torrie (1964).
Analysis of variance (ANOVA) was carried out using the freeware program Statistical Tool for Agricultural Research (STAR) version 2.0.1 of IRRI; the result of the ANOVA was used to compute for the estimates of genetic parameters such as genotypic and phenotypic variances, genotypic coefficient of variation, phenotypic coefficient of variation and broad-sense heritability (H2). Then Plant Breeding Tools (PBTools) version 1.4 was used for further phenotypic analysis such as broad sense heritability for each location trial and for the broad sense heritability from the combined location data. Genotypic and phenotypic correlation coefficients were also generated for some traits
Results and Discussion Results from the Magcalape, Asturias, Cebu Trial The trial in barangay Magcalape, Asturias, Cebu was requested by local government. Taro in the area is grown with only two known locally traded cultivars (Humanaco and Hinungot). The distribution of the INEA genotypes led to the establishment of a nursery which also was the evaluation/demonstration trial. However, the trial was research managed as local government has not allocated any funds yet for the nursery.

70
The growth at the first three months appeared normal, but with the low amount of rain in the succeeding months there was a reduction on the growth observed. Plant height measured at 6 and 7 months after planting (MAP), showed stunting (Table 1). The growth increment was already receding in some entries, as well as a change in the leaf area index. The predicted VGI was computed; the observed VGI was not computed in this case as, the number of leaves was not recorded. With the interest in the propagules (suckers and stolons) produced by the plants in the area, sucker formation was notably high in some INEA genotypes. In some cases, sucker formation still occurred at 7 MAP. Stolon formation occurred late, though some genotypes had started to form stolons already at 6 MAP. Table 1. Means for plant height, leaf area index (LAI), predicted vegetative growth index (VGI),
number of suckers and stolon observed at 6 to7 months after planting ( MAP) of selected taro evaluated under upland condition in Magcalape, Asturias, Cebu from Nov 2014 to May 2015.
Yield obtained from this trial was low compared to the previous replicated evaluation trials done in February to October 2014 in the research station. With the long dry spell some tubers had deteriorated already, and thus the five samples of tubers where taken from among those without decay. Although, the crop did not perform well in terms of expectation, the result conveys that some genotypes may tolerate prolong dry spell, but with reduction in yield. The potential of each genotype was investigated by taking the average of five sample tubers that had no decay, it could be noted that yield could reach as high as 6 to 8 tons/ha for BLSM 128 and BLSM 115, BLSM 143 and VG 1 and VG 2. Nevertheless, both BLSM 128 and BLSM 115 had lower dry matter content (%) than BLSM 143, BLSM 149, BLSM 151, VG 2 (local check) and NSIC G9. This suggests that for the Cebu environment these five genotypes could be considered for further evaluation. The harvest index likewise suggests that at the time the harvesting was done, most of the leaves could have senesced.
Genotypes Plant height (cm)
6 MAP
Plant height (cm)
7 MAP
LAI 6
MAP
LAI 7
MAP
VGI Predicted
6 MAP
VGI Predicted
7 MAP
No suckers 6 MAP
No Suckers 7 MAP
No Stolons 6 MAP
No Stolons 7 MAP
BLPNG 13 35.83 39.72 0.49 0.37 309.2 507.44 0.8 1.87 0 0 BLSM 115 57.48 57.98 0.70 0.62 1723.82 1962.16 3.20 4.20 0.2 0.47 BLSM 128 59.87 60.41 0.73 0.65 1936.29 2059.54 2.33 3.35 0.33 0.87 BLSM 132 48.41 49.08 0.88 0.70 1167.52 892.01 3.33 3.33 0 0 BLSM 143 51.47 55.88 0.86 0.64 1177.49 1505.28 4.53 5.57 0 0 BSLM 149 48.15 47.03 0.55 0.46 790.36 973.00 3.07 3.38 0 0.13 BLSM 151 38.09 46.24 0.97 0.73 483.41 819.12 0.07 1.00 0 0.20 BLSM 43 47.44 51.43 0.61 0.56 963.34 1396.93 0.67 1.96 0.60 0.07 BLSM 80 52.41 52.68 0.45 0.48 979.10 1006.89 1.73 3.18 0.07 0 Kahislot 35.91 40.02 0.63 0.51 468.18 675.70 0.00 0.67 0.07 0.27 NSIC G10 49.49 53.87 0.81 0.62 866.44 1268.11 0.13 0.13 0 0 NSIC G9 60.46 59.27 0.71 0.56 1470.10 1639.98 0.07 0.07 0 0.13 VG 1 51.53 49.11 0.83 0.77 1301.20 1339.46 0.07 0.07 0.13 0 VG 2 59.11 59.76 0.60 0.53 1195.42 1436.54 0.13 0.13 0 0.20 C.V.(%) 18.05 15.99 15.12 17.83 54.09 52.25 96.40 54.50 302.98 209.68 Tukey’s hsd (5%)
26.98 ns 0.32 0.31 ns ns 4.17 3.26 ns ns

71
Table 2. Means for yield and yield related parameters from taro evaluated in Magcalape, Asturias,
Cebu from October 2014 to May 2015 Results from the Pangasugan, Baybay, Leyte Trial Six months after planting seems to be the peak of growth of the different genotypes, and that at 7 MAP, the crop started to decrease growth (Table 3). Similarly, the LAI was larger than at 7 MAP. Implying that the leaf dimension had already reduced, which could be the beginning of plant senescence. The VGI observed at 6 MAP was larger than the VG predicted at 6 MAP. But when the VGI predicted was computed using the leaf measurement at 7 MAP, the values were larger than the computed observed VGI. The predicted VGI at 7 MAP was even larger than the predicted VGI at 6 MAP. This could probably be due to the sole leaf length measurement rather using the actual width of the lamina. The LAI at either 6 MAP or 7 MAP had similar trend with the values of the observed VGI. Sucker formation of genotypes was more pronounced in the Pangasugan, Baybay Leyte trial. The most suckering types are BLSM 115, BLPNG 13, BLSM 128, BLSM 149 BLSM 151, and CEMAL 14. These genotypes could be further evaluated for leaf and stalk production which is for vegetable use and processing. Genotypes with high yield potential and higher though not significantly different from the current national check variety (i.e., NSIC G10) are BLSM 132, BLSM 151 and BLSM 80. Basing on the average weight of five sample tubers, BLSM 115, BLSM 128, BLSM 132, BLSM 143 and BLSM 151 could surpass NSIC G10. These genotypes possess capacity for high corm dry matter content. All genotypes had at least 30% DMC, although NSIC G9 registered a corm DMC (%) of 42.65 followed by BLSM 151 (% DMC is 40.65). The genotypes did not differ in terms in harvest index; the range of HI was from 0.53 to 0.83.
Genotypes Corm Yield (tons/ha)
Average weight of individual
corm (g)
Corm Dry Matter Content (%)
Harvest Index (dry weight
basis)
BLPNG 13 1.77 71.11 24.88 0.74 BLSM 115 3.54 327.78 28.85 0.65 BLSM 128 3.43 256.11 29.90 0.71 BLSM 132 2.41 193.33 33.51 0.76 BLSM 143 2.70 200.00 53.08 0.75 BSLM 149 1.82 128.89 35.13 0.65 BLSM 151 2.43 146.11 36.93 0.79 BLSM 43 2.15 165.56 23.11 0.69 BLSM 80 2.63 277.78 29.49 0.85 Kahislot 1.69 136.11 27.94 0.76 NSIC G10 1.78 145.00 27.50 0.72 NSIC G9 1.84 161.67 34.93 0.76 VG 1 2.29 157.78 33.09 0.67 VG 2 3.41 287.78 36.25 0.61 C.V.(%) 31.40 20.90 22.63 12.03 Tukey’s hsd (5%) ns 119.24 22.09 ns

72
Table 3. Means for plant height, leaf area index (LAI), predicted vegetative growth index (VGI) number of suckers and stolon observed at 6 to 7 months after planting ( MAP) of selected taro genotypes evaluated under upland condition in Pangasugan, Baybay, Leyte from Nov 2014 to Aug 2015
Table 4. Means for yield and yield related parameters from taro evaluated in Pangasugan, Baybay, Leyte from November 2014 to August 2015
Genotypes Plant height (cm)
6 MAP
Plant height (cm)
7 MAP
LAI 6 MAP
LAI 7 MAP
VGI 0bserved
6 MAP
VGI Predicted
6 MAP
VGI Observed
7 MAP
VGI Predicted
7 MAP
Number of
suckers 7 MAP
Number of
Stolons 7 MAP
BLPNG 13 74.30 61.67 0.49 0.37 2219.18 1820.12 1504.98 2036.27 8.20 0 BLSM 115 92.73 95.70 0.70 0.62 4376.37 3040.92 3283.76 4285.87 9.47 0 BLSM 128 102.17 88.73 0.73 0.65 4997.88 3633.85 4604.82 5223.46 9.93 0 BLSM 132 114.80 106.07 0.88 0.70 6967.40 4893.16 5126.98 6202.17 6.00 0 BLSM 143 92.20 79.73 0.86 0.64 4191.11 4019.49 3349.68 4394.88 6.93 0 BSLM 149 81.30 76.20 0.55 0.46 3685.17 2114.16 2604.70 2686.15 10.73 0 BLSM 151 112.53 96.37 0.97 0.73 8672.07 5371.81 4689.85 5896.97 9.40 0 BLSM 80 89.63 86.07 0.61 0.56 4541.99 2779.03 3771.57 4003.15 5.53 0 CEMAL 14 75.93 71.33 0.45 0.48 2616.39 1719.67 2225.68 2932.94 9.27 0 Kahislot 77.13 72.10 0.63 0.51 3722.07 3465.64 3033.88 2827.29 6.53 0.60 NSIC G10 96.30 84.17 0.81 0.62 5698.55 4028.35 3879.99 4231.72 4.73 0.07 NSIC G9 96.87 98.30 0.71 0.56 4198.24 3414.12 35.79.78 4064.69 3.87 0 VG 1 89.93 78.00 0.83 0.77 4134.60 3866.18 3827.59 5003.82 2.73 0.13 VG 2 82.37 77.07 0.60 0.53 3201.50 2635.79 2620.58 3153.99 3.27 0.20 C.V.(%) 12.18 15.17 15.12 17.83 26.51 23.83 26.51 29.74 20.09 259.51 Tukey’s hsd (5%)
33.45 38.19 0.32 0.31 3602.29 2345.26 3323.69 3639.59 4.17 0.56
Genotypes Corm Yield (tons/ha)
Average weight of individual corm (g)
Corm Dry Matter
Content (%)
Harvest Index (dry weight basis)
BLPNG 13 1.01 53.33 31.98 0.54 BLSM 115 5.12 333.33 37.30 0.67 BLSM 128 4.29 386.7 35.48 0.64 BLSM 132 9.40 366.7 37.45 0.68 BLSM 143 4.55 306.7 34.57 0.58 BSLM 149 4.02 233.33 37.77 0.75 BLSM 151 7.44 426.7 40.65 0.75 BLSM 80 7.89 400.00 30.35 0.59 CEMAL 14 2.56 133.33 35.07 0.83 Kahislot 4.11 260.00 38.87 0.77 NSIC G10 7.02 273.33 33.10 0.61 NSIC G9 4.64 213.33 42.65 0.58 VG 1 5.74 240.00 35.07 0.75 VG 2 3.96 233.3 39.50 0.53 C.V.(%) 28.46 37.52 11.13 21.49 Tukey’s hsd (5%) 4.39 311.20 12.20 ns
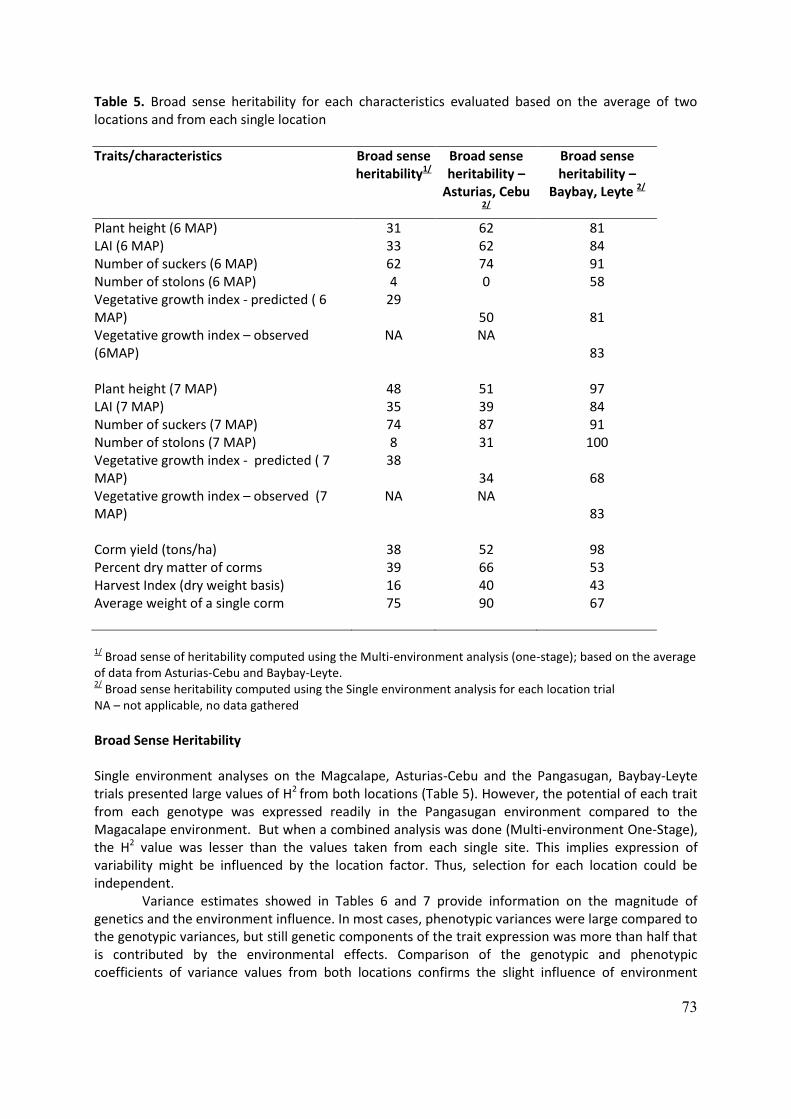
73
Table 5. Broad sense heritability for each characteristics evaluated based on the average of two locations and from each single location
Traits/characteristics Broad sense heritability1/
Broad sense heritability –
Asturias, Cebu 2/
Broad sense heritability –
Baybay, Leyte 2/
Plant height (6 MAP) 31 62 81 LAI (6 MAP) 33 62 84 Number of suckers (6 MAP) 62 74 91 Number of stolons (6 MAP) 4 0 58 Vegetative growth index - predicted ( 6 MAP)
29 50 81
Vegetative growth index – observed (6MAP)
NA NA 83
Plant height (7 MAP) 48 51 97 LAI (7 MAP) 35 39 84 Number of suckers (7 MAP) 74 87 91 Number of stolons (7 MAP) 8 31 100 Vegetative growth index - predicted ( 7 MAP)
38 34 68
Vegetative growth index – observed (7 MAP)
NA NA 83
Corm yield (tons/ha) 38 52 98 Percent dry matter of corms 39 66 53 Harvest Index (dry weight basis) 16 40 43 Average weight of a single corm 75 90 67
1/
Broad sense of heritability computed using the Multi-environment analysis (one-stage); based on the average of data from Asturias-Cebu and Baybay-Leyte. 2/
Broad sense heritability computed using the Single environment analysis for each location trial NA – not applicable, no data gathered
Broad Sense Heritability Single environment analyses on the Magcalape, Asturias-Cebu and the Pangasugan, Baybay-Leyte trials presented large values of H2 from both locations (Table 5). However, the potential of each trait from each genotype was expressed readily in the Pangasugan environment compared to the Magacalape environment. But when a combined analysis was done (Multi-environment One-Stage), the H2 value was lesser than the values taken from each single site. This implies expression of variability might be influenced by the location factor. Thus, selection for each location could be independent. Variance estimates showed in Tables 6 and 7 provide information on the magnitude of genetics and the environment influence. In most cases, phenotypic variances were large compared to the genotypic variances, but still genetic components of the trait expression was more than half that is contributed by the environmental effects. Comparison of the genotypic and phenotypic coefficients of variance values from both locations confirms the slight influence of environment

74
factors. The number of stolons produced was not consistent, with no genetic variance detected at 6 MAP form plants grown in Asturias, Cebu; while in Beyaby-Leyte, stolon were detected to be affected by genetic factors. Table 6. Estimates of genetic parameters of some measured plant attributes from 14 taro genotypes evaluated in Magcalape, Astruias-Cebu from October 2014 to May 2015
Traits/characteristics Mean Square
Estimate of Error
Variance
Genotypic Variance
Phenotypic Variance
Genotypic coefficient
of Variance
(%)
Phenotypic Coefficient of Variance
(%)
Plant height (6 MAP) 209.63 80.43 43.07 69.88 13.21 16.82 LAI (6 MAP) 0.03 0.01 0.01 0.01 25.81 32.67 Number of suckers (6 MAP) 7.37 1.92 1.82 2.46 93.58 108.84 Number of stolons (6 MAP) 0.09 0.09 0.00 0.03 0.00 174.93 Vegetative growth index - predicted ( 6 MAP) 657940 328423 109839 219313 31.28 44.20 Plant height (7 MAP) 139.81 68.06 23.92 46.60 9.48 13.23 LAI (7 MAP) 0.03 0.02 0.00 0.01 16.36 26.14 Number of suckers (7 MAP) 9.32 1.17 2.71 3.11 82.79 88.55 Number of stolons (7 MAP) 0.18 0.12 0.02 0.06 81.81 146.08 Vegetative growth index - predicted ( 7 MAP) 640459 425715 71581 213486 21.43 37.00 Corm yield (tons/ha) 1.27 0.61 0.22 0.42 19.33 26.88 Percent dry matter of corms 160.40 53.93 35.49 53.47 18.36 22.53 Harvest Index (dry weight basis) 0.01 0.01 0.00 0.00 5.65 8.94 Average weight of a single corm 15667 1572 4699 5222 36.15 38.11
Genotypic and Phenotypic Correlation Coefficients Corm yield (tons/ha) had high genotypic correlation coefficient with average weight of tubers, and the vegetative growth index and its related attributes such as LAI and plant height. This was noted from both locations (cf Tables 8 and 9). The phenotypic correlation coefficients between yield and VGI were slightly lesser than genotypic correlation coefficients, suggesting a strong genetic component and that VGI could be used to select genotypes with high yield potential. Harvest index had low correlation coefficients with yield. This probably could be due to the way HI values were obtained. HI is based on sample plants gathered at time of harvest, when the vegetative parts had senesced non-uniformly. Though difference in values was noted from the observed and predicted VGI, from the Pangasugan trial, it could be noted that there is a strong correlation, either based on the genetic or phenotypic evaluation. However, observed VGI values had higher genotypic and phenotypic correlation coefficients with yield of corm than with the predicted VGI values (Table 9). This imply that a good estimate for VGI estimates would require the collection of data such leaf dimensions, number of leaves , suckers and stolons. The formula for the VGI predicted imposes a lamina leaf-width ratio of 1.4, which is not necessarily absolute to all genotypes (data not shown). However, the length-width ratio is not consistently correlated to yield or other yield related parameters. The VGI

75
values had similar trend as the LAI index, which could change depending on the population density, while VGI shows the individual plant structure. Table 7. Estimates of genetic parameters of some measured plant attributes frome 14 taro genotypes evaluated in Pangasugan, Baybay – Leyte, from November 2014 to August 2015
Traits/characteristics Mean Square
Estimate of Error
Variance
Genotypic Variance
Phenotypic Variance
Genotypic coefficient of Variance
(%)
Phenotypic Coefficient of Variance
(%)
Plant height (6 MAP) 384.98 71.95 104.34 128.33 11.49 12.74 LAI (6 MAP) 0.07 0.01 0.02 0.02 20.28 22.08 Number of suckers (6 MAP) 21.07 1.92 6.38 7.02 36.61 38.41 Number of stolons (6 MAP) 0.08 0.03 0.02 0.03 174.56 230.14 VGI - pred ( 6 MAP) 6748843 1274322 1824841 2249614 28.79 31.96 VGI – obs (6MAP) 8588650 1433630 2385007 2862883 34.20 37.47 Plant height (7 MAP) 482.38 12.61 156.59 160.79 13.71 13.89 LAI (7 MAP) 0.07 0.01 0.02 0.02 20.28 22.08 Number of suckers (7 MAP) 21.07 1.92 6.38 7.02 36.61 38.41 Number of stolons (7 MAP) 0.21 0.00 0.07 0.07 267.27 267.27 VGI - pred( 7 MAP) 4614399 1463444 1050318 1538133 25.20 30.49 VGI – obs (7 MAP) 8588650 1433630 2385007 2862883 34.20 37.47 Corm yield (tons/ha) 114.70 2.13 37.52 38.23 119.41 120.53 Percent dry matter of corms 34.93 16.44 6.16 11.64 6.82 9.37 Harvest Index (dry weight basis) 0.00 0.00 0.00 0.00 1.77 2.70 Average weight of a single corm 32730 10700 7344 10910 31.08 37.88
Table 8. Genotypic and phenotypic correlation values for some measured traits; Asturias- Cebu evaluation@
Traits Corm PCDM WtTb HIDB PLH6 PLH7 LAI6 LAI7 LWR6 LWR7 VGIP6 VGIP7 VGIO6 VGIO7 SKR6 SKR7
Yield 0.04 1.00 -0.01 0.73 0.80 0.71 0.68 -1.0 -0.09 0.74 0.77 NA NA 0.30 0.35 PCDM 0.11 0.02 0.14 0.02 0.20 -0.14 -0.26 1.0 0.64 -0.04 -0.10 NA NA 0.48 0.34 WtTu 0.99 0.12 -0.10 0.77 0.86 0.76 0.80 -1.0 -0.05 0.82 0.88 NA NA 0.33 0.34 HIDB -0.10 0.09 -0.07 -0.4 -0.27 -0.84 -1.0 1.0 0.26 -0.85 -1.00 NA NA 0.07 0.22 PLHT6 0.71 0.21 0.71 -0.29 1.00 0.83 0.78 1.0 0.00 0.95 0.91 NA NA 0.09 0.00 PLHT7 0.72 0.28 0.73 -0.17 0.94 0.71 0.66 -1.0 0.09 0.91 0.88 NA NA 0.13 0.04 LAI6 0.69 0.06 0.71 -0.46 0.86 0.79 1.00 1.0 -0.00 1.00 1.00 NA NA 0.17 0.11 LAI7 0.61 0.06 0.64 -0.47 0.82 0.81 0.95 -1.0 0.10 0.89 0.94 NA NA -0.02 0.01 LWR6 -0.14 -0.02 -0.11 0.27 -0.11 -0.15 -0.05 -0.24 1.00 1.00 -1.00 NA NA 1.00 1.00 LWR7 -0.15 0.38 -0.10 0.26 -0.10 -0.05 -0.07 -0.05 0.45 0.20 0.33 NA NA 0.84 0.18 VGIP6 0.69 0.15 0.71 -0.39 0.90 0.85 0.98 0.88 0.05 0.06 1.00 NA NA 0.12 0.69 VGIP7 0.64 015 0.66 -0.40 0.86 0.90 0.92 0.97 -0.16 0.06 0.92 NA NA NA 0.18 VGIO6 NA NA NA NA NA NA NA NA NA NA NA NA NA NA 0.12 VGIO7 NA NA NA NA NA NA NA NA NA NA NA NA NA 1.00 NA SKR6 0.34 0.38 0.35 -0.0 0.15 0.19 0.21 0.16 0.32 0.53 0.27 0.26 NA NA NA SKR7 0.39 0.47 0.38 0.08 0.24 0.23 0.27 0.17 0.54 0.51 0.36 0.26 NA NA 0.92 @
Values in bold above the diagonal are genotypic correlation coefficient, while italicized values below the diagonal are phenotypic correlation coefficients NA – not applicable, no data gathered Legend: Yield – yield of corm (tons/ha) PCDM – Percent dry matter of corm
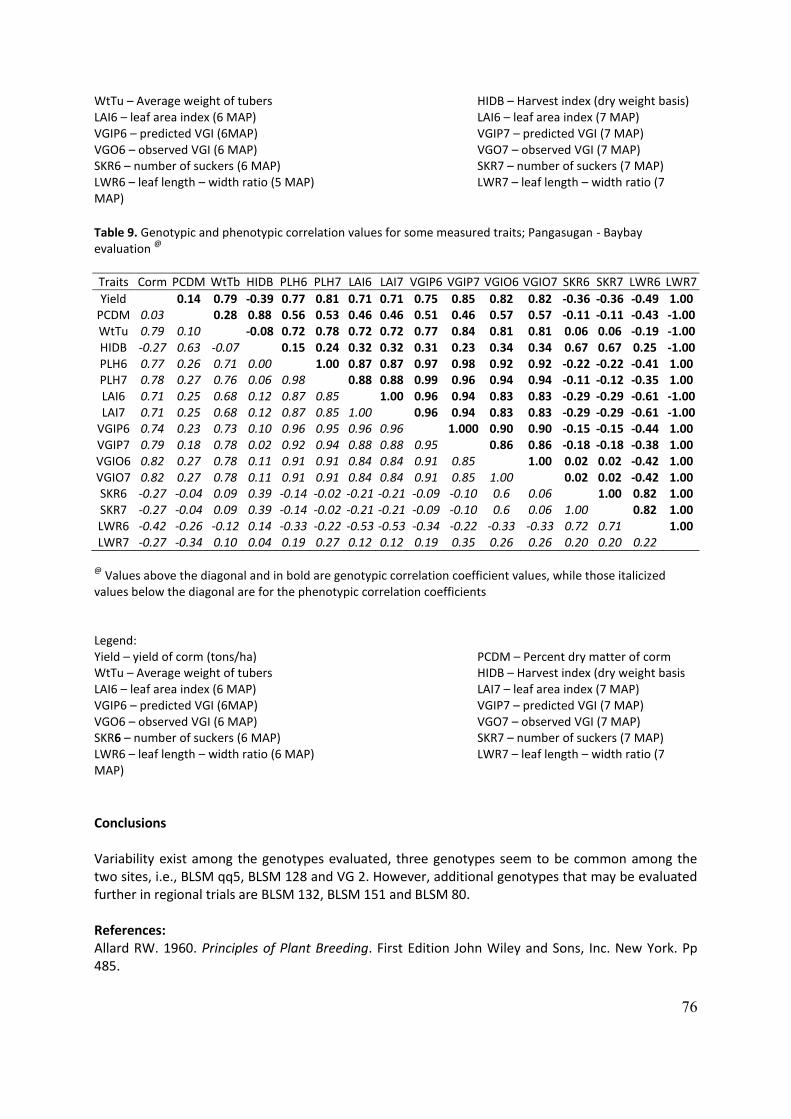
76
WtTu – Average weight of tubers HIDB – Harvest index (dry weight basis) LAI6 – leaf area index (6 MAP) LAI6 – leaf area index (7 MAP) VGIP6 – predicted VGI (6MAP) VGIP7 – predicted VGI (7 MAP) VGO6 – observed VGI (6 MAP) VGO7 – observed VGI (7 MAP) SKR6 – number of suckers (6 MAP) SKR7 – number of suckers (7 MAP) LWR6 – leaf length – width ratio (5 MAP) LWR7 – leaf length – width ratio (7 MAP)
Table 9. Genotypic and phenotypic correlation values for some measured traits; Pangasugan - Baybay evaluation
@
Traits Corm PCDM WtTb HIDB PLH6 PLH7 LAI6 LAI7 VGIP6 VGIP7 VGIO6 VGIO7 SKR6 SKR7 LWR6 LWR7
Yield 0.14 0.79 -0.39 0.77 0.81 0.71 0.71 0.75 0.85 0.82 0.82 -0.36 -0.36 -0.49 1.00 PCDM 0.03 0.28 0.88 0.56 0.53 0.46 0.46 0.51 0.46 0.57 0.57 -0.11 -0.11 -0.43 -1.00 WtTu 0.79 0.10 -0.08 0.72 0.78 0.72 0.72 0.77 0.84 0.81 0.81 0.06 0.06 -0.19 -1.00 HIDB -0.27 0.63 -0.07 0.15 0.24 0.32 0.32 0.31 0.23 0.34 0.34 0.67 0.67 0.25 -1.00 PLH6 0.77 0.26 0.71 0.00 1.00 0.87 0.87 0.97 0.98 0.92 0.92 -0.22 -0.22 -0.41 1.00 PLH7 0.78 0.27 0.76 0.06 0.98 0.88 0.88 0.99 0.96 0.94 0.94 -0.11 -0.12 -0.35 1.00 LAI6 0.71 0.25 0.68 0.12 0.87 0.85 1.00 0.96 0.94 0.83 0.83 -0.29 -0.29 -0.61 -1.00 LAI7 0.71 0.25 0.68 0.12 0.87 0.85 1.00 0.96 0.94 0.83 0.83 -0.29 -0.29 -0.61 -1.00
VGIP6 0.74 0.23 0.73 0.10 0.96 0.95 0.96 0.96 1.000 0.90 0.90 -0.15 -0.15 -0.44 1.00 VGIP7 0.79 0.18 0.78 0.02 0.92 0.94 0.88 0.88 0.95 0.86 0.86 -0.18 -0.18 -0.38 1.00 VGIO6 0.82 0.27 0.78 0.11 0.91 0.91 0.84 0.84 0.91 0.85 1.00 0.02 0.02 -0.42 1.00 VGIO7 0.82 0.27 0.78 0.11 0.91 0.91 0.84 0.84 0.91 0.85 1.00 0.02 0.02 -0.42 1.00 SKR6 -0.27 -0.04 0.09 0.39 -0.14 -0.02 -0.21 -0.21 -0.09 -0.10 0.6 0.06 1.00 0.82 1.00 SKR7 -0.27 -0.04 0.09 0.39 -0.14 -0.02 -0.21 -0.21 -0.09 -0.10 0.6 0.06 1.00 0.82 1.00 LWR6 -0.42 -0.26 -0.12 0.14 -0.33 -0.22 -0.53 -0.53 -0.34 -0.22 -0.33 -0.33 0.72 0.71 1.00 LWR7 -0.27 -0.34 0.10 0.04 0.19 0.27 0.12 0.12 0.19 0.35 0.26 0.26 0.20 0.20 0.22
@
Values above the diagonal and in bold are genotypic correlation coefficient values, while those italicized values below the diagonal are for the phenotypic correlation coefficients Legend: Yield – yield of corm (tons/ha) PCDM – Percent dry matter of corm WtTu – Average weight of tubers HIDB – Harvest index (dry weight basis LAI6 – leaf area index (6 MAP) LAI7 – leaf area index (7 MAP) VGIP6 – predicted VGI (6MAP) VGIP7 – predicted VGI (7 MAP) VGO6 – observed VGI (6 MAP) VGO7 – observed VGI (7 MAP) SKR6 – number of suckers (6 MAP) SKR7 – number of suckers (7 MAP) LWR6 – leaf length – width ratio (6 MAP) LWR7 – leaf length – width ratio (7 MAP)
Conclusions Variability exist among the genotypes evaluated, three genotypes seem to be common among the two sites, i.e., BLSM qq5, BLSM 128 and VG 2. However, additional genotypes that may be evaluated further in regional trials are BLSM 132, BLSM 151 and BLSM 80. References: Allard RW. 1960. Principles of Plant Breeding. First Edition John Wiley and Sons, Inc. New York. Pp 485.

77
Burton GW and EH DeVane, 1953. Estimating heritability in tall fescue (Festuca arundinacea L.) from replicated clonal material. Agron. J. 45: 478 – 481. Kwon SH and JH Torrie, 1964. Heritability and inter-relationship among traits of two soybean populations. Crop Sci. 4: 196 – 198. Robinson HF, RE Comstock and PH Harvey, 1951. Genotypic and phenotypic correlations in corn and their implications in selection. Agron. J. :282 -287. Soulard L, P Letourmy, TV Cao, F Lawac, H Chair and V Lebot, 2016. Evaluation of vegetative growth, yield and qualtiy related traits in taro (Colocasia esculenta (L.) Schott). Crop Sci. 56: 1 – 14. Ongoing Activities:
1. Three evaluation of similar genotypes evaluated in 2014 – 2015. a) First set-up done in Asturias in August 2015 and scheduled for harvesting in
March 2016. This was intended to exposed the different genotypes to the predicted El Niño phenomenon to occur from late 2015 to early 2016.
b) The second set-up was also done in upland condition in Pangasugan, Baybay Leyte from July 2015 to February 2016. This had just been harvested last week.
c) The third set up was for the evaluation under lowland condition. This was planted in October 2015 and schedule for harvesting May 2016.

78
2.12. Vanuatu, VARTC (Floriane Lawac, Roger Malapa) 1: Colocasia esculenta
A- Germplasm distribution
After receiving 50 taro accessions from SPC, only 47 survival introductions were multiplied in field at VARTC station. Twenty four (24) to 30 accessions were distributed to the farmers. Each farmer received between 5 to 10 plants per accession. These plants were distributed in four different islands spreading from the North to the South of the archipelago where different agro-ecological zones are expected to prevail according to the latitudes and the exposition from the southeast trade wind (table 1). Regions exposed in the windward side (southeast and inland) would be more humid as compared to the leeward side (northwest).
Table 1: Characteristic of 4 agro-ecological zones
Island Latitude Site location Temp (oC)
Type of Soil Annual rainfall
Gaua 14º 15’ S Northeast 24 - 31 Volcanic 4000mm
Santo 15º 15’ S East and South 23 – 30 Alluvial 2500mm – 2800mm
Ambae 15º 24’ S West 22 – 31 Volcanic 1200mm – 1800mm
Tanna 19º 30’ S Middle bush 21 - 29 Volcanic 1100mm – 1500mm
In 2015, 24 to 30 introduced accessions were distributed to 28 farmers in 18 villages (table 2).
Table 2: Number of farmer in four (4) agro-ecological zones
Agro-ecological zones Villages Trial plots Farmers Distribution
Santo (East/South) 6 12 12 May-June 2015
Tanna (Middle bush) 1 6 30* June 2015
Ambae (West) 4 8 4 September 2015
Gaua (Northeast) 1 2 1 September 2015
Total 18 28 18
*NGO The distribution was done between May-June in 2 agro-ecological zones located in Santo and Tanna. Santo is the biggest island of the archipelago, so we focused on some precise areas only, particularly on the Eastern part and Southern part of the island. On Tanna, the distribution was done in

79
collaboration with the Nasituan Cooperation, a local NGO which is established in the Middle Bush in Tanna. The second distribution in Ambae and Gaua occurred on September 2015. Six (6) out of 10 taro trial plots have failed due to the prolonged El Nino effect that was established just after cyclone PAM. The trial on Gaua was repeated but still no success.
B- On farm participatory evaluation on progress
The trials were established in early 2015. Most of the trials are in the vegetative phase. For now on we have only morphological data of trials from the first distribution. The trials from the second distribution have failed. The remaining trial plots will be soon harvested.
Figure 1: New hybrids seedlings in nursery
Figure 2: Seedlings after 3 months in nursery

80
2: Xanthosoma sagittifolium A- Breeding of Xanthosoma sagittifolium
1) Genetic diversity study based on SSRs markers
New insight gained from molecular genetic diversity study (SSRs) of the Vanuatu national collection has completely re-oriented the breeding strategy of Xanthosoma sagattifolium at VARTC in 2015. This study was undertaken by CIRAD-Montpellier in 2014 under the framework of INEA revealed the existence of two distinct genetic backgrounds within Xanthosoma sagattifolium. The first group is represented by 7 cultivars that are classified into 4 groups of related morphotypes or convar (pop1). Such convar regroups dwarves and tall plant that produce yellow, white or red cormel flesh colour which are characterized by a medium to low dry matter content. The second convar (pop2) regroup 3 cultivars that can be easily distinguished by very tall vigorous and erected plants that produce blue whitish (waxy) stem colour. Cormels are of white or red flesh and dry matter content is very high. Table 1 summarizes the classification of the cultivars and progenies obtained from previous crosses. Table 1: Classification of cultivars and progenies of X. sagittifolium based on SSRs markers
Sub-population Biological status
Origin Sample size Convar groups Number of genotyped acc.
Pop1 Cultivar nd 7 GC1, GC2, GC3, GC5
6
Pop2 Cultivar nd 3 GC4 3 Pop3 Selected
progeny Pop 1 11 GC1, GC3 9
Pop4 Progeny Pop 2 x Pop1
47 GC4, GC5 1
So far the best 11 clones (pop3) that have been selected at C4 stemmed from crosses
involving only parents from pop1. None of the pop4 progenies stemming from crosses involving a female parent from pop2 have been selected because of their comparative poor performance (low yield, high number of cormel, high number of sucker, very tall plant, etc.). Pop4 include 47 progenies that are still maintained in the field at C4. 2) New breeding strategy and objectives The strategy mainly focuses on 2 main objectives:
Exploit heterosis by favouring crosses between distant genotypes such as Pop1xPop4, Pop3xPop4 in order to enlarge the genetic basis of the species and to avoid inbreeding in the long term.
Favour crossing between a yellow flesh cultivar (Pop1, GC2) and elite cultivars and elite hybrids of Pop1 and Pop4 in order to produce improved varieties with high tolerance to root rot disease as conferred by cultivar with yellow cormel flesh.
2) Activities :
Field establishment of subpopulations with distinct genetic background

81
Pop1, Pop2 and Pop3 were established in the field in September 2014.
Pop 4 is established later in April 2015.
Characterization
Plant eight, number of leaves and flowering were evaluated for the subpopulations pop1, pop2 and pop3.
Pollen grain structure was investigated in order to classify the individual into groups of 11 female and 6 male genitors.
Hand pollination
Hand pollination was conducted from 11th to 25th July. Flowering rate is reduced and highly affected by drought. Fruit development was also affected because most of the fruit didn’t complete their development because of the dry spell that affected crop development from June to December just after the cyclone Pam strike in March. Mature fruit were collected in late August early September with a rate of 30.6% success crosses.
Seed germination study
A seed germination study was conducted on both Colocasia esculenta and Xanthosoma sagittifolium from November to December 2015. Treatments based on HCl, commercial bleach (calcium hypochlorite) and hot water were investigated and compared. Seed germination rate of X. sagittifolium is highly optimized with a 1% bleach solution treatment giving a 90% germination in two weeks as compared to control.
Participative selection
Eleven selected hybrids were introduced in the Middle Bush Tanna and in Gaua for participative selection. However, crop failure is very high as already reported for colocasia because of post PAM disaster and drought.

82
2.13. Papua New Guinea, NARI (C. Atung, J. Waki, B. Komolong) Introduction The Papua New Guinea (PNG) National Agricultural Research Institute (NARI) is one of the partner countries in the International Network for Edible Aroids (INEA) implementing the project ‘Adapting clonally propagated crops to climatic and commercial changes’ supported by the European Union. This report summarizes activities and achievement in Year 5 (2015) of implementation by the Institute in the Work packages it is participating in. Work package 1: Project Management Activities The Institute has provided regular updates and quarterly reports to the technical project coordinator in the prescribed format and submitted the Annual financial report 2014 to LRD-SPC as the administrative coordination unit. Work package 2: Distribution of 30 selected genotypes to village communities NARI selected 30 genotypes from introduced and local taro genotypes after initial on-station evaluation trials at the beginning of the project from 2011-2012 Once selections were completed the materials have been propagated further to generate sufficient planting material to establish participatory evaluation trials in the selected village communities. The activity was completed during second quarter of 2015. Work package 3: Breeding and on- farm participatory selection and evaluation On-station evaluation- Nursery, field planting and selection Seedlings from crosses (in access of 5000) were raised in modified water beds in the nursery in December 2014. Two batches of transplanting were done due growth performance. Seedlings that were fully developed in nursery were taken as first batch while those that were underdeveloped were given time to develop further, hance regarded as second batch. First batch progenies This batch consisted of fully developed seedlings ready for field planting at the time. The seedlings were transplanted into the field during the first quarter of 2015. These included a total 138 families. During November to December 2014, seedlings were raised in modified waterbeds and further transplanted into poly pots and nursery trays at 3-4 leaf stage, and placed in open air, with nylon shade cover. In March 2015, over 2000 progenies were transferred to the Bubia research field and were planted at 50cm x 100cm spacing in a continuum of families. The plot was maintained up to October 2015 during which time observation and selection was made for on-farm trials. The genotypes were selected based on:
Stolon forming ability – the highly prolific stolon genotypes were selected out
Sucker forming ability – the prolific suckering genotypes were selected out
Corm forming ability – the clearly defined shaped with less root hairs were selected
Disease resistance – Genotypes with very high Taro Leaf Blight incidence on the leaves were selected out
Three hundred single clone genotypes have been distributed and planted in three villages in the Morobe province, namely, Musom-Tale (Nawaeb district), Wankun (Markham district), and Gabensis (Huon Gulf district). 30 households received equal number of planting materials (i.e.,10 planting/household) to evaluate based on their local traits of preference.

83
Establishment of on-farm trials under this work package was considerably affected by the 2015 El Nino event. Above sites are in areas that were less affected and which received sufficient rainfall to establish the trials. Other planned sites in Madang Province could not be established in 2015 due to the prolonged dry season caused by the El Nino event. Brief on-farm village background: Musom-Tale village Prior to engagement with the village, a faith-based farmer group from the village approached NARI to seek support in taro farming. Taro is the main staple in the area and also a means of income. The engaged farmers were keen to transfer the technologies to other households and continue the work in the effort to commercialize the crop. Observation shows that they lack diversity of taros in their gardens. This would be an opportunity to diversify.
Plate1: Musom-Tale village farmers tending to their newly planted hybrid gardens

84
Wankun village The village is located along the fertile bank of a river in the Markham valley. Their main staple is ‘kalapua’ cooking banana, which is drought tolerant but succumbs to frequent floods. Taro is a traditionally valued yet not much considered in their farming system. Hence diversity is observed to be lacking. In fact there were rare sightings of taro gardens as compared to Musom-Tale. However it has been expressed that farmers need diversity to maintain taro cultivation. Gabensis village The engaged village were mostly settlers who bought off land from Gabensis village landlords. The farmers are limited by the area they occupy but have quite fair bit of area to do farming. They are happy to share the technology to anyone in the village. In all the sites the single plant genotypes were planted in two rows beginning with local cultivar as first plants in the rows followed by the hybrids and continued the pattern. Data will be collected on disease incidences, selected vegetative and yield parameters, and culinary quality. Visits to the sites will take place at four, five and six months to make necessary observation. Most importantly farmers will select lines that suites their local preferences. The selected lines will be further multiplied in a demarcated farm at the village and distributed to all the communities. These clones will be incorporated into the germplasm collection at Bubia. Second batch progenies Towards the end of August 2015 the second batch of seedlings (remnants) in access of 1500 individuals comprising 71 families were transplanted into the field. These will be selected and brought to the two selected villages in Madang province in March 2016. Selection and evaluation will be the same as in batch one. Table1. Families and corresponding progenies transplanted in field in August 2015.
No Fparent Mparent Progeny code No Fparent Mparent Progeny
code
1 NT02 CE/IND/06 NCes14001 36 BL/SM/157 C4-150 NCes14067
2 C5-353 BL/SM/104 NCes14007 37 JY11 CE/IND/06 NCes14068
3 C5-216 BL/SM/104 NCes14008 38 BL/SM/148 C5-216 NCes14070
4 C5-308 CE/IND/06 NCes14010 39 C4-153 BL/SM/151 NCes14073
5 BL/SM/104 BC867 NCes14015 40 CE/IND/16 ??? NCes14083
6 CE/IND/16 C5-308 NCes14019 41 BC867 CE/MAL/14 NCes14085
7 C5-234 CE/IND/16 NCes14023 42 JY11 BL/SM/104 NCes14086
8 BL/HW/05 C5-353 NCes14025 43 KPOSN 27 BC867 NCes14087
9 C5-216 BL/SM/120 NCes14031 44 BL/SM/80 C5-245 NCes14088
10 C5-353 BL/SM/151 NCes14032 45 BC867 BL/SM/115 NCes14090
11 C5-224 NT03 NCes14033 46 CE/MAL/14 C4-150 NCes14091
12 C5-304 CE/IND/14 NCes14034 47 BL/SM/80 BC867 NCes14095
13 BL/SM/111 BC867 NCes14035 48 C4-150 BL/SM/120 NCes14097
14 BC867 BL/SM/151 NCes14037 49 BL/SM/158 C5-216 NCes14104
15 CE/IND/06 C4-150 NCes14039 50 CE/MAL/14 C5-308 NCes14105
16 NT02 NUMKOWI NCes14041 51 BL/SM/143 CE/IND/14 NCes14110

85
No Fparent Mparent Progeny code No Fparent Mparent Progeny
code
17 NT01 L/YELLOW NCes14042 52 C5-309 CE/MAL/07 NCes14111
18 NT03 BC867 NCes14043 53 C4-150 BL/SM/157 NCes14112
19 C5-216 C5-216 NCes14044 54 BL/SM/148 BC867 NCes14113
20 C4-150 CE/IND/16 NCes14045 55 BL/SM/148 CE/MAL/14 NCes14115
21 C5-245 BL/SM/104 NCes14046 56 C5-217 CE/MAL/07 NCes14124
22 NT03 NUMKOWI NCes14047 57 KPOSN 27 CE/IND/06 NCes14127
23 C5-199 BL/SM/111 NCes14048 58 BL/SM/151 C5-309 NCes14128
24 C5-191 L/YELLOW NCes14049 59 BL/SM/152 C5-216 NCes14131
25 BL/HW/05 C5-224 NCes14050 60 BL/SM/80 C5-309 NCes14135
26 BL/SM/120 C5-224 NCes14051 61 CE/IND/31 ?? NCes14136
27 NT01 C5-353 NCes14053 62 BL/SM/104 ?? NCes14137
28 NT02 C5-353 NCes14054 63 BL/SM/111 ?? NCes14138
29 CE/MAL/07 C5-353 NCes14055 64 C5-234 ?? NCes14141
30 BL/SM/111 C5-216 NCes14056 65 C5-216 ?? NCes14145
31 CE/IND/16 C4-150 NCes14057 66 C5-245 CE/THA/15 NCes14149
32 C5-353 CE/IND/06 NCes14059 67 Keselevenga ? NCes14156
33 BL/SM/152 3191/41 NCes14063 68 BL/SM/157 319/41 NCes14150
34 BC867 BL/SM/111 NCes14065 69 BL/SM/157 BC867 NCes14152
35 BC867 BL/SM/104 NCes14066 70 CE/IND/31 BC867 NCes14153
71 CE/MAL/14 CE/MAL/14 NCes14076
Plate 2. Two of the potential progenies that will be evaluated and brought to farmers
CE/IND/31X BC867 BC867
BC867 x BL/SM/115
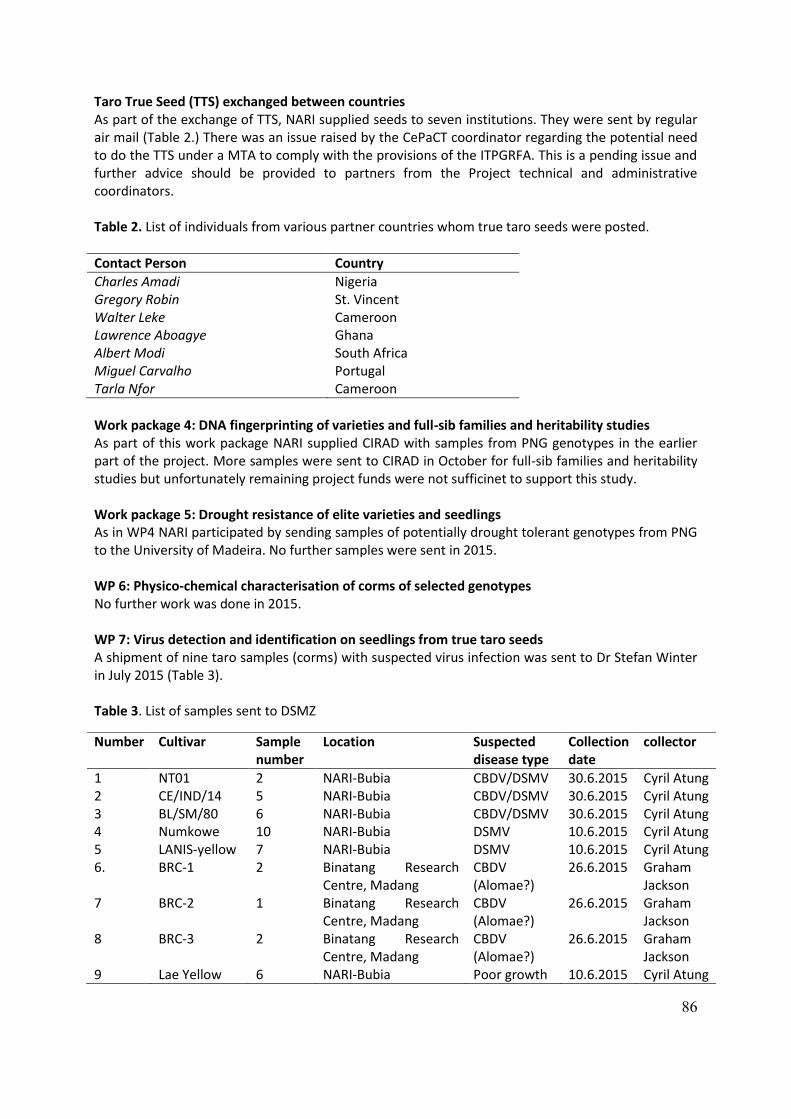
86
Taro True Seed (TTS) exchanged between countries As part of the exchange of TTS, NARI supplied seeds to seven institutions. They were sent by regular air mail (Table 2.) There was an issue raised by the CePaCT coordinator regarding the potential need to do the TTS under a MTA to comply with the provisions of the ITPGRFA. This is a pending issue and further advice should be provided to partners from the Project technical and administrative coordinators. Table 2. List of individuals from various partner countries whom true taro seeds were posted.
Contact Person Country
Charles Amadi Nigeria Gregory Robin St. Vincent Walter Leke Cameroon Lawrence Aboagye Ghana Albert Modi South Africa Miguel Carvalho Portugal Tarla Nfor Cameroon
Work package 4: DNA fingerprinting of varieties and full-sib families and heritability studies As part of this work package NARI supplied CIRAD with samples from PNG genotypes in the earlier part of the project. More samples were sent to CIRAD in October for full-sib families and heritability studies but unfortunately remaining project funds were not sufficinet to support this study. Work package 5: Drought resistance of elite varieties and seedlings As in WP4 NARI participated by sending samples of potentially drought tolerant genotypes from PNG to the University of Madeira. No further samples were sent in 2015. WP 6: Physico-chemical characterisation of corms of selected genotypes No further work was done in 2015. WP 7: Virus detection and identification on seedlings from true taro seeds A shipment of nine taro samples (corms) with suspected virus infection was sent to Dr Stefan Winter in July 2015 (Table 3). Table 3. List of samples sent to DSMZ
Number Cultivar Sample number
Location Suspected disease type
Collection date
collector
1 NT01 2 NARI-Bubia CBDV/DSMV 30.6.2015 Cyril Atung 2 CE/IND/14 5 NARI-Bubia CBDV/DSMV 30.6.2015 Cyril Atung 3 BL/SM/80 6 NARI-Bubia CBDV/DSMV 30.6.2015 Cyril Atung 4 Numkowe 10 NARI-Bubia DSMV 10.6.2015 Cyril Atung 5 LANIS-yellow 7 NARI-Bubia DSMV 10.6.2015 Cyril Atung 6. BRC-1 2 Binatang Research
Centre, Madang CBDV (Alomae?)
26.6.2015 Graham Jackson
7 BRC-2 1 Binatang Research Centre, Madang
CBDV (Alomae?)
26.6.2015 Graham Jackson
8 BRC-3 2 Binatang Research Centre, Madang
CBDV (Alomae?)
26.6.2015 Graham Jackson
9 Lae Yellow 6 NARI-Bubia Poor growth 10.6.2015 Cyril Atung
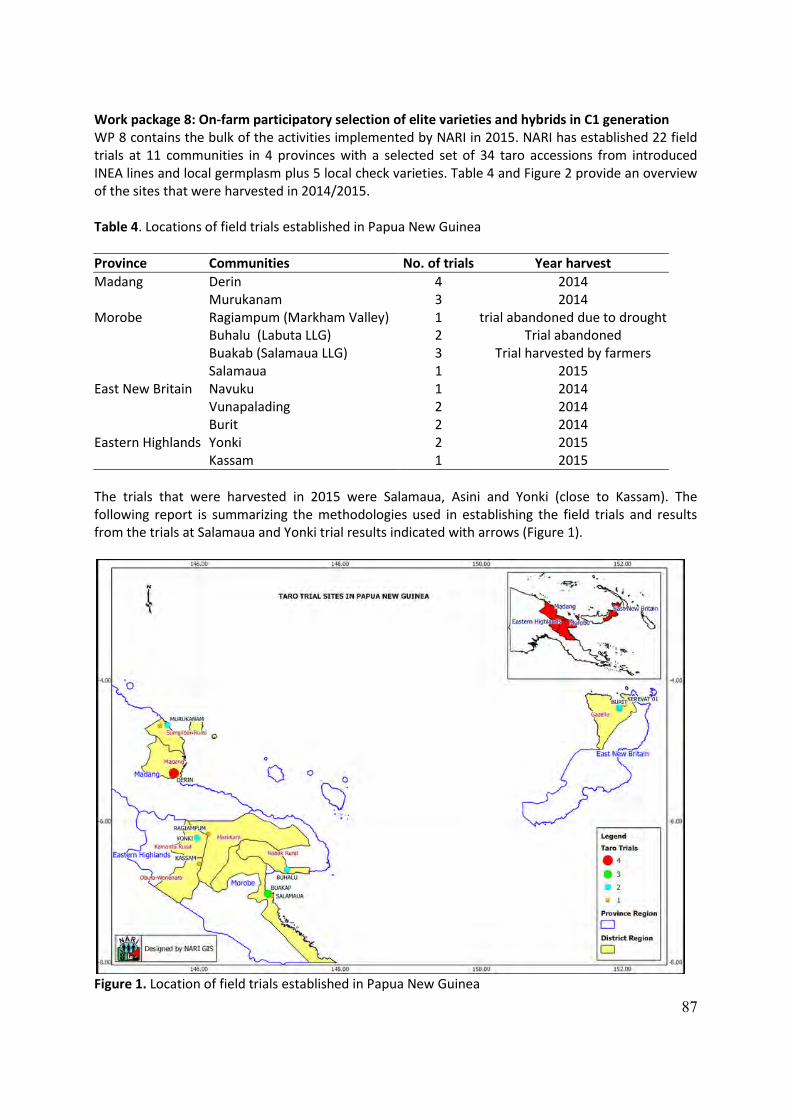
87
Work package 8: On-farm participatory selection of elite varieties and hybrids in C1 generation WP 8 contains the bulk of the activities implemented by NARI in 2015. NARI has established 22 field trials at 11 communities in 4 provinces with a selected set of 34 taro accessions from introduced INEA lines and local germplasm plus 5 local check varieties. Table 4 and Figure 2 provide an overview of the sites that were harvested in 2014/2015. Table 4. Locations of field trials established in Papua New Guinea
Province Communities No. of trials Year harvest
Madang Derin 4 2014 Murukanam 3 2014
Morobe Ragiampum (Markham Valley) 1 trial abandoned due to drought Buhalu (Labuta LLG) 2 Trial abandoned Buakab (Salamaua LLG) 3 Trial harvested by farmers Salamaua 1 2015
East New Britain Navuku 1 2014 Vunapalading 2 2014 Burit 2 2014
Eastern Highlands Yonki 2 2015 Kassam 1 2015
The trials that were harvested in 2015 were Salamaua, Asini and Yonki (close to Kassam). The following report is summarizing the methodologies used in establishing the field trials and results from the trials at Salamaua and Yonki trial results indicated with arrows (Figure 1).
Figure 1. Location of field trials established in Papua New Guinea

88
a) Materials and Method Varieties of diverse origin were selected from a preliminary on-station evaluation of 50 accessions from international collections supplied by CePaCT, accessions from the PNG National Taro Germplasm Collections and breeding lines from the NARI Taro breeding programme from 2012 to 2013. Table 5 shows the list of accessions and origin of the 40 varieties tested (34 test genotypes) and (5 standard checks) in the on-farm trials different village communities in two different Province with different agro-climatic conditions. The four local control varieties were Numkowe (local preferred cultivar), NT01 and NT02, (best NARI released varieties), and Siasi and Kiupa or sometimes known as Bukawaha, (top local farmer cultivar) (Table 5). The trials in Madang and ENB were harvested in early June and December 2014, respectively. Table 5. Taro varieties and their origin used in (Salamaua & Yonki) on farm trials
Type of genotype Source of Origin
No. of Genotypes
Accessions / Codes in brackets
Improved variety PNG 2 NT01, NT02 Elite lines PNG 10 C4-150, C4-153, C5-191, C5-199, C5-216, C5-234, C5-
245, C5-304, C5-308, C5-353 Landrace PNG 5 KPOSN27, Numkowe,319/41, Kiupa, Siasi Exotic lines Samoa 16 BL/SM/104, BL/SM/111, BL/SM/115, BL/SM/116,
BL/SM/120, BL/SM/128, BL/SM/132, BL/SM/136, BL/SM/143, BL/SM/148, BL/SM/149, BL/SM/151, BL/SM/152, BL/SM/157, BL/SM/43, BL/SM/80
Exotic lines Hawaii 2 BL/HW/05, BL/HW/26, Exotic lines Malaysia 3 CE/MAL/07, CE/MAL/12, CE/MAL/14 Exotic lines Indonesia 3 CE/IND/14, CE/IND/16, CE/IND/31 (Salamaua trial)
Information on trial locations Salamaua Salamaua is located in a high rainfall area with >3200mm rainfall/year with a mean annual temperature of 30.9°C. Four trials were planted initially. One trial was abandoned due dry conditions experience that destroyed the trials while the Asini and Puakap trials were harvested and distribution done by farmers themselves. At Salamaua, the trial was struggling to pick up. At harvest the farmers were encouraged to select their preferred varieties. About 43 farmers participated at harvest (28 female and 15 Male). The names of the farmer selected varieties were recorded. The main data collected were Taro Leaf Blight (TLB) rating, sucker numbers, stolon numbers and corm weight in grams which was later converted to tonnes/ha. Yonki The Yonki trials were established at Kassama and Anasina, respectively which are located at an altitude of >1200masl. The trial was harvested in May 2015 consisting of 36 lines (10 advanced PNG breeding lines, 2 NARI released lines, 1 local landrace and 23 exotic lines) as shown in Table 4. The trial was planted using an augmented design to reduce space when a large number varieties was used in an evaluation trial. The plant spacing was 1mx0.5m between and within plots. The trial was planted on a previously cultivated rice paddy and sweetpotato plot. The main data of interest was the corm yield and eating quality.

89
Eating Quality Assessment Taro corms weight 100-500 grams were peeled by farmers and split into small pieces and placed in cut onion bags and boiled for 30-40 minutes .The samples were taken out of the onion bags and sorted according to labels. About 54 people were gathered for the taro eating quality assessment. However, 48 participated in the eating quality taste while the remaining were observers, did not p participated in the taste test. Due to large number of farmers, farmers were grouped into 16 groups of 2-5 members per group. The 39 test varieties including the four check varieties were placed on to a plate and distributed to all 16 groups. After each group finished tasting their varieties, they rotated the plate around to other groups. Each group were tasked to assess all 39 varieties and identify the variety she or he considers best. Plant Material Distribution At Salamau, after the taste panel was conducted, plant materials distribution was conducted with the taro grower co-ordinator Mr Ngasegom Alinga leading the discussion. The priority was given to the visiting farmers from the nearby community representatives (Puakap, Asini, and Kela). A total of 54 farmers were presented with planting material which comprised of 18 households and 36 individual families. The lead farmer called out the names of the taro growing farmers. Each farmer was to select two accessions each from 39 accessions. Left over planting material was distributed to interested farmers who gave their names to Alinga for recording. The distribution was basically done based on farmer’s preference for a variety in terms of yield and taste. TLB (local name: Ross kapa) was not important for farmers when selecting for variety in this community. At Yonki, model farmers wanted to keep all the planting material for another season. Our trials were initially established during the start of the dry season so trials were not performing as expected.
Trial design Each trial was planted using an augmented design with 6 blocks and 4 standard checks were replicated within blocks (Table 6 shows the example from Madang trials). Each plot consisted of five data plants without guard rows. The plot size was 1 x 0.5m between and within rows with each plot covering 2.5m2. The trials were planted near old gardens which provided an excellent source of taro leaf blight caused by Phytophthora colocasiae inoculums ensuring heavy disease pressure to allow spores to migrate to new plots to infest new varieties. Table 6. Field plan lay-out for on-farm trials at 11 communities in PNG (some variations between sites for local varieties)
Blocks 1: 2 3 4 5 6
BL/SM/158 NT02 BL/HW/37 Numkowe BL/SM/111 NT02 Numkowe BL/SM/104 319/41 BL/SM/43 NT01 BL/SM/149 CE/MAL/14 NT01 NT02 LANIS Numkowe BL/SM/120 NT02 BL/SM/152 BL/SM/157 CE/IND/14 BL/SM/116 LANIS BL/SM/80 LANIS Numkowe CE/MAL/07 LANIS BL/SM/151 NT01 KPOSN27 C5-353 NT01 NT02 NT01 CE/IND/31 Numkowe LANIS BL/SM/115 BL/HW/26 BL/HW/05 LANIS BL/SM/148 CE/IND/16 BL/SM/128 BL/SM/132 Numkowe BL/SM/136 CE/MAL/12 NT01 NT02 BL/SM/143 C5-245
Data collection The severity of taro leaf blight (TLB) was estimated using the standard area diagram developed by Gollifer and Brown (1974). The percentage disease leaf area was estimated for five leaves on each
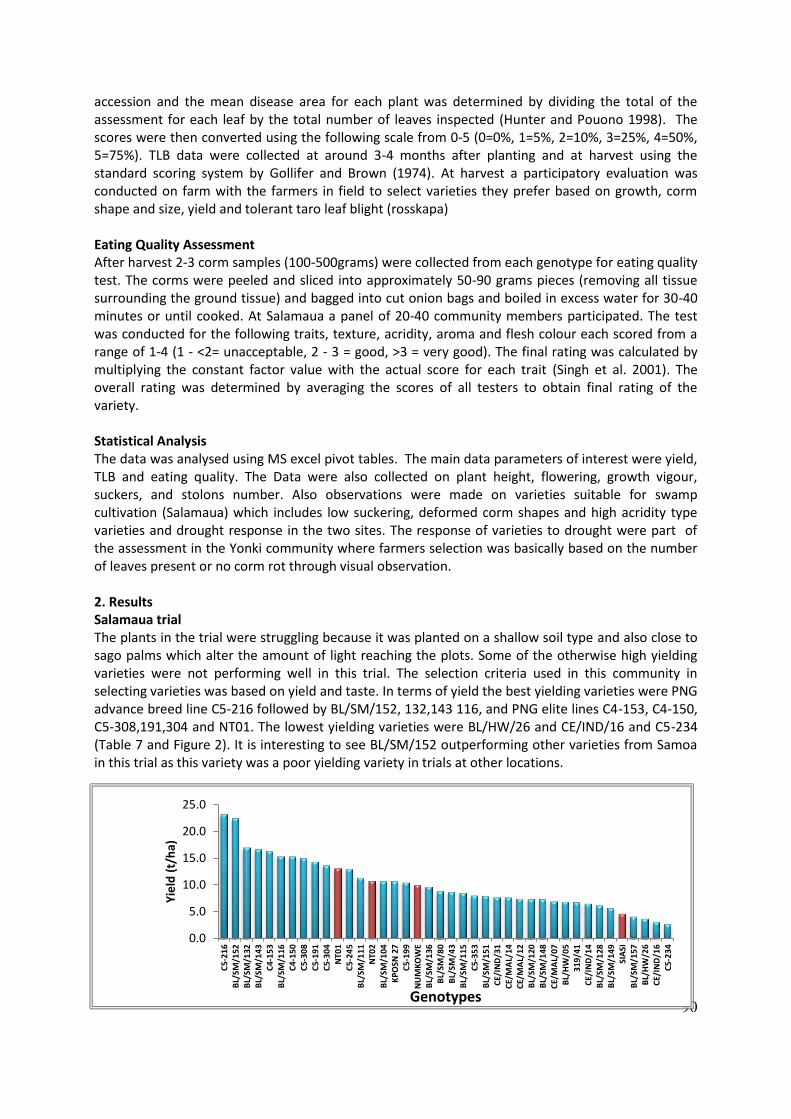
90
0.0
5.0
10.0
15.0
20.0
25.0
C5-
21
6B
L/SM
/152
BL/
SM/1
32B
L/SM
/143
C4-
15
3B
L/SM
/116
C4-
15
0C
5-3
08
C5-
19
1C
5-3
04
NT0
1C
5-2
45
BL/
SM/1
11N
T02
BL/
SM/1
04K
PO
SN 2
7C
5-1
99
NU
MK
OW
EB
L/SM
/136
BL/
SM/8
0B
L/SM
/43
BL/
SM/1
15C
5-3
53
BL/
SM/1
51C
E/IN
D/3
1C
E/M
AL/
14
CE/
MA
L/1
2B
L/SM
/120
BL/
SM/1
48C
E/M
AL/
07
BL/
HW
/05
319
/41
CE/
IND
/14
BL/
SM/1
28B
L/SM
/149
SIA
SIB
L/SM
/157
BL/
HW
/26
CE/
IND
/16
C5-
23
4
Yie
ld (
t/h
a)
Genotypes
accession and the mean disease area for each plant was determined by dividing the total of the assessment for each leaf by the total number of leaves inspected (Hunter and Pouono 1998). The scores were then converted using the following scale from 0-5 (0=0%, 1=5%, 2=10%, 3=25%, 4=50%, 5=75%). TLB data were collected at around 3-4 months after planting and at harvest using the standard scoring system by Gollifer and Brown (1974). At harvest a participatory evaluation was conducted on farm with the farmers in field to select varieties they prefer based on growth, corm shape and size, yield and tolerant taro leaf blight (rosskapa) Eating Quality Assessment After harvest 2-3 corm samples (100-500grams) were collected from each genotype for eating quality test. The corms were peeled and sliced into approximately 50-90 grams pieces (removing all tissue surrounding the ground tissue) and bagged into cut onion bags and boiled in excess water for 30-40 minutes or until cooked. At Salamaua a panel of 20-40 community members participated. The test was conducted for the following traits, texture, acridity, aroma and flesh colour each scored from a range of 1-4 (1 - <2= unacceptable, 2 - 3 = good, >3 = very good). The final rating was calculated by multiplying the constant factor value with the actual score for each trait (Singh et al. 2001). The overall rating was determined by averaging the scores of all testers to obtain final rating of the variety. Statistical Analysis The data was analysed using MS excel pivot tables. The main data parameters of interest were yield, TLB and eating quality. The Data were also collected on plant height, flowering, growth vigour, suckers, and stolons number. Also observations were made on varieties suitable for swamp cultivation (Salamaua) which includes low suckering, deformed corm shapes and high acridity type varieties and drought response in the two sites. The response of varieties to drought were part of the assessment in the Yonki community where farmers selection was basically based on the number of leaves present or no corm rot through visual observation. 2. Results Salamaua trial The plants in the trial were struggling because it was planted on a shallow soil type and also close to sago palms which alter the amount of light reaching the plots. Some of the otherwise high yielding varieties were not performing well in this trial. The selection criteria used in this community in selecting varieties was based on yield and taste. In terms of yield the best yielding varieties were PNG advance breed line C5-216 followed by BL/SM/152, 132,143 116, and PNG elite lines C4-153, C4-150, C5-308,191,304 and NT01. The lowest yielding varieties were BL/HW/26 and CE/IND/16 and C5-234 (Table 7 and Figure 2). It is interesting to see BL/SM/152 outperforming other varieties from Samoa in this trial as this variety was a poor yielding variety in trials at other locations.

91
+ - flower absent, ++-rarely flower, +++- highly flowering, * - standard checks genotypes EQS score: 1≥ =unacceptable, 2≥=good and 3≥ = very good , R = resistant, SS=slightly susceptible
Disease observation on farm Severity of Taro leaf blight caused by Phytophthora colocasia varies with varieties. Some of the varieties observed in previous trials to be resistant were seen being infected with taro leaf blight. For example BL/SM/148 and 143 showed high level of resistance in our previous farm trials but severity was higher in this trial (Table 7). TLB (ross kapa) as known by the community is not considered a major part of their selection of new taro varieties.
Table 7. Performance of the new lines at Salamaua
Varieties Plant height
Suckers Flower form
TLB Average (g) (Yield)
Yield (t/ha)
EQ Score
Taste rating
C5-216 130.0 0.0 + R 1162.5 23.3 3.2 very good BL/SM/152 108.3 2.7 + R 1125.0 22.5 3.3 very good BL/SM/132 123.3 2.0 + SS 850.3 17.0 2.5 Good BL/SM/143 103.3 0.7 + SS 833.3 16.7 3.2 very good C4-153 70.0 0.3 + R 816.7 16.3 3.0 very good BL/SM/116 120.0 7.0 + R 766.7 15.3 3.0 very good C4-150 91.7 2.3 + R 766.7 15.3 2.2 Good C5-308 70.0 2.3 + R 750.0 15.0 3.0 very good C5-191 28.3 0.0 + R 716.7 14.3 2.2 Good C5-304 88.3 5.0 + R 683.3 13.7 2.6 Good NT01 77.5 2.1 + R 654.2 13.1 3.1 very good C5-245 93.3 1.3 + R 650.0 13.0 2.4 Good BL/SM/111 115.0 6.7 ++ R 566.7 11.3 1.8 Poor NT02 62.0 2.9 + R 538.2 10.8 3.2 very good BL/SM/104 78.3 12.3 + R 533.3 10.7 3.3 very good KPOSN 27 71.7 2.3 + R 533.3 10.7 2.0 Good C5-199 68.3 3.3 + R 520.8 10.4 2.8 Good NUMKOWE 51.7 2.2 + R 500.0 10.0 3.0 very good BL/SM/136 63.3 2.0 + R 483.3 9.7 2.7 Good BL/SM/80 51.7 0.3 + R 441.7 8.8 3.2 very good BL/SM/43 78.3 5.3 + R 433.3 8.7 3.0 very good BL/SM/115 75.7 3.0 + R 425.2 8.5 3.3 very good C5-353 63.3 0.3 + R 400.0 8.0 3.2 very good BL/SM/151 75.0 3.3 + S 395.8 7.9 2.0 Good CE/IND/31 60.0 2.0 + R 383.3 7.7 2.4 Good CE/MAL/14 53.3 5.7 + S 383.3 7.7 2.5 Good CE/MAL/12 56.7 2.3 + R 370.8 7.4 3.0 very good BL/SM/120 83.3 1.0 + R 366.7 7.3 2.6 Good BL/SM/148 46.7 0.0 + SS 366.7 7.3 3.1 very good CE/MAL/07 63.3 4.0 ++ R 346.0 6.9 2.6 Good BL/HW/05 45.0 0.0 + R 341.7 6.8 1.4 Poor 319/41 55.0 1.3 + S 337.5 6.8 2.3 Good CE/IND/14 80.0 8.0 + S 325.0 6.5 1.7 Poor BL/SM/128 60.0 3.7 + R 308.5 6.2 2.8 Good BL/SM/149 45.0 0.7 + R 283.3 5.7 3.5 very good SIASI 32.5 1.4 + S 230.6 4.6 4.3 very good BL/SM/157 35.0 0.3 + R 204.2 4.1 2.6 Good BL/HW/26 28.3 0.7 + R 183.3 3.7 2.3 Good CE/IND/16 41.7 1.0 + R 154.2 3.1 2.4 Good C5-234 46.7 2.3 + R 133.3 2.7 3.1 very good

92
Eating quality assessment: The taste test evaluation is an important part of the farmer participatory evaluation and selection process. During taste testing participants were asked to complete the score rating sheet based on their preference. The results from the taste panel test are summarised and presented in Table 7. From the panel evaluation, 19 varieties were rated as very good followed by 17 varieties as good and 3 varieties were rated as poor. Lagui farmer’s selection confirms our previous study on the highly acrid type varieties BL/HW/05 and BL/SM/11. BL/SM/111 was discarded by farmers during the harvest. Farmers made this decision after looking at the corm quality and shape, also the flowering ability and sucker which farmers believe assembles wild type taro. Yonki Trials The Arona valley which is the home to the Yonki hydropower Dam, the largest in PNG produces a lot of taro for supply of their well liked local brand of taro varieties to the main Goroka, Agamore and Kainantu markets. The trial was planted during April where the rain season starts to vary and dry season follows after which provided an opportunity for us to identify drought tolerant lines. Among the three trials planted 2 in the Arona valley, one each at Kassam. Only the Kassam and Anasina trial 2 were harvested while the trial at Anasina was replaced with sweetpotato by the farmer. The location of the trial was chosen to reflect the growing conditions of the community in the higher altitude. The evaluation site was chosen to see how these new lines are adapted to higher altitudes unfavourable conditions. The trials were harvested in March -May 2015. Though, the results show some high yielding varieties this was not significantly different. The selected varieties were from PNG advance breeding lines while the new lines did not perform well under higher altitude growing environments (Table 8 and 9). Figure 3 shows the 6 best yielding varieties NARI advance breeding lines C5-245, C5-353, C5-216, C4-150 and Indonesian line CE/IND/16 compared to the three highest yielding standard checks (Kiupa, NT01 and Numkowe) Kassam trial. At Anasina, the selection criteria used in selecting of the best performing lines were based on corm yield, corm shape and size. We observed in this trial that yields from 399 grams and below were considered as poor performing and used as pig feed. The yields >400 grams were considered as good for human consumption and market. The results shows that the PNG advance breeding lines performed much better with 5 of the lines (1,2,7,9,&10) making the top ten list (Table 9) with the two released NARI lines (3& 8), and 3 INEA –SPC lines (BL/HW/26,BL/SM/143 and BLS/SM/115) rank 4, 5 and 6 respectively. Some of the highly performing varieties in trials at other locations performed poorly in this trial. The lowest yielding varieties were Samoan breeding lines (BL/SM/152,111 and 136. The three varieties performed poorly in terms of growth and yield while BL/SM/157 and C4-153 did not survive the harsher growing conditions and died out after planting. Disease observation on farm Taro leaf blight was recorded as slightly susceptible to tolerant range. The slightly susceptible varieties are BL/SM/132,111 and PNG advance lines C4-150 and C5-234 (Table 8 and 9) Eating Quality Assessment All 36 lines were evaluated for blind taste test. About 10 participants conducted the blind panel taste test. The model farmer and his family conduct the test on the 34 lines against four local checks.

93
Table 8 and 9 shows the results and many of the Samoan and PNG breeding lines were rated as good except BL/SM/143 which is rated as very good while a number of accessions such as BL/SM/05, BL/SM/11, BL/SM/116 and Malaysian line CE/MAL/07 were rated as high acridity type which were similar to the Salamaua results. and also to the one obtained from the Derin, Murukanam and Kerevat taste panels previously described including the assessment as ‘unacceptable’ for BL/HW/05. Table 8. Performances of the 36 Lines evaluated for Yield and agronomic performance –Yonki (Kassam) (R –resistant), SS- slightly susceptible)
Genotype Corm Yield (grams)
Yield (t/ha)
Plant height (cm)
Taro leaf Blight (TLB)
Suckering Stolon Taste rating
C5-245 1000 20 Tall R Yes No Good C5-353 854.2 17.1 Tall R Yes No Good CE/IND/16 904.2 18.1 Tall R Yes No Good BL/SM/115 470.8 9.4 Tall R No No Good C5-308 534.2 10.7 Tall R Yes No Good NT01 726.1 14.5 Tall R Yes No Good BL/SM/132 358.3 7.2 Tall SS Yes No Good KIUPA 822.1 16.4 Tall R Yes Yes Good BL/HW/26 425 8.5 Tall R Yes No Good C5-234 258.3 5.2 Tall SS Yes No Good BL/SM/151 420.8 8.4 Tall R Yes Yes Good CE/IND/14 172.8 3.5 Tall R Yes No Good C5-191 204.2 4.1 Medium R Yes No Good BL/SM/120 175.3 3.5 Medium R Yes No Good NUMKOWE 567.3 11.3 Medium R Yes No Good BL/SM/43 262.5 5.3 Medium R Yes No Good NT02 348.7 7 Medium R Yes No Good BL/SM/128 312.5 6.3 Medium R Yes Yes Good BL/SM/136 147.8 3 Medium R Yes No Good C5-216 758.3 15.2 Medium R No No Good BL/SM/149 256.2 5.1 Medium R Yes No Good CE/MAL/12 102.5 2.1 Medium R Yes Yes Good C5-304 225 4.5 Medium R Yes No Good BL/SM/104 81.3 1.6 Dwarf R No No Good C4-153 142.5 2.9 Dwarf R Yes No Good BL/SM/80 70.8 1.4 Dwarf R Yes No Good C4-150 870.8 17.4 Dwarf SS Yes Yes Good BL/SM/148 408.3 8.2 Dwarf R Yes No Good BL/SM/152 58.3 1.2 Dwarf R Yes No Good BL/SM/157 37.5 0.8 Dwarf R No No Good BL/HW/05 162.5 3.3 Tall R No No high acridity BL/SM/111 199.2 4 Tall SS Yes Yes high acridity BL/SM/116 461.7 9.2 Tall R Yes Yes high acridity C5-199 137.5 2.8 Medium R No No high acridity CE/MAL/07 491.7 9.8 Medium R Yes Yes high acridity BL/SM/143 487.5 9.8 Medium R Yes No very good

94
0.0
2.0
4.0
6.0
8.0
10.0
12.0
14.0
16.0
18.0
20.0
C5
-24
5C
E/IN
D/1
6C
4-1
50
C5
-35
3K
IUP
AC
5-2
16
NT0
1N
UM
KO
WE
C5
-30
8C
E/M
AL/
07
BL/
SM/1
43
BL/
SM/1
15
BL/
SM/1
16
BL/
HW
/26
BL/
SM/1
51
BL/
SM/1
48
BL/
SM/1
32
NT0
2B
L/SM
/12
8B
L/SM
/43
C5
-23
4B
L/SM
/14
9C
5-3
04
C5
-19
1B
L/SM
/11
1B
L/SM
/12
0C
E/IN
D/1
4B
L/H
W/0
5B
L/SM
/13
6C
4-1
53
C5
-19
9C
E/M
AL/
12
BL/
SM/1
04
BL/
SM/8
0B
L/SM
/15
2B
L/SM
/15
7
Yie
ld (
t/h
a)
Genotypes
Table 9. The yield and yield components of the Anasina trial (Arona Valley) Yonki
Genotype Average of
Yield (g)
Average of Height
(cm)
Average no. suckers
Taste score rating
Rank yield (t/ha)
C4-150 962.50 83.67 0.67 excellent 1
C5-304 916.67 78.00 2.00 poor 2
NT01 695.83 77.61 2.39 excellent 3
BL/HW/26 487.50 61.33 5.00 good 4
BL/SM/143 487.50 67.67 2.00 good 5
BL/SM/115 450.00 46.33 2.67 good 6
C5-216 450.00 40.67 0.00 good 7
NT02 447.22 52.11 2.94 excellent 8
C5-245 416.67 49.33 1.67 excellent 9
C5-199 408.50 69.00 0.67 good 10
C5-353 370.83 42.67 0.00 good 11
CE/MAL/07 325.00 43.00 0.00 good 12
NUMKOWE 306.94 46.72 1.61 excellent 13
C5-308 300.00 48.67 0.00 good 14
BL/HW/05 287.50 116.00 2.33 poor 15
BL/SM/128 287.50 35.33 0.00 excellent 16
CE/IND/16 287.50 66.67 6.00 poor 17
CE/MAL/12 283.33 44.00 7.00 poor 18
Kiupa 272.22 46.17 3.11 excellent 19
BL/SM/80 245.83 35.00 0.67 good 20
BL/SM/148 229.17 46.67 0.00 good 21
Figure 3. Yield of the test lines (aqua) vs the standard (brown colour bars) at Kassam trial

95
Farmer Selections and Distribution of Planting material (Salamaua) A total of 1258 planting material was distributed to 55 farmers. Materials with inadequate planting material were given to Mr Ngasegom and Ngalau Aihi (ward councillor) for multiplication safe keeping before distributing to their farmers (Table 10) Table 10. List of participants and total varieties received at Salamaua site
Community Total Farmers Number of varieties
Lagui 48 37 Puakap 3 39 Asini 1 39 Kela 3 39 Mr Alinga Ngasenom 1 2 (BL/HW/26 & C5-216) Aihi Ngalau 1 2 (BL/HW/26 & C5-216)
Farmers in Lagui are encouraged to make their own selection based on observation on the growth performance on farm of a particular variety and give names to NARI team. Also during culinary test, farmers were also encouraged to take note of the names of the best eating quality varieties and rank them accordingly (Table 11). It was noted that PNG advance breeding line C4-150, C4-153 and BL/SM/143, BL/SM/148, BL/SM/43 and NT01 and NT02 were highly rated by farmers. Table 11. The top ten varieties highly rated by the farmers based on eating quality (Salamaua and Yonki)
Variety/Salamaua Rank quality Variety (Yonki) Quality
C5-353 1 Starchy, soft C5-245 Starchy, soft C4-153 2 Hard, starchy C5-353 Hard, starchy BL/SM/143 3 Hard starch C5-216 Hard starch BL/SM/148 4 Hard starch, sweet C4-150 Hard starch, sweet
NT01 5 Hard starchy, good for
market CE/IND/16 Hard starchy, good for
market
NT02 6 Hard starchy, good for
market C5-304 Hard starchy, good for
market BL/SM/149 7 Starchy, hard BL/SM/143 Starchy, hard
C5-191 220.83 31.33 0.67 good 22
CE/IND/14 216.67 43.33 2.00 poor 23
BL/SM/149 212.50 50.67 4.00 good 24
BL/SM/120 208.33 63.33 6.67 poor 25
BL/SM/43 208.33 58.00 0.67 good 26
BL/SM/104 200.00 33.33 1.67 good 27
BL/SM/132 183.33 62.67 3.33 good 28
C5-234 183.33 48.00 0.67 good 29
BL/SM/116 170.83 41.00 2.33 poor 30
BL/SM/151 166.67 46.67 3.00 excellent 31
BL/SM/152 79.17 28.00 1.67 poor 32
BL/SM/111 75.00 33.00 0.00 poor 33
BL/SM/136 35.00 28.33 0.00 poor 34
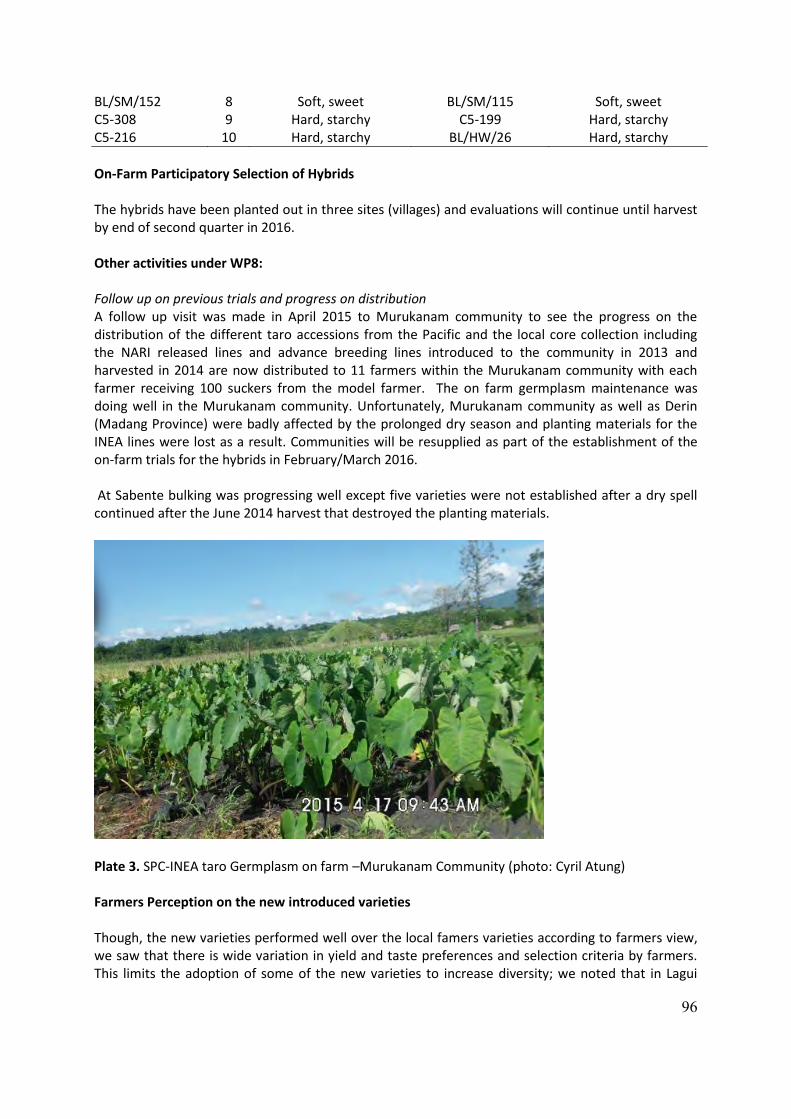
96
BL/SM/152 8 Soft, sweet BL/SM/115 Soft, sweet C5-308 9 Hard, starchy C5-199 Hard, starchy C5-216 10 Hard, starchy BL/HW/26 Hard, starchy
On-Farm Participatory Selection of Hybrids The hybrids have been planted out in three sites (villages) and evaluations will continue until harvest by end of second quarter in 2016. Other activities under WP8: Follow up on previous trials and progress on distribution A follow up visit was made in April 2015 to Murukanam community to see the progress on the distribution of the different taro accessions from the Pacific and the local core collection including the NARI released lines and advance breeding lines introduced to the community in 2013 and harvested in 2014 are now distributed to 11 farmers within the Murukanam community with each farmer receiving 100 suckers from the model farmer. The on farm germplasm maintenance was doing well in the Murukanam community. Unfortunately, Murukanam community as well as Derin (Madang Province) were badly affected by the prolonged dry season and planting materials for the INEA lines were lost as a result. Communities will be resupplied as part of the establishment of the on-farm trials for the hybrids in February/March 2016. At Sabente bulking was progressing well except five varieties were not established after a dry spell continued after the June 2014 harvest that destroyed the planting materials.
Plate 3. SPC-INEA taro Germplasm on farm –Murukanam Community (photo: Cyril Atung) Farmers Perception on the new introduced varieties Though, the new varieties performed well over the local famers varieties according to farmers view, we saw that there is wide variation in yield and taste preferences and selection criteria by farmers. This limits the adoption of some of the new varieties to increase diversity; we noted that in Lagui

97
village there is diversity already existed on farm, considering the type and number of variety grown on farm. At Asini there was very low diversity as Numkowe dominates the village backyard gardens and the main community garden at Kaiva Road. In Salamaua 50-80% of the farm cultivated, were planted with local Numkowe and Siasi while some varieties existed only in small plots for special purposes including seed, conservation, social and religious purposes. The reason behind Numkowe dominating the village gardens it is considered a special taro for special purpose such as church conventions and customary obligations. The new INEA lines have created interest among the community to increase taro production. Five farmers at Lagui were interviewed to get their perception of the new varieties after the 2014 March harvest. The farmers revealed that there was an increase in farmer number, from the initial farmers who had been given the planting materials in March reported that they had distributed the materials to their married sons and daughters. Some farmers reported that they have given out more materials after their own initial planting and harvesting. Those farmers are now preparing land for the second round of replanting for next year’s crop season and two farmers reported that they have increased their planting holes for the new varieties to 100. Mr Ngasegom and Philip Tufi said they now preparing a separate garden for these new varieties after planted and harvested their first (farmers own) plots. Mr Ngasegom who collected BL/SM/43, 148 and 143 stated that these three varieties are producing the best yield so far followed by C5-353. Similarly at Asini BL/SM/143,43, 136 and C5-353 were observed in three of the gardens. This was also confirmed by the lead farmer who started the distribution since 2014 harvest; he observed similar yield performances and recommended this to the three farmers who collected the materials from him. Asked why they prefer the varieties the farmers response was that they like the variety based on growth form, colour and yield and taste. Most farmers that visited the garden stated that most of the new varieties were “ross kappa” free which is a nickname given to taro leaf blight in Tok pisin. Publications/Conference participation Cyril Atung attended the World Congress on Root and Tuber crops held at Nanning, Guangxi Province, from 18-23 January 2015-and presented a posterr Titled “Participatory Evaluation and Selection of exotic Taro Genotypes in Papua New Guinea” Cyril Atung, Jeffrey Waki, Birte Komolong

98
2.14. CIRAD, 3rd clonal generation (A. Lequeux-Sauvage) The aim of this experiment was to measure the performances of 8 full-sib families in their third clonal generation and to compare their performances with the seminal generation (F1), first and second clonal generations (C1 and C2). The results were collected by Aurélie Lequeux-Sauvage for her MSc thesis. The experimental design was established in VARTC (Santo) in August 2014 and harvested in June 2015. Results from the previous experiments (F1, C1 and C2) have been published in INEA annual reports 2012, 2013 and 2014. Overall, 1800 plants in 60 plots were measured for: Suckers : number of suckers per plant
Stolons : number of stolons per plant Leaves : number of leaves per plant Height : of plant in cm Length : of the longest leaf Width : of the longest leaf Inflorescences : number per plant VGI obs : Vegetative Growth Index (observed) VGI pred : Vegetative Growth Index (predicted) VGI pred2 : second formula for VGI Corm weight : total fresh corm weight in grams Fresh weight : sample measured in grams Dry weight : sample measured in grams % DM : dry matter content in % fresh weight
Photo 1 : Field experiment for full-sib families in their third generation (VARTC, Santo). Table 1: Number of plants per family
Family no. Cross Female X Male
Number of hybrid plants in plots
32 HLB 01 X (VU 370 X ID 316) 30 × 12 (360) 31 HLB 11 X VU 1104 30 × 11 (330) 35 HLB 33 X (VU 370 X ID 316) 30 × 11 (330) 33 (VU 370 X ID 316) X ( ID 316 X VU HYB) 30 × 4 (120) 34 (VU 370 X ID 316) X V U 1859 30 × 5 (150) 36 (VU 370 X ID 316) X VU 1765 30 × 5 (150) 37 HLB 01 X (VU 370 X D 316) 30 × 3 (90) 38 (VU 370 X ID 316) X HLB 06 30 × 4 (120)

99
Figure 1: Blocks and repetitions for each treatment (family)
Figure 2: Plants layout with each family plot (1 X 1 m)
Table 2. Descriptive statistics in C3 population (all plants in all families. n = 1650)
Suckers Stolons Leaves Height Length Width Inflors
VGI Obs
VGI pred
VGI pred2
Corm g
% DM
mean 6.2 2.9 4.9 122.1 43.7 36.5 4.2 10581 1714 8985 782 28.3
std 5.2 5.3 1.2 22.9 8.4 6.9 6.7 6602 911 4583 546 23.7
cv% 83.9 182.8 24.5 18.8 19.2 18.9 159.5 62.4 53.2 51.00 69.8 83.7
Descriptive statistics for the whole C3 population are presented in table 2. Tremendous variation exists for the number of suckers, stolons and inflorescences per plant. Descriptive statistics for each individual family are presented in table 3.

100
Table 3. Descriptive statistics for each family, for vegetative traits
Family Suckers Stolons Leaves Height Length Width Inflos VGI pred
VGI pred2
Weight g
% DM
31 mean 4.2 5.46 5.18 117.26 42.91 35.67 3.27 1519.9 8083.6 749.5 26.5
std 1.36 1.09 0.23 9.36 2.25 1.87 1.03 292.0 1417.9 537.9 15.8
32 mean 7.99 0.72 4.55 127.86 45.72 38.06 8.25 1987.6 10303.9 706.3 20.9
std 1.26 0.57 0.37 11.62 3.45 2.86 2.23 439.4 2224.7 513.9 13.0
33 mean 7.19 3.94 4.44 128.31 45.27 37.56 3.82 1821.4 9678.7 600 25.5
std 1.12 0.51 0.24 8.41 2.41 1.6 0.41 359.0 1858.5 439.2 12.3
34 mean 3.19 6.59 4.86 103.05 38.78 32.05 2.17 1075.6 5882.1 700 28.6
std 0.49 1.56 0.37 10.04 2.57 2.04 0.45 217.3 1130.5 430.7 13.3
35 mean 5.12 3.6 4.99 128.69 46.39 39.12 5.52 1986.2 10318.8 848.6 20.7
std 0.92 1.28 0.41 5.84 1.67 1.57 1.45 201.3 1031.7 570.0 10.4
36 mean 6.03 3.4 5.34 133.78 48.51 39.41 4.05 2243.7 11665.3 1144.2 27.4
std 1.12 1.81 0.12 10.43 2.4 2.12 0.94 358.9 1812.8 686.4 11.5
37 mean 6.73 2.04 4.89 132.61 45.85 37.61 1.89 2009.4 10403.6 934.1 55.5
std 0.71 0.74 0.33 1.12 0.42 0.75 0.68 33.3 90.8 637.3 25.9
38 mean 7.39 0.31 5.28 118.02 41.56 34.59 2.48 1481.9 7741.6 777.9 30.2
std 1.77 0.32 0.37 13.21 1.61 1.05 0.62 244.1 1212.6 457.4 17.9
5.461
0.720
3.937
6.588
3.600
3.405
2.037 0.310
stolons
31
32
33
34
35
36
37
38
4.203
7.989
7.193
3.188 5.124
6.034
6.732
7.386
Suckers:
31
32
33
34
35
36
37
38
5.184
4.554
4.437
4.865 4.998
5.341
4.893
5.283
Leaves
31
32
33
34
35
36
37
38
117.260
127.864
128.314
103.046 128.699
133.780
132.614
118.024
Height
31
32
33
34
35
36
37
38

101
42.914
45.718
45.266
38.780 46.398
48.510
45.848
41.559
Length
31
32
33
34
35
36
37
38
35.668
38.064
37.558
32.052 39.122
39.412
37.605
34.593
Width
31
32
33
34
35
36
37
38
10086.338
11433.192
10427.571
6931.249 12611.88
4
14499.809
12114.208
9801.379
VGI obs
31
32
33
34
35
36
37
38
749.512
706.250
600.000
700.000
848.606
1144.231
934.103
777.885
corm weight
31
32
33
34
35
36
37
38
3.270
8.247
3.821 2.168
5.519
4.052
1.888
2.476
inflorescences
31
32
33
34
35
36
37
38
26.471
20.979
25.511
28.579
20.750 27.377
55.493
30.145
% DM
31
32
33
34
35
36
37
38

102
Table 4: Ranking of family means according to their VGI (vegetative growth index) with corresponding corm weight.
Family VGI obs
Family Corm
weight
36 14500
36 1144
35 12612
37 934
37 12114
35 849
32 11433
38 778
33 10428
31 750
31 10086
32 706
38 9801
34 700
34 6931
33 600
The spatial distribution of the mean VGI and mean corm weight per plot treatment (n=30), indicates that the experimental field layout gives a good control of the environmental conditions as there are no zones revealing significant differences. Mean VGI per plot across the field layout (Valateruru) in C3:
VGI Obs
1 2 3 4 5 6 7 8 9 10
A 12854 14745 10956 11838 8376 13098 9290 11505 10314 8099
B 11434 10127 10675 9166 8487 6313 9544 12460 11703 8623
C 7411 8442 6464 10974 10439 10872 8159 13467 8999 11953
D 14225 11335 4667 11530 14191 9516 9783 7674 8358 9080
E 7703 11082 13693 7569 5242 8287 9306 9054 8288 8603
F 11807 8694 8828 5801 10600 13091 11465 12430 16176 10228
Mean corm weight per plot across the field layout (Valateruru) in C3:
Corm weight
1 2 3 4 5 6 7 8 9 10
A 793 1008 803 1055 666 675 918 663 823 810
B 717 734 743 800 468 702 738 957 645 810
C 650 628 512 837 742 947 832 813 625 858
D 1033 712 643 957 1132 913 810 677 740 587
E 740 887 1277 638 480 582 803 823 442 780
F 680 723 812 680 733 690 930 1018 1283 758
It appears that there are no environmental factors (differences between blocks) interacting with the measurement of genetic factors (family values) and therefore, the results are reliable enough to compare these families. For each family, the values obtained in the third clonal generation, for each morphological trait, were compared with those obtained in the F1 (seminal) generation for the same trait. Results are presented in Table 5.

103
Table 5: Comparison of F1 and C3 values for each trait.
Family generation suckers stolons height length inflos VGIpred VGIpred2 weight
31 F1 2.5 6.9 76.4 34.7 1.2 605 3467 322 C3 4.2 5.5 117.3 42.9 3.3 1520 8084 750
32 F1 6.2 0.9 74.1 36 1.9 130 3913 299 C3 7.9 0.7 127.9 45.8 8.2 1988 10304 706
33 F1 6.6 5.9 73 32.6 1.1 411 2826 181 C3 7.2 3.9 128.3 45.3 3.8 1821 9679 600
34 F1 1.7 8.4 73.4 30.7 0.8 424 2650 165 C3 3.2 6.6 103 38.8 2.2 1076 5882 700
35 F1 3.3 6.0 93 37.8 1.9 903 4989 322 C3 5.1 3.6 128.7 46.4 5.5 1986 10319 849
36 F1 3.2 2.9 81.9 35.5 1.6 771 4045 375 C3 6.0 3.4 133.8 48.5 4.1 2244 11665 1144
37 F1 5.8 4.9 97.7 38.6 0.8 1052 5810 453 C3 6.7 2.1 133 45.8 1.9 2009 10404 934
38 F1 9.3 0.1 93.4 37.6 0.6 927 5088 355 C3 7.4 0.3 118 41.6 2.5 1482 7742 778
The number of stolons per plant is a deleterious trait that can be selected as early as the F1s. The number of inflorescences per plant is a deleterious trait because inflorescences are deforming the corm shape. Unfortunately, the number of inflorescences per plant across the different generations did not decrease.
Table 6: Means, standard deviation and covariances of the number of inflorescences per plant.
F1 C1 C2 C3
Mean 1.386 1.980 2.509 4.182
Std 2.233 2.987 3.660 6.661
Cov 161.139 150.861 145.859 159.278
1.386
1.980
2.509
4.182
R² = 0.9161
0.000
0.500
1.000
1.500
2.000
2.500
3.000
3.500
4.000
4.500
F1 C1 C2 C3
Generations
number of inflorescences per plant

104
Correlations between traits : Correlation coefficients: Corm weight X VGI obs: 0.62 Corm weight X VGI pred 2: 0.56 Corm weigh X VGI pred: 0.55
Table 7: Correlations between traits for all individuals in C3
Suckers Stolons Leaves Height Length Width Inflos
VGI obs
VGI pred
VGI pred2)
Weight
Stolons -0.42
Leaves 0.05 0.23
Height 0.34 0.12 0.58**
Length 0.18 0.19 0.65** 0.85**
Width 0.19 0.17 0.65** 0.86** 0.94**
Inflos 0.23 -0.06 0.12 0.31 0.28 0.26
VGI obs 0.07 0.17 0.66** 0.70** 0.79** 0.78** 0.26
VGI pred 0.10 0.09 0.48** 0.76** 0.87** 0.80** 0.31 0.92**
VGI pred 2 0.15 0.13 0.49** 0.78** 0.88** 0.81** 0.33 0.92** 1.00**
Weight 0.08 0.12 0.53** 0.50** 0.52** 0.51** 0.10 0.62** 0.55** 0.56**
%DM 0.06 -0.07 0.20 0.12 0.11 0.13 -0.14 0.03 0.02 0.02 0.11
Correlation coefficients for individual hybrid plants between F1 and C3: Suckers: 0.48 Stolons : 0.49 Height: 0.20 Length: 0.16 Inflorescences: 0.32 VGI pred: 0.20 VGI pred2: 0.18
y = 0.0497x + 280.75 R² = 0.3873
0
500
1000
1500
2000
2500
3000
3500
4000
4500
0.00 5000.00 10000.00 15000.00 20000.00 25000.00 30000.00 35000.00 40000.00 45000.00
VGI obs
correlations between corm weight and VGI in C1, C2, C3

105
Conclusions Stolons are considered as deleterious traits and it is easy to eliminate plants producing them as early as the seminal generation. The number of suckers is also a trait fairly easy to select in F1. Surprisingly, it appears that the number of inflorescences per plant doesn’t decrease with successive clonal generations. F1 seedlings producing inflorescences should therefore be eliminated as this trait deforming the corms of dasheen type genotypes is preserved in successive clonal generations. The VGI is a suitable multi-trait index for the selection of dasheen type genotypes at an early stage and can be used to speed up the selection process. The experimental field design used in this study (subplots of 30 plants) and randomized incomplete blocks, offer a good control of the environment and a good assessment of the genetic variance, within and between families.

106
2.15. CIRAD, DNA fingerprinting (Hana Chaïr, Laurent Soulard) In 2015, the activities to investigate further the genetic diversity of taro were continued. Also, progresses were made on the genetic mapping and identification of QTLs related to important traits. Finally, we have also initiated activities on development of new set of markers to complement those identified in order to solve the difficulties encountered due to the taro genome size and the absence of reference genome. Genotyping of Colocasia esculenta accessions: The work on the assessment of the genetic diversity and ploidy level of all the varieties received from INEA partners was achieved. The results of this work have been reported in manuscript which has been submitted to PLOS ONE. The manuscript has been accepted for publication with revisions: Genetic diversification and dispersal of taro (Colocasia esculenta (L.) Schott). 2016. H. Chaïr, R. E. Traore, M.F. Duval, R. Rivallan, A. Mukherjee, L. M. Aboagye, W. J. Van Rensburg, V. Andrianavalona, M.A.A. Pinheiro de Carvalho, F. Saborio, M. Sri Prana, B. Komolong1, F. Lawac and V. Lebot. Abstract: Taro (Colocasia esculenta (L.) Schott) is widely distributed in tropical and sub-tropical areas. However, its origin, diversification and dispersal remain unclear. While taro genetic diversity has often been documented at the country or regional level in Asia and the Pacific, few data are available on Americas and Africa where it was supposed to have been introduced through human migration. We used eleven microsatellite markers to investigate the diversity and diversification of taro based on sample covering nineteen countries on four continents (Asia, the Pacific, Africa and America). The highest genetic diversity and number of private alleles were observed in samples from Asia, mainly India in comparison with other continents. While taro has mostly been diversified in Asia and the Pacific via sexual reproduction, clonal diversification appeared to be predominant in the African and American countries investigated. Bayesian clustering led to a first genetic group of diploids from the Asia-Pacific region and to a second diploid-triploid group mainly from India. Admixed varieties between the two genetic pools were also found. In West Africa, varieties were found to have originated from India with only one multi-locus lineage assigned to the Asian pool, while varieties in Madagascar originated from India and Indonesia. The South African varieties shared lineages with Japan. The Caribbean Islands varieties were found to have originated from the Pacific, while in Costa Rica they were from India or admixed between Indian and Asian groups. Taro dispersal in the different areas of Africa and America is thus discussed in the light of available records of voyages and settlements.

107
Genetic diversity of taro using chloroplastic markers While the use of nuclear markers led to the assessment of the genetic diversity and diversification of taro, we used the chloroplastic sequences to investigate its origin and dispersal. The work has been done in the framework of master thesis by Sitti-Anlati MOUSSA. Main results The genetic diversity and diffusion of taro (Colocasia esculenta) was investigated using NGS sequencing of chloroplast markers. Six chloroplast locus (trnK intron, trnY-IGS-trnE, IGS between trnT and psbD, petD-IGS-rpoA, trnL (UAA)-trnF, rpl32-trnL (UAG)) were used to analyse 151 accessions from 19 countries and four continents, Asia, Africa, America and Pacific. The highest haplotypic diversity was obtained in Asia (Hd=0.65) specifically in India and the lower was obtained in Pacific (Hd=0.24). Those chloroplast markers revealed great intraspecific gene diversity in the different countries. The phylogenetic tree and the haplotype network have revealed three distinct haplotype groups that have highly diverged. The results did not show any strict relationship between the geographic distribution and genetic diversity. However the geographical distribution of haplotypes allows the identification of the origin area of the ancestor of each accession and shows that the diffusion of taro from Asia to other countries follows a specific pattern. We distinguish a haplotype
Figure 1: Unrooted neighbor-joining tree, based on 11 microsatellite markers, using Dice distance, showing genetic relationships among 136 UG and MLL. Each node label is colour-coded according to membership in the two clusters C1 and C2 identified by STRUCTURE. Genotypes assigned to admixed groups are shown in black. Outer circles are colour-coded according to sub-clustering within Clusters 1 and 2. Genotypes assigned to admixed after sub-clustering are shown in black.

108
commonly present in the four continents, haplotypes specific to Asia, and haplotypes spread in Africa and America and Indian Ocean. Our study allows us to hypothesize that taro sampled in Africa,
America, Pacific and Japan originated from India. However, we cannot confirm with certainty, the ways followed by taro from India to these continents. Further analyses are still going-on. Phenotypic data analyses: Heritabilities, correlation and correspondence between morphological traits is part of Laurent Soulard PhD thesis. The aim of the study was to investigate heritability, correlation and correspondence of growth, yield and corm quality-related traits through a breeder-friendly design (natural size blocks) in conjunction with a better consideration of spatial and environmental effects. The study wass based on the F1 (Feb-Nov 2012) and C1 (Dec 2012-Sept 2013). The results of this work will be published in: Evaluation of vegetative growth, yield and quality related traits in taro (Colocasia esculenta [L.] Schott). Laurent Soulard, Philippe Letourmy, Tuong-Vi Cao, Floriane Lawac, Hâna Chaïr and Vincent Lebot. Crop Science, Vol. 56, May-June 2016. Abstract Taro (Colocasia esculenta [L.] Schott) breeders apply heavy selection pressure on yield during the seminal (F1) and first clonal generations (C1). However, the genetic gain achieved with this practice has never been evaluated and prior accurate assessment of the genetic control of the traits under selection is required. The present study aimed at evaluating broad sense heritability, between-trait and between generation correlations, and genetic gain for traits related to vegetative growth, yield, and corm quality. A fully randomized-block trial consisting of 13 full-sib families (1890 genotypes) was set up and measured in F1 and C1 generations. ANOVAs were performed with mixed models, considering spatial autocorrelations when necessary. Chi-square tests revealed the stability of the presence or absence of stolons, suckers, and inflorescences between F1 and C1, suggesting strong genetic control for such organs. Highly fitted models resulted in particularly accurate predicted genetic values. Heritability and genetic gain computations assumed unbalanced data and gave rather high values. The number of stolons, the number of suckers, fresh corm weight, and dry matter
Figure 2 : Chlorotypes distribution between the countries investigated

109
content were found to be the most heritable traits. Mass and family selection strategies were tested and revealed moderate to high genetic gain for most heritable traits in both generations. Selection indexes such as the vegetative growth index and future breeding strategies are discussed. Results could be of interest for breeding in other aroid crops. Genetic mapping and QTL identification The data analysis on both families was continued: F31 (266 progenies produced from crossing HLB11 x VU006) and F32 (292 produced from crossing HLB01 x (VU370xID316)). Initially, the SNP calling performed with the non reference GBS pipeline UNEAK 3.0 generated 22,734 raw SNPs for F31 and 16,744 for F32. Therefore SNPs were filtered on the total read depth per site (8x). After inclusion of 14 SSRs to the dataset, individuals and markers were filtered on missingness (<40% for bridge SNPs, <20% for specific SNPs) with VCFtools 0.1.12b, and on segregation distortion (X²<30) with Joinmap 4.1. Finally, 94 individuals and 747 markers for F31, along with 93 individuals and 826 markers for F32 were selected for mapping with Joinmap 4.1. In total, 596 (F31) and 559 (F32) markers were successfully assigned to 14 linkage groups by Joinmap 4.1 (as expected for the x=14 chromosomes in taro), with an independence LOD threshold of 11.0 and 8.0 for F31 and F32 respectively. After final assignment, homologous chromosomes revealed a high number of bridge markers, namely 459 SNPs and 9 SSRs. Markers were evenly distributed over the linkage groups ranging in size from 90 to 15 markers for F31 and from 92 to 12 markers for F32.
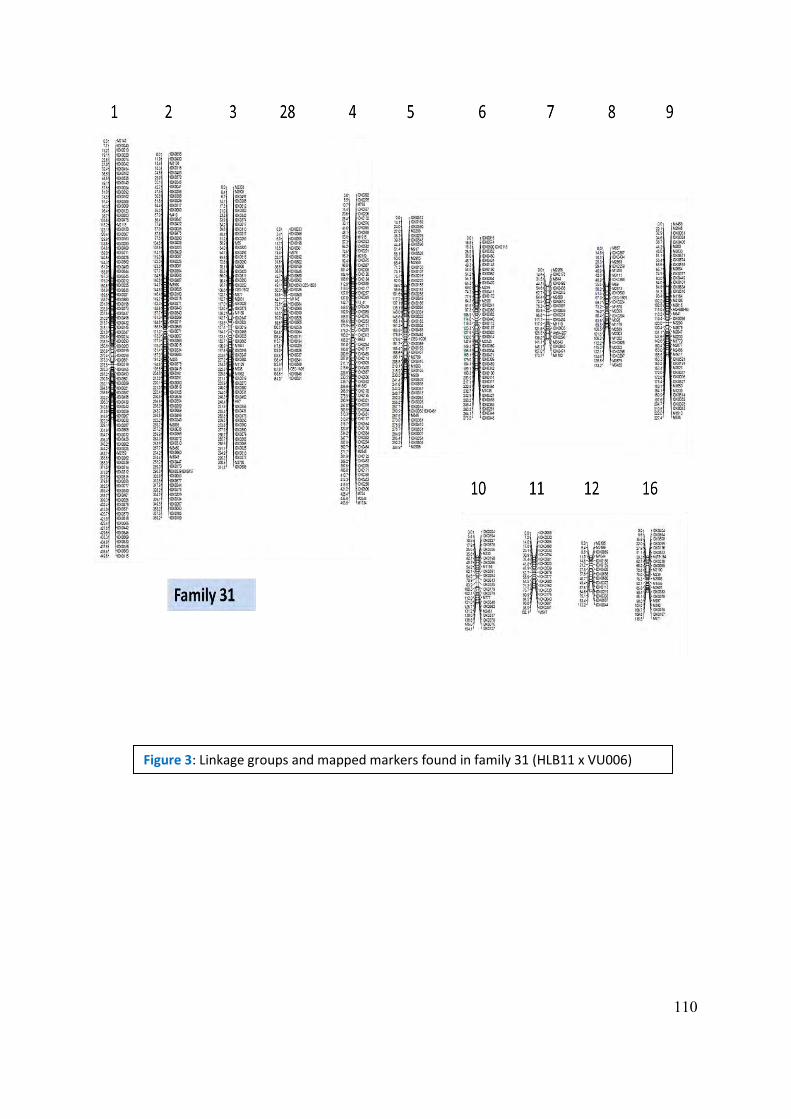
110
Figure 3: Linkage groups and mapped markers found in family 31 (HLB11 x VU006)

111
QTL detection analysis were conducted on both progenies with MapQTL 6, using the maps previously constructed with Joinmap and phenotypic data for several traits related to vegetative growth (plant height, number of leaves, stolons, suckers…), corm yield and corm quality (shape, colour, dry matter content…). At the moment, the test was only conducted on the first clonal generation (C1) with the Kruskal-Wallis method for Normal distributed variables and with Interval mapping for the other variables. After calculation of a significance threshold value with a permutation test, putative QTLs were identified for plant height, leaf length and width, number of inflorescences. No QTLs were detected for the fresh corm weight or the dry matter content. Correlations among traits seemed to be confirmed by these preliminary results. QTL detection for the seminal generation (F1) will also be explored in order to test the stability of QTLs we have detected.
Figure 4: Example of QTL detection: QTL related to leaf width.

112
2.16. University of Maribor (Janja Kristl, Anton Ivancic) Breeding and on- farm participatory selection and evaluation (Anton Ivancic) Hybridization and evaluation of hybrid progenies took place in several countries (INEA partners). We assisted the breeders with the needed information (correspondence via e-mail, assistance with literature). The most frequently discussed problems, during this period, were schemes and techniques of genetic recombination, absence or slow seed germination, and slow growth of seedlings. Seed germination appears to be a serious problem in Xanthosoma. The coordinator of the breeding activities, A. Ivancic, visited NARI (the Momase Regional Centre at Bubia and the Highlands Regional Centre at Aiyura). As a principal aroid breeder at Bubia, in early 1990s, he introduced modified phenotypic recurrent selection. This approach has been found to be the best solution for complex situations where breeders have to improve several qualitative and quantitative traits more or less simultaneously (e.g., yield quantity and quality, several diseases and pests, adaptability different environment (paddy and/or upland conditions, tropical lowlands, high altitudes, draught)). Currently, they are at the cycle-5 and preparing the cycle-6 population. The climatic conditions at Bubia appear to be favourable for taro hybridisation, and the presence of all major pests and diseases enables efficient selection. In 2015, a part of the produced (true) seed was distributed to other partners of INEA. Practical problems associated with taro breeding in 2015: 1. Absence of flowering, poor flowering and hybridisation failure Based on previous experience and communications with INEA partners, we analysed 20 possible reasons. Here is the list: (1) flowering starts when plants are too old - it often happens because the plants were sprayed with GA3 very late, or the growth was stopped due to various reasons (e.g., drought or serious damage of leaves) and then it re-started; (2) plants are too weak, usually with very small inflorescences (on the Malaita Island in the Solomon Islands, there are so called 'female taros' which are normally bisexual but small, with many side cormels and small inflorescences which rarely produce seed - if we wanted to get seeds, we had to remove the developing side cormels and carefully apply GA3); (3) too much rain or continuous sprinkler irrigation during flowering; (4) severe drought; (5) plants were fertilized with too much nitrogen; (6) serious infection with viral or other leaf pathogens, or pests; (7) inappropriate period of the year (in the tropics we tend to plant (or replant) the parental material for crosses at the beginning of the rainy season which is also the warmest period of the year, so that flowering takes place when it is wet and hot; (8) some cultivars never flower; (9) polyploidy - there are serious problems with triploids – usually we do not use triploids as female components in crosses; (10) extreme shade; (11) nutrient deficiency (poor soil or competitive root system of the nearby shrubs or trees); (12) the entire or too big portion of corm was used for replanting (one should use normal head set of the main or side cormels), or planting was too deep; (13) the concentration of the applied GA3 was too high (in this case, some of the leaf petioles or parts of leaf petioles become yellowish and resemble the upper part of spathe);
113
(14) inadequate pH; (15) heavy soil prevented normal development of the root system; (16) high altitude (around the equator, according to our experience, the altitude should not exceed 1500 m); (17) salinity; (18) weeds, especially climbers may cause serious problems; (19) parental material was brought from a completely different environment (from the highlands to the lowlands or vice versa); (20) dryland genotypes are growing in paddy fields or vice versa. 2. Reasons for the absence of germination, poor or erratic germination The second major practical is seed germination. Here is the list of possible reasons for the absence of germination, poor or erratic germination: (1) the harvested seeds were not mature; (2) harvest took place too late (fruit heads were already dry), (3) seeds were not properly extracted; (4) seeds were planted immediately after harvesting (without proper extraction and drying); (5) after harvest, seeds were not properly washed; (6) drying took place more than a week, in wet conditions; (7) wet harvested seeds were exposed to direct solar radiation; (8) too high temperature was used for drying (the temperature should not exceed 35 °C); (9) too deep planting; inappropriate soil (pure sand, heavy clay, salinity, high concentration of artificial fertilisers, ….); (10) dry soil; (11) too wet soil; (12) algae on the soil surface; (13) soil was infected by harmful microorganisms or pests; (14) too low temperature (the temperature should not be below 12 °C, for fast germination it should be above 24 °C); (15) too big differences between day and night temperatures; (16) low air humidity; (17) exposure of germinating seeds to direct sun (in the tropics); (18) too old seeds; (19) seed storage was inappropriate. Physico-chemical characterization of corms of selected genotypes (Janja Kristl) In 2015, the main activities in physico-chemical analysis of corms of selected taro cultivars were:
1. Determination of total nitrogen (and calculated crude proteins) and starch content in 200 samples from Madeira.
2. Statistical evaluation of the results of nitrate content in taro corms and its distribution within corms of selected taro genotypes from Vanuatu; writing and submitting the paper to an international journal.
3. Finalizing the PhD thesis. 4. Determination of minerals, starch and total nitrogen content in 21 samples of taro corms
from Madagascar. 5. Optimization of extraction procedure and HPLC determination of soluble and total oxalate
content in different parts of taro corms from Vanuatu. 6. Determination of minerals, starch and total nitrogen content in taro samples from Nigeria,
Philippines, Kenya, South Africa, Cuba, Burkina Faso, Nicaragua, and Trinidad and Tobago were not realized as we did not receive the samples.
Determination of total nitrogen (crude proteins) and starch content in 200 samples from Madeira: In 2015, we completed the analysis of total starch and nitrogen (and calculated crude proteins) content in taro samples from Madeira. We analysed 35 accessions; in each accession, there were 3 control samples and 3 samples of plants exposed to drought stress. The results indicated that drought stress increased crude proteins in taro corms. The results were sent to our partners from Madeira for further evaluation.

114
Nitrate content in taro corms and its distribution within corms of selected taro genotypes from Vanuatu: Based on WP3 (Breeding and on farm participatory selections and evaluation) and WP 6, we prepared a paper which has already been accepted for publication in the Journal of Food Composition and Analysis. Janja Kristl, Anton Ivancic, Andrej Mergedus, Vilma Sem, Mitja Kolar, Vincent Lebot. Variation of nitrate content among randomly selected taro (Colocasia esculenta (L.) Schott) genotypes and the distribution of nitrate within a corm. Journal of Food Composition and Analysis (available at: http://ac.els-cdn.com/S0889157516300060/1-s2.0-S0889157516300060-main.pdf?_tid=a56503f4-c5b9-11e5-bf79-00000aab0f01&acdnat=1453983863_0de2e7b280395eff83ceea02d702ffed) Finalizing PhD thesis The PhD candidate Andrej Mergedus has finalized his thesis. A written thesis has to be approved by the 4 members commission before the candidate can defend it. The commission will prepare the final report before mid-March 2016. The content of minerals, starch and crude proteins in taro samples from Madagascar Minerals, starch and total nitrogen content was determined in 21 taro samples from Madagascar. The varieties were collected from 6 villages: Niarovana Caroline, Miarinarivo Itasy, Ifanadiana, Ambohimahitsy, Antsirabe Betafo, and Ilaka Est. The oven-dried taro samples were milled into fine powder using titanium mill. The determinations then followed standard laboratory procedures that were optimised and used for analysing taro samples in previous years. The protein content was calculated from the percentage of nitrogen multiplied by 6.25 (N(%) × 6.25). The results are expressed on dry weight basis (DW). The mean values of two duplicate analysis of each mineral, starch and crude proteins in taro cultivars are presented in Table 1. The crude proteins content ranged from 1.93% in 'Saonjo mamy' to 14.0% in 'Ramandady mavo' grown in Ambohimahitsy. The mean value of 21 taro cultivars was 5.44% (Table 2). The average protein content was higher when compared with the average value obtained for ten taro cultivars from Papua New Guinea (3.72%). The starch content varied from 41% ('Tadinipiso') to 75% ('Brickaville'). The content of Mg, Ca, K and P was in the range from 638 mg/kg ('Saonjo mamy') to 1563 mg/kg ('Ramandady menakely'), 552 mg/kg ('Madarasy') to 4364 mg/kg ('Tadinipiso'), 0.32% ('Saonjo mamy') to 1.13% ('Ramandady fotsy' grown in Antsirabe Betafo), and from 0.11% ('Amerikana' and 'Saonjo mamy') to 0.51% ('Soagnara'). The concentration of Zn in cultivars 'Soamamy mena' (352 mg/kg), 'Tadinipiso' (340 mg/kg), 'Ramandady mavo' (grown in Miarinarivo Itasy, 210 mg/kg), 'Ramandady mavo' (grown in Ambohimahitsy, 181 mg/kg), 'Betaniazo' (174 mg/kg), and 'Ramandady fotsy' (164 mg/kg) was much higher when compared with the published data (3-63 mg/kg). The content of Mn was relatively low and ranged from 0.47 mg/kg ('Soampotsy') to 70.7 mg/kg ('Saonjo mamy') with mean value of 12.4 mg/kg. In most of the anlysed cultivars, the Fe concentration was higher when compared to published data (6-18 mg/kg).

115
Table 1: The content of some of the most important minerals, total starch and crude proteins in taro cultivars from Madagascar.
Cultivar Mg (mg/kg) Ca (mg/kg) K (%) P (%) Zn (mg/kg) Mn (mg/kg) Fe (mg/kg) Cu (mg/kg) Proteins (%) Starch (%)
Niarovana Caroline
Soagnara 1226e 977h 0.46k 0.51a 93.8i 37.6b 39.3c 10.06b 8.21c 65efghi
Madarasy 1370b 552m 0.66f 0.31g 71.5m 5.78jk 18.4f 5.34h 5.13h 67defg
Soampotsy 1063gh 837i 0.46k 0.25kl 109g 0.47o 15.6g 7.62de 2.92l 66defgh
Tadinipiso 1282cd 4364a 0.52i 0.23m 340b 1.70mn 27.1e 17.4a 2.88l 41m
Betaniazo 1101fg 2384c 1.11b 0.44c 174e 7.89i 26.8e 7.52e 5.11h 58k
Brickaville 750j 822ij 0.42l 0.28ij 89jk 1.62mn 27.7e 8.61c 3.79k 75a
Miarinarivo Itasy
Ramandady mavo 936i 1228g 0.53hi 0.31g 210c 2.28m 12.9h 8.50c 2.92l 63ghij
Ramandady vangamena 1254de 687k 0.55g 0.29hi 29.7r 9.37h 20.3f 5.90g 5.03h 71abc
Ramandady fotsy 1262cde 695k 0.53hi 0.33f 164f 6.09jk 20.8f 6.40f 4.98h 73ab
Saonjo gasy fotsy 1309c 667k 1.04c 0.43c 92ij 7.93i 36.1d 6.43f 6.47e 59jk
Ifanadiana
Soagnara 1089fg 773j 0.46k 0.46b 45.9p 20.5d 27.0e 7.97d 6.20f 68cde
Ramandady mavo 1077fg 602lm 0.55g 0.27j 61.8n 3.69l 15.9g 5.65gh 3.97jk 63fghij
Soamamy mena 1076fg 1706d 0.79e 0.40d 352a 5.50k 27.3e 7.31e 5.85g 61ijk
Saonjo fotsy 1083fg 1753d 0.52i 0.24lm 77.8l 5.59jk 19.2f 5.87g 4.05j 70bcd
Ambohimahitsy
Amerikana 697k 648kl 0.35n 0.11n 103h 14.3e 26.9e 1.50k 4.10j 67cdef
Ramandady mena 1529a 1314f 0.54gh 0.25k 85.9k 10.2g 26.1e 1.44k 6.91d 48l
Ramandady menakely 1563a 934h 0.50j 0.36e 104h 6.37j 42.8b 2.34j 8.85b 62hij
Saonjo gasy fotsy 1517a 2513b 0.39m 0.26k 52.9o 1.00no 28.8e 1.31k 6.60e 59jk
Ramandady mavo 1019h 1295f 0.87d 0.43c 181d 27.9c 60.3a 2.72j 14.0a 46l
Antsirabe Betafo
Ramandady fotsy 1123f 1425e 1.13a 0.30gh 62.5n 13.4f 26.8e 3.97i 4.37i 58k
Ilaka Est
Saonjo mamy 638l 665k 0.32o 0.11n 86.5k 70.7a 28.4e 0.34l 1.93m 69bcde
Values with a different letters within the same column denote statistically significant differences (Duncan’s test, p < 0.05). (Duncan at confidence level 0.95)

116
Table 2: Means, maximum and minimum values and coefficients of variation of analyzed parameters in 21 taro cultivars form Madagascar.
Mean Minimum Maximum CV (%)
Mg (mg/kg) 1141 638 1563 22.0 Ca (mg/kg) 1278 552 4364 69.9 K (%) 0.60 0.32 1.13 39.5 P (%) 0.31 0.11 0.51 33.3 Zn (mg/kg) 123 29.7 352 70.2 Mn (mg/kg) 12.4 0.47 70.7 130 Fe (mg/kg) 27.4 12.9 60.3 38.6 Cu (mg/kg) 5.91 0.34 17.4 64.1 Crude proteins (%) 5.44 1.93 14.0 47.9 Total starch (%) 62 41 75 14.6
Optimization of extraction procedure and HPLC determination of soluble and total oxalate content in different parts of taro corms from Vanuatu We studied the effects of different factors such as solvent, temperature, extraction time and sample mass/extraction volume ratio to determine optimal extraction conditions for soluble and total oxalate. The concentration of oxalate in taro extracts was determined by liquid chromatography after optimization of chromatographic separation. When considering the overall averages of water soluble oxalate, the results indicated that there were highly significant differences between central, marginal and upper parts of taro corm. The highest mean value was determined in the central (157 mg/kg DW) and lower parts (158 mg/kg DW), followed by the marginal (124 mg/kg DW), and upper parts (120 mg/kg DW). No significant differences were found in the water soluble oxalate content between the marginal and upper parts. The total oxalate content was not significantly different in central (183 mg/kg DW), marginal (184 mg/kg DW) and lower parts (189 mg/kg DW). The lowest mean value was determined in upper parts (156 mg/kg DW). Future work: determination of water soluble and total oxalate content in taro corms collected in various stages of development (maturity), from 5 to 13 months after planting.

117
2.17. University of Madeira (Miguel de Carvalho) Study of drought tolerance in taro genotypes (elite cultivars and seedlings) In the framework of the project Europe Aid / 128-500/C/ACT/TPS, "Adaptation of vegetative propagated crops to climate change and trade", the partner 5, University of Madeira is in charge of the WP 5, titled “Evaluation of drought resistance of elite cultivars and seedlings”. During WP execution, as shown in the last report, progress was made in the definition of drought conditions for taro, water needs, evaluation of the plant behaviour under drought conditions, using morphological, physiological and biochemical traits, and ranking and classifying 34 cultivars for drought tolerance.
The WP 5 team developed also suitable protocols for drought tolerance screening. During 2015, the WP goals were: a) Realization of 2nd assay with a smaller number of accessions (12 + 4 accessions), including the
taro standards to validate drought tolerance results. b) Nutritional and biochemical analysis completion for 1st assay samples. c) Data analysis and preparation of results for publication. This report aims to summarize the most important WP achievements during 2015. 1 – 2nd drought stress field assay: During WP execution, the screening of 34 taro elite and local cultivars was done, using traits that were specifically associated with the drought stress (see interim report 26.ISOPlexisCP14.03_EUAid.WP5.IPReport040215). Twelve taro cultivars showing different stress responses (table 1), were included in a new field assay to validate the results of drought tolerance assessment obtained, during the first assay. Four accessions originated from Papua New Guinea (PNG) were included for stress tolerance evaluation for the first time (Table 1). Table 1 – Table shows accession number used by ISOPlexis Genebank, name and geographical origin of the cultivars included in the 2nd drought stress essay.
Acession Variety name Origin Classification
2061 Blanco Saucero Canary islands- La Palma Tolerant, high yield
2216 Branco Madeira Island Tolerant, high yield
2186 Kolokasi Cyprus Tolerant, high yield
2239 Karang CE/MAL/10 SPC, Fiji Tolerant, medium yield
2234 C3-22 BL/PNG/11 SPC, Fiji Resistant, low yield
2056 Listado Canary islands- La Palma Resistant, low yield
2244 Boklua CE/THA/24 SPC, Fiji Resistant, low yield
2210 Roxo Madeira Island Resistant, low yield
2232 PExPH 15-6 BL/HW/0 SPC, Fiji Sensitive
2208 Branco Madeira Island Sensitive
2062 Barranquera de los Sauces Canary islands- La Palma Sensitive
2246 Takenoko-Imo CA/JP/08 SPC, Fiji Sensitive
2443 KPOSN 246 PNG Unknown
2446 KPOKP 24 PNG Unknown
2449 KPOSN 24 PNG Unknown
2452 BC 765 PNG Unknown
118
Experimental design: The trial was fully completed in 2015, in a greenhouse in the Preces experimental station. The experimental design was a factorial experiment with two factors: irrigation level and cultivar. Plantation occurred in February 2015. In total, 24 plants were used per accession, individually cultivated in pots. For statistical purposes, each pot has treated as a single plant plot. The pots were deployed in 6 rows, with row to row and pot to pot distances of 0.9 m and 0.3 m, respectively. Each row had 4 pots from each accession, and functioned as assay replicates. Three were used for control and 3 for stress conditions, making 3 replicates for control and drought conditions each. Irrigation was delivered using drip irrigation. Due to lack of available plants, PNG accessions were replicated only once in control and drought conditions. In total, 329 plants were tested. Stress conditions were imposed at the end of April 2015 until harvest, which occurred in December 2015. After analysis of the data from the 1st drought field assay, and plant water use monitoring has decided to irrigate plants in control with 20 mm/day, through all the assay, and plants in stress conditions with 10 mm/day at the beginning experimental period, decreasing to 7.5 mm/day and 5 /day in the final months. Chlorophyll content (CCI) and 11 morphological, biomass and yield parameters validated for association, with stress tolerance, in the last assay, were measured at harvest, in all plants. Besides, 4 of the morphological parameters and CCI were measured in all plants when stress was imposed, and after 3 months of stress imposition. Soil moisture, irrigation and atmospheric parameters (temperature, relative humidity, and photosynthetically active radiation) were monitored regularly. Plant Water Use was monitored at regular intervals. A total of 12388 data points (excluding atmospheric parameters) were taken. 2 – Completion of 1st drought stress samples biochemical analysis One of the WP goals is to find biochemical markers that could be correlated with stress tolerance or susceptibility and use for fast plant material assessment. Samples obtained from the 1st drought field assay were used in the analysis of biochemical composition, focusing in content of starch and protein fractions. This work has performed by our partners from Maribor University (WP 6). Results were obtained during 2015, and are shown in table 2. A preliminary multivariate analysis was performed. Significant differences were found in both parameters, between control and stress conditions, showing that drought stress determines the enhancement of protein content and decrease in starch accumulation. An interim report has elaborated reporting more detailed the results of this work (see: 26.ISOPlexisCP13.04_EUAid.WP5&6.IPReport140715). A limited number of samples were also submitted to isotope analysis, to determine 13C/12C and 15N/14N ratios. Sixteen samples from 2 accessions (one local and one obtained from SPC) were selected for a pilot test, distributed 12 samples from above dried ground tissue (3 from control and 3 from stress conditions for each accession), and 4 from dried corm tissue (1 from control and 1 from stress conditions, for each accession). Preliminary data analysis show significant differences of both parameters between accessions and between experimental variants. However, these results are preliminary and needed to be confirmed. The isotope ratios appear to be good and perspective candidates for biochemical markers that could be used in the screen of crop material for drought tolerance. A new set of isotope analysis will be realized in 2016, using the plant samples from 2nd assays to assess the taro drought tolerance.

119
Table 2 – Variation of protein and starch content in taro corms grown under well-watered (control) and non-watered (stress) conditions.
Protein (%) Starch (%)
Accession (ISOP)
Control Drought % Drought Control Drought % Drought
2056 2.38 6.18 259.75 35.28 42.83 121.41
2057 2.57 7.64 296.71 44.28 49.54 111.87
2058 2.03 6.27 308.13 65.79 38.78 58.94
2060 4.26 12.14 285.21 58.25 39.63 68.04
2061 4.39 6.23 141.78 63.53 59.80 94.13
2062 6.52 11.44 175.65 28.23 20.44 72.42
2183 2.27 4.36 191.59 55.62 55.29 99.40
2184 3.66 19.90 544.18 56.11 28.67 51.09
2186’ 4.23 7.87 186.10 53.87 38.42 71.33
2207 2.11 7.52 356.45 44.91 53.68 119.52
2208 3.28 10.10 307.54 47.46 29.58 62.32
2209 4.23 12.32 291.40 60.64 22.43 36.99
2210 1.91 5.74 299.98 55.42 65.87 118.87
2211* 3.44 8.48 246.29 58.50 26.59 45.46
2212 3.04 7.71 253.60 55.75 54.81 98.32
2213 5.45 9.58 175.89 57.10 30.05 52.62
2214 2.50 7.89 315.37 66.80 43.85 65.65
2215 2.90 8.04 277.36 60.78 60.46 99.48
2216 11.86 9.33 78.67 32.15 45.31 140.95
2232 2.57 12.01 466.80 51.38 54.69 106.44
2233 1.84 7.65 415.63 62.81 60.21 95.87
2234 1.68 6.37 378.55 70.67 56.76 80.31
2235’ nd nd Nd nd nd nd
2236 2.87 14.35 500.37 69.57 63.37 91.08
2237 nd nd Nd nd nd nd
2238 3.21 12.17 378.91 72.32 51.61 71.37
2239 4.02 10.06 250.59 53.87 43.54 80.82
2240 3.94 13.38 339.66 59.22 44.01 74.32
2241 5.07 10.75 211.82 64.05 51.63 80.61
2242 2.53 10.27 406.20 41.82 55.84 133.52
2244 2.69 8.15 302.94 63.77 60.85 95.42
2245 4.60 14.84 322.61 52.55 47.07 89.57
2246* 7.20 13.89 193.04 52.80 42.66 80.79
2243 R1 1.31 8.58 654.26 68.38 62.74 91.75
2243 R2 2.93 9.38 320.59 63.77 52.10 81.71
Mean 3.62 9.72 307.08 55.98 47.06 86.13
SD 2.00 3.24 119.02 10.82 12.48 24.97
Min. 1.31 4.36 78.67 28.23 20.44 36.99
Max. 7.20 19.90 654.26 72.32 65.87 140.95

120
3 – Taro sample harvest and processing for biochemical analysis An effort was made to preserve samples from the current assay for further biochemical and nutritional studies. Research team expect with this additional work confirm obtained results for variation of starch and protein content under stress conditions, and also expand the number of nutritional parameters analysed, with ultimate goal to increase the knowledge about the drivers of drought tolerance (e.g. drought conditions, water use, and biochemical and physiological basis) in this crop. We intend also to analyse more crop samples to determine the variation of 13C/12C and 15N/14N ratios, in order to obtain more reliable results, and validate them as stress tolerance markers. If possible, new parameters (e.g. specific proteins and amino acids content) and techniques (e.g. NIRS) will be tested in the analysis of samples generated from drought assays. Take in consideration these goals, fresh corm and above ground leaf and petiole samples were harvest and stored. Always as possible, one dried and one fresh sample from corm, leaf and petiole per plant were stored. Samples were stored as dry material where dried at 65ºC. All samples were packed and sealed under vacuum before storage. Dried and fresh samples were stored frozen at -35ºC. Those include 319 dried and 310 fresh corm samples, and 299 dried and 252 fresh above ground samples. 4 – Data treatment and results publication In 2015, a poster communication of the assay results has presented at AGRI 2015 Symposium, in Amsterdam and published in journal Procedia Environmental Sciences. Results of 1st drought assay, accessions screening and identification of crop standards for stress assessment are in the final stages of preparation for publication, probably in the Journal of Experimental Botany. Further efforts with data treatment and statistical analysis will be made to use the biochemical and nutritional data and 2nd drought assays results for a publication, during 2016. Results from the 2nd field assay, will be treated and correlated with the results from the first assay. We expect to validate select taro standards for drought tolerance and susceptibility and classify PNG taro cultivars. Stress Tolerance Index (STI) and Stress Susceptibility Index (SSI), Water Use (WU) and Water Use Efficiency (WUE) will be calculated. Multivariate analysis will be made. We expect to start the preparation of a new publication based in these treatments during the current year. Project achievements and WP5 Deliverables: 1. Field assays for drought tolerance studies established. Two pilot assays and 2 full drought assays was been realized. During these assays crop hydric model as confirmed, drought conditions established and experimental protocols developed, and 38 taro accessions screened with the selection of 8 crop standards. 2. Morpho-agronomic traits associated with drought tolerance accurately identified and evaluated. 23 morphological and agronomic traits usually used to assess the drought tolerance of plant material has been analysed and their specificity to study plant behaviour under drought conditions validated. Eleven traits was validated and used in 1st and 2nd drought assays, with productivity ones selected to calculate stress sensitivity and stress tolerance indexes. 3. Physiological and biochemical markers analysed and correlation studies completed. Eight physiological traits, which variation is usually correlated with the drought has been analysed and validated. First isotope analysis (13C/12C and 15N/14N ratios) realized, additional the samples of 2nd

121
drought assay will be analysed. Their use in taro drought tolerance assessment is pending of further analysis and correlation with biochemical and molecular markers. 4. Chemical analysis of corms grown under drought stress carried out. The chemical analysis (total protein and starch) of corm samples of 34 cultivars screened in the 1st drought assay has realized with assistance of WP 6 team. 5. Association of different traits and markers with drought tolerance studied. The work on this deliverable is now starting, with the analysis of data obtained. 6. One MSc defended on taro drought tolerance at the University of Madeira. A master (MSc) thesis has written using the results of the 1st taro drought assay, with goal to modulate the drought conditions in this crop. Rodrigues, V. (2014) Modelação das condições de stress hídrico no inhame (Colocasia esculenta (L) Schott) e avaliação da variação em caracteres associados à tolerância. Universidade da Madeira. Funchal. Pp 93 A PhD thesis is planned to elaborate and present to defence by one of technicians project scholarships, using the WP5 project results. 1. Two papers published in international journals. One poster communication and related publication in AGRI 2015 proceedings in Procedia Environmental Sciences has done. A manuscript with results of 1st drought assay and taro drought tolerance assessment is in final stage of preparation to publication. Ganança, J.F.T., Freitas, J.G.F., Nóbrega, H.G.M., Rodrigues, R., Antunes, G., Rodrigues, M., Pinheiro de Carvalho, M.A.A., Lebot, V. (2015). Screening of elite and local taro(Colocasia esculenta) cultivars for drought tolerance. In Proceedings of Agriculture and Climate Change - Adapting Crops to Increased Uncertainty (AGRI 2015) Procedia Environmental Sciences. 29: 41–42 Ganança, J.F.T., Freitas, J.G.F., Nóbrega, H.G.M., Rodrigues, V., Antunes, G., Rodrigues, M., Pinheiro de Carvalho, M.A.A., Lebot V., et al. (2016) A simple methodology for assessing taro [Colocasia esculenta (L.) Schott] cultivars drought tolerance. Journal of Experimental Botany (in preparation) Conclusions: As result of the execution of work plan of the WP 5 “Evaluation of drought resistance of elite cultivars and seedlings” during 2015, a new full drought assay was performed, aiming to confirm results obtained from previous assays, and validate used parameters. Dried and fresh samples were obtained for further analysis. Data was obtained for biochemical and nutritional parameters from previous assays samples. Although the proposed work was done in 2015, data treatment will only be done in 2016, and confirmation of the classification for 12 accessions in relation to their drought tolerance will be dependent upon these analyses.

122
2.18. DSMZ, Germany (Stephan Winter) Introduction and summary In 2015, virus research at DSMZ Plant Virus Department concentrated on: 1. Diversity analysis of CBDV isolates associated with Alomae using NGS approaches 2. The improvement and validation of molecular assays for the detection of diverse CBDV isolates from PNG and the Solomons 3. Genome reconstruction of a TaVCV isolate from Vanuatu 4. Reconstruction of a tenuivirus RNA genome 5. Transmission studies of CBDV, TaVCV and tenuivirus isolates using Tarophagus colocasiae from Vanuatu and Solomon islands. Plant materials and insects In February 2015, a virus survey collection was conducted during the INEA meeting in Vanuatu. Further Taro materials were obtained from the Solomon islands and from Papua New Guinea. All plant materials obtained were established in the glasshouse at DSMZ Plant Virus Department and maintained under glasshouse (26°C) conditions for symptom expression and subsequent virus studies. Two colonies of Tarophagus insects were established at DSMZ, one from adult insects collected in Vanuatu and one from nymphs recovered from the Taro materials sent from the Solomon islands.
Figure 3: Tarophagus insects at the leaf underside of Taro in Vanuatu The main focus of virus research with the material received in 2015 was 1) to confirm presence of viruses identified, 2) to further discover new viruses, 3) to fully characterise the tenuivirus and the putative TaVCV from Vanuatu. Further efforts were made to investigate the role of the rhabdovirus CBDV and other viruses in the Alomae and Bobone diseases. During fall/winter 2015, all biological experiments with Taro were suspended due to seasonal climatic conditions also affecting growth and development of Taro. Plants generally remained in a

123
stagnant phase which did not support further experimentation. Taro experiments will continue in March 2016 with the expected start of the growing season. Genome characterisation, diversity analysis and new diagnostic protocols for Taro viruses Assembly of a CBDV-PNG isolate and diversity of CBSD isolates The sequence scaffolds of CBDV-PNG were connected to a complete genome and the annotated genomes of CBDV-SOL (12193 nt) and CBDV-PNG (12209 nt) were compared.
Figure 4: Genome maps of CBDV isolates from PNG and from Solomon islands. The overall genome diversity of 84% shows that these viruses are quite diverse as also indicated by evidence provided for other planthopper-transmitted rhabdoviruses. Further CBDV genomes were reconstructed from miSeq Sequence to resolve the level of diversity. As shown in Figure 2, all isolates from the Solomon islands resemble one sequence type with sequence identities above 99%.
Figure 5: Sequence identities (%) of complete CBDV genomes from Solomon islands and Papua New Guinea. The comparative analysis of virus isolates revealed a geographic diversification of CBDV isolates. The biological significance of this finding is unclear. However, the overall sequence diversity explains the failure of the RT-PCR tests developed so far, to detect all virus isolates. Detection of CBDV in Taro using RT-PCR New sets of primers were tested in RT-PCR but there was no one primer set capable to detect all virus isolates. Hence a multiplex PCR assay was developed with a mixture of 4 primers, to detect virus isolates from PNG and from Solomon islands. The new protocol will be validated in 2016. Characterisation of Taro vein chlorosis virus (TVCV) from Vanuatu During the INEA project meeting in Vanuatu, 2015 leaf samples and living plants were taken from plants showing suspicious virus symptoms.

124
Figure 6: Vein clearing symptoms on Taro leaves in Vanuatu. The symptoms differ greatly to symptoms caused by DMV in Taro. When planted in the DSMZ glasshouse, newly developing leaves from symptomatic plants collected in Vanuatu were all without symptoms. During six month of observation only one plant (Van_38) developed symptoms that resembled the original symptoms indicating TaVCV. Symptoms in this plant however were transient and leaves following the symptomatic leaf remained symptomless. All leaf materials collected were subjected to RT-PCR following the protocol recommended in the Virus indexing protocols (Revill et al., 2005b). Similarly to CBDV tests, only few positives were obtained. RNA from a symptomatic leaf was taken (miV38) and subjected to RNAseq analysis. The reconstruction of the RNA genome of the TaVCV isolate from Vanuatu showed similarity to TaVCV earlier reported (Revill et al., 2005a) however with a diversity level of %. This again explains the failures of the recommended tests to detect all isolates.
Figure 7: Genome map of TaVCV from Vanuatu miV38 (upper) and comparison of the genome sequences with TaVCV from Genbank (NC_006942) (lower). Currently a new protocol will be developed and validated in 2016. Taro Tenuivirus genus Tenuivirus The reconstruction of a full genome sequence of the 5 genome segments of the tenuivirus from Taro was temporarily suspended because of other priorities. However, deep sequencing of Taro samples from Vanuatu and PNG revealed that this virus has a wide spread occurrence since it was found in both regions. However, the biological function of the virus still remains unclear. Transmission studies of CBDV, TaVCV and tenuivirus isolates using Tarophagus colocasiae For biological characterisation and the proof of Koch’s postulates, insect colonies were used for transmission of Taro viruses. Taro with disease symptoms (Figure 6) and confirmed presence of either one or mixed infections of all viruses were used for the studies.

125
Figure 8: Symptoms of Taro virus diseases. Typical bobone-like symptoms (left), severely malformed plants, stunted growth and distorted leaves of Alomae (middle) and severe leaf chlorosis (right) in one plant with only a single infection of the taro tenuivirus. Maintenance of plant hoppers on Taro under glasshouse conditions proved to be very complicated because of the particular behaviour of the insects, contamination of the populations with mites and the adverse climatic conditions in Germany. In addition a further complication was that acquisition access to acquire the virus(es) is followed by an undefined retention period in the vector insect prior to inoculation. The virus has to passage through the insect, to multiply in the insect and only after this can be transmitted. All experiments were conducted with 10 plants for each attempt and multiple trials for each disease. After 3-4 month, some plants proved positive however symptoms typical for a particular virus or disease were not detected. Plants were maintained in the glasshouse during the winter period.
Figure 9: First NEW symptoms indicating TaVCV in Taro from transmission with T. colocasiae. Mixed infection with DsMV (right). With first symptoms on newly formed leaves becoming visible in January 2016, it is expected that more symptoms will be developing on Taro providing evidence that T. colocasiae is the vector of all

126
rhabdoviruses and – hopefully – also for the tenuvirus. This then would be a prerequisite to reconstruct the principle components of Alomae and Bobone disease. Output & future developments 1. Protocols for detection of CBDV and TaVCV have been revised on the basis of new sequences of complete virus genomes 2. Tests will be validated in 2016 and made available. 3. Positive controls for all viruses and reference samples are available. 4. Virus transmission by T. colocasae confirmed this insect as the vector for the rhabdoviruses. 5. Virus transmission assays will continue in 2016 6. New attempts will be made to produce virus specific antisera for TaVCV and CBDV to facilitate laboratory testing. 7. All shall be delivered before the end of the INEA project. Revill, P., Trinh, X., Dale, J., Harding, R., 2005a. Taro vein chlorosis virus: characterization and variability of a new nucleorhabdovirus. J Gen Virol 86, 491-499. Revill, P.A., Jackson, G.V.H., Hafner, G.J., Yang, I., Maino, M.K., Dowling, M.L., Devitt, L.C., Dale, J.L., Harding, R.M., 2005b. Incidence and distribution of viruses of Taro (Colocasia esculenta) in Pacific Island countries. Australas Plant Path 34, 327-331.

127
3. Appendix List of publications (PDF files) here attached:
3.1. INEA Newsletters (6)
3.2. Variation of nitrate content among randomly selected taro (Colocasia esculenta (L.) Schott) genotypes and the distribution of nitrate within a corm. Kristl, A. Ivancic, A. Mergedus, V. Sem, M. Kolar, V. Lebot. 2016. Journal of Food Composition and Analysis.
3.3. Evaluation of vegetative growth, yield and quality related traits in taro (Colocasia esculenta [L.] Schott). L. Soulard, P. Letourmy, TV Cao, F. Lawac, H. Chaïr, V. Lebot. 2016. Crop Science, Vol. 56.
3.4. Characterization of taro [Colocasia esculenta (L.) Schott] germplasm for improved flavonoid composition and content V. Lebot, F. Lawac, S. Michalet, L. Legendre. Plant Genetic Resources Characterisation and Utilisation. 2015.
3.5. Optimizing the utilization of plant genetic resources for climatic changes adaptation in the Pacific: the need for a new approach. V. Lebot. Acta Hortic. 1101. ISHS 2015. Proc. XXIX IHC – IV Intl. Symp. on Plant Genetic Resources, Brisbane, Australia.