
2004 ANNUAL REPORT FUBON COMMERCIAL BANK -
77
2004 ANNUAL REPORT FUBON COMMERCIAL BANK Fubon Commercial Bank and TaipeiBank have been officially merged into Taipei Fubon Commercial Bank on January 1, 2005 169, Sec. 4, Jen Ai Road, Taipei, Taiwan Tel: (02) 27716699
Transcript of 2004 ANNUAL REPORT FUBON COMMERCIAL BANK -

2004 ANNUAL REPORT
FUBON COMMERCIAL BANK
Fubon Commercial Bank and TaipeiBank have been officially merged into Taipei Fubon Commercial Bank on January 1, 2005
169, Sec. 4, Jen Ai Road, Taipei, Taiwan
Tel: (02) 27716699

1
1. Spokesperson Name:TienHsia Chang Title:Chief Financial Officer Tel:(886)227716699 Email:[email protected]
Acting Spokesperson Name:Daniel Chen Title:Chief Strategy Officer Tel:(886)227716699 Email:[email protected]
2. Contact Information – Corporate Headquarters and Branches Please see page14
3. Stock Registration Agent Name:Fubon Securities Co., Ltd. Address:2F, 17, HsuChang St., Taipei, Taiwan, R.O.C. Tel:(886)223810131 Website:www.fbs.com.tw
4. Credit Rating Institution Name:Taiwan Ratings Corporation Address:23F, 100, Sec. 2, Roosevelt Rd., Taipei, Taiwan, R.O.C. Tel:(886)22368 8277 Website:www.taiwanratings.com
5. Certified Public Accountants for Fiscal Year 2004 CPAs:Ray Chang, Terence Huang Company:Deloitte & Touche Address:12F, 156, Sec. 3, MinSheng E. Rd., Taipei, Taiwan, R.O.C. Tel:(886)225459988 Website:www.deloitte.com.tw
6. Exchange Houses where Overseas Securities are Listed:None
7. Website www.taipeifubon.com.tw
2
Table of Contents
Item Page I. Message to Shareholders 3
II. Corporate Profile 4
1. Introduction 4
2. Organizational Structure 5
III. Business Operations 7
1. Business Information 7
2. Business Strategy and Business Plans for 2005 9
3. Research and Development Plans 11
4. Employees Structure 11
IV. Special Notes 12
1. Dividend Policy and Status of Execution 12
2. Implementation of the Internal Controls System 13
V. Headquarters and Branches of Taipei Fubon Commercial Bank 14
<Appendix 1> Annual Financial Reports for 2004 and 2003 22
<Appendix 2> Consolidated Financial Reports for 2004 and 2003 70
3
I. Message to Shareholders In respect to the Year 2004 operation, Fubon Commercial Bank dedicated most of its effort to make the first fullscale integration between Taipei Bank, a large governmentowned bank and the private bank successfully; even so, it still kept the new products innovated and profitability sustained, recording pretax income at NT$5.2 billion and aftertax earnings per share at NT$1.95.
Fubon Commercial Bank and Taipei Bank have very different strengths and historical backgrounds. Fubon Commercial Bank focusd on wealth management and consumer banking, Taipei Bank expertized in corporate banking and government banking. Through mutual support and further cooperation, the merger effectively offers better back up and support to each side. The organizational structure and information systems of both banks have been integrated efficiently and effectively. Meanwhile, the merger synergy realized gradually.
First, ongoing launch programs were introduced for comprehensive product lines including creative and wellpacked mortgages and consumer loans to fulfill consumers' needs / wants in the consumer banking field. Actually those have proved popular, enabling the business to grow around 21% and exceeding approximately the outstanding balance NT$24 billion in the consumer loan business.
In addition, when comparing the number of wealth management clients the Bank served last year, customer base rose over 10% in 2004. Yield coming from products crossselling rose 23.3%, while returns in bancassurance area grew 43.2%.
Besides cooperating with other subsidiaries of Fubon Financial Holding Co., Ltd. to develop project financing technologies and provide customized financial planning services for the jumbo corporate accounts, the Bank tapped SME business thru SMBCGF program.
Based on Fubon Commercial Bank's strong operations performed and asset quality maintained, Taiwan Ratings Corporation in December 2004 issued it longterm and shortterm credit ratings of “twAA” and “twA1” respectively, with a “stable” outlook and noted that the Bank's profitability has increased over the past two years in part due to betterthanaverage marginal net income and commissions from wealth management.
After completion of the merger with Taipei Bank on January 1, 2005. The Bank will undergo a capital reduction of NT$10 billion. This will not pose any negative effect to the bank’s capital health. Rather, maintaining the same level of profits, the Bank’s ROE and EPS will effectively improve, providing a positive impact on the Bank’s operations after the merger. The Financial Supervisory Commission of the Executive Yuan has approved the capital reduction, which will be completed during 2005.
To expand sales capability, offer completed product lines including banking, as well as insurance, brokerage and asset management products and deliver comprehensive financial services to all of our customers, Taipei Fubon Bank has reengineered the organization and business process into a customerdriven entity. Not only does the Bank become the private domestic bank with the largest network of branches and the highest market share in the Taipei area but also serves as Fubon Financial's most powerful crossselling platform. Following innovation, one of the driving forces of Fubon, the Bank will continue to strive for excellence in strategies planning, products offering and service quality improving, utilize Fubon Bank (Hong Kong) platform to develop Greater China business and participate in industry consolidation to enlarge operating scale and then maximizing shareholders' values.

4
II. Corporate Profile 1. Introduction (1)Date of Establishment:
Fubon Commercial Bank (FCB) was established on August 1,1991 by Ministry of Finance Order Tsai Tzu No.800278066.
(2)History of Development Established in 1991, Fubon Commercial Bank provides all kind of financial services approved
by the Banking Law. On December 29, 2001, Fubon Financial Holding Co., Ltd. obtained 100% of the outstanding shares of the Bank through a share swap and the Bank's stock was delisted from the Taiwan Stock Exchange on the same date.
Taipei Bank began operating under the Fubon FHC umbrella on December 23, 2002. At the beginning it has maintained operations alongside Fubon Commercial Bank as an independent entity. However, in order to preserve the brand position and strengths of both parties, as well as minimizing potential repercussions, Fubon FHC then decide to merge two banks through actively integration of information systems, workflow, organization and staff.
After two years of intensive preparation, Fubon Commercial Bank and Taipei Bank were officially merged into Taipei Fubon Commercial Bank on Jan. 1, 2005. The integration of two banks marked the first and only successful fullscale merger of operations between a large governmentowned bank and an accomplished private bank in Taiwan. The move will not only help Fubon FHC expand its earnings potential but also achieve a milestone in Taiwan financial merge history.

5
2. Organizational Structure
Board of Directors n Chairman n Directors
Supervisors n AssetLiability Management Committee n Faculty Evaluation Committee n Credit Evaluation Committee n General Planning Committee n Work Rationalization Promotion Committee n Trust Asset Evaluation Committee n Risk Management Committee President
Auditing Department
Corporate Banking Group
Consumer Banking Group
Financial Services Group
Treasury Division Office Administration Group
Credit Card Business Group
Trust Division
Consumer Credit Department
Corporate Credit Department
Project Finance Department
Small Business Finance Department
SmallAmount Handy Loan Center
Financial Services Department
International Banking Department
Electronic Banking Department
Customer Service Center
Centralized Processing Department
Business Department
Accounting Department
Planning Department
IT Department
Human Resources Department
Office Administration Department
Consumer Banking Department
Corporate Banking Department
7 Regional Centers
(1) Organization Chart
Car Loan Center
Operation Management Department
Credit Department
Marketing Department
Sales Department
39 Branches
SME Department
Shareholder’s Meeting
6 Regional Centers
2004.12.31
6
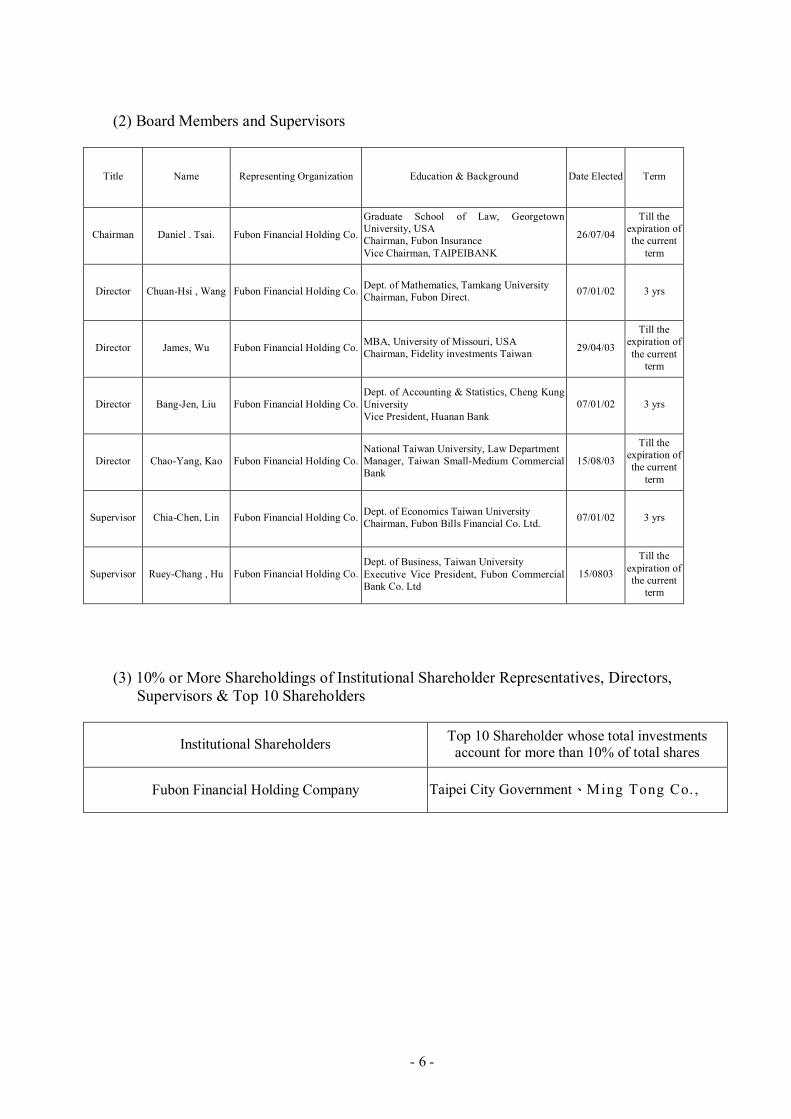
(2) Board Members and Supervisors
Title Name Representing Organization Education & Background Date Elected Term
Chairman Daniel . Tsai. Fubon Financial Holding Co.
Graduate School of Law, Georgetown University, USA Chairman, Fubon Insurance Vice Chairman, TAIPEIBANK
26/07/04
Till the expiration of the current
term
Director ChuanHsi , Wang Fubon Financial Holding Co. Dept. of Mathematics, Tamkang University Chairman, Fubon Direct. 07/01/02 3 yrs
Director James, Wu Fubon Financial Holding Co. MBA, University of Missouri, USA Chairman, Fidelity investments Taiwan 29/04/03
Till the expiration of the current
term
Director BangJen, Liu Fubon Financial Holding Co. Dept. of Accounting & Statistics, Cheng Kung University Vice President, Huanan Bank
07/01/02 3 yrs
Director ChaoYang, Kao Fubon Financial Holding Co. National Taiwan University, Law Department Manager, Taiwan SmallMedium Commercial Bank
15/08/03
Till the expiration of the current
term
Supervisor ChiaChen, Lin Fubon Financial Holding Co. Dept. of Economics Taiwan University Chairman, Fubon Bills Financial Co. Ltd. 07/01/02 3 yrs
Supervisor RueyChang , Hu Fubon Financial Holding Co. Dept. of Business, Taiwan University Executive Vice President, Fubon Commercial Bank Co. Ltd
15/0803
Till the expiration of the current
term
(3) 10% or More Shareholdings of Institutional Shareholder Representatives, Directors, Supervisors & Top 10 Shareholders
Institutional Shareholders Top 10 Shareholder whose total investments account for more than 10% of total shares
Fubon Financial Holding Company Taipei City Government、Ming Tong Co. ,

7
III. Business Operations 1. Business Information (1) Breakdown of Total Revenues
Unit:﹪ Item 2004 2003 Wealth Management 18.91 19.42 Loans 33.73 26.77 Credit Card 28.91 27.61 Others 18.45 26.20 Total 100.00 100.00
(2) Business Performance (A) Wealth Management
Platinum account officers and personal bankers in each branch offer asset portfolio advice based on customers' financial needs, tax considerations, and the abilities to assume risk. The innovative product portfolios and highly efficient services put the Bank ahead of its counterparts and strengthen its brand name in the wealth management market. At the end of 2004, the total fee income grew 22.41%.
The Bank seeks to provide tailormade products for its customers. To offer distinct service, the Bank divided customers into Platinum and Normal customers based on their asset size and are served by PA and PB, respectively.
The Bank maintains cooperative relationships with strategic partners McDonald’s and Fubon Insurance. This has resulted in many sales promotion projects, helping to raise the volume of automated services. In addition, in order to ensure the smooth progress of the merger with Taipei Bank, the Bank began moving automation hardware to Taipei Bank in May 2004. Hardware in the IC ATM Cards program has been upgraded.
(B) Consumer Banking In 2004, the Bank posted substantial growth over 2003 in consumer banking
according to the policy of providing customized products and the introduction of various loan products. In the consumer loan business, the Bank expanded the scale by initiating segmentoriented product offering for various targets; in the mortgage business, following the product strategy focusing on “Fixed Rate Mortgages” in Year 2003, the Bank primarily reached low risk clients with stable incomes by launching the third wave “Fixed Rate MortgagePlatinum Campaign” and introduced innovative “100% Mortgage” to the customers with a reliable repayment history.
(C) Corporate Banking In recent years, the Bank focuses on planning customized financial products and
stressing marketing in order to provide more comprehensive financial services. Besides providing the suitable financial service for core corporate customers, the Bank also designs appropriate structure financial products and derivatives to avoid interest and exchange risks. In addition, joint with SMBCG fund.

8
Banking services in Greater China market become more and more important. The Bank will use Hong Kong affiliate, Fubon Bank(Hong Kong), as a spring board to develop Greater China market. In 2004, the Bank executed several business partnerships with Fubon Bank(Hong Kong). In particular, the “Hong KongTaiwan Rapid Remittance” program was launched at the end of the year which provide clients much better remittance services.
(D) Credit Card business The Bank launched cobranded card initiatives to acquire more potential clients and
held usage activities to bolster customer loyalty in 2004. Simultaneously, the Bank offered more tailormade products and services via eventdriven technologies. In the end of 2004, the Bank was among the top five in market share for platinum cards and grew 11.18% in the charges made while comparing with ones in 2003.
To reward cardholders for their patronage, on December 25, 2004, the Bank increased travel accident insurance and insurance coverage of flight delay and baggage delay or loss for cardholders, established a cardholder’s’ travel service center and continued to integrate its customer service system, helping to raise service quality.
(E)Treasury In an effort to provide clients with a more comprehensive product line and
customized financial planning services, the Bank remains committed to expanding and developing derivatives products. While merging with Taipei Bank, the Bank will continue to apply for licenses to issue more marketoriented products, further fulfilling the varied customers’ needs.
(F)Trust The assets under the custody of the Bank consisted of domestic mutual funds,
discretionary investment assets, business operation funds, stock owned by venture capital company and marketable securities certificates owned by of securities and bills finance company.
Due to changes in the economic environment and amendments in Trust Laws, more and more clients are seeking to have diversified trust products. As a result, the Bank has launched various individual management trust services, such as pecuniary trust, securities trust and real estate trust. The business volume of all such trust products grew sharply from 2003. In the future, the Bank will look at various trust products overseas in an effort to develop individual and juristic trust products suitable for Taiwan.
9
2. Business Strategy and Business Plans for 2005 (1) Business Strategy
(A)Grow corporate and consumer loans (B)Grow credit card portfolio (C)Realize potential in wealth management business (D)Growth other feebased business (E)Realize cost savings (F) Improve operating efficiency (G)Prudent credit and market risk control (H)Develop greater Chinese business together with Fubon Bank (Hong Kong)
(2) Business Plans (A)Wealth Management
1) Continue to cross sell products including banking, as well as insurance and asset management merchandises and deliver comprehensive financial services.
2) Build up Wealth Management RM System and offer tailormade financial recommendations.
3) Speed up the switch move on IC ATM Card and promote the combinedfunction of IC ATM Card and Visa Debit.
4) Renovate the branches to unify the brand image and embellish the distribution channels’ appearance.
(B)Consumer Banking 1) Innovate consumeroriented loan products under the guideline, “decentralization, segmentation and timeliness”.
2) Enforce the marketing function by offering extensive training session, deploying more branch sales force and simplifying the workflow.
3) Exercise the CRM technology to shoot the target customers precisely by fully tapping the data warehouse resources.
4) Review the customers’ business status and loan quality regularly and adjust pricing and loan approval policy timely.
(C)Corporate Banking 1) Develop capital market and investment banking services apart from traditional loan business.
10
2) Further explore SME business through “Small and Medium Business Credit Guarantee Fund”.
3) Upgrade trade finance products and offer Epayment services over Greater China Area.
4) Improve the operation efficiency through digitized application process.
(D)Credit Card business 1) Keep on focusing acquisition by issuing affinity card and cobranded card.
2) Strengthen platinum cards market penetration through market campaigns.
3) Initiate ore usage promotional programs to promote client loyalty.
4) Systematize the collection process to follow up customers’ liquidity more efficiently.
(E)Treasury 1) Adopt more flexible trade strategies to control market risk.
2) Gradually strengthen salesoriented operations and raise the percentage of handling fee income.
3) Improve capital efficiency and lower costs.
(F) Trust 1) Promote and develop collective investment trust funds business. 2) Further penetrate trust business including personal trusts, as well as securities trusts, real estate trusts, charitable trusts, employees benefit trusts and pension trusts.
3) Exploit the securitization business.

11
3. Research and Development Plans (1)R&D Spending for the Past Two Years
Unit:NT$1,000 Item 2004 2003
R & D Spending 14,130 18,021
(2)Research and Development Plans (A)Strengthening the Marketing Management System
Besides using data warehouse systems to grasp client profiles and trading habits as a reference for marketing decision, the Bank completed the construction of marketing management system in 2004. This system will initiate, administer and execute marketing activities more independently. Able to hone in on client trading behavior, it will rapidly provide clients with relevant products and services to satisfy their financial needs. Due to the operation of the marketing management system, the Bank’s marketing model takes client needs as its guiding principle. Not only does it speed up marketing responses, improve response rates and improve client loyalty, it also increases the Bank’s income and profit.
(B)Chip Card According to the regulations of Visa International and MasterCard International,
new credit cards in Taiwan will be issued in the form of chip cards from January 2006. Meanwhile, the chip card migration steering committee of the Bankers Association of the ROC has resolved that in order to accelerate the installation of the chip card terminals, the IRF for credit cards (the ratio between the issuing banks and acquiring banks) will be lowered by 0.0442%for 4 year to subsidize the acquiring banks, the transaction fee rate allocated to the issuing banks will be cut to 1.5058%, down from the existing 1.55%, so as to subsidize the acquiring banks. In July 2003, a project management office(PMO) for the chip card migration was established to push for the smooth conversion to credit chip cards. The PMO is backed by an NT$60 million fund, to be shared by member banks according to the value of the customer transaction. Our bank plans to install the related systems in 2005 and then adopt the marketing strategy to issue credit chipcards at a proper time.
4. Employees Structure Year 2004 2003 As on April 8,2005
Staff 1,695 1,451 4,520 Workers 625 509 289 Number of employees Total 2,320 1,960 4,809
Average age (years) 31.10 32.01 33.26 Average tenure(years) 9.00 9.05 7.46
Graduate or higher 5.68% 5.31% 4.89% College/University 82.2% 80.26% 84.15% Senior high school 12.03% 14.33% 10.83% Education level
Below senior high 0.09% 0.10% 0.13% Note:The number of employees on April 8, 2005 is combined.
12
IV. Special Notes 1. Dividend Policy and Status of Execution
(1) Dividend Policy The board of directors authorized by the shareholders amended the Bank’s Articles of
Incorporation on March 22, 2002. This amendment provides that the following should be appropriated from the annual net income, less any deficit: 1) 30% as legal reserve; 2) 1% to 5% of the remaining earnings as employee bonus; 3) Dividends to shareholders of all or part of the remainder and unappropriated earnings
generated in prior years as determined by the board of directors. Under the Company Law, legal reserve should be appropriated until the reserve equals the paidin capital. This reserve should only be used to reduce or offset a deficit. When the reserve reaches 50% of the Bank’s paidin capital up to 50% thereof may be declared as stock dividend. The Banking Law limits the appropriation for cash dividend, and any additional dividends to shareholders are limited to 15% of the Bank’s paidin capital.
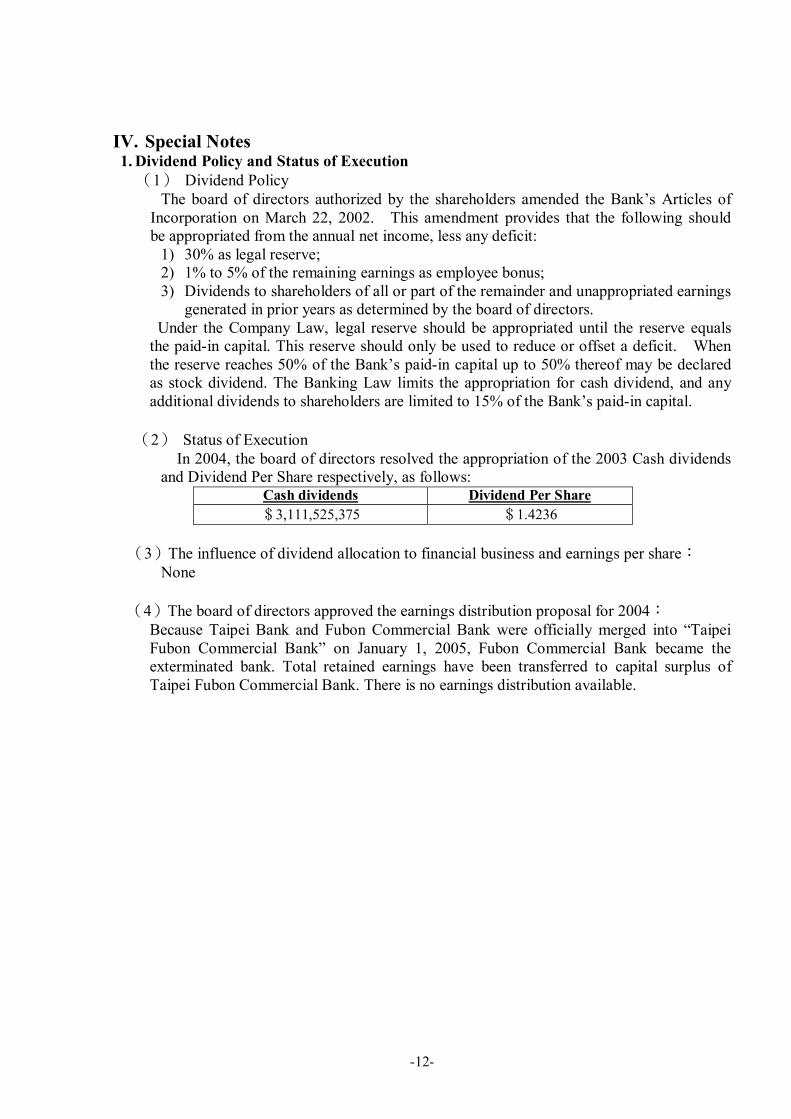
(2) Status of Execution In 2004, the board of directors resolved the appropriation of the 2003 Cash dividends
and Dividend Per Share respectively, as follows: Cash dividends Dividend Per Share $3,111,525,375 $1.4236
(3)The influence of dividend allocation to financial business and earnings per share: None
(4)The board of directors approved the earnings distribution proposal for 2004: Because Taipei Bank and Fubon Commercial Bank were officially merged into “Taipei Fubon Commercial Bank” on January 1, 2005, Fubon Commercial Bank became the exterminated bank. Total retained earnings have been transferred to capital surplus of Taipei Fubon Commercial Bank. There is no earnings distribution available.
13
2. Implementation of the Internal Controls System
Statement of Internal Controls
On behalf of Taipei Fubon Commercial Bank we affirm that during the period of Jan. 1, 2004
through Dec. 31, 2004 Taipei Fubon Commercial Bank did in fact conform to the
Implementation Regulations for Banks’ Internal Control Systems and Auditing Systems in
establishing an internal control system and implementing risk management, and that the Bank
was audited by an unbiased and independent unit which submitted reports regularly to the
Bank’s directors and supervisors. Careful assessment reveals that the Bank’s various units did in
fact effectively implement internal controls and observe the relevant laws and regulations during
this year.
This Statement is submitted to Bureau of Monetary, Financial Supervisory Commission, R.O.C.
14
V. Headquarters and Branches of Taipei Fubon Commercial Bank
Headquarters Address and Telephone Number
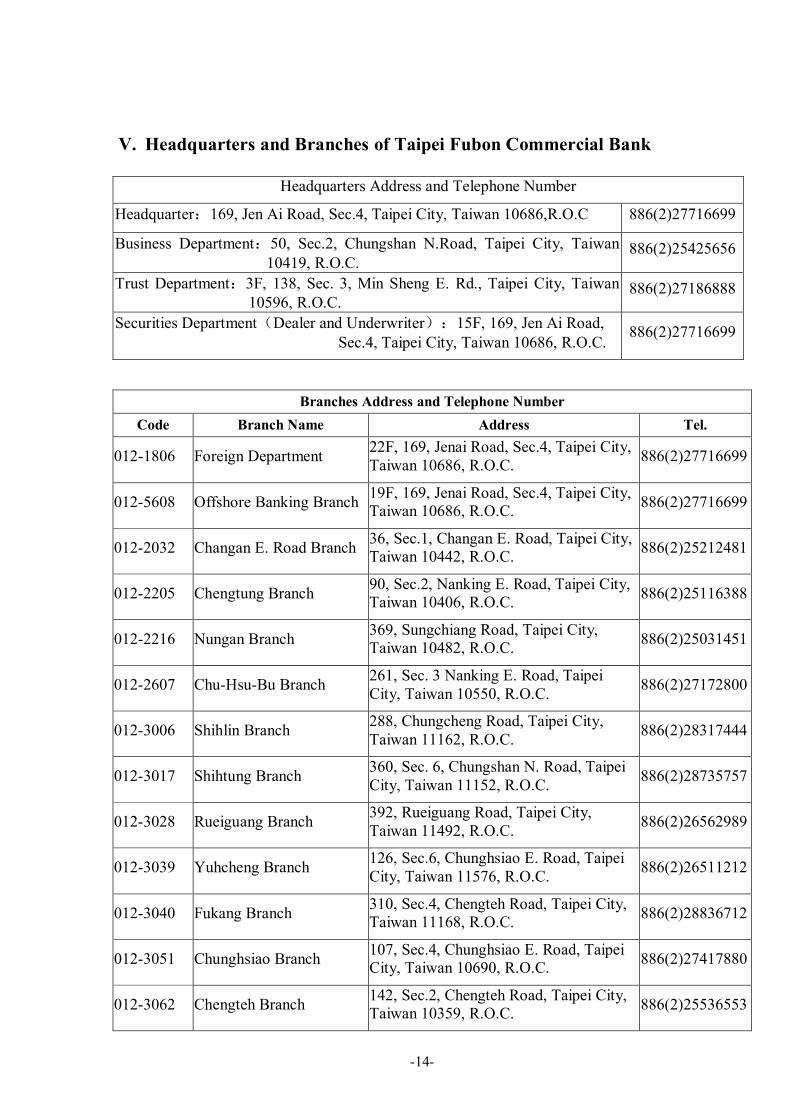
Headquarter:169, Jen Ai Road, Sec.4, Taipei City, Taiwan 10686,R.O.C 886(2)27716699
Business Department:50, Sec.2, Chungshan N.Road, Taipei City, Taiwan 10419, R.O.C.
886(2)25425656
Trust Department:3F, 138, Sec. 3, Min Sheng E. Rd., Taipei City, Taiwan 10596, R.O.C.
886(2)27186888
Securities Department(Dealer and Underwriter):15F, 169, Jen Ai Road, Sec.4, Taipei City, Taiwan 10686, R.O.C.
886(2)27716699
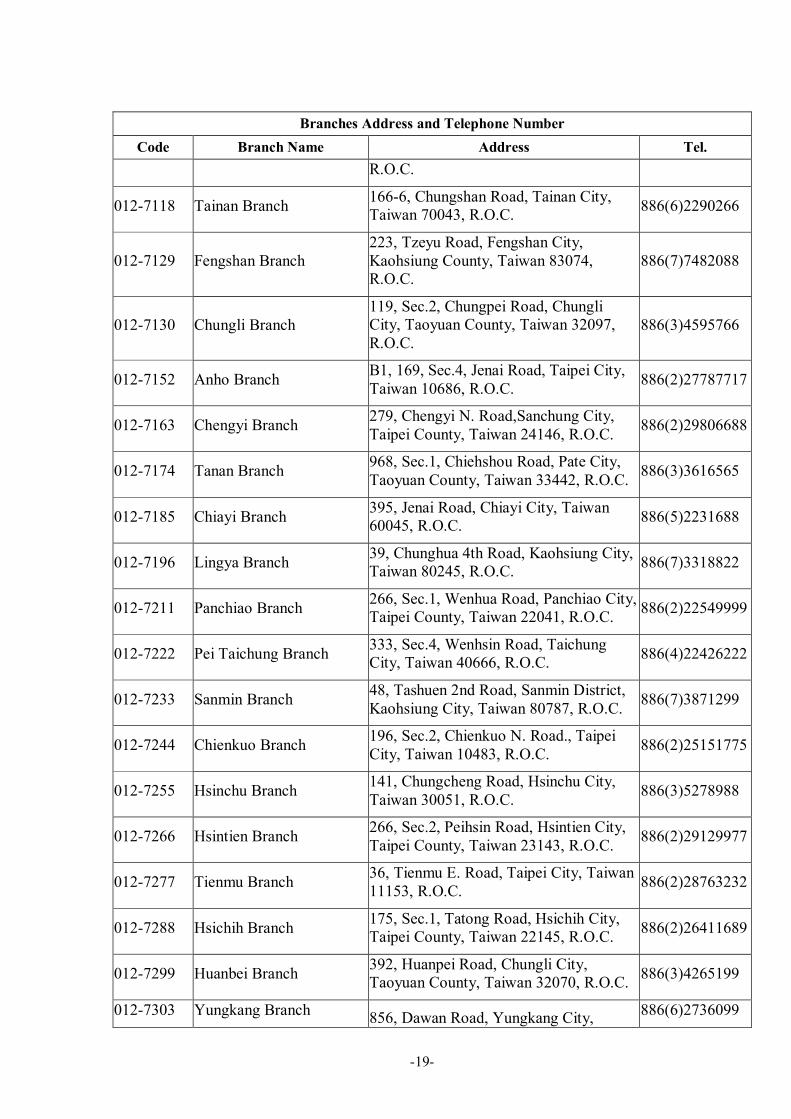
Branches Address and Telephone Number Code Branch Name Address Tel.
0121806 Foreign Department 22F, 169, Jenai Road, Sec.4, Taipei City, Taiwan 10686, R.O.C. 886(2)27716699
0125608 Offshore Banking Branch 19F, 169, Jenai Road, Sec.4, Taipei City, Taiwan 10686, R.O.C. 886(2)27716699
0122032 Changan E. Road Branch 36, Sec.1, Changan E. Road, Taipei City, Taiwan 10442, R.O.C. 886(2)25212481
0122205 Chengtung Branch 90, Sec.2, Nanking E. Road, Taipei City, Taiwan 10406, R.O.C. 886(2)25116388
0122216 Nungan Branch 369, Sungchiang Road, Taipei City, Taiwan 10482, R.O.C. 886(2)25031451
0122607 ChuHsuBu Branch 261, Sec. 3 Nanking E. Road, Taipei City, Taiwan 10550, R.O.C. 886(2)27172800
0123006 Shihlin Branch 288, Chungcheng Road, Taipei City, Taiwan 11162, R.O.C. 886(2)28317444
0123017 Shihtung Branch 360, Sec. 6, Chungshan N. Road, Taipei City, Taiwan 11152, R.O.C. 886(2)28735757
0123028 Rueiguang Branch 392, Rueiguang Road, Taipei City, Taiwan 11492, R.O.C. 886(2)26562989
0123039 Yuhcheng Branch 126, Sec.6, Chunghsiao E. Road, Taipei City, Taiwan 11576, R.O.C. 886(2)26511212
0123040 Fukang Branch 310, Sec.4, Chengteh Road, Taipei City, Taiwan 11168, R.O.C. 886(2)28836712
0123051 Chunghsiao Branch 107, Sec.4, Chunghsiao E. Road, Taipei City, Taiwan 10690, R.O.C. 886(2)27417880
0123062 Chengteh Branch 142, Sec.2, Chengteh Road, Taipei City, Taiwan 10359, R.O.C. 886(2)25536553

15
Branches Address and Telephone Number Code Branch Name Address Tel.
0123073 Lungchiang Branch 28, Sec.3, Nanking E. Road, Taipei City, Taiwan 10489, R.O.C. 886(2)25073817
0123109 Yenping Branch 69, Sec.2, Yenping N. Road, Taipei City, Taiwan 10346, R.O.C. 886(2)25552170
0123202 Mucha Branch 92, Sec.3, Mucha Road, Taipei City, Taiwan 11648, R.O.C. 886(2)29391035
0123213 Muhsin Branch 212, Sec.3, Muhsin Road, Taipei City, Taiwan 11660, R.O.C. 886(2)29383791
0123305 Lungshan Branch 161, Hsining S. Road, Taipei City, Taiwan 10844, R.O.C. 886(2)23718720
0123408 Pate Branch 178, Sec.3, Pate Road, Taipei City, Taiwan 10555, R.O.C. 886(2)25776467
0123419 Yungchuen Branch 151,Fude Street, Taipei City, Taiwan 11078, R.O.C. 886(2)27592921
0123420 Yungchi Branch 185,Yungchi Road, Taipei City, Taiwan 11063, R.O.C. 886(2)27628700
0123501 Chungshan Branch 162, Sec.2, Chungshan N. Road, Taipei City, Taiwan 10452, R.O.C. 886(2)25963171
0123604 Peitou Branch 2, Sec.1, Chungyang N. Road, Taipei City, Taiwan 11263, R.O.C. 886(2)28915533
0123615 Shihpai Branch 216, Wenlin N. Road, Taipei City, Taiwan 11287, R.O.C. 886(2)28271616
0123707 Taan Branch 37, Sec.4, Jenai Road, Taipei City, Taiwan 10685, R.O.C. 886(2)27312333
0123800 Tatung Branch 175, Sec.3, Chungking N. Road, Taipei City, Taiwan 10369, R.O.C. 886(2)25929282
0123903 Kuting Branch 100, Sec.3, Roosevelt Road, Taipei City, Taiwan 10088, R.O.C. 886(2)23650381
0124003 Shuangyuan Branch 19, Tungyuan Street, Taipei City, Taiwan 10864, R.O.C. 886(2)23030374
0124014 Wanhua Branch 482, Wanta Road, Taipei City, Taiwan 10872, R.O.C. 886(2)23325901
0124106 Chiencheng Branch 22, Nanking W. Road, Taipei City, Taiwan 10352, R.O.C. 886(2)25554161
0124117 Shihfu Branch 1, Shihfu Road, Taipei City,Taiwan 11008,R.O.C. 886(2)27298999
0124209 Nankang Branch 195, Sanchung Road, Taipei City, Taiwan 11501, R.O.C. 886(2)26551177

16
Branches Address and Telephone Number Code Branch Name Address Tel.
0124302 Chingmei Branch 64, Chingwen Street, Taipei City, Taiwan 11670, R.O.C. 886(2)29352636
0124313 Hsinglung Branch 69, Sec.3, Hsinglung Road, Taipei City, Taiwan 11694, R.O.C. 886(2)86639889
0124405 Neihu Branch 6, Lane 174,Sec.3, Chengkung Road, Taipei City, Taiwan 11460, R.O.C. 886(2)27961820
0124427 Wende Branch 42, Wende Road, Taipei City, Taiwan 11475, R.O.C. 886(2)26582620
0124508 Tunhua Branch 201, Tunhua N. Road, Taipei City, Taiwan 10508, R.O.C. 886(2)27131660
0124542 Minsheng Branch 1631, Sec.5, Minsheng E. Road, Taipei City, Taiwan 10573, R.O.C. 886(2)27640853
0124601 Hsinyi Branch 299, Sec.4, Hsinyi Road, Taipei City, Taiwan 10681, R.O.C. 886(2)27006381
0124612 Juangjing Branch 286, Juangjing Road, Taipei City, Taiwan 11049, R.O.C. 886(2)27226206
0124623 Taipei World Trade Center Branch
13F, 333, Sec.1, Keelung Road, Taipei City, Taiwan 11012, R.O.C. 886(2)27252916
0124704 Sungchiang Branch 200, Sungchiang Road, Taipei City, Taiwan 10467, R.O.C. 886(2)25434282
0124807 Hoping Branch 236, Sec.2, Fuhsing S. Road, Taipei City, Taiwan 10663, R.O.C. 886(2)27022421
0124900 Yenchi Branch 387, Sec.4, Jenai Road, Taipei City, Taiwan 10693, R.O.C. 886(2)27527600
0125000 Chengchung Branch 7, Qingdao W. Road, Taipei City, Taiwan 10041, R.O.C. 886(2)23615481
0125103 Nanmen Branch 5, Sec.1, Roosevelt Road, Taipei City, Taiwan 10092, R.O.C. 886(2)23971640
0125206 Fuhsing Branch 234, Fuhsing N. Road, Taipei City, Taiwan 10480, R.O.C. 886(2)25023530
0125309 Hsisung Branch 751, Sec.4, Nanking E. Road, Taipei City, Taiwan 10550, R.O.C. 886(2)27170037
0125402 Changan Branch 82, Sungchiang Road, Taipei City, Taiwan 10456, R.O.C. 886(2)25519797
0125505 Kueilin Branch 52, Kueilin Road, Taipei City, Taiwan 10849, R.O.C. 886(2)23026226
0125701 Tunho Branch 77, Sec.2, Tunhua S. Road, Taipei City, Taiwan 10682, R.O.C. 886(2)27012409

17
Branches Address and Telephone Number Code Branch Name Address Tel.
0125804 Tungmen Branch 69, Sec.2, Jenai Road, Taipei City, Taiwan 10062, R.O.C. 886(2)23512081
0125907 Chunglun Branch 6, Fuhsing N. Road, Taipei City, Taiwan 10492, R.O.C. 886(2)27418257
0126007 Keelung Road Branch 21, Sec.2, Keelung Road, Taipei City, Taiwan 11052, R.O.C. 886(2)27373671
0126100 Chinhua Branch 178, Sec.1, Hoping E. Road, Taipei City, Taiwan 10645, R.O.C. 886(2)23698566
0126203 Sungnan Branch 412, Sec.5, Chunghsiao E. Road, Taipei City, Taiwan 11061, R.O.C. 886(2)27255111
0126214 Huaisheng Branch 215, Sec.3, Chunghsiao E. Road, Taipei City, Taiwan 10655, R.O.C. 886(2)27818380
0126306 Minchuan Branch 37, Sec.3, Minchuan E. Road, Taipei City, Taiwan 10476, R.O.C. 886(2)25166786
0126409 Chilin Branch 146, Chilin Road, Taipei City, Taiwan 10459, R.O.C. 886(2)25681248
0126502 Shetzu Branch 225, Sec.5, Yengping N. Road, Taipei City, Taiwan 11171, R.O.C. 886(2)28168585
0126605 Kaohsiung Branch 358, Chungshan 2nd Road, Kaohsiung City, Taiwan 80242, R.O.C. 886(7)3356226
0126683 Hsihu Branch 240, Sec.1, Neihu Road, Taipei City, Taiwan 11493, R.O.C. 886(2)87511788
0126694 Haishan Branch 208, Sec.3, Chungyang Road, Tucheng City, Taipei County, Taiwan 23680, R.O.C.
886(2)22677877
0126708 Wanlung Branch 136, Sec.6, Roosevelt Road, Taipei City, Taiwan 11674, R.O.C. 886(2)29339956
0126719 Chungkang Branch 160, Sec.1, Taichungkang Road, Taichung City, Taiwan 40354, R.O.C. 886(4)23207711
0126720 Hsinchuang Branch 227, Hsintai Road, Hsinchuang City, Taipei County, Taiwan 24242, R.O.C. 886(2)29903366
0126731 Taoyuan Branch 33, Chunghua Road, Taoyuan City, Taoyuan County, Taiwan 33065, R.O.C. 886(3)3367171
0126742 Chengkung Branch 515, Chengkung Road, Tainan City, Taiwan 70057, R.O.C. 886(6)2803166
0126764 Sunglung Branch 1761,Sec.1, Keelung Road, Taipei City, Taiwan 10072, R.O.C. 886(2)27473399
0126775 Houpu Branch 55, Sec.1, Nanya S.Road, Panchiao City, 886(2)29693388

18
Branches Address and Telephone Number Code Branch Name Address Tel.
Taipei County, Taiwan 22060, R.O.C.
0126786 Hsinming Branch 582, Chungcheng Road, Chungli City, Taoyuan County, Taiwan 32047, R.O.C. 886(3)4023311
0126797 Sanchung Branch 36, Sec.2, Chunghsiao Road, Sanchung City, Taipei County, Taiwan 24162, R.O.C.
886(2)89836868
0126801 Fengyuan Branch 139, Hsiangyang Road, Fengyuan City, Taichung County, Taiwan 42080, R.O.C. 886(4)25220088
0126812 Shuangho Branch 696, Chingping Road, Chungho City, Taipei County, Taiwan 23559, R.O.C. 886(2)22438877
0126823 Kushan Branch 387, Huarong Road, Kushan District, Kaohsiung City, Taiwan 80454, R.O.C. 886(7)5523111
0126845 Fengcheng Branch 126, Minsheng Road, Hsinchu City, Taiwan 30043, R.O.C. 886(3)5343888
0126856 Changhua Branch 349, Sec.2, Chungshan Road, Changhua City, Changhua County, Taiwan 50065, R.O.C.
886(4)7261333
0126878 Yungho Branch 407, Deho Road, Yungho City, Taipei County, Taiwan 23451, R.O.C. 886(2)86601616
0126890 Taipei 101 Branch 5Fl., 45, Shihfu Road, Taipei City, Taiwan 11001, R.O.C. 886(2)81018585
0127015 Shuanglien Branch 13, Sec.1, Minsheng E.Road, Taipei City, Taiwan 10451, R.O.C. 886(2)25115511
0127026 Nanking East Road Branch
139, Sec.2, Nanking E.Road, Taipei City, Taiwan 10485, R.O.C. 886(2)25155518
0127037 Tunpei Branch 138, Sec.3, Minsheng E.Road, Taipei City, Taiwan 10596, R.O.C. 886(2)27185151
0127048 Jenai Branch 237, Sec.1, Chienkuo S.Road, Taipei City, Taiwan 10657, R.O.C. 886(2)23258878
0127059 Hsinhsing Branch 1, Liouhe 1st Road, Kaohsiung City, Taiwan 80055, R.O.C. 886(7)2391515
0127060 Chungcheng Branch 476, Chungcheng Road, Taoyuan City, Taoyuan County, Taiwan 33047, R.O.C. 886(3)3350335
0127071 Taichung Branch 196, Sec.2, Liuchuan W. Road., Taichung City, Taiwan 40357, R.O.C. 886(4)22221911
0127093 Sungshan Branch 421, Sungshan Road, Taipei City, Taiwan 11083, R.O.C. 886(2)27281199
0127107 Tucheng Branch 100, Sec.1, Chungyang Road, Tucheng City, Taipei County, Taiwan 23664,
886(2)22709898
19
Branches Address and Telephone Number Code Branch Name Address Tel.
R.O.C.
0127118 Tainan Branch 1666, Chungshan Road, Tainan City, Taiwan 70043, R.O.C. 886(6)2290266
0127129 Fengshan Branch 223, Tzeyu Road, Fengshan City, Kaohsiung County, Taiwan 83074, R.O.C.
886(7)7482088
0127130 Chungli Branch 119, Sec.2, Chungpei Road, Chungli City, Taoyuan County, Taiwan 32097, R.O.C.
886(3)4595766
0127152 Anho Branch B1, 169, Sec.4, Jenai Road, Taipei City, Taiwan 10686, R.O.C. 886(2)27787717
0127163 Chengyi Branch 279, Chengyi N. Road,Sanchung City, Taipei County, Taiwan 24146, R.O.C. 886(2)29806688
0127174 Tanan Branch 968, Sec.1, Chiehshou Road, Pate City, Taoyuan County, Taiwan 33442, R.O.C. 886(3)3616565
0127185 Chiayi Branch 395, Jenai Road, Chiayi City, Taiwan 60045, R.O.C. 886(5)2231688
0127196 Lingya Branch 39, Chunghua 4th Road, Kaohsiung City, Taiwan 80245, R.O.C. 886(7)3318822
0127211 Panchiao Branch 266, Sec.1, Wenhua Road, Panchiao City, Taipei County, Taiwan 22041, R.O.C. 886(2)22549999
0127222 Pei Taichung Branch 333, Sec.4, Wenhsin Road, Taichung City, Taiwan 40666, R.O.C. 886(4)22426222
0127233 Sanmin Branch 48, Tashuen 2nd Road, Sanmin District, Kaohsiung City, Taiwan 80787, R.O.C. 886(7)3871299
0127244 Chienkuo Branch 196, Sec.2, Chienkuo N. Road., Taipei City, Taiwan 10483, R.O.C. 886(2)25151775
0127255 Hsinchu Branch 141, Chungcheng Road, Hsinchu City, Taiwan 30051, R.O.C. 886(3)5278988
0127266 Hsintien Branch 266, Sec.2, Peihsin Road, Hsintien City, Taipei County, Taiwan 23143, R.O.C. 886(2)29129977
0127277 Tienmu Branch 36, Tienmu E. Road, Taipei City, Taiwan 11153, R.O.C. 886(2)28763232
0127288 Hsichih Branch 175, Sec.1, Tatong Road, Hsichih City, Taipei County, Taiwan 22145, R.O.C. 886(2)26411689
0127299 Huanbei Branch 392, Huanpei Road, Chungli City, Taoyuan County, Taiwan 32070, R.O.C. 886(3)4265199
0127303 Yungkang Branch 856, Dawan Road, Yungkang City, 886(6)2736099

20
Branches Address and Telephone Number Code Branch Name Address Tel.
Tainan County, Taiwan 71070, R.O.C.
0127314 Hsiangyang Branch 9, Hsiangyang Road, Taipei City, Taiwan 10046, R.O.C. 886(2)23885889
0127336 Wuku Branch 445, Huacheng Road, Hsinchuang City, Taipei County, Taiwan 24253, R.O.C. 886(2)85213399
0127347 Hsinying Branch 301, Minchi Road, Hsinying City, Tainan County, Taiwan 73047, R.O.C. 886(6)6569889
0127358 Pingtung Branch 459, Hoping Road, Pingtung City, Pingtung County, Taiwan 90064, R.O.C. 886(8)7336899
0127369 Chienchen Branch 289, Paotai Road, Chienchen District, Kaohsiung City, Taiwan 80643, R.O.C. 886(7)7170055
0127370 Tunnan Branch 108, Sec.1, Tunhua S. Road, Taipei City, Taiwan 10557, R.O.C. 886(2)87719898
0127381 Paosheng Branch 3, Paosheng Road, Yungho City, Taipei County, Taiwan 23444, R.O.C. 886(2)89230888
0127392 Yuanlin Branch 596, Chukuang Road, Yuanlin City, Changhua County, Taiwan 51052, R.O.C. 886(4)8369189
0127406 Luotung Branch 286, Hsintung Road, Luotung Town, Ilan County, Taiwan 26541, R.O.C. 886(3)9566611
0127417 Juihu Branch 62, Juihu Street, Taipei City, Taiwan 11494, R.O.C. 886(2)26591088
0126753 Chientan MiniBranch 116, Sec.4, Chengteh Road, Taipei City, Taiwan 11167, R.O.C. 886(2)28866868
0126834 Kaiyuan MiniBranch 536, Chunghua Road, Yungkang City, Tainan County, Taiwan 71079, R.O.C. 886(6)2028585
0126867 Tunghu MiniBranch 25, Tunghu Road, Taipei City, Taiwan 11487, R.O.C. 886(2)26336677
0126889 Wuchia MiniBranch 493, Wuchia 2nd Road, Fengshan City, Kaohsiung County, Taiwan 83091, R.O.C.
886(7)8223111
0127428 Chiho MiniBranch 1721, Sec.2, Keelung Road, Taipei City, Taiwan 10675, R.O.C. 886(2)66388988
0127439 Nanchang MiniBranch 65, Sec.1, Hoping W. Road, Taipei City, Taiwan 10078, R.O.C.
886(2)6630567 8
0122043 Kuting Accounting Office 4Fl., 8, Sec.1, Roosevelt Road, Taipei City, Taiwan 10074, R.O.C. 886(2)23926508
0124210 Nankang Accounting Office
2Fl., 360, Sec.1, Nankang Road, Taipei City, Taiwan 11579, R.O.C. 886(2)27831442

21
Branches Address and Telephone Number Code Branch Name Address Tel.
0124416 Neihu Accounting Office 992, Sec.6, Minchuan E. Road, Taipei City, Taiwan 11466, R.O.C. 886(2)27915130
Los Angeles Branch 14TH FLOOR, 100 WALL STREET NEW YORK,NY 10005 U.S.A
(0021212)
9689888
New York Agency 33RD FLOOR,SUITE #3300 700 SOUTH FLOWER STREET LOS ANGELES CA90017 U.S.A
(0021213) 2369151
Hong Kong Branch 34TH FLOOR 9 QUEEN’S ROAD, CENTRAL HONG KONG
(002852)
28227700
London Representative Office
1 BEAUFORT GARDENS
LONDON NW4 3QN,U.K
(00244208)
2038028

22
<Appendix1>
Annual Financial Report for 2004 and 2003

23
INDEPENDENT AUDITORS’ REPORT
The Board of Directors and Shareholders Fubon Bank Co., Ltd.
We have audited the accompanying balance sheets of Fubon Bank Co., Ltd. as of December 31, 2004 and 2003 and the related statements of income, changes in shareholders’ equity and cash flows for the years then ended. These financial statements are the responsibility of the Bank’s management. Our responsibility is to express an opinion on these financial statements based on our audits.
We conducted our audits in accordance with the Rules Governing the Auditing and Certification of Financial Statements of Financial Institutions by Certified Public Accountants and auditing standards generally accepted in the Republic of China. Those standards require that we plan and perform the audit to obtain reasonable assurance about whether the financial statements are free of material misstatement. An audit includes examining, on a test basis, evidence supporting the amounts and disclosures in the financial statements. An audit also includes assessing the accounting principles used and significant estimates made by management, as well as evaluating the overall financial statement presentation. We believe that our audits provide a reasonable basis for our opinion.
In our opinion, the financial statements referred to above present fairly, in all material respects, the financial position of Fubon Bank Co., Ltd. as of December 31, 2004 and 2003, and the results of its operations and its cash flows for the years then ended, in conformity with Criteria Governing the Preparation of Financial Reports by Public Banks (effective January 1, 2004), Criteria Governing the Preparation of Financial Reports by Securities Issuers (applicable for 2003) and accounting principles generally accepted in the Republic of China.
As described in Note 3, sales and purchases of bonds and shortterm bills under agreements to repurchase or to resell were treated as outright sales or purchases in 2003. In 2004, under the “Criteria Governing the Preparation of Financial Reports by Public Banks” effective January 1, 2004, the repurchase/resell transactions are treated as financing.
We have also audited the consolidated financial statements of Fubon Bank as of and for the years ended December 31, 2004 and 2003, on which we have issued a modified unqualified opinion thereon.
January 25, 2005
Notice to Readers
The accompanying financial statements are intended only to present the financial position, results of operations and cash flows in accordance with accounting principles and practices generally accepted in the Republic of China and not those of any other jurisdictions. The standards, procedures and practices to audit such financial statements are those generally accepted and applied in the Republic of China.
For the convenience of readers, the auditors’ report and the accompanying financial statements have been translated into English from the original Chinese version prepared and used in the Republic of China. If there is any conflict between the English version and the original Chinese version or any difference in the interpretation of the two versions, the Chineselanguage auditors’ report and financial statements shall prevail.

24
FUBON BANK CO., LTD.
BALANCE SHEETS DECEMBER 31, 2004 AND 2003 (In Thousands of New Taiwan Dollars, Except Par Value)
2004 2003 2004 2003 ASSETS Amount % Amount % LIABILITIES AND SHAREHOLDERS’ EQUITY Amount % Amount %
CASH AND CASH EQUIVALENTS (Notes 2 and 4) $ 4,949,638 1 $ 5,567,244 2 LIABILITIES Due to banks (Note 11) $ 2,495,414 1 $ 4,406,959 1
DUE FROM CENTRAL BANK AND BANKS (Notes 2 and 5) 23,030,585 7 44,946,386 16 Payables (Notes 2 and 12) 6,048,360 2 6,053,305 2 Repurchase agreements (Note 2) 25,760,412 8
SECURITIES PURCHASED, NET (Notes 2 and 6) 88,128,211 27 72,269,878 25 Advance receipts 773,412 357,292 Deposits and remittances (Note 13) 231,482,544 70 221,433,147 77
RECEIVABLES, NET (Notes 2 and 7) 35,666,338 11 35,964,991 12 Bank debentures (Note 14) 29,400,000 9 22,500,000 8 Other liabilities (Notes 2 and 15) 1,488,372 1,676,441 1
PREPAYMENTS 319,994 172,313 Total liabilities 297,448,514 90 256,427,144 89
BILLS, DISCOUNTS AND LOANS, NET (Notes 2 and 8) 122,098,693 37 112,521,388 39 SHAREHOLDERS’ EQUITY
LONGTERM INVESTMENTS, NET (Notes 2 and 9) Capital stock $10 par value Longterm equity investments under the equity method 7,122,098 2 6,963,973 3 Authorized and issued 2,185,736,697 shares 21,857,367 7 21,857,367 8 Longterm equity investments under the cost method 3,452,865 1 2,795,171 1 Capital surplus Longterm bond investments 38,507,131 12 456,501 Paidin capital in excess of par value 1,437,250 1,437,250
Reissuance of treasury stock 26,054 26,054 Longterm investments, net 49,082,094 15 10,215,645 4 Retained earnings
Legal reserve 5,148,426 2 3,801,201 1 OTHER FINANCIAL ASSETS (Note 2) 1,379,199 832,623 Special reserve 252,058 252,058
Unappropriated 4,365,274 1 4,596,072 2 PROPERTIES (Note 2) Unrealized loss on longterm equity investments (60,541 ) (61,191 ) Cost Land 2,574,997 1 2,574,997 1 Total shareholders’ equity 33,025,888 10 31,908,811 11 Buildings 2,211,693 1 2,205,374 1 Equipment 1,154,798 936,874 CONTINGENCIES AND COMMITMENTS (Notes 2 and 24) Transportation and communications equipment 76,692 109,050 Miscellaneous equipment 362,559 349,376 Leasehold improvements 600,806 569,579 Total cost 6,981,545 2 6,745,250 2
Less: Accumulated depreciation 1,968,824 1,777,540 5,012,721 2 4,967,710 2
Advances for acquisition of equipment and construction in progress 264,617 42,996
Net properties 5,277,338 2 5,010,706 2
OTHER ASSETS, NET (Notes 2 and 10) 542,312 834,781
TOTAL $ 330,474,402 100 $ 288,335,955 100 TOTAL $ 330,474,402 100 $ 288,335,955 100
The accompanying notes are an integral part of the financial statements.
(With Deloitte & Touche audit report dated January 25, 2005)
25
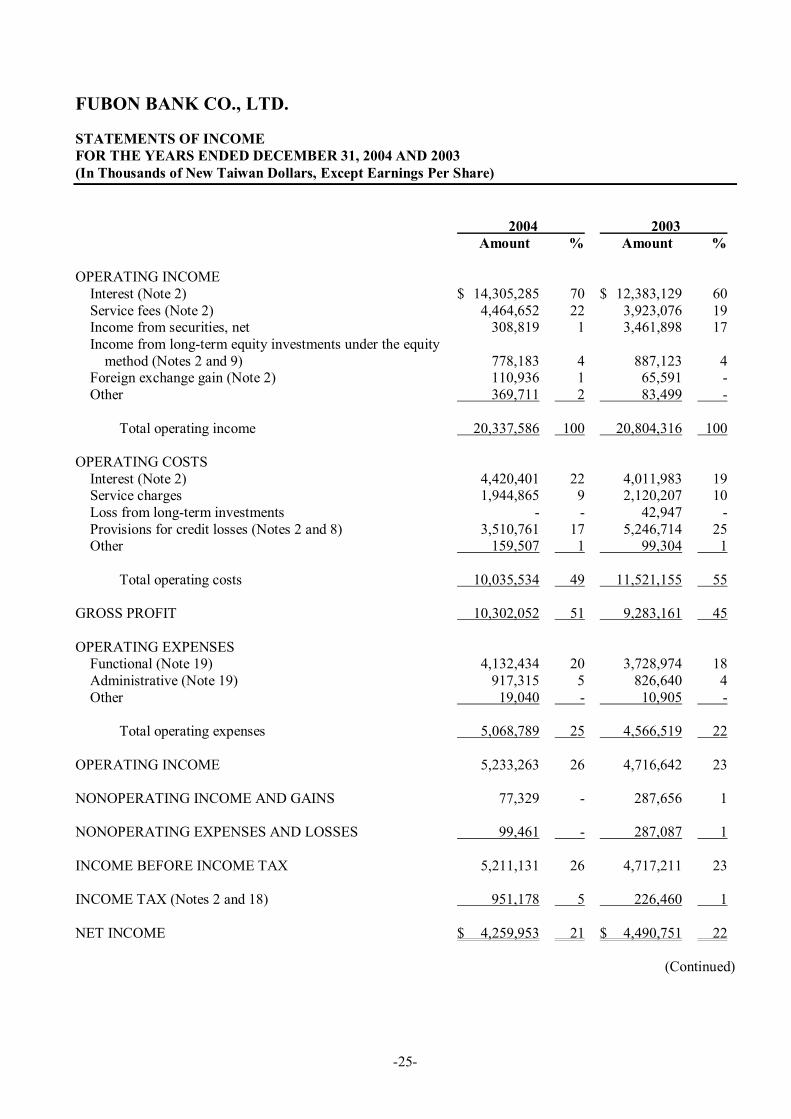
FUBON BANK CO., LTD.
STATEMENTS OF INCOME FOR THE YEARS ENDED DECEMBER 31, 2004 AND 2003 (In Thousands of New Taiwan Dollars, Except Earnings Per Share)
2004 2003 Amount % Amount %
OPERATING INCOME Interest (Note 2) $ 14,305,285 70 $ 12,383,129 60 Service fees (Note 2) 4,464,652 22 3,923,076 19 Income from securities, net 308,819 1 3,461,898 17 Income from longterm equity investments under the equity method (Notes 2 and 9) 778,183 4 887,123 4
Foreign exchange gain (Note 2) 110,936 1 65,591 Other 369,711 2 83,499
Total operating income 20,337,586 100 20,804,316 100
OPERATING COSTS Interest (Note 2) 4,420,401 22 4,011,983 19 Service charges 1,944,865 9 2,120,207 10 Loss from longterm investments 42,947 Provisions for credit losses (Notes 2 and 8) 3,510,761 17 5,246,714 25 Other 159,507 1 99,304 1
Total operating costs 10,035,534 49 11,521,155 55
GROSS PROFIT 10,302,052 51 9,283,161 45
OPERATING EXPENSES Functional (Note 19) 4,132,434 20 3,728,974 18 Administrative (Note 19) 917,315 5 826,640 4 Other 19,040 10,905
Total operating expenses 5,068,789 25 4,566,519 22
OPERATING INCOME 5,233,263 26 4,716,642 23
NONOPERATING INCOME AND GAINS 77,329 287,656 1
NONOPERATING EXPENSES AND LOSSES 99,461 287,087 1
INCOME BEFORE INCOME TAX 5,211,131 26 4,717,211 23
INCOME TAX (Notes 2 and 18) 951,178 5 226,460 1
NET INCOME $ 4,259,953 21 $ 4,490,751 22
(Continued)

26
2004 2003 After After
Pretax Tax Pretax Tax EARNINGS PER SHARE (Note 20) Basic earnings per share $ 2.38 $ 1.95 $ 2.16 $ 2.06
The accompanying notes are an integral part of the financial statements.
(With Deloitte & Touche audit report dated January 25, 2005) (Concluded)

27
FUBON BANK CO., LTD.
STATEMENTS OF CHANGES IN SHAREHOLDERS’ EQUITY FOR THE YEARS ENDED DECEMBER 31, 2004 AND 2003 (In Thousands of New Taiwan Dollars)
Unrealized Loss on
Longterm Capital Surplus (Notes 2 and 16) Equity Treasury
Capital Stock Additional Reissuance Retained Earnings (Notes 2 and 16) Investments Stock Total Shares (in Paidin of Treasury Legal Special (Notes 2 (Notes 2 Shareholders’ Thousands) Amount Capital Stock Total Reserve Reserve Unappropriated Total and 9) and 17) Equity
BALANCE, JANUARY 1, 2003 2,185,737 $ 21,857,367 $ 1,437,250 $ 6,510 $ 1,443,760 $ 3,576,309 $ 252,058 $ 854,960 $ 4,683,327 $ (134,725 ) $ (245,332 ) $ 27,604,397
Appropriation of 2002 earnings Legal reserve 224,892 (224,892 ) Cash dividends (518,747 ) (518,747 ) (518,747 ) Bonus to employees (6,000 ) (6,000 ) (6,000 )
Treasury stock reissued to employees 19,544 19,544 245,332 264,876
Reversal of unrealized loss on longterm equity investments 73,534 73,534
Net income for the year ended December 31, 2003 4,490,751 4,490,751 4,490,751
BALANCE, DECEMBER 31, 2003 2,185,737 21,857,367 1,437,250 26,054 1,463,304 3,801,201 252,058 4,596,072 8,649,331 (61,191 ) 31,908,811
Appropriation of 2003 earnings Legal reserve 1,347,225 (1,347,225 ) Cash dividends (3,111,526 ) (3,111,526 ) (3,111,526 ) Bonus to employees (32,000 ) (32,000 ) (32,000 )
Net income for the year ended December 31, 2004 4,259,953 4,259,953 4,259,953
Reversal of unrealized loss on longterm equity investments 650 650
BALANCE, DECEMBER 31, 2004 2,185,737 $ 21,857,367 $ 1,437,250 $ 26,054 $ 1,463,304 $ 5,148,426 $ 252,058 $ 4,365,274 $ 9,765,758 $ (60,541 ) $ $ 33,025,888
The accompanying notes are an integral part of the financial statements.
(With Deloitte & Touche audit report dated January 25, 2005)

28
FUBON BANK CO., LTD.
STATEMENTS OF CASH FLOWS FOR THE YEARS ENDED DECEMBER 31, 2004 AND 2003 (In Thousands of New Taiwan Dollars)
2004 2003
CASH FLOWS FROM OPERATING ACTIVITIES Net income $ 4,259,953 $ 4,490,751 Provision of allowance for losses on securities 185,541 Provision of allowance for longterm bond investments 19,061 62,057 Provision of loss on longterm equity investments 19,146 Provisions for credit losses 3,510,761 5,246,714 Depreciation and amortization 327,648 285,115 Income from disposal of nonperforming loans, net (31,027 ) Loss from transfer of securities purchased to longterm bond investments 2,031,372 Income from longterm equity investments under the equity method (778,183 ) (887,123 ) Cash dividends received 623,862 675,289 Losses (gains) on disposal of longterm investments (9,841 ) 23,801 Losses on disposal of properties, net 1,898 2,181 Losses on disposal of collaterals assumed 27,844 92,220 Unrealized losses on collaterals assumed 140,446 Increase (decrease) in accrued pension cost (7,476 ) 65,321 Deferred income tax 33,219 35,997 Amortization of premium on longterm bond investment 27,719 Decrease in receivables and prepayments 538,033 335,387 Increase (decrease) in payables and advances receipts 392,651 (2,971,347 )
Net cash provided by operating activities 11,293,481 7,475,509
CASH FLOWS FROM INVESTING ACTIVITIES Increase in securities purchased for investing purposes (58,433,303 ) (14,068,783 ) Decrease (increase) in due from Central Bank and banks 21,915,801 (13,555,823 ) Decrease (increase) in bills, discounts and loans (13,463,660 ) 2,926,288 Increase in longterm equity investments (3,154 ) Increase in longterm bond investments (2,384,677 ) (271,984 ) Proceeds from disposal of longterm investments 3,529,685 816,766 Acquisition of properties (707,098 ) (288,365 ) Proceeds from disposal of properties 123,188 9,044 Increase in other financial assets (546,576 ) (436,627 ) Proceeds from disposal of collaterals assumed 120,290 241,677 Increase in other assets (41,598 ) (44,934 )
Net cash used in investing activities (49,891,102 ) (24,772,741 )
CASH FLOWS FROM FINANCING ACTIVITIES Increase (decrease) in due to banks (1,911,545 ) 2,840,971 Increase in repurchase agreements 25,760,412 Increase in deposits and remittances 10,049,397 2,591,959 Increase in bank debentures 6,900,000 12,500,000 Increase (decrease) in other liabilities (188,069 ) 504,764 Cash dividends and employee bonus paid (3,111,526 ) (524,747 )
(Continued)
29
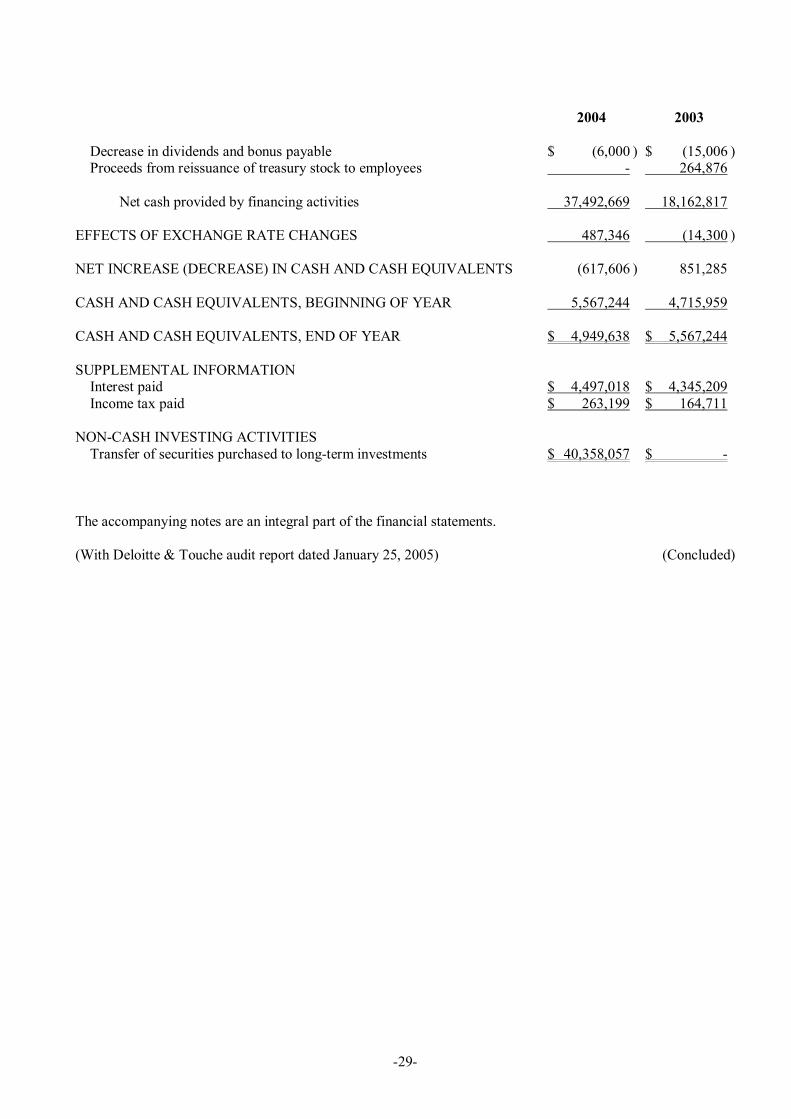
2004 2003
Decrease in dividends and bonus payable $ (6,000 ) $ (15,006 ) Proceeds from reissuance of treasury stock to employees 264,876
Net cash provided by financing activities 37,492,669 18,162,817
EFFECTS OF EXCHANGE RATE CHANGES 487,346 (14,300 )
NET INCREASE (DECREASE) IN CASH AND CASH EQUIVALENTS (617,606 ) 851,285
CASH AND CASH EQUIVALENTS, BEGINNING OF YEAR 5,567,244 4,715,959
CASH AND CASH EQUIVALENTS, END OF YEAR $ 4,949,638 $ 5,567,244
SUPPLEMENTAL INFORMATION Interest paid $ 4,497,018 $ 4,345,209 Income tax paid $ 263,199 $ 164,711
NONCASH INVESTING ACTIVITIES Transfer of securities purchased to longterm investments $ 40,358,057 $
The accompanying notes are an integral part of the financial statements.
(With Deloitte & Touche audit report dated January 25, 2005) (Concluded)

30
FUBON BANK CO., LTD.
NOTES TO FINANCIAL STATEMENTS FOR THE YEARS ENDED DECEMBER 31, 2004 AND 2003 (In Thousands of New Taiwan Dollars, Unless Otherwise Stated)
1. ORGANIZATION AND OPERATIONS
Fubon Bank Co., Ltd. (the “Bank”) obtained authorization from the Ministry of Finance (“MOF”) of the Republic of China (ROC) to operate as a commercial bank on August 1, 1991 and started operations on April 20, 1992.
The Bank was established to engage in all commercial banking operations allowed by the Banking Law.
Through a share swap effective December 19, 2001, the Bank became an unlisted wholly owned subsidiary of Fubon Financial Holdings Co., Ltd. (FFH, a newly formed financial holdings company under the ROC Financial Holdings Company Act).
As of December 31, 2004, the Bank’s operating units included Banking, Trust Department, International Division of the Head Office, an offshore banking unit (OBU) and 38 domestic branches.
The operations of the Bank’s Trust Department are (1) planning, managing and operating of a trust business; and (2) custody of nondiscretionary trust funds in overseas securities and mutual funds. These operations are regulated under the Banking Law and the Trust Law.
As of December 31, 2004 and 2003, the Bank had 2,320 and 1,960 employees, respectively.
To fully harness the synergy of both diversified business operations and decrease operating costs, the Bank planned to merge with Taipei Bank (wholly owned subsidiary of Fubon Financial Holdings Co., Ltd.) on January 1, 2005 with Taipei Bank as the surviving entity after a decision reached by the board of directors of the two companies on September 8, 2004. The Bank will swap issued shares with Taipei Bank at a ratio of 1 to 0.675, resulting in 1,475,372,270 shares of common stock to be issued by Taipei Bank.
2. SUMMARY OF SIGNIFICANT ACCOUNTING POLICIES
The Bank’s financial statements were prepared in conformity with Criteria Governing the Preparation of Financial Reports by Public Banks (effective January 1, 2004), Criteria Governing the Preparation of Financial Reports by Securities Issuers (applicable for 2003) and generally accepted accounting principles in the ROC. Under these guidelines and principles, the Bank should estimate the allowance for credit losses, depreciation, pension, losses on suspended lawsuits and provision for losses on guarantees. Since operating conditions have an element of uncertainty, the estimates may vary from the actual amounts. Significant accounting policies of the Bank are summarized below:
Basis of Financial Statement Preparation
The accompanying financial statements include the accounts of the Head Office, the OBU and all branches. All interoffice balances and transactions have been eliminated.
31
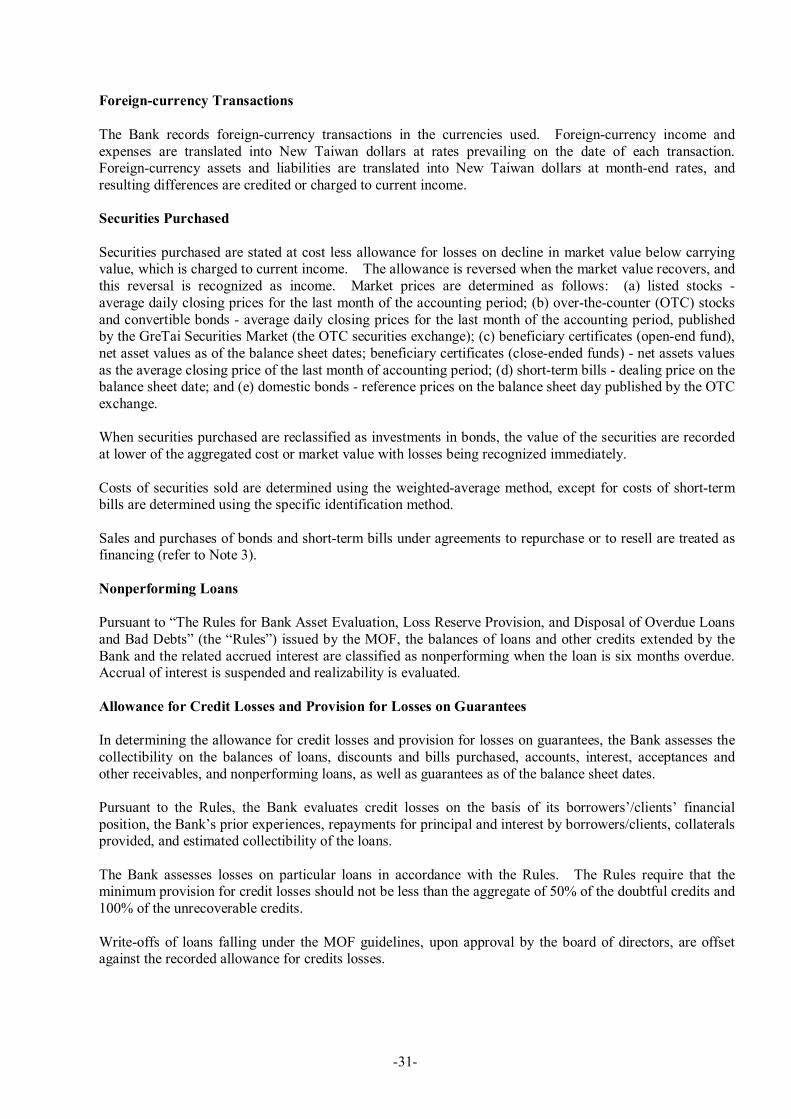
Foreigncurrency Transactions
The Bank records foreigncurrency transactions in the currencies used. Foreigncurrency income and expenses are translated into New Taiwan dollars at rates prevailing on the date of each transaction. Foreigncurrency assets and liabilities are translated into New Taiwan dollars at monthend rates, and resulting differences are credited or charged to current income.
Securities Purchased
Securities purchased are stated at cost less allowance for losses on decline in market value below carrying value, which is charged to current income. The allowance is reversed when the market value recovers, and this reversal is recognized as income. Market prices are determined as follows: (a) listed stocks average daily closing prices for the last month of the accounting period; (b) overthecounter (OTC) stocks and convertible bonds average daily closing prices for the last month of the accounting period, published by the GreTai Securities Market (the OTC securities exchange); (c) beneficiary certificates (openend fund), net asset values as of the balance sheet dates; beneficiary certificates (closeended funds) net assets values as the average closing price of the last month of accounting period; (d) shortterm bills dealing price on the balance sheet date; and (e) domestic bonds reference prices on the balance sheet day published by the OTC exchange.
When securities purchased are reclassified as investments in bonds, the value of the securities are recorded at lower of the aggregated cost or market value with losses being recognized immediately.
Costs of securities sold are determined using the weightedaverage method, except for costs of shortterm bills are determined using the specific identification method.
Sales and purchases of bonds and shortterm bills under agreements to repurchase or to resell are treated as financing (refer to Note 3).
Nonperforming Loans
Pursuant to “The Rules for Bank Asset Evaluation, Loss Reserve Provision, and Disposal of Overdue Loans and Bad Debts” (the “Rules”) issued by the MOF, the balances of loans and other credits extended by the Bank and the related accrued interest are classified as nonperforming when the loan is six months overdue. Accrual of interest is suspended and realizability is evaluated.
Allowance for Credit Losses and Provision for Losses on Guarantees
In determining the allowance for credit losses and provision for losses on guarantees, the Bank assesses the collectibility on the balances of loans, discounts and bills purchased, accounts, interest, acceptances and other receivables, and nonperforming loans, as well as guarantees as of the balance sheet dates.
Pursuant to the Rules, the Bank evaluates credit losses on the basis of its borrowers’/clients’ financial position, the Bank’s prior experiences, repayments for principal and interest by borrowers/clients, collaterals provided, and estimated collectibility of the loans.
The Bank assesses losses on particular loans in accordance with the Rules. The Rules require that the minimum provision for credit losses should not be less than the aggregate of 50% of the doubtful credits and 100% of the unrecoverable credits.
Writeoffs of loans falling under the MOF guidelines, upon approval by the board of directors, are offset against the recorded allowance for credits losses.
32
Investments in Shares of Stock
Investments in companies wherein the Bank exercises significant influence on their operating and financial policy decisions are accounted for by the equity method. Under the equity method, the investments are carried at cost on the acquisition date and subsequently adjusted for the Bank’s equity in the investees’ net income or loss. Any cash dividends received are accounted for as reduction in the carrying values of the investments. When the investment is acquired or when the equity method is first adopted, the difference between the investment cost and the Bank’s equity in the investee’s net asset is amortized over 5 years.
Other investments in shares of stocks with no quoted market price are accounted for at cost. The carrying amount of the investment is reduced to reflect a decline of market values other than temporary below carrying values, with the related losses charged to current income. Other investments in shares of stock with quoted market price are stated at the lower of cost or market. The reduction of the carrying value of an investment to reflect a lower market value and its writeup due to the subsequent recovery in market value are charged or credited to stockholders’ equity, respectively. Cash dividends received after the acquisition year are recorded as investment income.
Under accounting principles generally accepted in the ROC, in applying the lower of cost or market method, the shares of the Fubon Financial Holdings held by the Bank should be evaluated separately from the listed stocks.
For both equitymethod and costmethod investments, stock dividends received are accounted for only as increases in the number of shares held.
Costs of investments sold are determined using the weightedaverage method.
If the values of longterm equity investments have been impaired, the loss from investments is recognized and carrying value of longterm equity investments is modified.
Investments in Bonds
Investments in bonds are stated at cost. Premium or discount is amortized (as a charge or credit to interest income) using the straightline method over the remaining terms of the bonds.
If the value of longterm bond investments have been impaired permanently, the losses from investments will be recognized and carrying values of longterm bond investments will be modified.
Properties
Properties are stated at cost less accumulated depreciation. Major renewals, additions and improvements are capitalized, while repairs and maintenance are expensed as incurred.
Depreciation is calculated by the straightline method over service lives estimated as follows: buildings, 5 to 47 years; equipment, 3 to 4 years; transportation and communications equipment, 3 to 5 years; miscellaneous equipment, 5 to 8 years; and leasehold improvements, lower of contract period or service lives. For assets that have reached their residual value but are still in use, further depreciation is calculated on the basis of any remaining salvage value and newly estimated service lives.
Upon sale or other disposal of properties, their cost and related accumulated depreciation are removed from the accounts. Any resulting gain (loss) or revenue (expense) is credited (charged) to current income.
Collaterals Assumed
Collaterals assumed are recorded at cost (included in other assets) and revalued at the lower of cost or net realizable value as of the balance sheet dates.

33
Operating Leases
The Bank has operating lease agreements on the office spaces used by its branches. The imputed interest on lease deposits (included as part of other financial assets), computed using the interest rate on oneyear time deposit, is charged to functional expenses rent and credited to interest income.
Treasury Stock
Issued stock reacquired is carried at cost and presented as a deduction to arrive at shareholders’ equity. The treasury stocks are to be reissued to employees. The reissuance of treasury stocks is accounted for as follows: (a) reissue price higher than the acquisition cost the excess is credited to capital surplus reissuance of treasury stock; and (b) reissue price less than the acquisition cost initially charged to capital surplus reissuance of treasury stock, with any remaining deficiency charged to unappropriated earnings.
Pension
Pension costs on defined benefit plans are determined on the basis of actuarial calculations. Unrecognized net transition obligation is amortized over the average remaining service years of employees.
Interest Revenue and Service Fees
Interest revenue is recorded using the accrual method. No interest revenue is recognized in the accompanying financial statements on loans and other credits extended by the Bank that are classified as nonperforming loans. The interest revenue on those loans/credits is recognized upon collection.
Under the regulations of the MOF, the interest revenue on credits covered by agreements that extend their maturity is recorded as deferred revenue (included as other liabilities) and recognized as revenue upon collection.
Service fees are recorded as income upon receipt and substantial completion of activities involved in the earnings process.
Income Tax
Interperiod income tax allocation is applied, in which tax effects of deductible temporary differences, loss carryforwards and unused investment tax credits are recognized as deferred income tax assets and those of taxable temporary differences are recognized as deferred income tax liabilities. A valuation allowance is provided for deferred income tax assets that are not certain to be realized.
Tax credits for acquiring certain equipment or technology, research and development expenditures, personnel training expenditures and equity investments are recognized as reduction of current income tax.
Income tax on interest derived from shortterm negotiable instrument is levied separately.
Adjustments of prior years’ tax liabilities are included in the current year’s tax expense.
Income tax (10%) on unappropriated earnings is recorded as income tax in the year when the shareholders resolve the retention of the earnings.
The Bank and Fubon Financial Holdings and subsidiaries use a linkedtax system for income tax filings since 2002. Under the related rules, the accounting procedure is applied systematically on a consistent basis, and related contributions and payments are accrued as receivables and payables, respectively.
34
Foreign Exchange Forwards
Foreigncurrency assets and liabilities on forward exchange contracts for trading purposes are recorded at contracted forward rates on the contract starting dates. Gains or losses arising from the differences between the contracted forward rates and spot rates on settlement are credited or charged to current income. For contracts outstanding as of the balance sheet dates, the gains or losses arising from the differences between the contracted forward rates and the forward rates available for the remaining maturities of the contracts are credited or charged to related receivables or payables as of the balance sheet dates.
Nondeliverable forward contracts do not involve exchanges of principal upon settlement. Gains or losses arising from the differences between the contracted interest rates and actual interest rates upon settlement or as of the balance sheet dates are credited or charged to current income.
Currency Swap Contracts
Foreigncurrency spotposition assets or liabilities arising from currency swap contracts, which are mainly for managing risks on the Bank’s currency positions, are recorded at spot rates when the transactions occur. Discounts or premiums are amortized by the straightline method over the contract terms and are recorded as interest income or expense. The corresponding forwardposition assets or liabilities are recorded at the contracted forward rates. For contracts outstanding as of the balance sheet dates, the receivables and payables are netted out.
Crosscurrency Swaps
Crosscurrency swap contracts are recorded as memorandum entries at spot rates on the contract dates. The net interest receivable or payable on the settlement or balance sheet date is recorded as an adjustment to the revenue or expense associated with the item being hedged.
Crosscurrency swap contracts, which are for the purposes of accommodating customers’ needs or managing the Bank’s exposures, are marked to market as of the balance sheet dates. The interest received or paid at each settlement date or balance sheet date are recognized as interest income or expense, which are credited or charged to current income.
Asset Swaps
Asset swap contracts involve the exchange of interest payments on fixedrate bonds and stock conversion rights of convertible bonds for floatingrate interest. Gains or losses arising from the differences between these rates are recorded as adjustments to interest income or expense associated with the bonds being hedged.
Interest Rate Futures
Margin deposits paid by the Bank on futures contracts bought for trading purpose are recognized as assets. Both unrealized gain or loss arising from changes in market value of future contracts on the balance sheet dates, and realized gain or loss calculated on contract settlement date or from early settlement, are recognized as current income or loss and the book value of margin deposit will be adjusted.
Options
The amounts received from options written and amounts paid on options bought for the purposes of accommodating customers’ needs or managing the Bank’s exposures are recognized as liability and asset, respectively. The outstanding contracts are adjusted on the basis of market value on the balance sheet dates, and any gain or loss arising from the revaluation is shown as “net gain or loss on derivative financial instruments.” The gains or losses from the exercise of the options are charged to the current period.

35
Interest Rate Swaps
The Bank enters into interest rate swap agreements for the purposes of accommodating customers’ needs or managing the Banks’ exposures. Interest rate swaps do not involve exchanges of the notional principals, which are recorded on the contract dates using memorandum entries. The interest received or paid at each settlement date is recognized as interest income or expense. The outstanding agreements for trading purposes are recognized at market value on balance sheet dates.
For swaps entered into for hedging purposes, the net interest on each settlement is recorded as an adjustment to interest income or expense associated with the item being hedged.
Credit Default Swaps
Credit default swaps involve paying premium to transfer credit risk of denominated entities to third party. Such transactions are recorded by memorandum entries at the contract dates. The premium paid or accrual by the Bank for a credit default swap contract on each settlement or balance sheet date is recorded as current expense.
Contingencies
A loss is recognized when it is probable that an asset has been impaired or a liability has been incurred and the amount of loss can be reasonably estimated. If the amount of loss cannot be reasonably estimated and the loss is possible but remote, the reason for the possible loss is described as a footnote disclosure in the financial statements.
Reclassifications
Certain accounts for the year ended December 31, 2003 have been reclassified to conform to the presentation of the financial statements for the comparative period in 2004.
3. ACCOUNTING CHANGES
Under a directive issued by the MOF, bonds and shortterm bills under agreements to repurchase or to resell were treated as outright sales or purchases. However, under the “Criteria Governing the Preparation of Financial Reports by Public Banks” effective January 1, 2004, the repurchase/resell transactions are treated as financing. As a result of this change, pretax income for the year ended December 31, 2004 decreased by $191,558.
Since the repurchase/resell transactions of the Bank are daily financing activities with great volume, and the accounting systems had been revised for several times, the historical trading data are hard to trace, thus, calculating the cumulative effect of change in accounting principle is difficult. Thus, the Bank cannot calculate the cumulative effect of the change in accounting principle nor disclose the pro forma information.
4. CASH AND CASH EQUIVALENT
December 31 2004 2003
Cash on hand $ 1,739,249 $ 2,208,964 Checks for clearing 2,062,575 2,903,737 Due from banks 1,147,814 454,543
$ 4,949,638 $ 5,567,244
36
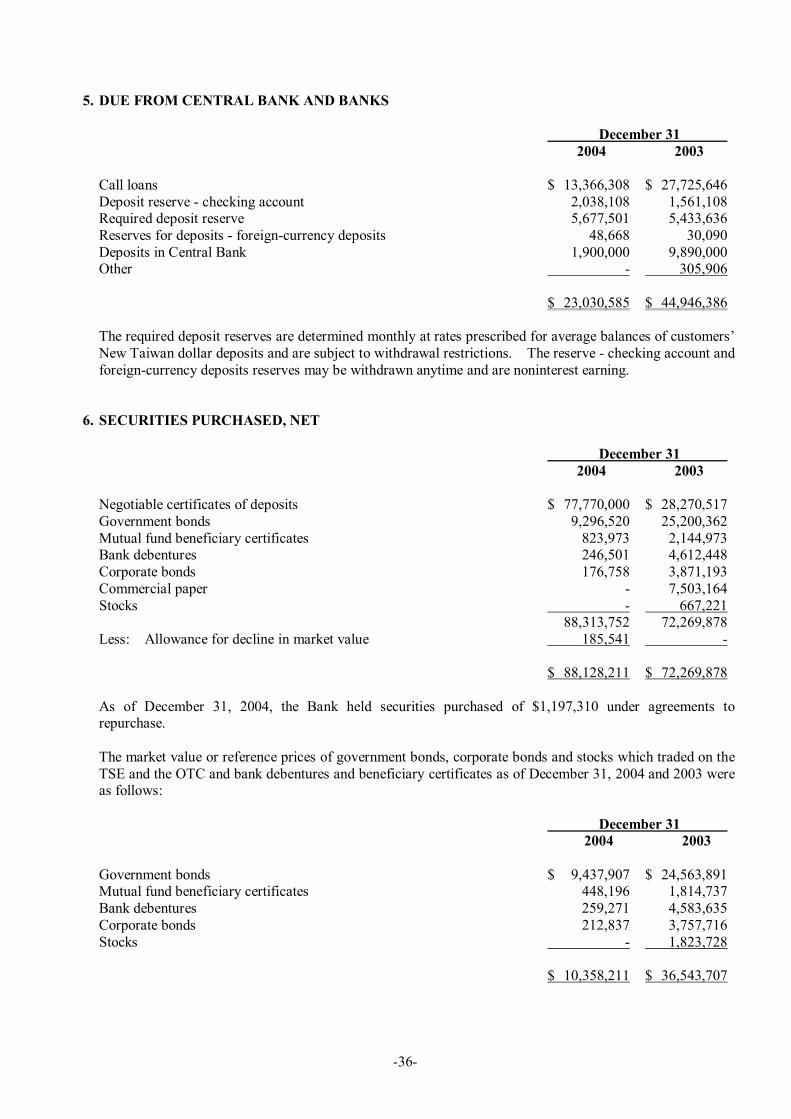
5. DUE FROM CENTRAL BANK AND BANKS
December 31 2004 2003
Call loans $ 13,366,308 $ 27,725,646 Deposit reserve checking account 2,038,108 1,561,108 Required deposit reserve 5,677,501 5,433,636 Reserves for deposits foreigncurrency deposits 48,668 30,090 Deposits in Central Bank 1,900,000 9,890,000 Other 305,906
$ 23,030,585 $ 44,946,386
The required deposit reserves are determined monthly at rates prescribed for average balances of customers’ New Taiwan dollar deposits and are subject to withdrawal restrictions. The reserve checking account and foreigncurrency deposits reserves may be withdrawn anytime and are noninterest earning.
6. SECURITIES PURCHASED, NET
December 31 2004 2003
Negotiable certificates of deposits $ 77,770,000 $ 28,270,517 Government bonds 9,296,520 25,200,362 Mutual fund beneficiary certificates 823,973 2,144,973 Bank debentures 246,501 4,612,448 Corporate bonds 176,758 3,871,193 Commercial paper 7,503,164 Stocks 667,221
88,313,752 72,269,878 Less: Allowance for decline in market value 185,541
$ 88,128,211 $ 72,269,878
As of December 31, 2004, the Bank held securities purchased of $1,197,310 under agreements to repurchase.
The market value or reference prices of government bonds, corporate bonds and stocks which traded on the TSE and the OTC and bank debentures and beneficiary certificates as of December 31, 2004 and 2003 were as follows:
December 31 2004 2003
Government bonds $ 9,437,907 $ 24,563,891 Mutual fund beneficiary certificates 448,196 1,814,737 Bank debentures 259,271 4,583,635 Corporate bonds 212,837 3,757,716 Stocks 1,823,728
$ 10,358,211 $ 36,543,707
37
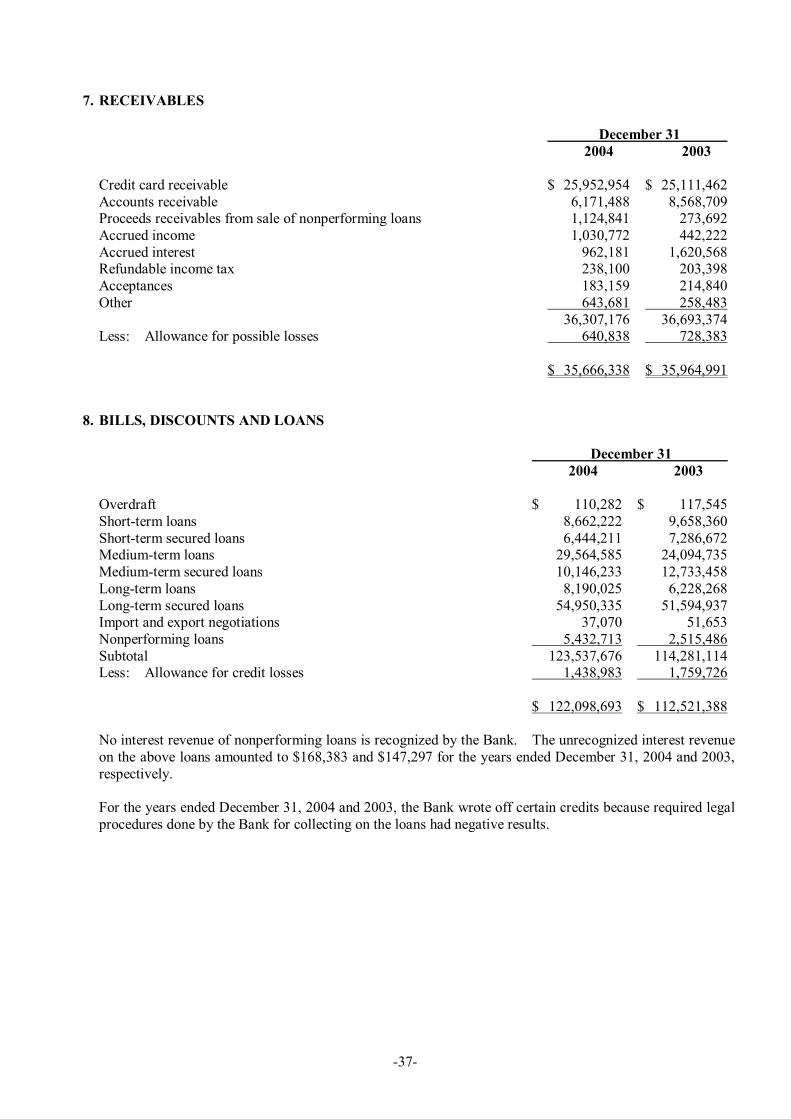
7. RECEIVABLES
December 31 2004 2003
Credit card receivable $ 25,952,954 $ 25,111,462 Accounts receivable 6,171,488 8,568,709 Proceeds receivables from sale of nonperforming loans 1,124,841 273,692 Accrued income 1,030,772 442,222 Accrued interest 962,181 1,620,568 Refundable income tax 238,100 203,398 Acceptances 183,159 214,840 Other 643,681 258,483
36,307,176 36,693,374 Less: Allowance for possible losses 640,838 728,383
$ 35,666,338 $ 35,964,991
8. BILLS, DISCOUNTS AND LOANS
December 31 2004 2003
Overdraft $ 110,282 $ 117,545 Shortterm loans 8,662,222 9,658,360 Shortterm secured loans 6,444,211 7,286,672 Mediumterm loans 29,564,585 24,094,735 Mediumterm secured loans 10,146,233 12,733,458 Longterm loans 8,190,025 6,228,268 Longterm secured loans 54,950,335 51,594,937 Import and export negotiations 37,070 51,653 Nonperforming loans 5,432,713 2,515,486 Subtotal 123,537,676 114,281,114 Less: Allowance for credit losses 1,438,983 1,759,726
$ 122,098,693 $ 112,521,388
No interest revenue of nonperforming loans is recognized by the Bank. The unrecognized interest revenue on the above loans amounted to $168,383 and $147,297 for the years ended December 31, 2004 and 2003, respectively.
For the years ended December 31, 2004 and 2003, the Bank wrote off certain credits because required legal procedures done by the Bank for collecting on the loans had negative results.

38
The details and changes in allowance for credit losses on bills, discounts and loans (including receivables shown in Note 7) are summarized below:
For the Year Ended December 31, 2004 Specific Risk General Risk Total
Balance, January 1, 2004 $ 1,315,666 $ 1,172,443 $ 2,488,109 Provision 4,064,264 (553,503 ) 3,510,761 Writeoff (4,587,480 ) (4,587,480 ) Recovery of writtenoff credits 611,470 611,470 Other 56,961 56,961
Balance, December 31, 2004 $ 1,460,881 $ 618,940 $ 2,079,821
For the Year Ended December 31, 2003 Specific Risk General Risk Total
Balance, January 1, 2003 $ 1,301,566 $ 1,261,905 $ 2,563,471 Provision 5,336,176 (89,462 ) 5,246,714 Writeoff (5,654,543 ) (5,654,543 ) Recovery of writtenoff credits 334,222 334,222 Other (1,755 ) (1,755 )
Balance, December 31, 2003 $ 1,315,666 $ 1,172,443 $ 2,488,109
9. LONGTERM INVESTMENTS
December 31 2004 2003
Percentage Percentage Carrying of Owner Carrying of Owner Value ship (%) Value ship (%)
Equity investments
Equity method Fubon Bills Finance Co., Ltd. $ 6,209,475 100.00 $ 6,085,481 100.00 Fubon Leasing Co., Ltd. 784,082 99.99 765,528 99.99 Fubonbank Insurance Agent Co., Ltd. 79,758 100.00 64,819 95.00 Fubon Construction Management Co., Ltd. 45,295 30.00 45,842 30.00 Fubon Insurance Agent Co., Ltd. 3,488 100.00 2,303 99.00
7,122,098 6,963,973 Cost method
Listed Taiwan Cellular Co., Ltd. 2,007,637 1.32 Fubon Financial Holding Co., Ltd. 1,164,336 0.50 KuoYang Construction Co., Ltd. 2,571 0.14
(Continued)
39
December 31 2004 2003
Percentage Percentage Carrying of Owner Carrying of Owner Value ship (%) Value ship (%)
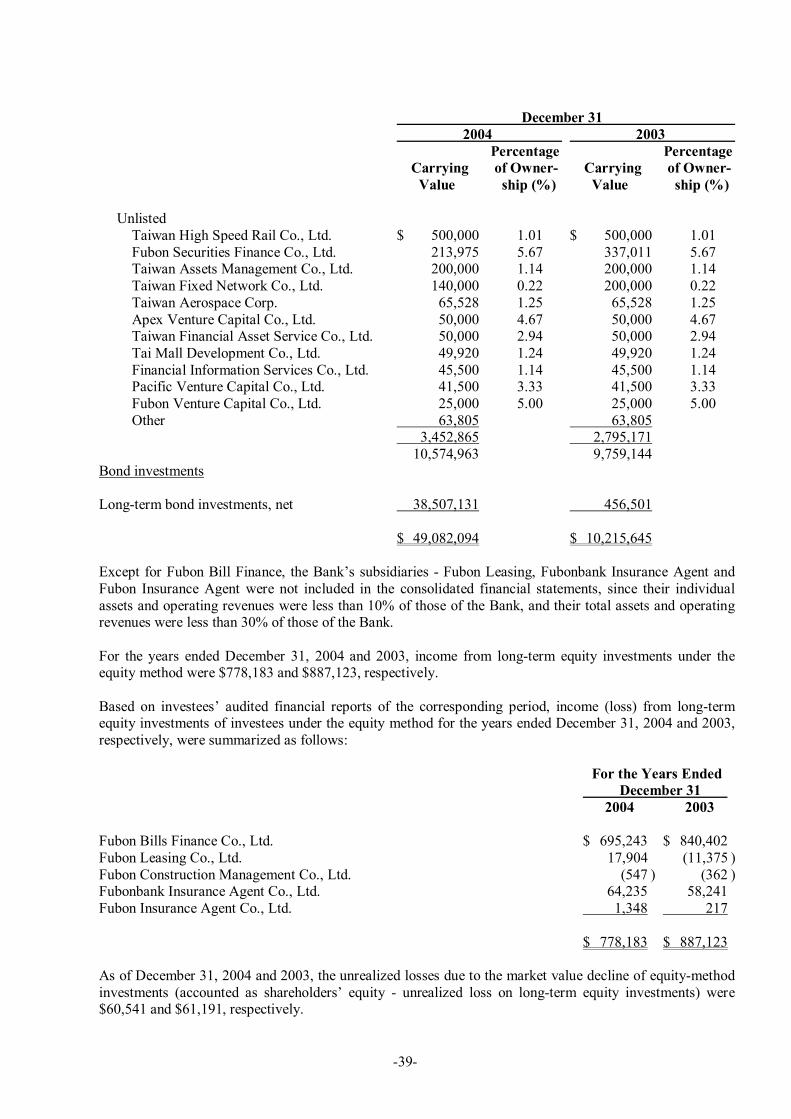
Unlisted Taiwan High Speed Rail Co., Ltd. $ 500,000 1.01 $ 500,000 1.01 Fubon Securities Finance Co., Ltd. 213,975 5.67 337,011 5.67 Taiwan Assets Management Co., Ltd. 200,000 1.14 200,000 1.14 Taiwan Fixed Network Co., Ltd. 140,000 0.22 200,000 0.22 Taiwan Aerospace Corp. 65,528 1.25 65,528 1.25 Apex Venture Capital Co., Ltd. 50,000 4.67 50,000 4.67 Taiwan Financial Asset Service Co., Ltd. 50,000 2.94 50,000 2.94 Tai Mall Development Co., Ltd. 49,920 1.24 49,920 1.24 Financial Information Services Co., Ltd. 45,500 1.14 45,500 1.14 Pacific Venture Capital Co., Ltd. 41,500 3.33 41,500 3.33 Fubon Venture Capital Co., Ltd. 25,000 5.00 25,000 5.00 Other 63,805 63,805
3,452,865 2,795,171 10,574,963 9,759,144
Bond investments
Longterm bond investments, net 38,507,131 456,501
$ 49,082,094 $ 10,215,645
Except for Fubon Bill Finance, the Bank’s subsidiaries Fubon Leasing, Fubonbank Insurance Agent and Fubon Insurance Agent were not included in the consolidated financial statements, since their individual assets and operating revenues were less than 10% of those of the Bank, and their total assets and operating revenues were less than 30% of those of the Bank.
For the years ended December 31, 2004 and 2003, income from longterm equity investments under the equity method were $778,183 and $887,123, respectively.
Based on investees’ audited financial reports of the corresponding period, income (loss) from longterm equity investments of investees under the equity method for the years ended December 31, 2004 and 2003, respectively, were summarized as follows:
For the Years Ended December 31
2004 2003
Fubon Bills Finance Co., Ltd. $ 695,243 $ 840,402 Fubon Leasing Co., Ltd. 17,904 (11,375 ) Fubon Construction Management Co., Ltd. (547 ) (362 ) Fubonbank Insurance Agent Co., Ltd. 64,235 58,241 Fubon Insurance Agent Co., Ltd. 1,348 217
$ 778,183 $ 887,123
As of December 31, 2004 and 2003, the unrealized losses due to the market value decline of equitymethod investments (accounted as shareholders’ equity unrealized loss on longterm equity investments) were $60,541 and $61,191, respectively.

40
As of December 31, 2003, the market value of the Bank’s equity in KuoYang Construction Co., Ltd. fell below carrying value, and this decline was considered other than temporary; thus, the Bank recognized $19,146 as loss on longterm equity investment.
Based on the average closing prices in December of 2004 and 2003, the market values of the listed stocks were $2,136,148 and $1,350,366, respectively, including the market value of Fubon Financial Holdings of $1,347,907 in 2003.
In March 2004, the Bank transferred investment in Taiwan Cellular Co., Ltd. from securities purchased to longterm equity investments. Also, longterm bond investments amounted to $38,350,420 was transferred from securities purchased in 2004 due to longterm holding intention.
As of December 31, 2004, the Bank held longterm bond investments of $12,169,498 under agreements to repurchase.
10. OTHER ASSETS, NET
December 31 2004 2003
Deferred income tax assets, net $ 209,956 $ 243,175 Deferred charges 154,042 110,429 Leasehold assets, net 139,301 141,860 Collaterals assumed, net 32,337 320,800 Other 6,676 18,517
$ 542,312 $ 834,781
11. DUE TO BANKS
December 31 2004 2003
Call loans $ 1,602,769 $ 3,722,036 Overdraft 691,140 418,183 Due to banks 201,505 203,179 Due to Central Bank 63,561
$ 2,495,414 $ 4,406,959
12. PAYABLES
December 31 2004 2003
Notes and checks in clearing $ 2,062,575 $ 2,903,737 Interest payable 979,597 895,349 Accrued expenses 922,491 1,019,716 Tax payable 889,394 120,659 Collections for others 121,677 297,404 Other 1,072,626 816,440
$ 6,048,360 $ 6,053,305
41
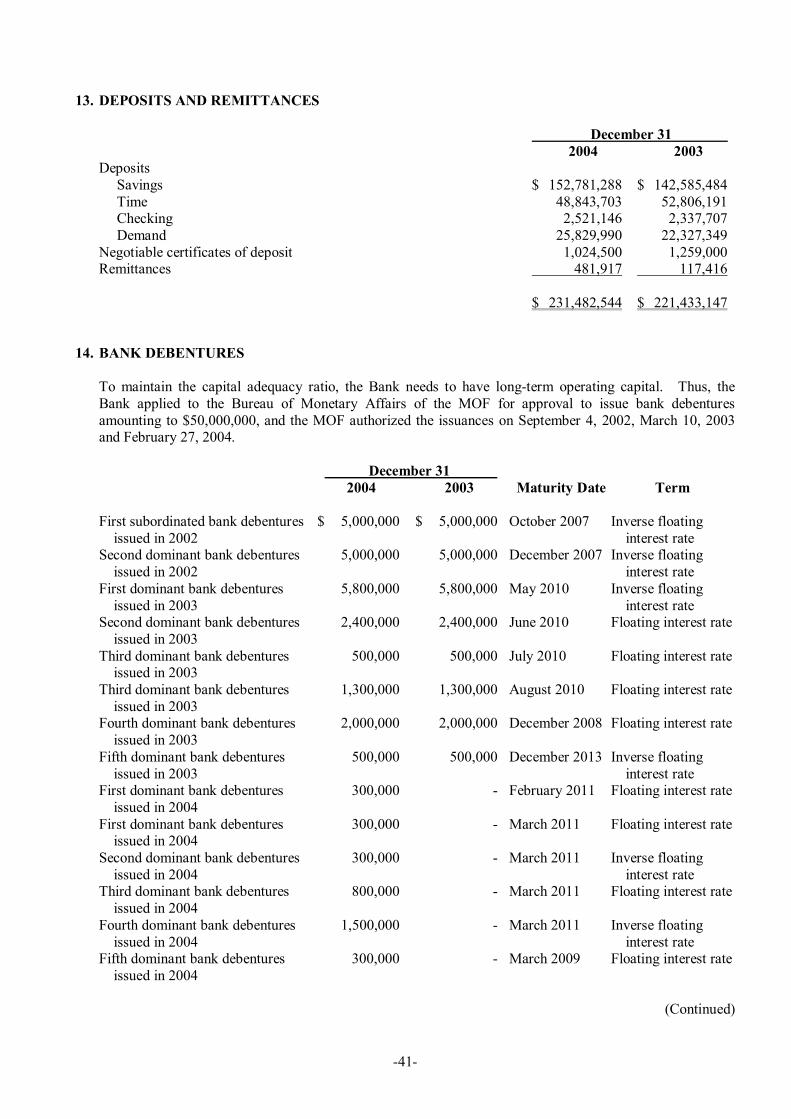
13. DEPOSITS AND REMITTANCES
December 31 2004 2003
Deposits Savings $ 152,781,288 $ 142,585,484 Time 48,843,703 52,806,191 Checking 2,521,146 2,337,707 Demand 25,829,990 22,327,349
Negotiable certificates of deposit 1,024,500 1,259,000 Remittances 481,917 117,416
$ 231,482,544 $ 221,433,147
14. BANK DEBENTURES
To maintain the capital adequacy ratio, the Bank needs to have longterm operating capital. Thus, the Bank applied to the Bureau of Monetary Affairs of the MOF for approval to issue bank debentures amounting to $50,000,000, and the MOF authorized the issuances on September 4, 2002, March 10, 2003 and February 27, 2004.
December 31 2004 2003 Maturity Date Term
First subordinated bank debentures issued in 2002
$ 5,000,000 $ 5,000,000 October 2007 Inverse floating interest rate
Second dominant bank debentures issued in 2002
5,000,000 5,000,000 December 2007 Inverse floating interest rate
First dominant bank debentures issued in 2003
5,800,000 5,800,000 May 2010 Inverse floating interest rate
Second dominant bank debentures issued in 2003
2,400,000 2,400,000 June 2010 Floating interest rate
Third dominant bank debentures issued in 2003
500,000 500,000 July 2010 Floating interest rate
Third dominant bank debentures issued in 2003
1,300,000 1,300,000 August 2010 Floating interest rate
Fourth dominant bank debentures issued in 2003
2,000,000 2,000,000 December 2008 Floating interest rate
Fifth dominant bank debentures issued in 2003
500,000 500,000 December 2013 Inverse floating interest rate
First dominant bank debentures issued in 2004
300,000 February 2011 Floating interest rate
First dominant bank debentures issued in 2004
300,000 March 2011 Floating interest rate
Second dominant bank debentures issued in 2004
300,000 March 2011 Inverse floating interest rate
Third dominant bank debentures issued in 2004
800,000 March 2011 Floating interest rate
Fourth dominant bank debentures issued in 2004
1,500,000 March 2011 Inverse floating interest rate
Fifth dominant bank debentures issued in 2004
300,000 March 2009 Floating interest rate
(Continued)
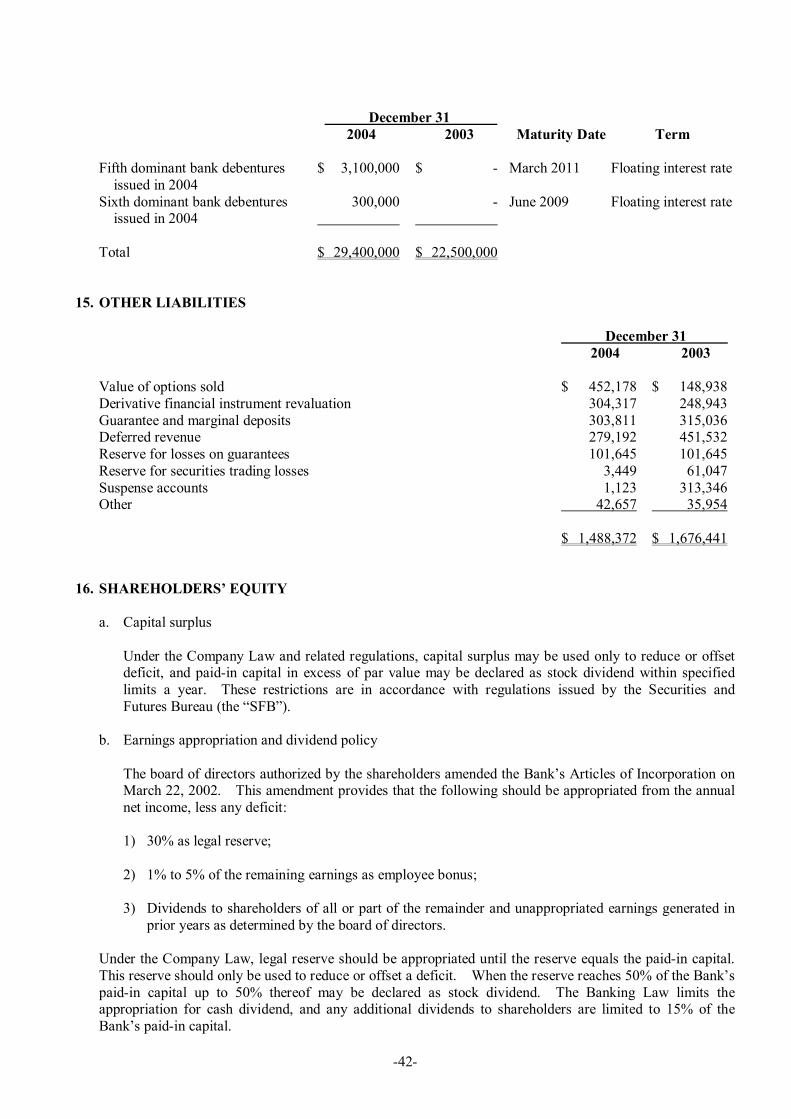
42
December 31 2004 2003 Maturity Date Term
Fifth dominant bank debentures issued in 2004
$ 3,100,000 $ March 2011 Floating interest rate
Sixth dominant bank debentures issued in 2004
300,000 June 2009 Floating interest rate
Total $ 29,400,000 $ 22,500,000
15. OTHER LIABILITIES
December 31 2004 2003
Value of options sold $ 452,178 $ 148,938 Derivative financial instrument revaluation 304,317 248,943 Guarantee and marginal deposits 303,811 315,036 Deferred revenue 279,192 451,532 Reserve for losses on guarantees 101,645 101,645 Reserve for securities trading losses 3,449 61,047 Suspense accounts 1,123 313,346 Other 42,657 35,954
$ 1,488,372 $ 1,676,441
16. SHAREHOLDERS’ EQUITY
a. Capital surplus
Under the Company Law and related regulations, capital surplus may be used only to reduce or offset deficit, and paidin capital in excess of par value may be declared as stock dividend within specified limits a year. These restrictions are in accordance with regulations issued by the Securities and Futures Bureau (the “SFB”).
b. Earnings appropriation and dividend policy
The board of directors authorized by the shareholders amended the Bank’s Articles of Incorporation on March 22, 2002. This amendment provides that the following should be appropriated from the annual net income, less any deficit:
1) 30% as legal reserve;
2) 1% to 5% of the remaining earnings as employee bonus;
3) Dividends to shareholders of all or part of the remainder and unappropriated earnings generated in prior years as determined by the board of directors.
Under the Company Law, legal reserve should be appropriated until the reserve equals the paidin capital. This reserve should only be used to reduce or offset a deficit. When the reserve reaches 50% of the Bank’s paidin capital up to 50% thereof may be declared as stock dividend. The Banking Law limits the appropriation for cash dividend, and any additional dividends to shareholders are limited to 15% of the Bank’s paidin capital.
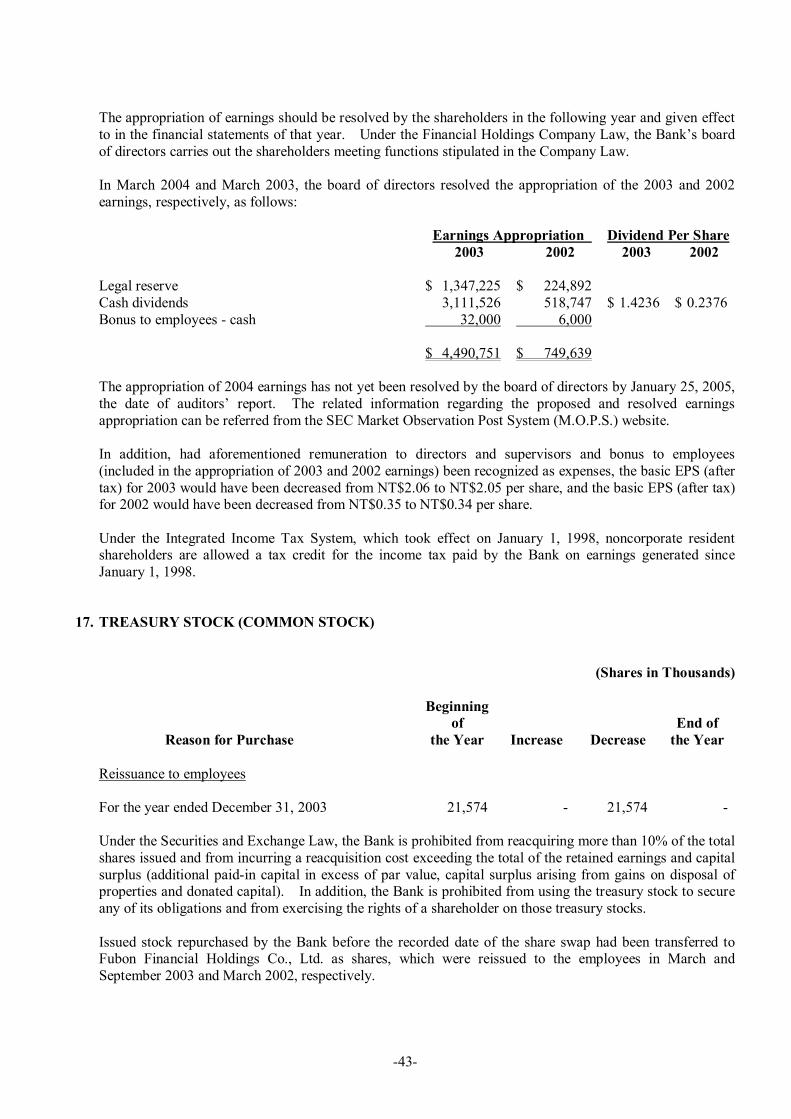
43
The appropriation of earnings should be resolved by the shareholders in the following year and given effect to in the financial statements of that year. Under the Financial Holdings Company Law, the Bank’s board of directors carries out the shareholders meeting functions stipulated in the Company Law.
In March 2004 and March 2003, the board of directors resolved the appropriation of the 2003 and 2002 earnings, respectively, as follows:
Earnings Appropriation Dividend Per Share 2003 2002 2003 2002
Legal reserve $ 1,347,225 $ 224,892 Cash dividends 3,111,526 518,747 $ 1.4236 $ 0.2376 Bonus to employees cash 32,000 6,000
$ 4,490,751 $ 749,639
The appropriation of 2004 earnings has not yet been resolved by the board of directors by January 25, 2005, the date of auditors’ report. The related information regarding the proposed and resolved earnings appropriation can be referred from the SEC Market Observation Post System (M.O.P.S.) website.
In addition, had aforementioned remuneration to directors and supervisors and bonus to employees (included in the appropriation of 2003 and 2002 earnings) been recognized as expenses, the basic EPS (after tax) for 2003 would have been decreased from NT$2.06 to NT$2.05 per share, and the basic EPS (after tax) for 2002 would have been decreased from NT$0.35 to NT$0.34 per share.
Under the Integrated Income Tax System, which took effect on January 1, 1998, noncorporate resident shareholders are allowed a tax credit for the income tax paid by the Bank on earnings generated since January 1, 1998.
17. TREASURY STOCK (COMMON STOCK)
(Shares in Thousands)
Beginning of End of
Reason for Purchase the Year Increase Decrease the Year
Reissuance to employees
For the year ended December 31, 2003 21,574 21,574
Under the Securities and Exchange Law, the Bank is prohibited from reacquiring more than 10% of the total shares issued and from incurring a reacquisition cost exceeding the total of the retained earnings and capital surplus (additional paidin capital in excess of par value, capital surplus arising from gains on disposal of properties and donated capital). In addition, the Bank is prohibited from using the treasury stock to secure any of its obligations and from exercising the rights of a shareholder on those treasury stocks.
Issued stock repurchased by the Bank before the recorded date of the share swap had been transferred to Fubon Financial Holdings Co., Ltd. as shares, which were reissued to the employees in March and September 2003 and March 2002, respectively.

44
18. INCOME TAX
Fubon Financial Holdings Co., Ltd. adopted the linkedtax system for income tax filings with its qualified subsidiaries, including the Bank.
a. Income tax expense:
For the Years Ended December 31
2004 2003
Current income tax $ 915,377 $ 57,721 Tax on unappropriated retained earnings 68,734 Separate taxes on shortterm bills interest revenue 118,742 43,095 Prior year’s tax adjustment (47,426 ) 20,913 Prior year’s effect of integrated income tax system (68,734 ) Deferred income tax 33,219 35,997
Income tax $ 951,178 $ 226,460
b. Reconciliation of tax on pretax income at statutory rate and current income tax:
For the Years Ended December 31
2004 2003
Tax on pretax income at 25% statutory rate $ 1,302,773 $ 1,179,293 Add (deduct) tax effects of: Taxexempt income 11,649 (438,093 ) Permanent difference (338,528 ) (482,178 ) Temporary difference (54,805 ) (22,576 ) Investment tax credits (5,712 ) (113,040 ) Other (65,685 )
Current income tax payable $ 915,377 $ 57,721
c. Deferred income tax assets (included in “other assets”) as of December 31, 2004 and 2003 consisted of the following:
December 31 2004 2003
Deferred income tax assets Excess for credit loss in tax limitation $ 131,554 $ 234,530 Other 78,402 8,645
Deferred tax assets, net $ 209,956 $ 243,175
d. Imputed tax credit:
Balance of shareholders’ imputed tax credit $ 112,566 $ 139,696
2004 2003 (Predicted) (Actual)
The ratio of imputed tax credit to earnings 2.58% 3.50%
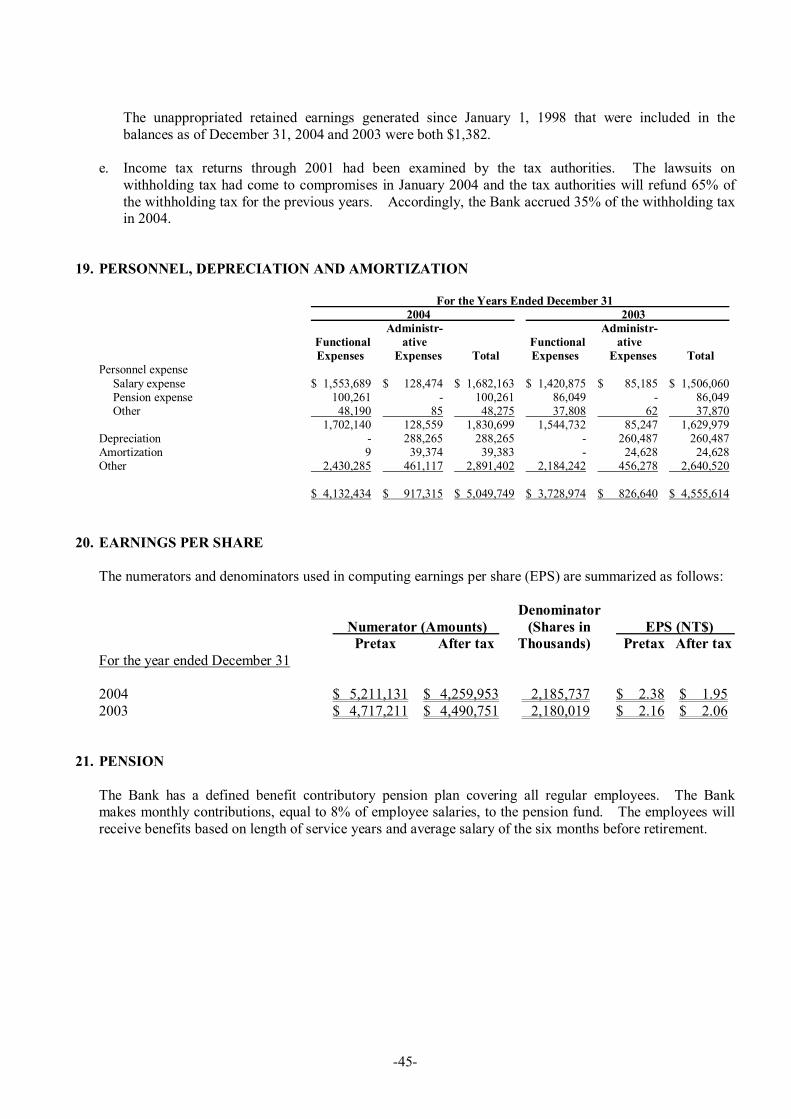
45
The unappropriated retained earnings generated since January 1, 1998 that were included in the balances as of December 31, 2004 and 2003 were both $1,382.
e. Income tax returns through 2001 had been examined by the tax authorities. The lawsuits on withholding tax had come to compromises in January 2004 and the tax authorities will refund 65% of the withholding tax for the previous years. Accordingly, the Bank accrued 35% of the withholding tax in 2004.
19. PERSONNEL, DEPRECIATION AND AMORTIZATION
For the Years Ended December 31 2004 2003
Administr Administr Functional ative Functional ative Expenses Expenses Total Expenses Expenses Total
Personnel expense Salary expense $ 1,553,689 $ 128,474 $ 1,682,163 $ 1,420,875 $ 85,185 $ 1,506,060 Pension expense 100,261 100,261 86,049 86,049 Other 48,190 85 48,275 37,808 62 37,870
1,702,140 128,559 1,830,699 1,544,732 85,247 1,629,979 Depreciation 288,265 288,265 260,487 260,487 Amortization 9 39,374 39,383 24,628 24,628 Other 2,430,285 461,117 2,891,402 2,184,242 456,278 2,640,520
$ 4,132,434 $ 917,315 $ 5,049,749 $ 3,728,974 $ 826,640 $ 4,555,614
20. EARNINGS PER SHARE
The numerators and denominators used in computing earnings per share (EPS) are summarized as follows:
Denominator Numerator (Amounts) (Shares in EPS (NT$) Pretax After tax Thousands) Pretax After tax
For the year ended December 31
2004 $ 5,211,131 $ 4,259,953 2,185,737 $ 2.38 $ 1.95 2003 $ 4,717,211 $ 4,490,751 2,180,019 $ 2.16 $ 2.06
21. PENSION
The Bank has a defined benefit contributory pension plan covering all regular employees. The Bank makes monthly contributions, equal to 8% of employee salaries, to the pension fund. The employees will receive benefits based on length of service years and average salary of the six months before retirement.

46
a. The reconciliation of the funded status of the plan and accrued pension cost as of December 31, 2004 and 2003 are as follows:
December 31 2004 2003
Benefit obligation Vested benefit obligation $ 18,084 $ 21,553 Nonvested benefit obligation 426,484 420,014 Accumulated benefit obligation 444,568 441,567 Additional benefits based on future salaries 242,843 250,434 Projected benefit obligation 687,411 692,001
Fair value of plan assets (639,264 ) (581,866 ) Funded status 48,147 110,135 Unrecognized net transition asset 730 852 Unrecognized pension loss (53,635 ) (114,469 )
Prepaid pension cost $ (4,758 ) $ (3,482 )
b. Actuarial assumptions
1) Discount rate used in determining present values 3.25% 3.25% 2) Future salary increase rate 3.00% 3.00% 3) Expected rate of return on plan assets 3.25% 3.25%
c. The changes in the pension fund are summarized below:
For the Years Ended December 31
2004 2003
Balance, January 1 $ 578,019 $ 512,697 Contributions 96,433 74,079 Benefits paid (45,320 ) (15,612 ) Interest and investment revenue 10,132 6,855
Balance, December 31 $ 639,264 $ 578,019
22. RELATEDPARTY TRANSACTIONS
The Bank’s related parties are as follows:
a. Related parties
Name Relationship to the Bank
Fubon Financial Holdings Co., Ltd. (FFH) Parent company Taipei City Government (TCG) Major shareholder of parent company Taipei Bank FFH’s equitymethod investee Fubon Insurance Co., Ltd. FFH’s equitymethod investee Fubon Life Insurance Co., Ltd. (FLI) FFH’s equitymethod investee Fubon Securities Co., Ltd. FFH’s equitymethod investee International Bank of Asia Limited FFH’s equitymethod investee
(Continued)

47
Name Relationship to the Bank
Fubon Securities Investment Trust Co., Ltd. and its affiliate funds (FSIT)
FFH’s equitymethod investee
Fubon Direct Marketing Consulting Co., Ltd. (FDM) FFH’s equitymethod investee Fubon Asset Management Co., Ltd. FFH’s equitymethod investee Fubon Venture Capital Consulting Co., Ltd. FFH’s equitymethod investee Taipei Bank Life Assurance Agent Co., Ltd. Taipei Bank’s equitymethod investee Fubon Bill Finance Co., Ltd. The Bank’s equitymethod investee Fubon Leasing Co., Ltd. The Bank’s equitymethod investee Fubon Construction Management Co., Ltd. (FCM) The Bank’s equitymethod investee Fubonbank Insurance Agent Co., Ltd. The Bank’s equitymethod investee Fubon Insurance Agent Co., Ltd. The Bank’s equitymethod investee Citibank Co., Ltd., Taipei Branch Related party in substance (Citibank was
not a related party since November 2004) Taipeibank Charitable Fundation Related party in substance Citi Securities Co., Ltd. Related party in substance (Citi Securities
was not a related party since November 2004)
Fubon Technology Consulting Co., Ltd. (FTC) Related party in substance Taiwan Cellular Co., Ltd. (TCC) Related party in substance Chung Hsing Land Development Co., Ltd. (CHLDC) Related party in substance International Investment Trust Co., Ltd. Related party in substance Ming Tong Co., Ltd. (MTC) Related party in substance Tao Yin Co., Ltd. Related party in substance Fubon Art Foundation (FAF) Related party in substance Fubon Charity Foundation (FCF) Related party in substance Kuang Hsin Printing Co., Ltd. Related party in substance Fubon Securities (BVI) Co., Ltd. Related party in substance Fubon Futures Co., Ltd. Related party in substance Fubon Venture Capital Co., Ltd. Related party in substance Sinostar Venture Capital Co., Ltd. Related party in substance Fubon Culture and Education Foundation (FCEF) Related party in substance Citi Fubon Life Insurance Company Hong Kong Limited Related party in substance Fubon Building Management Maintain Co., Ltd. Related party in substance Fubon Securities Finance Co., Ltd. Related party in substance Fubon Land Development Co., Ltd. Related party in substance Sinostar Capital Co., Ltd. Related party in substance FuAn Leasing Co., Ltd. Related party in substance Fubon Leisure and Entertainment Co., Ltd. Related party in substance Taiwan High Speed Rail Co., Ltd. Related party in substance Citi Insurance Agent Co., Ltd. Related party in substance Fubon Securities Investment Consulting Co., Ltd. Related party in substance FuSheng Properties Insurance Agent Co., Ltd. Related party in substance FuSheng Life Assurance Agent Co., Ltd. Related party in substance Others Directors, supervisors, managers and their
relatives

48
b. Significant relatedparty transactions are summarized as follows:
For the Year Ended December 31, 2004 % of the Interest
Balance as of Account Income December 31 Balance Rate (%) (Expense)
1) Deposits $ 5,298,014 2 05.4 $ (104,974 )
2) Loans $ 252,580 1 0.47.25 $ 3,373
3) Due from banks call loans
FBFC $ 0.851.165 $ 9,830 Taipei Bank 317,680 1 0.9751.45 4,017 International Bank of Asia Limited 7,942,000 35 0.9741.7854 97,356
$ 8,259,680 36 $ 111,203
4) Due to banks call loans
Citibank Co., Ltd., Taipei Branch $ 0.81.12 $ (1,052 ) Taipei Bank 0.9251.83 (330 )
$ $ (1,382 )
For the Year Ended December 31, 2003 % of the Interest
Balance as of Account Income December 31 Balance Rate (%) (Expense)
1) Deposits $ 7,451,977 3 05.4 $ (183,833 )
2) Loans $ 526,455 0.47.25 $ 3,170
3) Due from banks call loans
FBFC $ 2,050,000 7 0.8751.40 $ 14,118 Taipei Bank 0.81.55 6,089 Citibank Co., Ltd., Taipei Branch 1.01.165 985
$ 2,050,000 7 $ 21,192
4) Due to banks call loans
Citibank Co., Ltd., Taipei Branch $ 339,980 8 1.101.15 $ (210 ) Taipei Bank 0.91.31 (386 )
$ 339,980 8 $ (596 )

49
5) Securities
Trade Amount for the Years Ended December 31
Name Type 2004 2003
Fubon Bills Finance Bonds purchased $ 28,290,763 $ 81,288,496 Bonds sold 27,710,565 82,093,804 Bills purchased 1,683,809 12,208,431 Bills sold 79,923 Bills purchased under agreements to resell 99,775 578,551
Fubon Securities Bonds purchased 2,044,817 9,384,299 Bonds sold 1,666,698 12,884,075 Bonds purchased under agreements to resell
3,242,940
Fubon Leasing Bonds sold under agreements to repurchase 1,389,134 Citi Securities Bonds purchased 4,681,528 4,558,719
Bonds sold 4,097,858 3,158,865 FFH Bonds purchased 1,173,742 46,698
Bond sold 1,200,887 Bonds sold under agreements to repurchase 1,580,313
Taipei Bank Bonds purchased 7,688,352 Bonds sold 7,582,363 49,940
FLI Bonds purchased 642,305 Bonds sold 199,054 2,247,248 Bonds sold under agreements to repurchase 3,753,685
FSIT Bonds sold under agreements to repurchase 93,064,336 217,239,325 Fubon Insurance Co., Ltd.
Bonds sold under agreements to repurchase 1,747,850
6) Securities purchased
The Bank bought 80,086 thousands units and 72,943 thousands units of mutual funds amounting to $823,973 and $794,973 which FSIT had issued as of December 31, 2004 and 2003, respectively.
7) Derivatives (notional amount)
December 31 2004 2003
Citibank Co., Ltd., Taipei Branch Interest rate swap US$ 10,000 $ 5,300,000
5,300,000 Asset swap US$ 37,000 Foreign currency swap US$ 214,000 Spotrate forward US$ 185,000
1,237,311 FBFC
Interest rate swap 2,000,000 1,000,000 Fubon Securities Co., Ltd.
Foreigncurrency swap US$ 26,168 Asset swap US$ 3,000 Interest rate swap US$ 17,500 US$ 7,500 Spotrate forward US$ 18,308
(Continued)
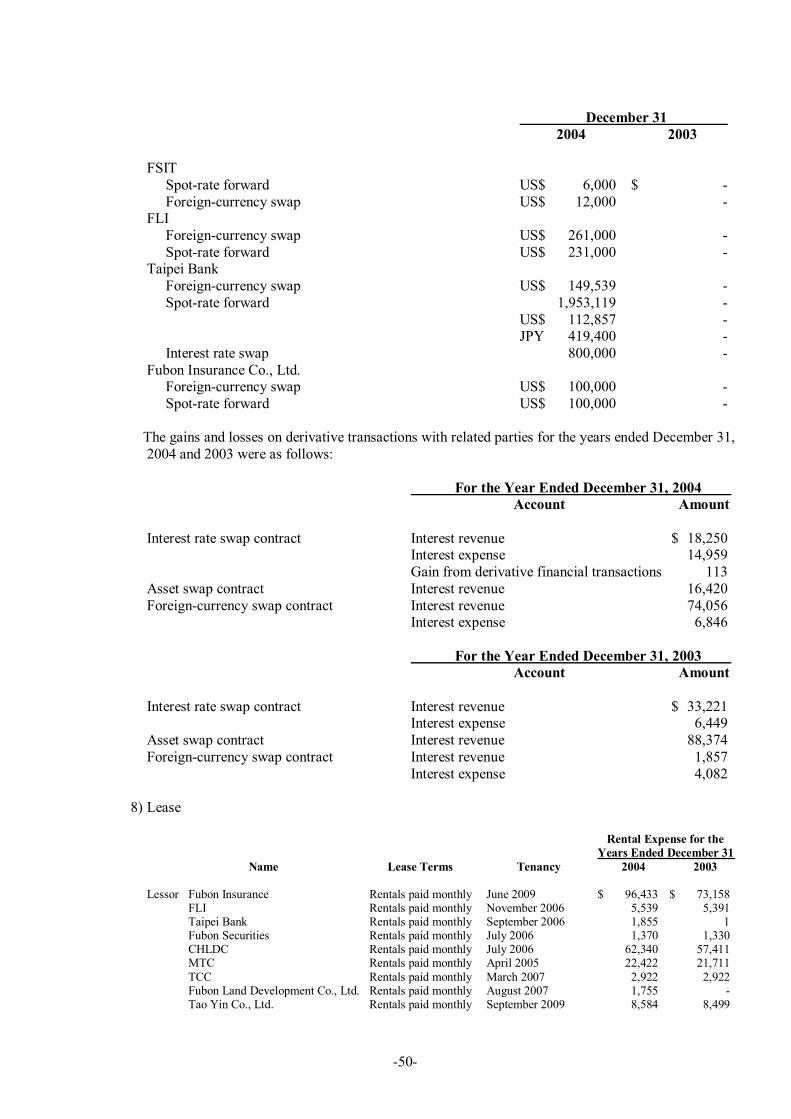
50
December 31 2004 2003
FSIT Spotrate forward US$ 6,000 $ Foreigncurrency swap US$ 12,000
FLI Foreigncurrency swap US$ 261,000 Spotrate forward US$ 231,000
Taipei Bank Foreigncurrency swap US$ 149,539 Spotrate forward 1,953,119
US$ 112,857 JPY 419,400
Interest rate swap 800,000 Fubon Insurance Co., Ltd.
Foreigncurrency swap US$ 100,000 Spotrate forward US$ 100,000
The gains and losses on derivative transactions with related parties for the years ended December 31, 2004 and 2003 were as follows:
For the Year Ended December 31, 2004 Account Amount
Interest rate swap contract Interest revenue $ 18,250 Interest expense 14,959 Gain from derivative financial transactions 113
Asset swap contract Interest revenue 16,420 Foreigncurrency swap contract Interest revenue 74,056
Interest expense 6,846
For the Year Ended December 31, 2003 Account Amount
Interest rate swap contract Interest revenue $ 33,221 Interest expense 6,449
Asset swap contract Interest revenue 88,374 Foreigncurrency swap contract Interest revenue 1,857
Interest expense 4,082
8) Lease
Rental Expense for the Years Ended December 31
Name Lease Terms Tenancy 2004 2003
Lessor Fubon Insurance Rentals paid monthly June 2009 $ 96,433 $ 73,158 FLI Rentals paid monthly November 2006 5,539 5,391 Taipei Bank Rentals paid monthly September 2006 1,855 1 Fubon Securities Rentals paid monthly July 2006 1,370 1,330 CHLDC Rentals paid monthly July 2006 62,340 57,411 MTC Rentals paid monthly April 2005 22,422 21,711 TCC Rentals paid monthly March 2007 2,922 2,922 Fubon Land Development Co., Ltd. Rentals paid monthly August 2007 1,755 Tao Yin Co., Ltd. Rentals paid monthly September 2009 8,584 8,499

51
9) Insurance
a) Property insurance
The Bank entered into several contracts with Fubon Insurance Co., Ltd. for the years ended December 31, 2004 and 2003. The details are as follows:
Insurance Insurance Insured Items Insurance Period Amount Expense
2004
Office facilities 2004.4.202005.4.20 $ 2,451,459 $ 1,500 Electronic facilities 2003.11.12005.11.1 965,729 3,079 Combined insurance for the bank and insurance items placed with the bank for safekeeping case
2003.8.22005.4.20 372,000 3,963
Public accident 2004.4.202005.4.20 108,000 442 Other 14,660
2003
Office facilities 2002.8.52004.4.20 2,506,373 1,815 Electronic facilities 2002.11.12004.11.1 763,002 2,671 Combined insurance for the bank and insurance items placed with the bank for safekeeping case
2002.8.22004.8.2 472,500 4,115
Public accident 2003.4.202004.4.20 90,000 329 Other 35,967
b) Life insurance
The Bank paid $23,477 and $22,149 to FLI for the employees’ group safety insurance for the years ended December 31, 2004 and 2003, respectively.
10) United marketing
The Bank signed an electronic transfer contract with Fubon Securities Co., Ltd. Under this contract, the Bank recognized apportioned cost, by the clients’ average deposits, amounted to $136,397 and $103,041 for the years ended December 31, 2004 and 2003, respectively.
The Bank had cooperative arrangements with Taipei Bank to promote a credit card jointly. Thus, for the year ended December 31, 2004 the Bank recognized service fee of $68,365 which was a percentage of the credit card users’ purchases.
11) Donation
For the Years Ended December 31
2004 2003
FCF $ 16,062 $ 13,367 FAF 3,590 2,400 FCEF 19,150 1,400
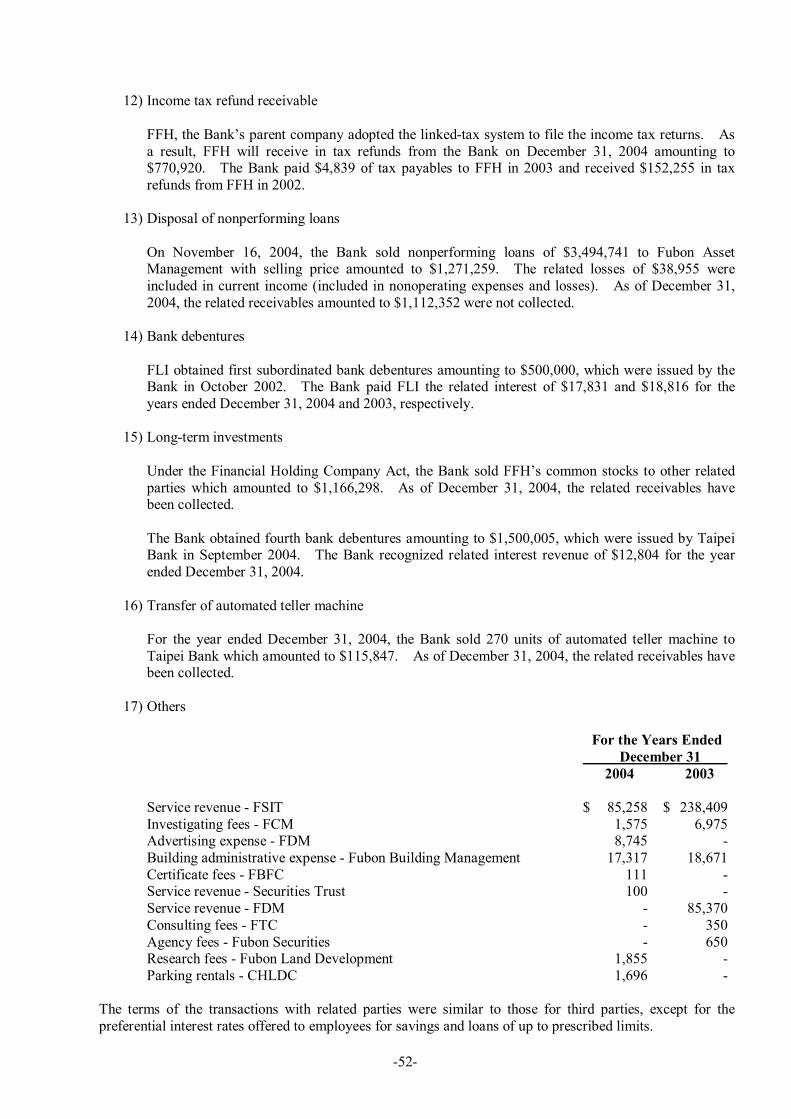
52
12) Income tax refund receivable
FFH, the Bank’s parent company adopted the linkedtax system to file the income tax returns. As a result, FFH will receive in tax refunds from the Bank on December 31, 2004 amounting to $770,920. The Bank paid $4,839 of tax payables to FFH in 2003 and received $152,255 in tax refunds from FFH in 2002.
13) Disposal of nonperforming loans
On November 16, 2004, the Bank sold nonperforming loans of $3,494,741 to Fubon Asset Management with selling price amounted to $1,271,259. The related losses of $38,955 were included in current income (included in nonoperating expenses and losses). As of December 31, 2004, the related receivables amounted to $1,112,352 were not collected.
14) Bank debentures
FLI obtained first subordinated bank debentures amounting to $500,000, which were issued by the Bank in October 2002. The Bank paid FLI the related interest of $17,831 and $18,816 for the years ended December 31, 2004 and 2003, respectively.
15) Longterm investments
Under the Financial Holding Company Act, the Bank sold FFH’s common stocks to other related parties which amounted to $1,166,298. As of December 31, 2004, the related receivables have been collected.
The Bank obtained fourth bank debentures amounting to $1,500,005, which were issued by Taipei Bank in September 2004. The Bank recognized related interest revenue of $12,804 for the year ended December 31, 2004.
16) Transfer of automated teller machine
For the year ended December 31, 2004, the Bank sold 270 units of automated teller machine to Taipei Bank which amounted to $115,847. As of December 31, 2004, the related receivables have been collected.
17) Others
For the Years Ended December 31
2004 2003
Service revenue FSIT $ 85,258 $ 238,409 Investigating fees FCM 1,575 6,975 Advertising expense FDM 8,745 Building administrative expense Fubon Building Management 17,317 18,671 Certificate fees FBFC 111 Service revenue Securities Trust 100 Service revenue FDM 85,370 Consulting fees FTC 350 Agency fees Fubon Securities 650 Research fees Fubon Land Development 1,855 Parking rentals CHLDC 1,696
The terms of the transactions with related parties were similar to those for third parties, except for the preferential interest rates offered to employees for savings and loans of up to prescribed limits.
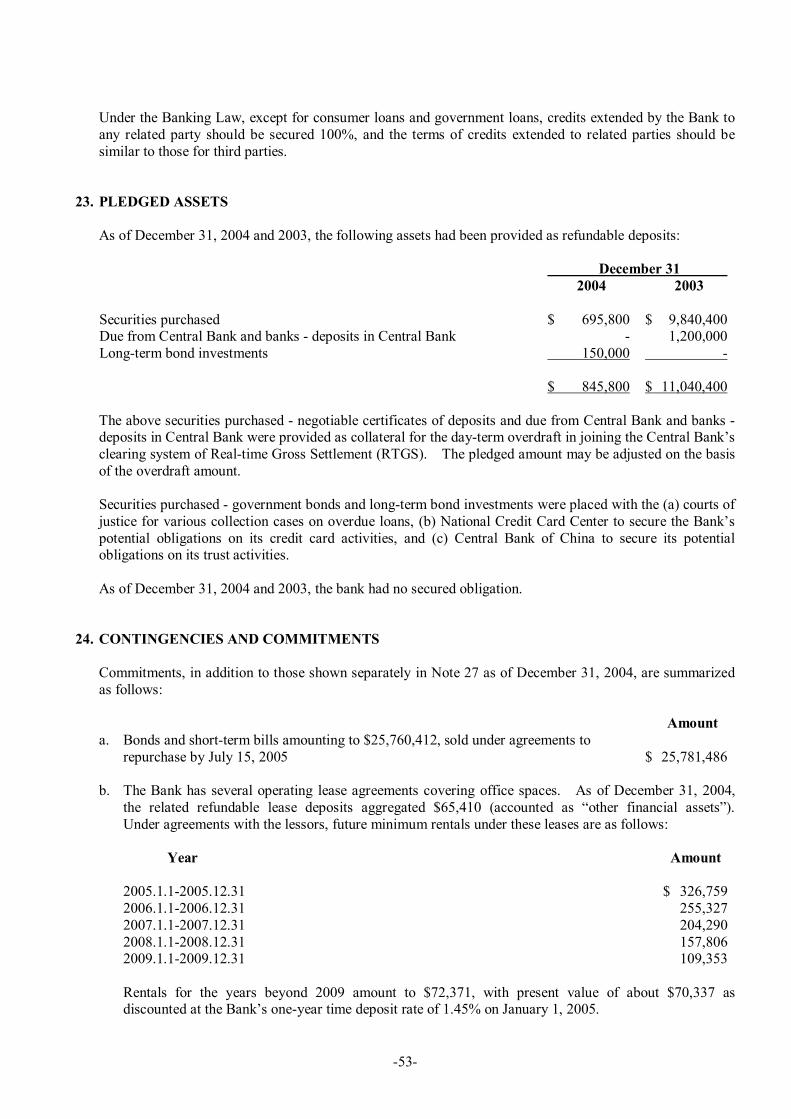
53
Under the Banking Law, except for consumer loans and government loans, credits extended by the Bank to any related party should be secured 100%, and the terms of credits extended to related parties should be similar to those for third parties.
23. PLEDGED ASSETS
As of December 31, 2004 and 2003, the following assets had been provided as refundable deposits:
December 31 2004 2003
Securities purchased $ 695,800 $ 9,840,400 Due from Central Bank and banks deposits in Central Bank 1,200,000 Longterm bond investments 150,000
$ 845,800 $ 11,040,400
The above securities purchased negotiable certificates of deposits and due from Central Bank and banks deposits in Central Bank were provided as collateral for the dayterm overdraft in joining the Central Bank’s clearing system of Realtime Gross Settlement (RTGS). The pledged amount may be adjusted on the basis of the overdraft amount.
Securities purchased government bonds and longterm bond investments were placed with the (a) courts of justice for various collection cases on overdue loans, (b) National Credit Card Center to secure the Bank’s potential obligations on its credit card activities, and (c) Central Bank of China to secure its potential obligations on its trust activities.
As of December 31, 2004 and 2003, the bank had no secured obligation.
24. CONTINGENCIES AND COMMITMENTS
Commitments, in addition to those shown separately in Note 27 as of December 31, 2004, are summarized as follows:
Amount a. Bonds and shortterm bills amounting to $25,760,412, sold under agreements to
repurchase by July 15, 2005 $ 25,781,486
b. The Bank has several operating lease agreements covering office spaces. As of December 31, 2004, the related refundable lease deposits aggregated $65,410 (accounted as “other financial assets”). Under agreements with the lessors, future minimum rentals under these leases are as follows:
Year Amount
2005.1.12005.12.31 $ 326,759 2006.1.12006.12.31 255,327 2007.1.12007.12.31 204,290 2008.1.12008.12.31 157,806 2009.1.12009.12.31 109,353
Rentals for the years beyond 2009 amount to $72,371, with present value of about $70,337 as discounted at the Bank’s oneyear time deposit rate of 1.45% on January 1, 2005.

54
c. Balance sheets and trust property of trust accounts
Balance Sheet of Trust Accounts December 31, 2004
Trust Assets Trust Liabilities and Equities
Bank deposits $ 76,094 Trust capital Shortterm investments Money trust $ 55,291,247 Mutual funds 25,635,548 Securities trust 3,759,485 Stocks 3,695,295 Realestate trust 571,202 Bills 100,332 59,621,934 Bonds 28,324,776 Reserve and accumulated Overseas stocks 1,264,663 earnings
59,020,614 Net income 28,350 Real estate Accumulated earnings (815 ) Land 396,881 27,535 Buildings 6,158 Construction in progress 149,722
552,761 Total trust liabilities and
Total trust assets $ 59,649,469 equities $ 59,649,469
Property of Trust Accounts December 31, 2004
Investment Portfolio Amount
Bank deposits $ 76,094 Shortterm investments Mutual funds 25,635,548 Stocks 3,695,295 Bills 100,332 Bonds 28,324,776 Overseas stocks 1,264,663
59,020,614 Real estate Land 396,881 Buildings 6,158 Construction in progress 149,722
552,761
Total $ 59,649,469
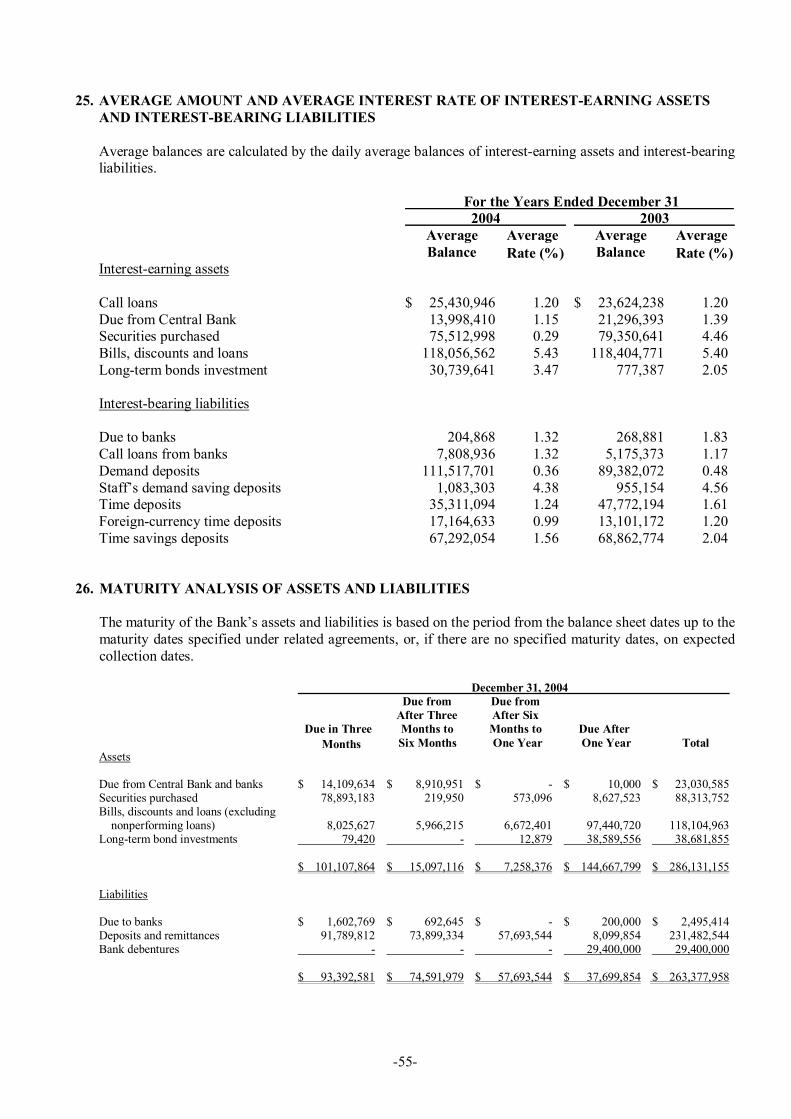
55
25. AVERAGE AMOUNT AND AVERAGE INTEREST RATE OF INTERESTEARNING ASSETS AND INTERESTBEARING LIABILITIES
Average balances are calculated by the daily average balances of interestearning assets and interestbearing liabilities.
For the Years Ended December 31 2004 2003
Average Average Average Average Balance Rate (%) Balance Rate (%)
Interestearning assets
Call loans $ 25,430,946 1.20 $ 23,624,238 1.20 Due from Central Bank 13,998,410 1.15 21,296,393 1.39 Securities purchased 75,512,998 0.29 79,350,641 4.46 Bills, discounts and loans 118,056,562 5.43 118,404,771 5.40 Longterm bonds investment 30,739,641 3.47 777,387 2.05
Interestbearing liabilities
Due to banks 204,868 1.32 268,881 1.83 Call loans from banks 7,808,936 1.32 5,175,373 1.17 Demand deposits 111,517,701 0.36 89,382,072 0.48 Staff’s demand saving deposits 1,083,303 4.38 955,154 4.56 Time deposits 35,311,094 1.24 47,772,194 1.61 Foreigncurrency time deposits 17,164,633 0.99 13,101,172 1.20 Time savings deposits 67,292,054 1.56 68,862,774 2.04
26. MATURITY ANALYSIS OF ASSETS AND LIABILITIES
The maturity of the Bank’s assets and liabilities is based on the period from the balance sheet dates up to the maturity dates specified under related agreements, or, if there are no specified maturity dates, on expected collection dates.
December 31, 2004 Due from Due from After Three After Six
Due in Three Months to Months to Due After Months Six Months One Year One Year Total
Assets
Due from Central Bank and banks $ 14,109,634 $ 8,910,951 $ $ 10,000 $ 23,030,585 Securities purchased 78,893,183 219,950 573,096 8,627,523 88,313,752 Bills, discounts and loans (excluding nonperforming loans) 8,025,627 5,966,215 6,672,401 97,440,720 118,104,963
Longterm bond investments 79,420 12,879 38,589,556 38,681,855
$ 101,107,864 $ 15,097,116 $ 7,258,376 $ 144,667,799 $ 286,131,155
Liabilities
Due to banks $ 1,602,769 $ 692,645 $ $ 200,000 $ 2,495,414 Deposits and remittances 91,789,812 73,899,334 57,693,544 8,099,854 231,482,544 Bank debentures 29,400,000 29,400,000
$ 93,392,581 $ 74,591,979 $ 57,693,544 $ 37,699,854 $ 263,377,958

56
December 31, 2003 Due from Due from After Three After Six
Due in Three Months to Months to Due After Months Six Months One Year One Year Total
Assets
Due from Central Bank and banks $ 28,789,286 $ 14,247,100 $ 10,000 $ 1,900,000 $ 44,946,386 Securities purchased 38,811,980 199,984 1,908,167 31,349,747 72,269,878 Bills, discounts and loans (excluding nonperforming loans) 15,219,534 5,912,475 4,819,205 85,814,414 111,765,628
Longterm bond investments 175,044 33,998 433,609 642,651
$ 82,995,844 $ 20,359,559 $ 6,771,370 $ 119,497,770 $ 229,624,543
Liabilities
Due to banks $ 4,140,219 $ 266,740 $ $ $ 4,406,959 Deposits and remittances 77,157,811 72,369,427 61,034,989 10,870,920 221,433,147 Bank debentures 22,500,000 22,500,000
$ 81,298,030 $ 72,636,167 $ 61,034,989 $ 33,370,920 $ 248,340,106
27. FINANCIAL INSTRUMENTS
a. Derivative financial instruments
The Bank enters into forward exchange, foreigncurrency swap, cross currency swap, interest rate swap, interest rate futures and option contracts for trading purposes, i.e., to accommodate customers’ needs and to manage its exposures. The Bank enters into interest rate swap, asset swap, credit default swap and crosscurrency swap for nontrading purposes, i.e., to hedge the effects of foreign exchange, interest rate or credit default exposure on foreigncurrency assets or liabilities. The Bank’s hedge strategy is to use instruments with fluctuations in their fair values that offset changes in the fair values of the underlying exposures. The Bank also periodically evaluates the effectiveness of the instruments.
The Bank is exposed to credit risk on counterparties’ default on contracts. Thus, the Bank reviews each customer’s credit history and credit rating before approving the financial instrument arrangement and the credit limit. An appropriate guarantee would be required from the customer. If the customer is another bank, it will be evaluated on the basis of its world ranking and credit rating.
The contract (notional) amounts, credit risks, and fair values of derivative transactions were as follows:
December 31 2004 2003
Contract Contract (Notional) (Notional) Amount Credit Risk Fair Value Amount Credit Risk Fair Value
Nontrading purposes
Interest rate swap contracts $ 50,342,000 $ 173,319 $ (180,327 ) $ 32,500,000 $ 71,636 $ (207,549 ) Asset swap contracts 1,996,884 22,890 (83,382 ) Crosscurrency swap contracts 2,531,755 (205,998 ) 2,481,854 (56,186 ) Credit default swap contracts 1,500,000 (1,314 )
Trading purposes
Forward exchange contracts 7,280,538 81,462 (74,489 ) 4,036,087 24,719 17,930 Foreigncurrency swap contracts 141,338,855 146,423 10,712 89,594,182 229,698 54,857 Crosscurrency swap contracts 773,106 87,101 8,645 Interest rate swap contracts 33,319,787 642,903 (22,354 ) 17,074,820 24,328 (228,812 )
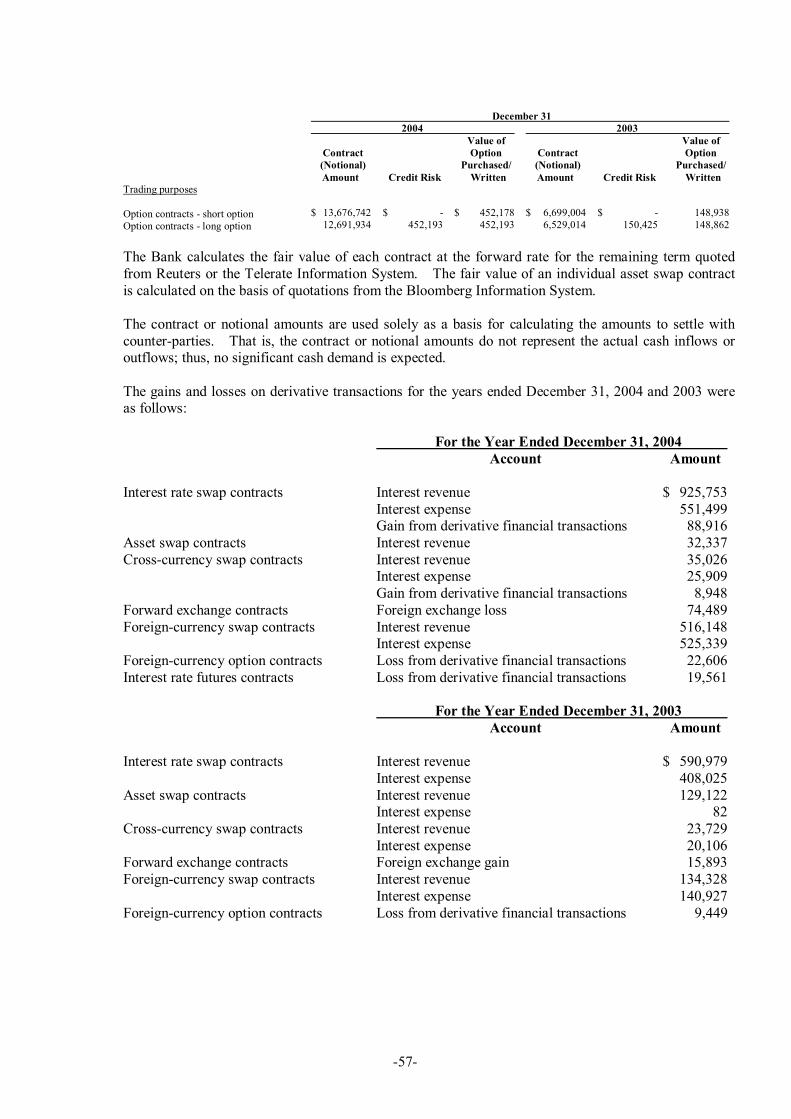
57
December 31 2004 2003
Value of Value of Contract Option Contract Option (Notional) Purchased/ (Notional) Purchased/ Amount Credit Risk Written Amount Credit Risk Written
Trading purposes
Option contracts short option $ 13,676,742 $ $ 452,178 $ 6,699,004 $ $ 148,938 Option contracts long option 12,691,934 452,193 452,193 6,529,014 150,425 148,862
The Bank calculates the fair value of each contract at the forward rate for the remaining term quoted from Reuters or the Telerate Information System. The fair value of an individual asset swap contract is calculated on the basis of quotations from the Bloomberg Information System.
The contract or notional amounts are used solely as a basis for calculating the amounts to settle with counterparties. That is, the contract or notional amounts do not represent the actual cash inflows or outflows; thus, no significant cash demand is expected.
The gains and losses on derivative transactions for the years ended December 31, 2004 and 2003 were as follows:
For the Year Ended December 31, 2004 Account Amount
Interest rate swap contracts Interest revenue $ 925,753 Interest expense 551,499 Gain from derivative financial transactions 88,916
Asset swap contracts Interest revenue 32,337 Crosscurrency swap contracts Interest revenue 35,026
Interest expense 25,909 Gain from derivative financial transactions 8,948
Forward exchange contracts Foreign exchange loss 74,489 Foreigncurrency swap contracts Interest revenue 516,148
Interest expense 525,339 Foreigncurrency option contracts Loss from derivative financial transactions 22,606 Interest rate futures contracts Loss from derivative financial transactions 19,561
For the Year Ended December 31, 2003 Account Amount
Interest rate swap contracts Interest revenue $ 590,979 Interest expense 408,025
Asset swap contracts Interest revenue 129,122 Interest expense 82
Crosscurrency swap contracts Interest revenue 23,729 Interest expense 20,106
Forward exchange contracts Foreign exchange gain 15,893 Foreigncurrency swap contracts Interest revenue 134,328
Interest expense 140,927 Foreigncurrency option contracts Loss from derivative financial transactions 9,449

58
b. Fair value of nonderivative financial instruments
December 31 2004 2003
Carrying Value Fair Value Carrying Value Fair Value Assets
Assets with fair value approximating carrying value $ 186,368,948 $ 186,368,948 $ 198,986,192 $ 198,986,192 Securities purchased 88,128,211 88,128,211 72,269,878 72,317,388 Longterm equity investments 10,574,963 10,703,474 9,759,144 9,942,603 Longterm bond investments 38,507,131 38,507,131 456,501 456,501
Liabilities
Liabilities with fair value approximating carrying value 295,513,274 295,513,274 254,166,383 254,166,383
Methods and assumptions applied in estimating the fair value of nonderivative financial instruments are as follows:
1) The carrying values of cash and cash equivalents, due from Central Bank and banks, receivables, Bonds and shortterm bills purchased under agreements to resell, other financial asset due to Central Bank, due to banks, remittances, payables, bonds and shortterm bills sold under agreements to repurchase, fund received for subloans and guarantee deposit received approximate their fair values due to the short maturity of these instruments.
2) Bill, discounts and loans, deposits, and bank debentures are interestearning assets and interesting bearing liabilities. Thus, their carrying value represent current fair value.
3) If market prices for securities purchased, longterm equity investments and longterm bond investments are available, the fair values of these financial instruments are based on these market prices. If market prices are unavailable, then their carrying values represent fair values.
4) Refundable guarantee deposits in the form of government bonds are based on their carrying values since such deposits do not have specific dates.
Not all of the fair values of all financial and nonfinancial instruments are presented above. Therefore, the total fair values disclosed do not represent the Bank’s aggregate fair value.
c. Financial instruments with offbalancesheet credit risks
The Bank has significant credit commitments principally relating to customer financing activities. For the years ended December 31, 2004 and 2003, the interest rates for loans ranged from 2.14% to 14.84% and from 1.49% to 14.20%, respectively, and the highest interest rate for credit cards was 19.69% for both periods. The Bank also issues financial guarantees and standby letters of credit to guarantee customers’ obligations to third parties. There was no concentration of maturity dates in one period that would potentially result in liquidity problems to the Bank.
The contract amounts of financial instruments with offbalancesheet credit risks were as follows:
December 31 2004 2003
Credit commitments of credit cards $ 163,937,353 $ 202,871,370 Financial guarantees and standby letters of credit 7,689,947 10,009,255

59
The total commitment amounts do not necessarily represent future cash requirements since most of the commitments are expected to expire without being drawn upon. The Bank is exposed to losses of up to the total amount of the commitments (without taking into account the value of any collateral) if counterparties default.
The Bank evaluates the creditworthiness of credit applications case by case, taking into account the applicant’s credit history, credit rating and financial condition. (As of December 31, 2004 and 2003, about 60.59% and 52.59%, respectively, of total loans granted were secured.) Collateral, mostly in the form of real estate, cash, inventories and marketable securities or other property, may be required depending on the result of the creditworthiness evaluation.
No collateral is required for credit card facilities but the credit status of each credit cardholder is closely monitored. Depending on the results of the credit status monitoring, appropriate measures are adopted, which include amending the credit limit and, if necessary, canceling the facility.
28. CONCENTRATIONS OF RISK
The Bank has no credit risk concentration in any counterparty or groups of counterparties engaged in similar business activities or activities in the same region that would cause the Bank’s ability to meet contractual obligations to be similarly affected by changes in economic or other conditions. However, as of December 31, 2004 and 2003, there were certain concentrations of risk, as follows:
December 31 2004 2003
Individuals $ 83,935,859 $ 93,973,353 Manufacturing 13,781,930 17,108,132 Business and commerce 9,960,330 9,385,047 Finance, insurance and realestate 5,168,979 9,615,092
The net positions of the main foreigncurrency transactions as of December 31, 2004 and 2003 were as follows:
December 31 2004 2003
Foreigncurrency New Taiwan Foreigncurrency New Taiwan Amounts Dollar Amounts Amounts Dollar Amounts
(in Thousands) (in Thousands) (in Thousands) (in Thousands)
Net positions of main foreign USD 28,924 $ 918,858 USD 35,458 $ 1,205,492 currency with market risk EUR 5,055 218,463 EUR 959 40,981
JPY 316,601 97,861 HKD 2,449 10,722 GBP 1,565 95,695 JPY 26,858 8,535 SEK 1,200 5,748 NZD 272 6,070
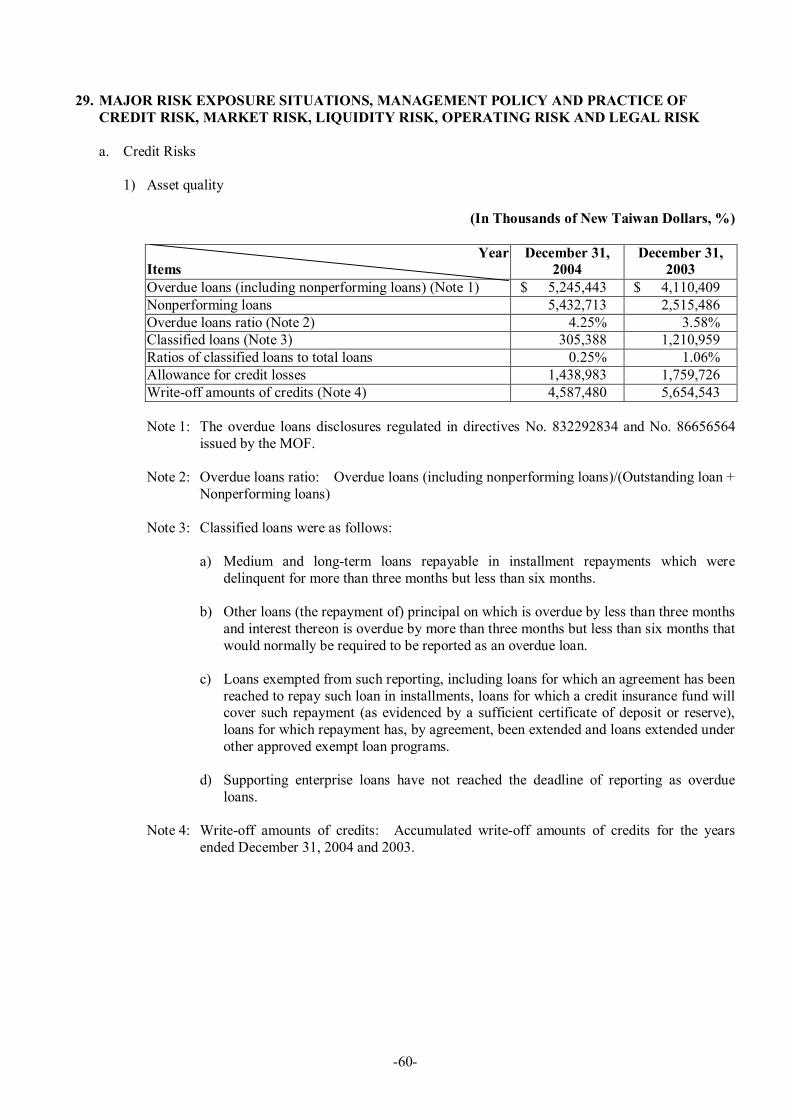
60
29. MAJOR RISK EXPOSURE SITUATIONS, MANAGEMENT POLICY AND PRACTICE OF CREDIT RISK, MARKET RISK, LIQUIDITY RISK, OPERATING RISK AND LEGAL RISK
a. Credit Risks
1) Asset quality
(In Thousands of New Taiwan Dollars, %)
Year Items
December 31, 2004
December 31, 2003
Overdue loans (including nonperforming loans) (Note 1) $ 5,245,443 $ 4,110,409 Nonperforming loans 5,432,713 2,515,486 Overdue loans ratio (Note 2) 4.25% 3.58% Classified loans (Note 3) 305,388 1,210,959 Ratios of classified loans to total loans 0.25% 1.06% Allowance for credit losses 1,438,983 1,759,726 Writeoff amounts of credits (Note 4) 4,587,480 5,654,543
Note 1: The overdue loans disclosures regulated in directives No. 832292834 and No. 86656564 issued by the MOF.
Note 2: Overdue loans ratio: Overdue loans (including nonperforming loans)/(Outstanding loan + Nonperforming loans)
Note 3: Classified loans were as follows:
a) Medium and longterm loans repayable in installment repayments which were delinquent for more than three months but less than six months.
b) Other loans (the repayment of) principal on which is overdue by less than three months and interest thereon is overdue by more than three months but less than six months that would normally be required to be reported as an overdue loan.
c) Loans exempted from such reporting, including loans for which an agreement has been reached to repay such loan in installments, loans for which a credit insurance fund will cover such repayment (as evidenced by a sufficient certificate of deposit or reserve), loans for which repayment has, by agreement, been extended and loans extended under other approved exempt loan programs.
d) Supporting enterprise loans have not reached the deadline of reporting as overdue loans.
Note 4: Writeoff amounts of credits: Accumulated writeoff amounts of credits for the years ended December 31, 2004 and 2003.
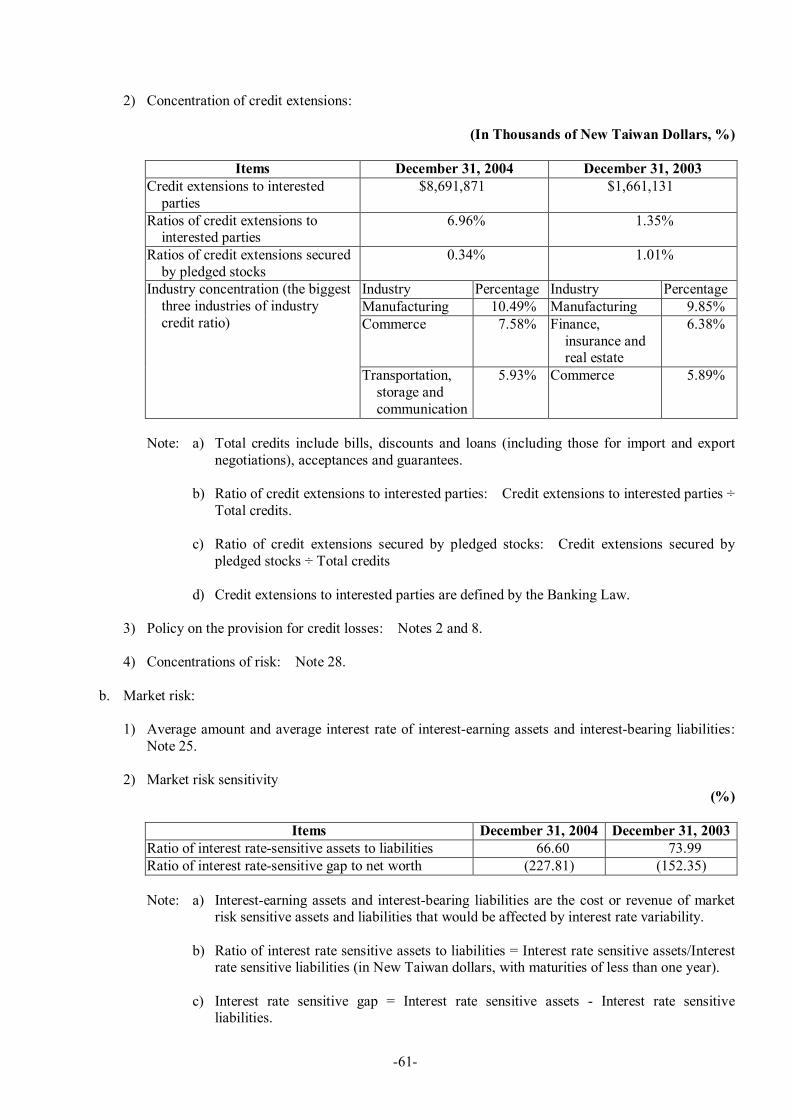
61
2) Concentration of credit extensions:
(In Thousands of New Taiwan Dollars, %)
Items December 31, 2004 December 31, 2003 Credit extensions to interested parties
$8,691,871 $1,661,131
Ratios of credit extensions to interested parties
6.96% 1.35%
Ratios of credit extensions secured by pledged stocks
0.34% 1.01%
Industry Percentage Industry Percentage Manufacturing 10.49% Manufacturing 9.85% Commerce 7.58% Finance,
insurance and real estate
6.38%
Industry concentration (the biggest three industries of industry credit ratio)
Transportation, storage and communication
5.93% Commerce 5.89%
Note: a) Total credits include bills, discounts and loans (including those for import and export negotiations), acceptances and guarantees.
b) Ratio of credit extensions to interested parties: Credit extensions to interested parties ÷ Total credits.
c) Ratio of credit extensions secured by pledged stocks: Credit extensions secured by pledged stocks ÷ Total credits
d) Credit extensions to interested parties are defined by the Banking Law.
3) Policy on the provision for credit losses: Notes 2 and 8.
4) Concentrations of risk: Note 28.
b. Market risk:
1) Average amount and average interest rate of interestearning assets and interestbearing liabilities: Note 25.
2) Market risk sensitivity (%)
Items December 31, 2004 December 31, 2003 Ratio of interest ratesensitive assets to liabilities 66.60 73.99 Ratio of interest ratesensitive gap to net worth (227.81) (152.35)
Note: a) Interestearning assets and interestbearing liabilities are the cost or revenue of market risk sensitive assets and liabilities that would be affected by interest rate variability.
b) Ratio of interest rate sensitive assets to liabilities = Interest rate sensitive assets/Interest rate sensitive liabilities (in New Taiwan dollars, with maturities of less than one year).
c) Interest rate sensitive gap = Interest rate sensitive assets Interest rate sensitive liabilities.
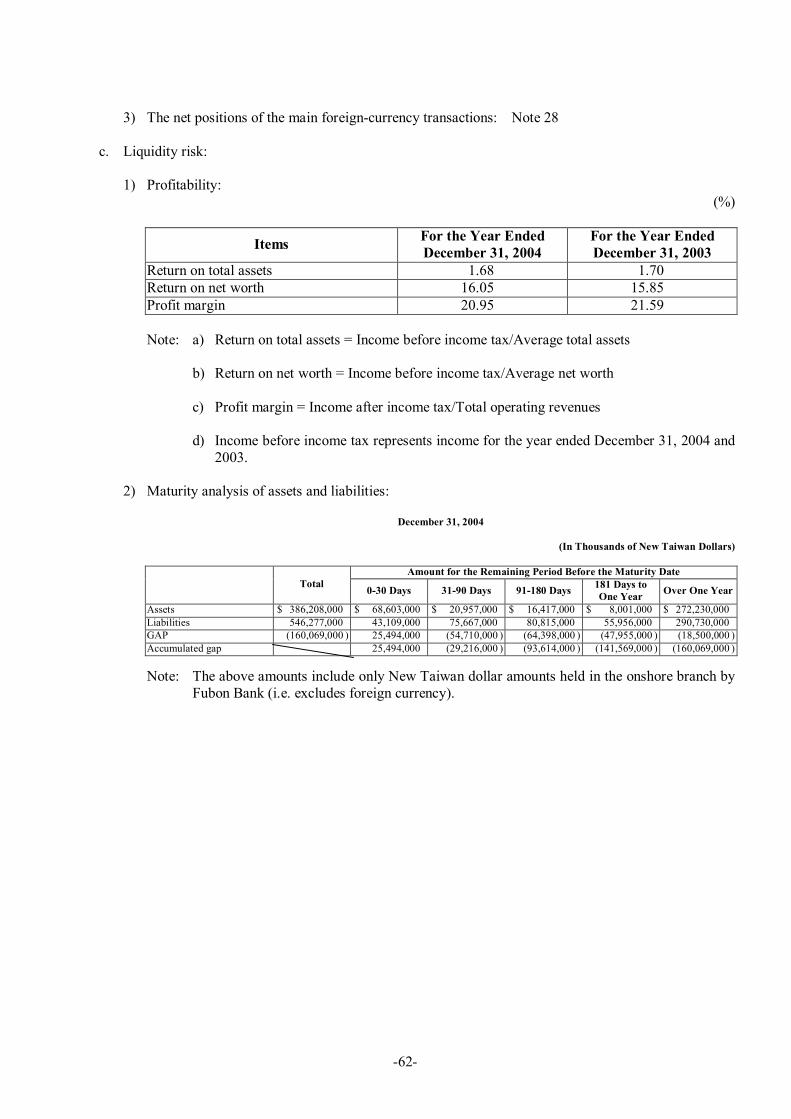
62
3) The net positions of the main foreigncurrency transactions: Note 28
c. Liquidity risk:
1) Profitability: (%)
Items For the Year Ended December 31, 2004
For the Year Ended December 31, 2003
Return on total assets 1.68 1.70 Return on net worth 16.05 15.85 Profit margin 20.95 21.59
Note: a) Return on total assets = Income before income tax/Average total assets
b) Return on net worth = Income before income tax/Average net worth
c) Profit margin = Income after income tax/Total operating revenues
d) Income before income tax represents income for the year ended December 31, 2004 and 2003.
2) Maturity analysis of assets and liabilities:
December 31, 2004
(In Thousands of New Taiwan Dollars)
Amount for the Remaining Period Before the Maturity Date Total 030 Days 3190 Days 91180 Days 181 Days to
One Year Over One Year
Assets $ 386,208,000 $ 68,603,000 $ 20,957,000 $ 16,417,000 $ 8,001,000 $ 272,230,000 Liabilities 546,277,000 43,109,000 75,667,000 80,815,000 55,956,000 290,730,000 GAP (160,069,000 ) 25,494,000 (54,710,000 ) (64,398,000 ) (47,955,000 ) (18,500,000 ) Accumulated gap 25,494,000 (29,216,000 ) (93,614,000 ) (141,569,000 ) (160,069,000 )
Note: The above amounts include only New Taiwan dollar amounts held in the onshore branch by Fubon Bank (i.e. excludes foreign currency).
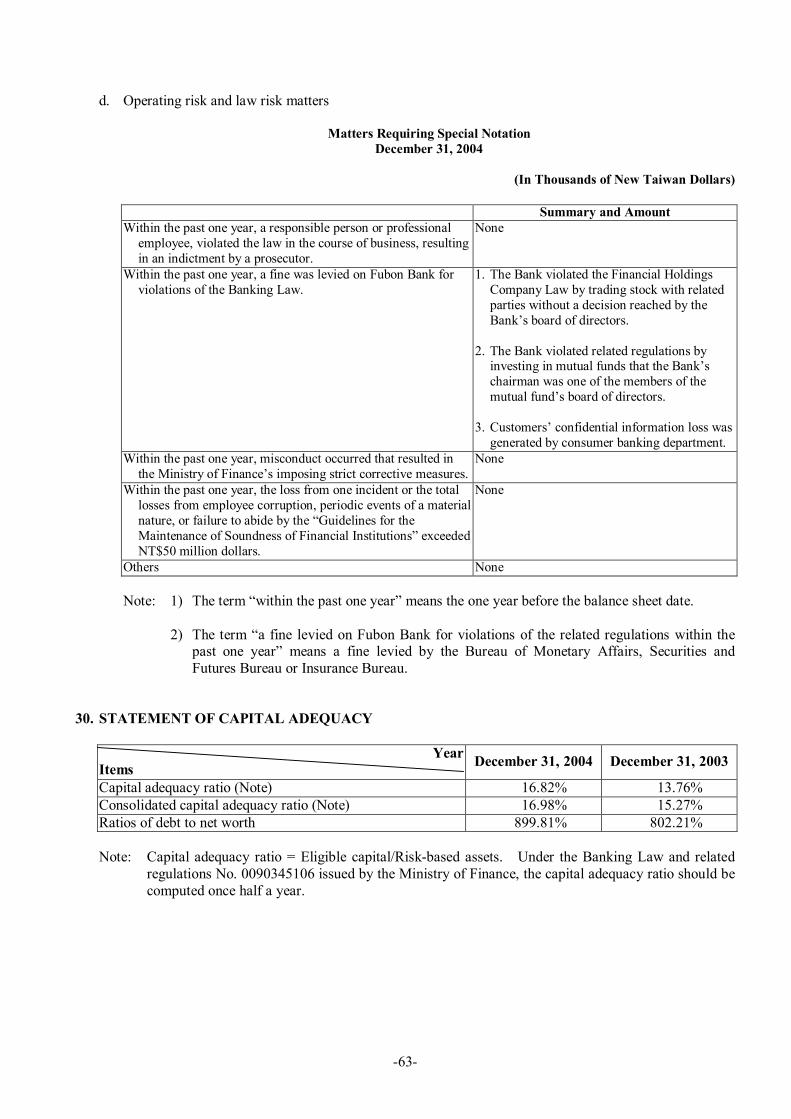
63
d. Operating risk and law risk matters
Matters Requiring Special Notation December 31, 2004
(In Thousands of New Taiwan Dollars)
Summary and Amount Within the past one year, a responsible person or professional employee, violated the law in the course of business, resulting in an indictment by a prosecutor.
None
Within the past one year, a fine was levied on Fubon Bank for violations of the Banking Law.
1. The Bank violated the Financial Holdings Company Law by trading stock with related parties without a decision reached by the Bank’s board of directors.
2. The Bank violated related regulations by investing in mutual funds that the Bank’s chairman was one of the members of the mutual fund’s board of directors.
3. Customers’ confidential information loss was generated by consumer banking department.
Within the past one year, misconduct occurred that resulted in the Ministry of Finance’s imposing strict corrective measures.
None
Within the past one year, the loss from one incident or the total losses from employee corruption, periodic events of a material nature, or failure to abide by the “Guidelines for the Maintenance of Soundness of Financial Institutions” exceeded NT$50 million dollars.
None
Others None
Note: 1) The term “within the past one year” means the one year before the balance sheet date.
2) The term “a fine levied on Fubon Bank for violations of the related regulations within the past one year” means a fine levied by the Bureau of Monetary Affairs, Securities and Futures Bureau or Insurance Bureau.
30. STATEMENT OF CAPITAL ADEQUACY
Year Items December 31, 2004 December 31, 2003
Capital adequacy ratio (Note) 16.82% 13.76% Consolidated capital adequacy ratio (Note) 16.98% 15.27% Ratios of debt to net worth 899.81% 802.21%
Note: Capital adequacy ratio = Eligible capital/Riskbased assets. Under the Banking Law and related regulations No. 0090345106 issued by the Ministry of Finance, the capital adequacy ratio should be computed once half a year.
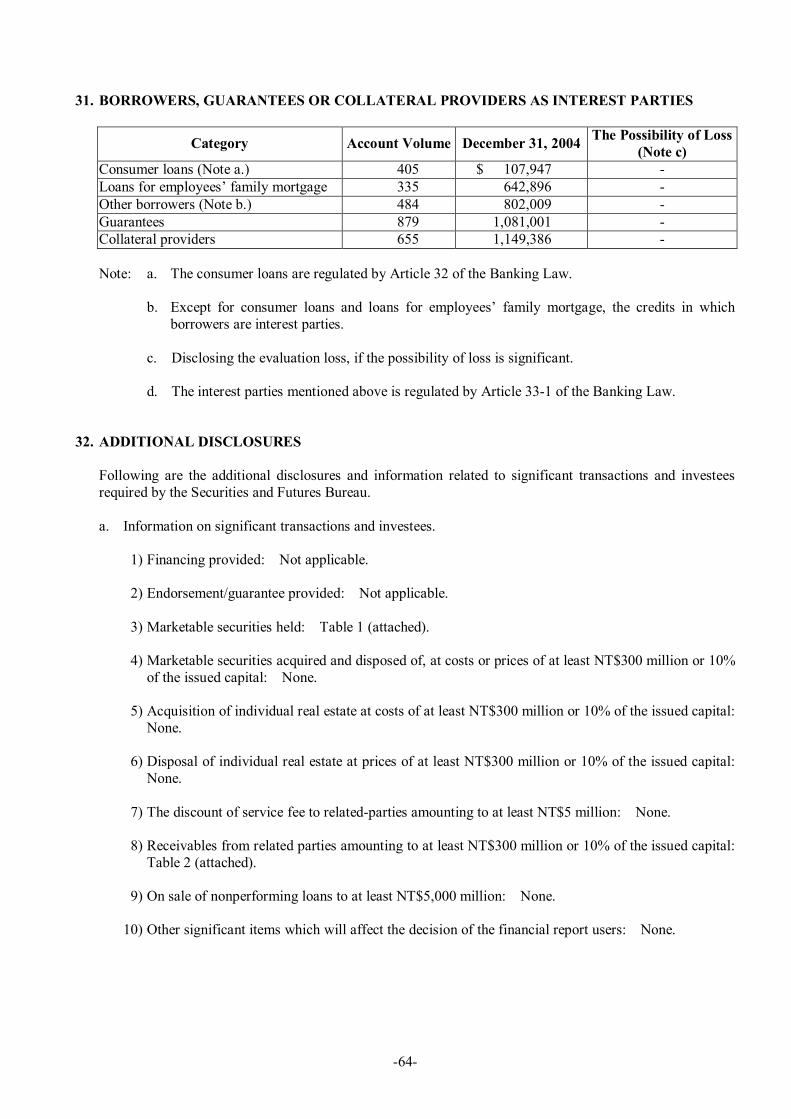
64
31. BORROWERS, GUARANTEES OR COLLATERAL PROVIDERS AS INTEREST PARTIES
Category Account Volume December 31, 2004 The Possibility of Loss (Note c) Consumer loans (Note a.) 405 $ 107,947 Loans for employees’ family mortgage 335 642,896 Other borrowers (Note b.) 484 802,009 Guarantees 879 1,081,001 Collateral providers 655 1,149,386
Note: a. The consumer loans are regulated by Article 32 of the Banking Law.
b. Except for consumer loans and loans for employees’ family mortgage, the credits in which borrowers are interest parties.
c. Disclosing the evaluation loss, if the possibility of loss is significant.
d. The interest parties mentioned above is regulated by Article 331 of the Banking Law.
32. ADDITIONAL DISCLOSURES
Following are the additional disclosures and information related to significant transactions and investees required by the Securities and Futures Bureau.
a. Information on significant transactions and investees.
1) Financing provided: Not applicable.
2) Endorsement/guarantee provided: Not applicable.
3) Marketable securities held: Table 1 (attached).
4) Marketable securities acquired and disposed of, at costs or prices of at least NT$300 million or 10% of the issued capital: None.
5) Acquisition of individual real estate at costs of at least NT$300 million or 10% of the issued capital: None.
6) Disposal of individual real estate at prices of at least NT$300 million or 10% of the issued capital: None.
7) The discount of service fee to relatedparties amounting to at least NT$5 million: None.
8) Receivables from related parties amounting to at least NT$300 million or 10% of the issued capital: Table 2 (attached).
9) On sale of nonperforming loans to at least NT$5,000 million: None.
10) Other significant items which will affect the decision of the financial report users: None.
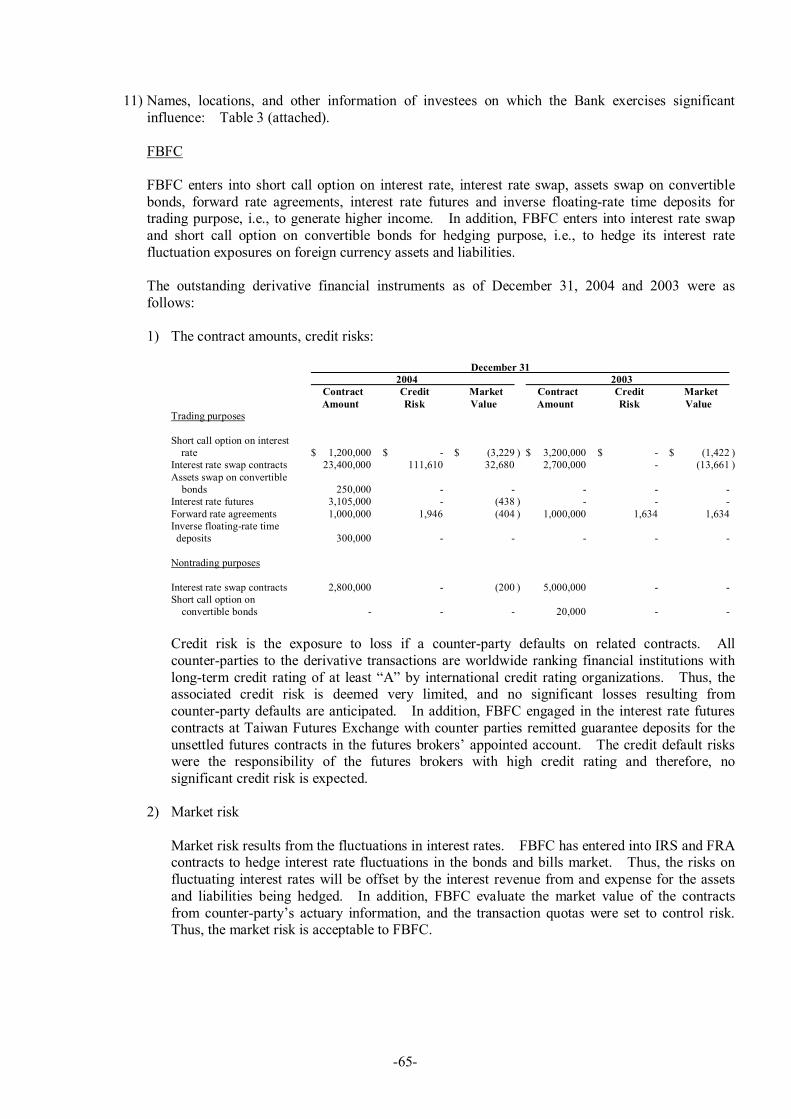
65
11) Names, locations, and other information of investees on which the Bank exercises significant influence: Table 3 (attached).
FBFC
FBFC enters into short call option on interest rate, interest rate swap, assets swap on convertible bonds, forward rate agreements, interest rate futures and inverse floatingrate time deposits for trading purpose, i.e., to generate higher income. In addition, FBFC enters into interest rate swap and short call option on convertible bonds for hedging purpose, i.e., to hedge its interest rate fluctuation exposures on foreign currency assets and liabilities.
The outstanding derivative financial instruments as of December 31, 2004 and 2003 were as follows:
1) The contract amounts, credit risks:
December 31 2004 2003
Contract Credit Market Contract Credit Market Amount Risk Value Amount Risk Value
Trading purposes
Short call option on interest rate $ 1,200,000 $ $ (3,229 ) $ 3,200,000 $ $ (1,422 )
Interest rate swap contracts 23,400,000 111,610 32,680 2,700,000 (13,661 ) Assets swap on convertible bonds 250,000
Interest rate futures 3,105,000 (438 ) Forward rate agreements 1,000,000 1,946 (404 ) 1,000,000 1,634 1,634 Inverse floatingrate time deposits 300,000
Nontrading purposes
Interest rate swap contracts 2,800,000 (200 ) 5,000,000 Short call option on convertible bonds 20,000
Credit risk is the exposure to loss if a counterparty defaults on related contracts. All counterparties to the derivative transactions are worldwide ranking financial institutions with longterm credit rating of at least “A” by international credit rating organizations. Thus, the associated credit risk is deemed very limited, and no significant losses resulting from counterparty defaults are anticipated. In addition, FBFC engaged in the interest rate futures contracts at Taiwan Futures Exchange with counter parties remitted guarantee deposits for the unsettled futures contracts in the futures brokers’ appointed account. The credit default risks were the responsibility of the futures brokers with high credit rating and therefore, no significant credit risk is expected.
2) Market risk
Market risk results from the fluctuations in interest rates. FBFC has entered into IRS and FRA contracts to hedge interest rate fluctuations in the bonds and bills market. Thus, the risks on fluctuating interest rates will be offset by the interest revenue from and expense for the assets and liabilities being hedged. In addition, FBFC evaluate the market value of the contracts from counterparty’s actuary information, and the transaction quotas were set to control risk. Thus, the market risk is acceptable to FBFC.

66
3) Liquidity risk and risk of cash flows
FBFC enters into nondelivery contract in which the contracts amounts are used only to calculate the amounts to settle with counterparties. Also, FBFC enters into interest rate futures transaction which is a kind of nondelivery margin transaction in which the related account receivable futures guarantee deposits and unsettled positions are calculated by lastprice in the evaluated day. That is, the nominal amount do not represent the actual cash inflow or outflow, thus, no significant cash demand is expected.
4) The gains and losses on derivative financial instruments
For the Years Ended December 31
2004 2003 Trading purposes Short call option on interest rate $ (6,256 ) $ 3,115 Interest rate swap contracts 61,637 (13,257 ) Forward rate agreements (404 ) 800 Assets swap on convertible bonds 4,006 Interest rate futures contracts (310 )
Gains from derivative financial instruments, net (included in other income) $ 58,673 $ (9,342 )
Nontrading purposes Forward rate agreements $ $ 20 Interest rate swap contracts 13,069 2,049
Interest income $ 13,069 $ 2,069
As of December 31, 2004 and 2003, the outstanding balances of derivative financial instruments were as follows:
December 31 2004 2003
Trading purposes: Short option premium (part of “other liabilities”) $ 4,634 $ 4,595 Unrealized valuation gains (part of “other financial assets”) $ 32,721 $ Accounts receivable futures guarantee deposits (part of “other financial assets guarantee deposits”) $ 63,812 $
Inverse floatingrate structured notes (part of other financial assets) $ 300,000 $
Interest receivable Nontrading purposes $ 9,038 $ 628 Trading purposes $ $ 129
33. SEGMENT AND GEOGRAPHIC INFORMATION
The Bank engages only in banking activities as prescribed by the Banking Law and has no single customer that accounts for 10% or more of the Bank’s operating revenues, and has no overseas units. Thus, no segment and geographic information is required to be disclosed.
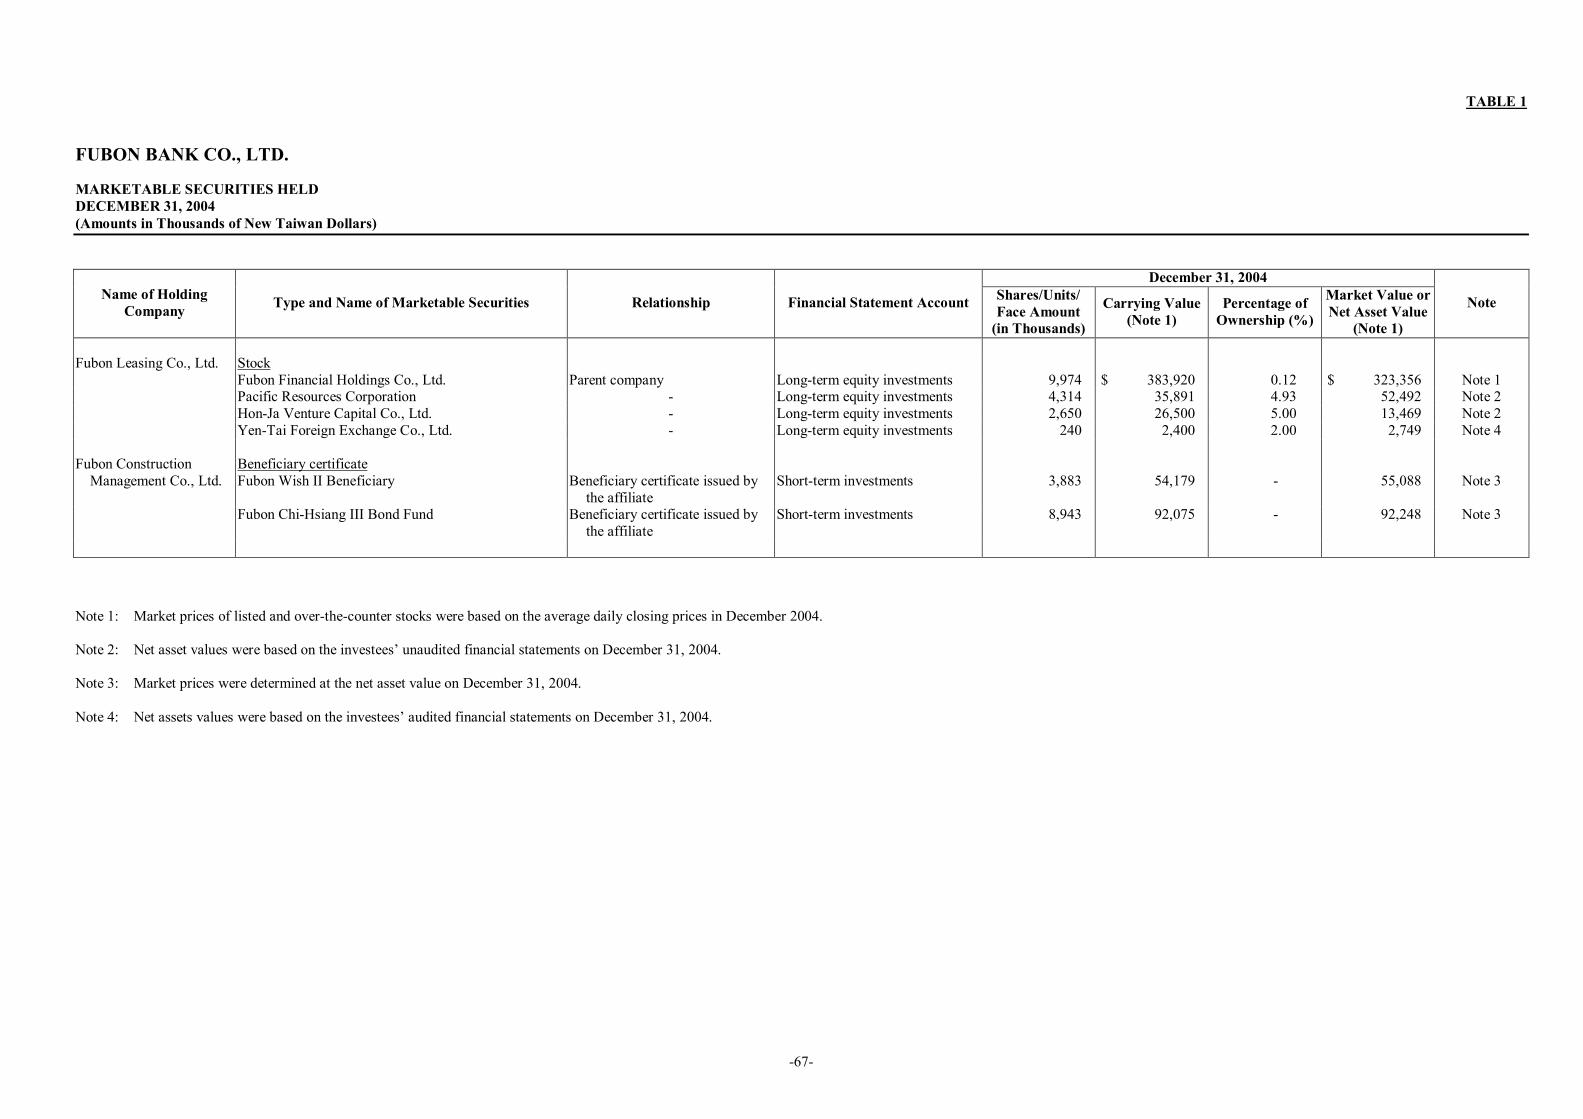
67
TABLE 1
FUBON BANK CO., LTD.
MARKETABLE SECURITIES HELD DECEMBER 31, 2004 (Amounts in Thousands of New Taiwan Dollars)
December 31, 2004 Name of Holding
Company Type and Name of Marketable Securities Relationship Financial Statement Account Shares/Units/ Face Amount (in Thousands)
Carrying Value (Note 1)
Percentage of Ownership (%)
Market Value or Net Asset Value
(Note 1)
Note
Fubon Leasing Co., Ltd. Stock Fubon Financial Holdings Co., Ltd. Parent company Longterm equity investments 9,974 $ 383,920 0.12 $ 323,356 Note 1 Pacific Resources Corporation Longterm equity investments 4,314 35,891 4.93 52,492 Note 2 HonJa Venture Capital Co., Ltd. Longterm equity investments 2,650 26,500 5.00 13,469 Note 2 YenTai Foreign Exchange Co., Ltd. Longterm equity investments 240 2,400 2.00 2,749 Note 4
Fubon Construction Beneficiary certificate Management Co., Ltd. Fubon Wish II Beneficiary Beneficiary certificate issued by
the affiliate Shortterm investments 3,883 54,179 55,088 Note 3
Fubon ChiHsiang III Bond Fund Beneficiary certificate issued by the affiliate
Shortterm investments 8,943 92,075 92,248 Note 3
Note 1: Market prices of listed and overthecounter stocks were based on the average daily closing prices in December 2004.
Note 2: Net asset values were based on the investees’ unaudited financial statements on December 31, 2004.
Note 3: Market prices were determined at the net asset value on December 31, 2004.
Note 4: Net assets values were based on the investees’ audited financial statements on December 31, 2004.

68
TABLE 2
FUBON BANK CO., LTD.
RECEIVABLES FROM RELATED PARTIES AMOUNTING TO AT LEAST NT$300 MILLION OR 10% OF THE ISSUED CAPITAL DECEMBER 31, 2004 (Amounts in Thousand of New Taiwan Dollars)
Overdue Company Name Related Party Relationship Ending Balance Turnover Rate Amount Action Taken
Amounts Received in Subsequent
Period
Allowance for Bad Debts
Fubon Bank Co., Ltd. Fubon Assets Management
Subsidiary of Fubon Financial Holdings
$1,112,352 Not applicable $ $ $
Note: The receivable comes from disposal of nonperforming loans to Fubon Assets Management on November 16, 2004.

69
TABLE 3
FUBON BANK CO., LTD.
NAMES, LOCATIONS, AND OTHER INFORMATION OF INVESTEES ON WHICH THE BANK EXERCISES SIGNIFICANT INFLUENCE DECEMBER 31, 2004 (Amounts in Thousands of New Taiwan Dollars)
Original Investment Amount Balance as of December 31, 2004 Investor Company Investee Company Location Main Businesses and Products December 31,
2004 December 31,
2003 Shares
(Thousands) Percentage of Ownership
Carrying Value
Net Income (Loss) of the Investee
Investment Gain (Loss) Note
Fubon Bank Co., Ltd. Fubon Bills Finance Co., Ltd. Taipei Bond and bill underwriting, guarantee, and endorsement
$ 3,910,329 $ 3,910,329 453,373 100.00 $ 6,209,475 $ 698,904 $ 695,243 Note 1
Fubon Leasing Co., Ltd. Taipei Sales, maintenance and lease of machinery and equipment
999,900 999,900 99,990 99.99 784,082 17,906 17,904
Fubon Construction Management Co., Ltd. Taipei Investigation, consultation, management and real estate evaluation of construction plans and finance
30,000 30,000 4,273 30.00 45,295 (1,823) (547)
Fubonbank Insurance Agent Co., Ltd. Taipei Life insurance agent 5,021 1,900 200 100.00 79,758 66,703 64,235 Note 2 Fubon Insurance Agent Co., Ltd. Taipei Property insurance agent 2,013 1,980 200 100.00 3,488 1,359 1,348 Note 2
Note 1: Net income from the investee included (1) the amortization of the difference between acquisition cost and the equity in the investee; and (2) reversal of unrealized transaction.
Note 2: In December 2004, the board of directors resolved the acquisition of minority interest of Fubonbank Insurance Agent Co., Ltd. and Fubon Insurance Agent Co., Ltd.

70
<Appendix2> Consolidated Financial Reports
for 2004 and 2003 Except for Fubon Bill Finance, the Bank’s subsidiaries Fubon Leasing, Fubonbank Insurance Agent and Fubon Insurance Agent were not included in the consolidated financial statements, since their individual assets and operating revenues were less than 10% of those of the Bank, and their total assets and operating revenues were less than 30% of those of the Bank. Consolidated Financial Statements of Fubon Commercial Bank and Fubon Bill Finance are as
fellow:

71
FUBON BANK CO., LTD. AND SUBSIDIARIES
CONSOLIDATED BALANCE SHEETS DECEMBER 31, 2004 AND 2003 (In Thousands of New Taiwan Dollars and Shares, Except Par Value)
2004 2003 2004 2003 ASSETS Amount % Amount % LIABILITIES AND SHAREHOLDERS’ EQUITY Amount % Amount %
CASH AND CASH EQUIVALENT $ 5,434,877 1 $ 6,918,206 2 LIABILITIES Shortterm bills payable $ 1,776,642 $ 3,745,248 1
DUE FROM CENTRAL BANK AND BANKS 23,481,585 6 43,696,386 15 Due to banks 10,880,414 3 9,306,959 3 Payables 6,132,854 2 6,107,961 2
SECURITIES PURCHASED, NET 133,102,791 35 87,303,404 29 Repurchase agreements 67,272,787 17 Advance receipts 773,412 357,292
RECEIVABLES, NET 36,490,305 10 36,157,646 12 Deposits and remittances 231,434,393 60 221,394,560 74 Bank debentures 29,400,000 8 22,500,000 8
RESELL AGREEMENTS 50,225 Bonds 3,000,000 1 1,000,000 Other liabilities 1,772,078 2,180,212 1
PREPAYMENTS AND OTHER 325,184 542,356 Total liabilities 352,442,580 91 266,592,232 89
BILLS, DISCOUNTS AND LOANS, NET 122,098,693 32 112,521,388 38 SHAREHOLDERS’ EQUITY
LONGTERM INVESTMENTS, NET Capital stock $10 par value Longterm equity investments under the equity method 912,623 878,492 Authorized and issued 2,185,736,697 shares 21,857,367 6 21,857,367 7 Longterm equity investments under the cost method 3,452,865 1 2,795,171 1 Capital surplus Longterm bond investments 49,694,075 13 456,501 Paidin capital in excess of par value 1,437,250 1,437,250 1
Reissuance of treasury stock 26,054 26,054 Longterm investments, net 54,059,563 14 4,130,164 1 Retained earnings
Legal reserve 5,148,426 2 3,801,201 1 OTHER FINANCIAL ASSETS 4,496,309 1 1,286,298 1 Special reserve 252,058 252,058
Unappropriated 4,365,274 1 4,596,072 2 PROPERTIES Unrealized loss on longterm equity investments (60,541) (61,191) Cost Land 2,574,997 1 2,574,997 1 Total shareholders’ equity 33,025,888 9 31,908,811 11 Buildings 2,211,693 1 2,205,374 1 Equipment 1,154,798 936,874 CONTINGENCIES AND COMMITMENTS Transportation and communications equipment 82,337 114,695 Miscellaneous equipment 390,881 378,742 Leasehold improvements 600,806 569,579 Total cost 7,015,512 2 6,780,261 2
Less: Accumulated depreciation 1,991,650 1 1,801,106 5,023,862 1 4,979,155 2
Advances on acquisitions of equipment and construction in progress 264,617 42,996
Net properties 5,288,479 1 5,022,151 2
OTHER ASSETS, NET 640,457 923,044
TOTAL $ 385,468,468 100 $ 298,501,043 100 TOTAL $ 385,468,468 100 $ 298,501,043 100

72
FUBON BANK CO., LTD. AND SUBSIDIARIES
CONSOLIDATED STATEMENTS OF INCOME FOR THE YEARS ENDED DECEMBER 31, 2004 AND 2003 (In Thousands of New Taiwan Dollars, Except Earnings Per Share)
2004 2003 Amount % Amount %
OPERATING INCOME Interest $ 15,843,127 72 $ 12,655,868 59 Service fees 4,581,415 21 4,077,888 19 Income from securities, net 729,810 3 4,466,997 21 Income from longterm equity investments under the equity method, net 82,940 46,721
Foreign exchange gain 110,936 1 65,591 Other 624,196 3 262,846 1
Total operating income 21,972,424 100 21,575,911 100
OPERATING COSTS Interest) 5,005,289 23 4,158,549 19 Service charges 1,944,754 9 2,131,262 10 Loss from longterm investments 42,947 Provisions for trading and credit losses 3,699,061 17 5,470,756 25 Other 590,959 2 99,304 1
Total operating costs 11,240,063 51 11,902,818 55
GROSS PROFIT 10,732,361 49 9,673,093 45
OPERATING EXPENSES Functional and administrative 5,265,597 24 4,746,058 22 Other 19,040 13,351
Total operating expenses 5,284,637 24 4,759,409 22
OPERATING INCOME 5,447,724 25 4,913,684 23
NONOPERATING INCOME AND GAINS 80,468 301,714 1
NONOPERATING EXPENSES AND LOSSES 106,261 1 287,087 1
INCOME BEFORE INCOME TAX 5,421,931 24 4,928,311 23
INCOME TAX 1,161,978 5 437,560 2
CONSOLIDATED NET INCOME $ 4,259,953 19 $ 4,490,751 21
(Continued)

73
2004 2003 After After
Pretax Tax Pretax Tax EARNINGS PER SHARE Basic earnings per share $ 2.48 $ 1.95 $ 2.26 $ 2.06
(Concluded)
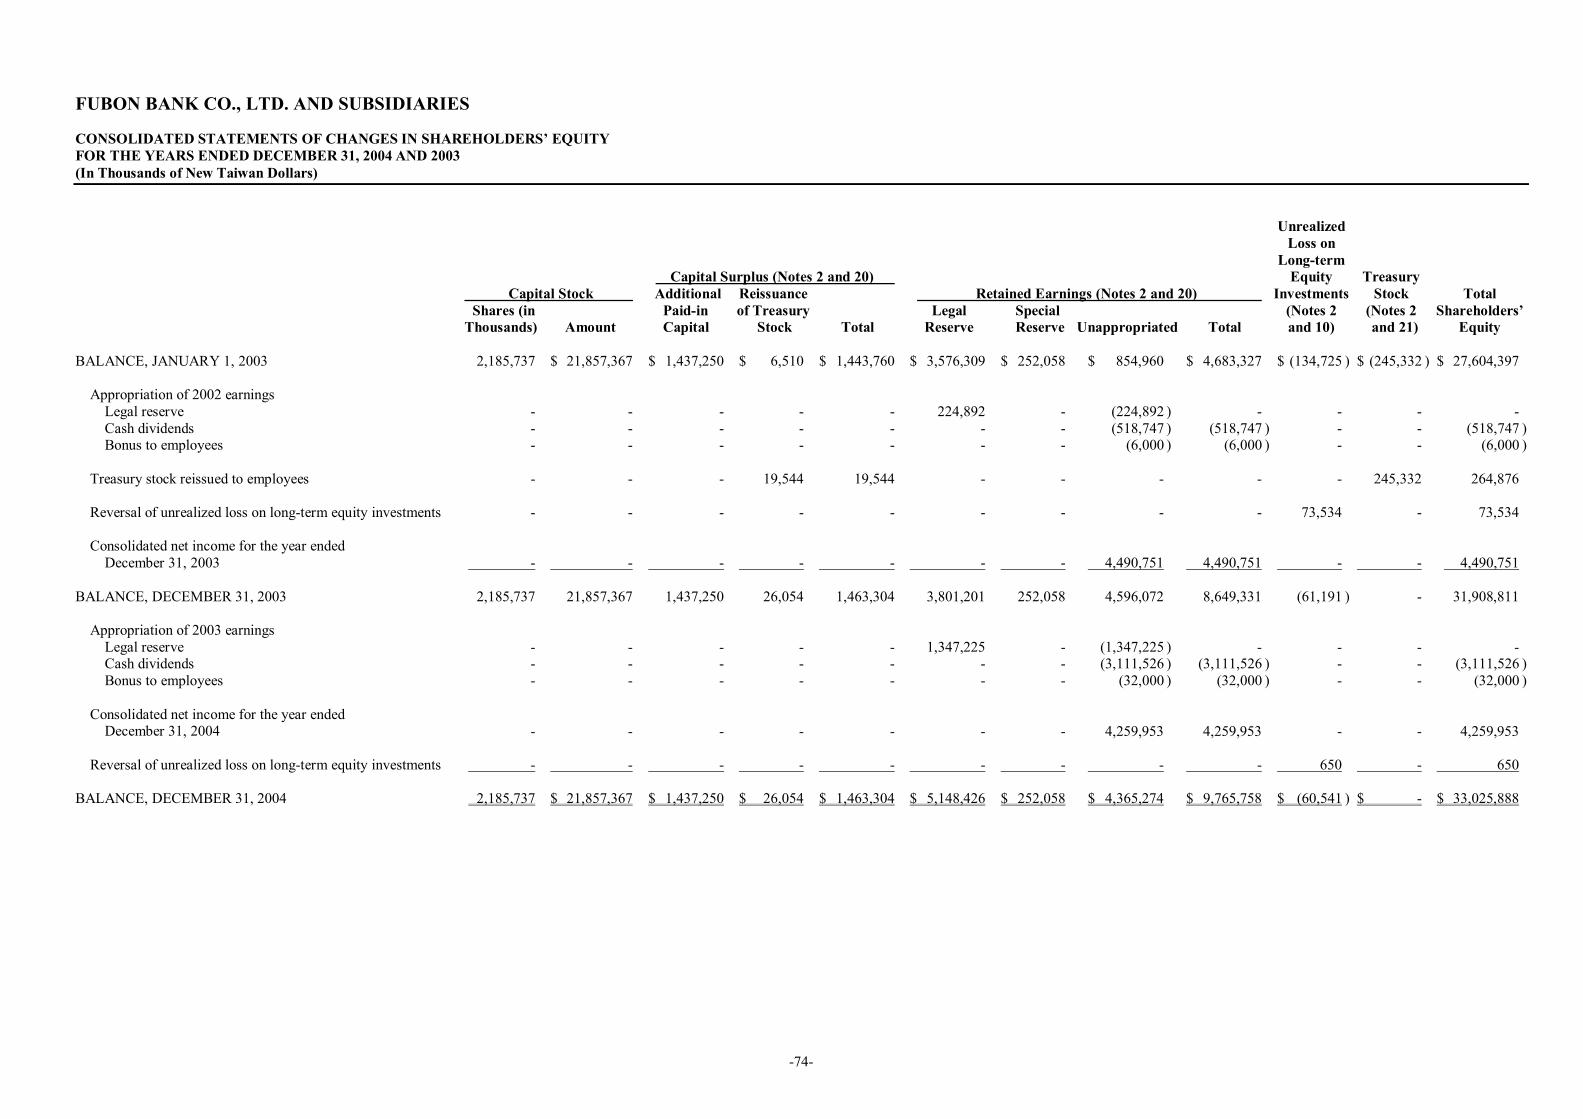
74
FUBON BANK CO., LTD. AND SUBSIDIARIES
CONSOLIDATED STATEMENTS OF CHANGES IN SHAREHOLDERS’ EQUITY FOR THE YEARS ENDED DECEMBER 31, 2004 AND 2003 (In Thousands of New Taiwan Dollars)
Unrealized Loss on
Longterm Capital Surplus (Notes 2 and 20) Equity Treasury
Capital Stock Additional Reissuance Retained Earnings (Notes 2 and 20) Investments Stock Total Shares (in Paidin of Treasury Legal Special (Notes 2 (Notes 2 Shareholders’ Thousands) Amount Capital Stock Total Reserve Reserve Unappropriated Total and 10) and 21) Equity
BALANCE, JANUARY 1, 2003 2,185,737 $ 21,857,367 $ 1,437,250 $ 6,510 $ 1,443,760 $ 3,576,309 $ 252,058 $ 854,960 $ 4,683,327 $ (134,725 ) $ (245,332 ) $ 27,604,397
Appropriation of 2002 earnings Legal reserve 224,892 (224,892 ) Cash dividends (518,747 ) (518,747 ) (518,747 ) Bonus to employees (6,000 ) (6,000 ) (6,000 )
Treasury stock reissued to employees 19,544 19,544 245,332 264,876
Reversal of unrealized loss on longterm equity investments 73,534 73,534
Consolidated net income for the year ended December 31, 2003 4,490,751 4,490,751 4,490,751
BALANCE, DECEMBER 31, 2003 2,185,737 21,857,367 1,437,250 26,054 1,463,304 3,801,201 252,058 4,596,072 8,649,331 (61,191 ) 31,908,811
Appropriation of 2003 earnings Legal reserve 1,347,225 (1,347,225 ) Cash dividends (3,111,526 ) (3,111,526 ) (3,111,526 ) Bonus to employees (32,000 ) (32,000 ) (32,000 )
Consolidated net income for the year ended December 31, 2004 4,259,953 4,259,953 4,259,953
Reversal of unrealized loss on longterm equity investments 650 650
BALANCE, DECEMBER 31, 2004 2,185,737 $ 21,857,367 $ 1,437,250 $ 26,054 $ 1,463,304 $ 5,148,426 $ 252,058 $ 4,365,274 $ 9,765,758 $ (60,541 ) $ $ 33,025,888

75
FUBON BANK CO., LTD. AND SUBSIDIARIES
CONSOLIDATED STATEMENTS OF CASH FLOWS FOR THE YEARS ENDED DECEMBER 31, 2004 AND 2003 (In Thousands of New Taiwan Dollars)
2004 2003
CASH FLOWS FROM OPERATING ACTIVITIES Consolidated net income $ 4,259,953 $ 4,490,751 Provision (reversal) of allowance for losses on securities 145,562 (101,320 ) Loss from longterm equity investments 19,146 Provision of allowance for longterm bond investments 19,061 62,057 Provisions for trading and credit losses 3,699,061 5,470,756 Depreciation and amortization 331,838 289,618 Gain on disposal of nonperforming loans, net (31,027 ) Loss from transfer of securities purchased to longterm bond investments 2,462,125
Income from longterm equity investments under the equity method (82,940 ) (46,721 )
Cash dividends received 52,613 26,966 Losses (gains) on disposal of longterm investments (9,841 ) 23,801 Losses on disposal of properties 2,127 2,250 Losses on disposal of collaterals assumed 27,844 92,220 Unrealized losses from collaterals assumed 132,725 2,025 Amortization of premium on longterm bond investments 27,719 Increase (decrease) in accrued pension cost (5,979 ) 66,870 Deferred income tax 26,661 35,934 Decrease (increase) in receivables and prepayments 9,938 (449,334 ) Increase in resell agreements (50,225 ) Increase (decrease) in payables and advance receipts 420,992 (3,019,137 ) Increase in repurchase agreements 41,612,150
Net cash provided by operating activities 53,050,357 6,965,882
CASH FLOWS FROM INVESTING ACTIVITIES Increase in securities purchased for investing purposes (99,952,075 ) (22,836,084 ) Decrease (increase) in due from Central Bank and banks 20,214,801 (9,805,823 ) Increase in other financial instruments (3,210,011 ) (829,703 ) Decrease (increase) in bills, discounts and loans (13,390,324 ) 3,138,034 Proceeds from disposal of longterm investments 3,529,685 816,766 Increase in longterm equity investments (3,154 ) Increase in longterm bond investments (2,384,677 ) (271,984 ) Acquisition of properties (710,406 ) (292,268 ) Proceeds from disposal of properties 123,196 9,272 Proceeds from disposal of collaterals assumed 120,290 241,677 Decrease (increase) in other assets (38,016 ) 251,657
Net cash used in investing activities (95,700,691 ) (29,578,456 )
(Continued)

76
2004 2003
CASH FLOWS FROM FINANCING ACTIVITIES Increase (decrease) in shortterm bills payable $ (1,968,606 ) $ 3,745,248 Increase in repurchase agreements 25,660,637 Increase in due to banks 1,573,455 3,520,971 Increase in deposits and remittances 10,039,833 3,093,176 Increase in bonds 2,000,000 1,000,000 Increase in bank debentures 6,900,000 12,500,000 Increase (decrease) in other liabilities (408,134 ) 547,978 Cash dividends and employee bonus paid (3,111,526 ) (524,747 ) Decrease in dividends and bonus payable (6,000 ) (15,006 ) Proceeds from reissuance of treasury stock to employees 264,876
Net cash provided by financing activities 40,679,659 24,132,496
EFFECTS OF EXCHANGE RATE CHANGES 487,346 (14,300 )
NET INCREASE (DECREASE) IN CASH AND CASH EQUIVALENT (1,483,329 ) 1,505,622
CASH AND CASH EQUIVALENT, BEGINNING OF YEAR 6,918,206 5,412,584
CASH AND CASH EQUIVALENT, END OF YEAR $ 5,434,877 $ 6,918,206
SUPPLEMENTAL INFORMATION Interest paid $ 5,051,091 $ 4,478,224 Income tax paid $ 480,557 $ 287,171
NONCASH INVESTING ACTIVITIES Transfer of securities purchased to longterm investments $ 51,545,001 $