
Title of Report - Failte Ireland · Title of Report Date Analysis of Visitor Accommodation in...
48
Analysis of Visitor Accommodation in Dublin 2015-20 Final Report June 2016
-
Upload
trinhnguyet -
Category
Documents
-
view
213 -
download
0
Transcript of Title of Report - Failte Ireland · Title of Report Date Analysis of Visitor Accommodation in...
Title of Report Date
Analysis of Visitor Accommodation
in Dublin 2015-20
Final Report
June 2016
DUBLIN VISITOR ACCOMMODATION 2015-2020: REPORT TO FÁILTE IRELAND
i
TABLE OF CONTENTS
EXECUTIVE SUMMARY ............................................................................................................................ I
1. INTRODUCTION .......................................................................................................................... 1
1.1 INTRODUCTION ............................................................................................................................ 1
1.2 PURPOSE AND TERMS OF REFERENCE ................................................................................................ 1
1.3 METHOD ................................................................................................................................... 2
1.4 REPORT STRUCTURE ..................................................................................................................... 2
2. INDUSTRY CONTEXT ....................................................................................................................... 4
2.1 INTRODUCTION ............................................................................................................................ 4
2.2 ECONOMIC CONTEXT AND TRENDS ................................................................................................... 4
2.3 IRISH AND DUBLIN TOURISM CONTEXT .............................................................................................. 6
2.4 POLICY CONTEXT .......................................................................................................................... 8
3. VISITOR ACCOMMODATION – DEMAND SCENARIOS .................................................................... 11
3.1 INTRODUCTION .......................................................................................................................... 11
3.2 EXISTING MARKET FOR VISITOR ACCOMMODATION IN DUBLIN .............................................................. 11
3.3 DRIVERS OF FUTURE DEMAND FOR ACCOMMODATION ........................................................................ 16
3.4 DEMAND SCENARIOS FOR VISITOR ACCOMMODATION IN DUBLIN ........................................................... 20
4. VISITOR ACCOMMODATION – SUPPLY TRENDS AND PROSPECTS ................................................. 22
4.1 INTRODUCTION .......................................................................................................................... 22
4.2 CURRENT SUPPLY OF VISITOR ACCOMMODATION IN DUBLIN ................................................................. 22
4.3 FUTURE PROSPECTS IN APPROVED ACCOMMODATION SUPPLY .............................................................. 26
4.4 FACTORS AFFECTING SUPPLY ......................................................................................................... 30
4.5 FACTORS AFFECTING DEVELOPMENT AMONGST PROJECTS WITH PLANNING APPROVAL ............................... 33
5. CONCLUSIONS AND POLICY RESPONSES ....................................................................................... 35
5.1 OVERALL CONCLUSIONS ............................................................................................................... 35
5.2 POSSIBLE POLICY RESPONSES ........................................................................................................ 41
ANNEXES

DUBLIN VISITOR ACCOMMODATION 2015-2020: REPORT TO FÁILTE IRELAND
i
Executive Summary
Over recent years there has been increasing evidence of an emerging shortfall of visitor accommodation
in Dublin that could limit the potential for tourism growth longer term, and also threaten the
competitiveness and attractiveness of the city as a tourist destination short term. Over the last five years
tourist arrivals to Dublin grew by 33%, yet the stock of available accommodation fell by 6%.
It was against this background that Fáilte Ireland commissioned Fitzpatrick Associates Economic
Consultants to:
clarify the amount of additional accommodation stock required to meet anticipated levels of
demand in Dublin between now and 2020; and
identify solutions to address the challenge arising from a shortfall in accommodation stock.
On the supply side, the findings are that after almost ten years of inactivity, a strong pipeline of new
accommodation stock is set to come on stream as the cost of providing new accommodation stock
comes into line with its earnings potential. As of late March 2016, 80 prospective projects to develop
additional hotel capacity in the city are identified, of which 65 are considered likely to open for business
by 2020. This could generate an estimated 5,550 additional bedrooms, split between new hotels (3,800
or 68%) and existing hotel extensions (1,750 or 32%). However, most of the new stock will not come on
stream until 2018 or later.
On the demand side, several scenarios are examined, with the annual growth in overseas arrivals
ranging from 2.2% to 6.8%. When the pipeline of accommodation supply is compared with prospective
demand, the resulting estimates of the scale of the supply shortfall are shown. In all cases, the analysis
points to an ongoing stock shortage between 2016 and 2018, but moving into surplus in most demand
scenarios thereafter.
In the short-term, corrective initiatives should focus on:
ongoing monitoring of market trends, particularly the supply pipeline. It is essential that the
anticipated new stock fully materialises, and also that it does so as quickly as possible;
liaison with the city’s planning officials to help bring about greater efficiency and certainty for those
seeking to put new visitor accommodation stock in place, e.g.:
o streamlining or fast-tracking the planning process;
o adopting a strategic development zone approach for hotels and related developments;
o supporting case-making for such developments and their planning approval;
formal initiatives to help better spread demand across the season and across the city and county.
Other actions should focus on changes to allow for more site intensification. These could include:
updating existing statutory accommodation regulations, particularly those of hotels, so that they
reflect contemporary consumer preferences. This should include, at minimum, bringing bedroom
size in line with international norms, less generous spatial requirements, and more flexible services
and facilities; and
reviewing maximum allowable heights. Increasing the number of storeys on building helps to
generate more revenue from the same footprint, and would hence encourage new supply.

DUBLIN VISITOR ACCOMMODATION 2015-2020: REPORT TO FÁILTE IRELAND
1
1. Introduction
1.1 Introduction
A new strategy for tourism development in Dublin – “Destination Dublin – A Collective Strategy for Growth to
2020”, was launched in January 2014. This sets out a range of tourism growth scenarios and targets for the
city to the end of the decade, as well as strategic actions to enable their achievement. In a context of a
continued strengthening of tourism demand in the city, in August 2015 Fáilte Ireland commissioned
Fitzpatrick Associates Economic Consultants to examine the future supply of visitor accommodation in
Dublin, and to assess any potential shortfall in supply in the context of growing tourist and visitor numbers
and anticipated further growth up to 2020. This report sets out the findings from the research.
1.2 Purpose and Terms of Reference
The overall aims of the research have been to:
identify the scale (if any) of the additional tourist accommodation stock required to meet anticipated
levels of demand in Dublin between now and 2020;
in the event of identifying the need for additional tourist accommodation, develop policy and related
solutions to address the challenge.
The specific objectives of the research were as follows:
1. Based on data provided by Fáilte Ireland and from other sources, quantify the scale and nature of
available tourist stock in Dublin city and county both by (a) location and (b) accommodation type.
2. Quantify, to the fullest possible extent, the paid accommodation stock (by location and type) likely
to come on-stream in Dublin city and county over the next five years, e.g. planning permissions
granted, existing builds, projects in planning and sites zoned, etc.
3. Based on up to four growth scenarios, identify the scale (if any) of the additional tourist
accommodation stock required to meet projected levels of demand between 2015 and 2020.
4. Provide an assessment of the key non-tourism specific macroeconomic factors that are likely to
influence the growth in future overseas tourist arrivals into Dublin, e.g., exchange rates, economic
growth, etc.
5. In the event of identifying the need for additional tourist accommodation:
a. provide an informed commentary on the possible reasons why the issue has arisen, e.g.,
profitability, availability of funding, relative rates of return on alternative property usages,
planning considerations, etc.
b. develop policy and other solutions to address the issue.

DUBLIN VISITOR ACCOMMODATION 2015-2020: REPORT TO FÁILTE IRELAND
2
1.3 Method
1.3.1 Overall Method
The methodology has comprised:
a review of relevant documents and literature;
a desk-based review and analysis of secondary data sources;
collation and examination of planning data on new visitor accommodation capacity from Dublin local
authorities; and
a programme of consultations with key stakeholders and informants.
A list of parties consulted is set out at Annex 1.
1.3.2 Scope and Definitions
In relation to the scope and definitions used in the analysis, it should be noted that:
the report and analysis deals with visitor accommodation approved by Fáilte Ireland, which includes
hotels, guest houses, youth and holiday hostels, Irish Home B&Bs, self-catering, and caravan and
camping. In Dublin and internationally there is growth in informal paid visitor accommodation,
particularly through web-based tools enabling listing, sharing, renting and letting of lodging for
short or longer-term durations. Some hosts that utilise such websites may be approved
accommodation providers but many are not, however there are no reliable estimates. While the
core analysis therefore deals only with approved accommodation, Chapter 4 includes information
provided by Airbnb, the well-known accommodation booking web platform;
“Dublin” is taken to mean the city and wider county, together comprising the areas of Dublin City
Council as well as Fingal, South Dublin and Dun Laoghaire Rathdown County Councils;
while tourism is a central driver of accommodation demand, so are non-tourist visits. The report
uses the terms tourist and visitor interchangeably;
the analysis focuses on “paid” bednights and bed capacity, and non-paid capacity (e.g. home
swapping or staying with friends/relatives) is not considered.
1.4 Report Structure
The report is structured as follows:
Section 2 describes the background context, including the macro-economy, recent tourism trends and
performance, and the strategic and policy context for national tourism and tourism in Dublin;
Section 3 describes the existing market for visitor accommodation, sets out a number of future
demand scenarios, and considers key macro-economic determinants for future demand growth;
Section 4 describes existing accommodation supply, sets out our findings regarding future anticipated
growth in supply, and considers factors affecting that supply growth outlook;

DUBLIN VISITOR ACCOMMODATION 2015-2020: REPORT TO FÁILTE IRELAND
3
Section 5 presents overall conclusions, and sets out a range of potential public policy responses for
the consideration of Fáilte Ireland.
DUBLIN VISITOR ACCOMMODATION 2015-2020: REPORT TO FÁILTE IRELAND
4
2. Industry Context
2.1 Introduction
This Section describes the background context to the study. Section 2.2 briefly describes the economic
context, touching on macro-economic factors that have influenced recent tourism growth. Section 2.3
considers the tourism context, and describes recent industry trends both nationally and specifically in Dublin.
Section 2.4 briefly touches on the policy and strategic context for tourism nationally and in Dublin.
2.2 Economic Context and Trends
2.2.1 Irish Context
The demand for Irish tourism services was buoyant in 2014 and 2015 aided by a benign economic
environment. This was a welcome change following a protracted period of much harsher economic
conditions that negatively impacted on Irish tourism. Thus, the tourism sector in Ireland has returned to
positive growth, and a number of key factors have contributed to this. These include the recent return to
overall economic growth in Ireland, and in key overseas tourism markets, as well as trends in exchange rate
movements and inflation that have enhanced price competitiveness.
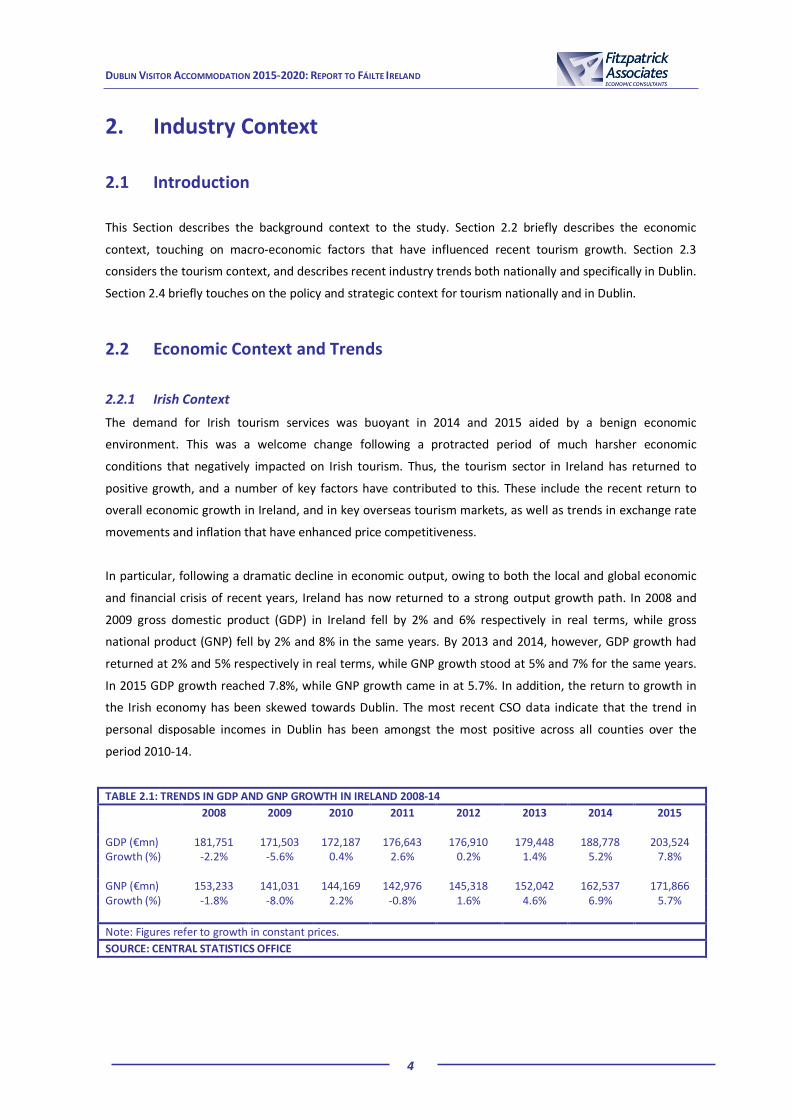
In particular, following a dramatic decline in economic output, owing to both the local and global economic
and financial crisis of recent years, Ireland has now returned to a strong output growth path. In 2008 and
2009 gross domestic product (GDP) in Ireland fell by 2% and 6% respectively in real terms, while gross
national product (GNP) fell by 2% and 8% in the same years. By 2013 and 2014, however, GDP growth had
returned at 2% and 5% respectively in real terms, while GNP growth stood at 5% and 7% for the same years.
In 2015 GDP growth reached 7.8%, while GNP growth came in at 5.7%. In addition, the return to growth in
the Irish economy has been skewed towards Dublin. The most recent CSO data indicate that the trend in
personal disposable incomes in Dublin has been amongst the most positive across all counties over the
period 2010-14.
TABLE 2.1: TRENDS IN GDP AND GNP GROWTH IN IRELAND 2008-14
2008 2009 2010 2011 2012 2013 2014 2015
GDP (€mn) 181,751 171,503 172,187 176,643 176,910 179,448 188,778 203,524 Growth (%) -2.2% -5.6% 0.4% 2.6% 0.2% 1.4% 5.2% 7.8% GNP (€mn) 153,233 141,031 144,169 142,976 145,318 152,042 162,537 171,866 Growth (%) -1.8% -8.0% 2.2% -0.8% 1.6% 4.6% 6.9% 5.7%
Note: Figures refer to growth in constant prices.
SOURCE: CENTRAL STATISTICS OFFICE

DUBLIN VISITOR ACCOMMODATION 2015-2020: REPORT TO FÁILTE IRELAND
5
2.2.2 Overseas Visitor Markets
Furthermore, economic growth also returned to many of Ireland’s key tourism source markets, contributing
to increased overseas tourism demand. In the UK and US GDP growth in real terms averaged 2.4% and 2.2%
per annum between 2013 and 2015 respectively. Growth in the Euro Area, on the other hand was more
muted averaging 0.8% per annum 2010 to 2015 and 0.7% in 2013-15.
TABLE 2.2: TRENDS IN GDP GROWTH IN KEY OVERSEAS TOURISM MARKETS 2010-15 (%)
2010 2011 2012 2013 2014 2015 (e) UK 1.9% 1.6% 0.7% 1.7% 3.0% 2.5% US 2.5% 1.6% 2.2% 1.5% 2.4% 2.6% Euro Area 2.0% 1.6% -0.8% -0.3% 0.9% 1.5% France 2.0% 2.1% 0.2% 0.7% 0.2% 1.2% Germany 3.9% 3.7% 0.6% 0.4% 1.6% 1.5%
Note: Figures refer to growth in constant prices.
SOURCE: INTERNATIONAL MONETARY FUND – WORLD ECONOMIC OUTLOOK OCTOBER 2015
2.2.3 Exchange Rates and Inflation
Movements in currency exchange rates in 2014 and 2015 impacted very favourably on Irish tourism,
particularly vis-à-vis Sterling and the US Dollar. In 2015 the value of the Euro was as low as £0.70 and $1.10,
compared to highs of nearly £0.95 and $1.60, respectively, during 2008 and 2009. Thus, the relative cost of
visiting Ireland fell for both UK and US visitors to Ireland, by as much as 30% in exchange rate terms, as their
home currencies appreciated against the Euro.
FIGURE 2.1: EURO EXCHANGE RATES, 2008-2016
SOURCE: EUROSTAT
0.60
0.70
0.80
0.90
1.00
1.10
1.20
1.30
1.40
1.50
1.60
20
08
M0
1
20
08
M0
3
20
08
M0
5
20
08
M0
7
20
08
M0
9
20
08
M1
1
20
09
M0
1
20
09
M0
3
20
09
M0
5
20
09
M0
7
20
09
M0
9
20
09
M1
1
20
10
M0
1
20
10
M0
3
20
10
M0
5
20
10
M0
7
20
10
M0
9
20
10
M1
1
20
11
M0
1
20
11
M0
3
20
11
M0
5
20
11
M0
7
20
11
M0
9
20
11
M1
1
20
12
M0
1
20
12
M0
3
20
12
M0
5
20
12
M0
7
20
12
M0
9
20
12
M1
1
20
13
M0
1
20
13
M0
3
20
13
M0
5
20
13
M0
7
20
13
M0
9
20
13
M1
1
20
14
M0
1
20
14
M0
3
20
14
M0
5
20
14
M0
7
20
14
M0
9
20
14
M1
1
20
15
M0
1
20
15
M0
3
20
15
M0
5
20
15
M0
7
20
15
M0
9
20
15
M1
1
20
16
M0
1
20
16
M0
3
£Stg per Euro $US per Euro

DUBLIN VISITOR ACCOMMODATION 2015-2020: REPORT TO FÁILTE IRELAND
6
Favourable inflation trends complemented the positive exchange rate movements with overall price growth
in Ireland generally lagging comparable movements in key source markets. In Ireland inflation averaged less
than 1% per annum in recent years and has also been low (although less so), and declining, in our key
tourism source markets.
Falling fuel costs have also made international travel cheaper - total passenger numbers rose by 4.5% within
the EU in the first half of 2015. Passenger movements in Dublin airport rose well over three times as fast
increasing to a record 11.5 mn for January – June 2015. This trend continued over the remainder of the year
with a 15% increase to 25 mn (3.3 mn additional passengers) for the full year.
TABLE 2.3: TRENDS IN INFLATION GROWTH IN IRELAND AND KEY OVERSEAS TOURISM MARKETS 2010-15 (%)
2010 2011 2012 2013 2014 2015 (e) Ireland -1.6% 1.2% 1.9% 0.5% 0.3% 0.2% UK 3.3% 4.5% 2.8% 2.6% 1.5% 0.1% US 1.6% 3.1% 2.1% 1.5% 1.6% 0.1% Euro Area 1.6% 2.7% 2.5% 1.3% 0.4% 0.2% France 1.7% 2.3% 2.2% 1.0% 0.6% 0.1% Germany 1.2% 2.5% 2.1% 1.6% 0.8% 0.2%
SOURCE: INTERNATIONAL MONETARY FUND – WORLD ECONOMIC OUTLOOK OCTOBER 2015
2.3 Irish and Dublin Tourism Context
2.3.1 Tourism Trends and Projections - National
Tourism growth as a whole has been very strong in Ireland between 2010 and 2015, but especially since
2013. It is estimated that the number of overseas visitors to Ireland will have grown by over 35% from 5.9
mn to a projected 8.0 mn between 2010 and 2015 (and 28% between 2012 and 2015). The 8.0 mn projection
is the highest ever – the previous high was 7.5 mn in 2007. Visitor numbers from Mainland Europe, in
particular, have grown strongly, at 16% between 2014 and 2015, while North American and British visits have
increased by about 13% and 12% respectively. Domestic trips within Ireland slumped in 2010-12 but
recovered over the last three years from 7.3 mn in 2010 to 7.5 mn in 2015.
TABLE 2.4: TRENDS IN OVERSEAS AND DOMESTIC VISITORS TO IRELAND 2010-15 (000s)
2010 2011 2012 2013 2014 2015 (e) Overseas visitors 5,945 6,240 6,286 6,686 7,105 8,045 % growth -9.6% 5.0% 0.7% 6.4% 6.3% 13.2% Domestic visitors 7,300 7,169 7,031 7,111 7,354 7,529 % growth -12.5% -1.8% -1.9% 1.1% 3.4% 2.0%
SOURCE: FÁILTE IRELAND
Revenue growth from overseas tourism mirrored the rise in visitor numbers, increasing from €3.0 bn in 2010
to an estimated €4.3 bn in 2015 (43% increase), but with all of this attributable to the period between 2012
DUBLIN VISITOR ACCOMMODATION 2015-2020: REPORT TO FÁILTE IRELAND
7
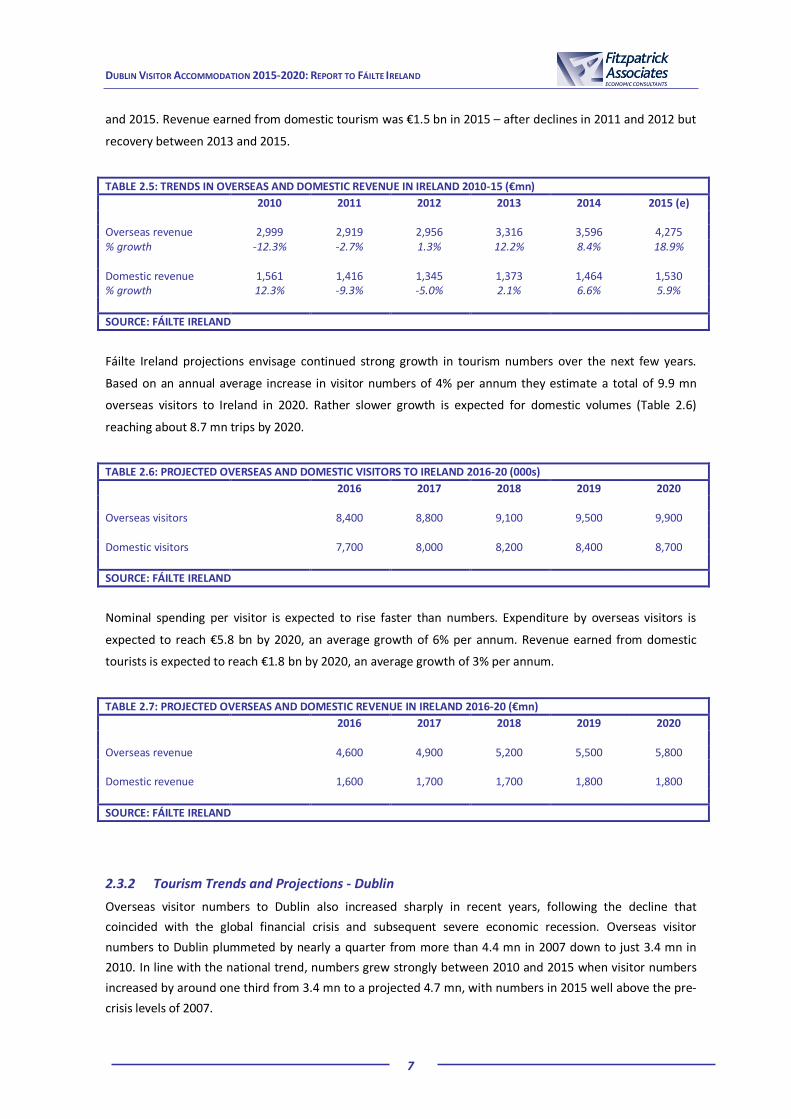
and 2015. Revenue earned from domestic tourism was €1.5 bn in 2015 – after declines in 2011 and 2012 but
recovery between 2013 and 2015.
TABLE 2.5: TRENDS IN OVERSEAS AND DOMESTIC REVENUE IN IRELAND 2010-15 (€mn)
2010 2011 2012 2013 2014 2015 (e) Overseas revenue 2,999 2,919 2,956 3,316 3,596 4,275 % growth -12.3% -2.7% 1.3% 12.2% 8.4% 18.9% Domestic revenue 1,561 1,416 1,345 1,373 1,464 1,530 % growth 12.3% -9.3% -5.0% 2.1% 6.6% 5.9%
SOURCE: FÁILTE IRELAND
Fáilte Ireland projections envisage continued strong growth in tourism numbers over the next few years.
Based on an annual average increase in visitor numbers of 4% per annum they estimate a total of 9.9 mn
overseas visitors to Ireland in 2020. Rather slower growth is expected for domestic volumes (Table 2.6)
reaching about 8.7 mn trips by 2020.
TABLE 2.6: PROJECTED OVERSEAS AND DOMESTIC VISITORS TO IRELAND 2016-20 (000s)
2016 2017 2018 2019 2020 Overseas visitors
8,400 8,800 9,100 9,500 9,900
Domestic visitors
7,700 8,000 8,200 8,400 8,700
SOURCE: FÁILTE IRELAND
Nominal spending per visitor is expected to rise faster than numbers. Expenditure by overseas visitors is
expected to reach €5.8 bn by 2020, an average growth of 6% per annum. Revenue earned from domestic
tourists is expected to reach €1.8 bn by 2020, an average growth of 3% per annum.
TABLE 2.7: PROJECTED OVERSEAS AND DOMESTIC REVENUE IN IRELAND 2016-20 (€mn)
2016 2017 2018 2019 2020 Overseas revenue
4,600 4,900 5,200 5,500 5,800
Domestic revenue
1,600 1,700 1,700 1,800 1,800
SOURCE: FÁILTE IRELAND
2.3.2 Tourism Trends and Projections - Dublin
Overseas visitor numbers to Dublin also increased sharply in recent years, following the decline that
coincided with the global financial crisis and subsequent severe economic recession. Overseas visitor
numbers to Dublin plummeted by nearly a quarter from more than 4.4 mn in 2007 down to just 3.4 mn in
2010. In line with the national trend, numbers grew strongly between 2010 and 2015 when visitor numbers
increased by around one third from 3.4 mn to a projected 4.7 mn, with numbers in 2015 well above the pre-
crisis levels of 2007.
DUBLIN VISITOR ACCOMMODATION 2015-2020: REPORT TO FÁILTE IRELAND
8
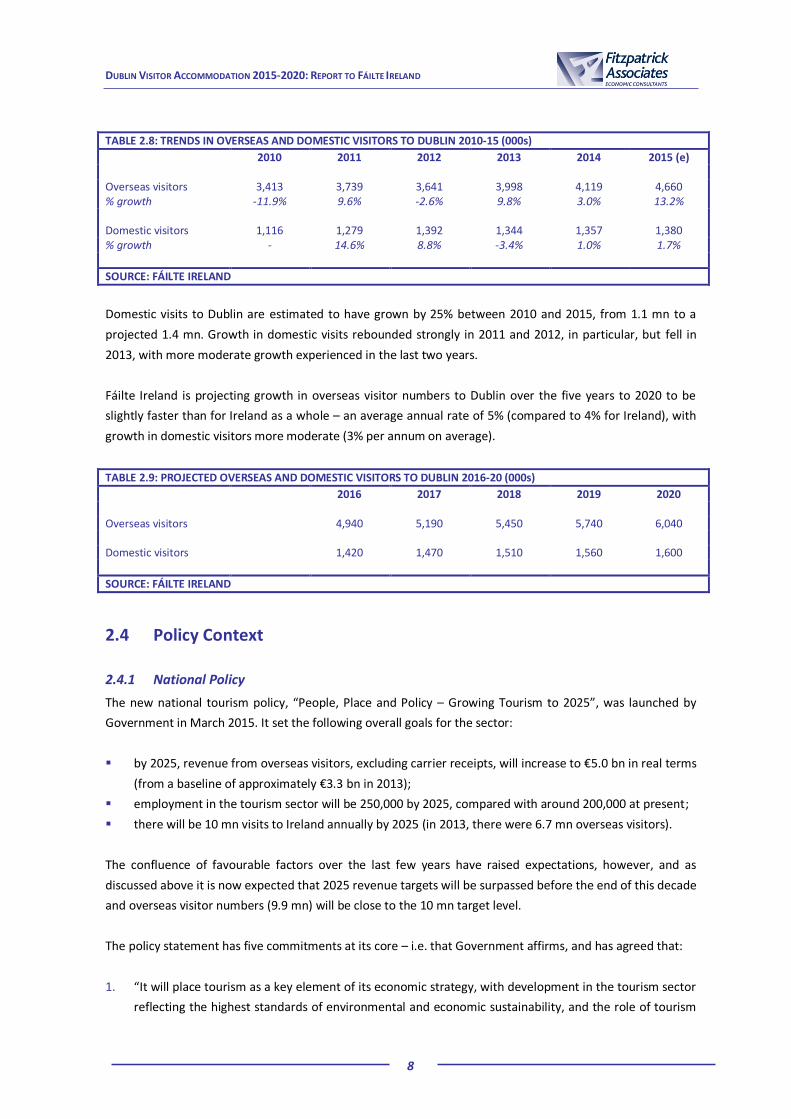
TABLE 2.8: TRENDS IN OVERSEAS AND DOMESTIC VISITORS TO DUBLIN 2010-15 (000s)
2010 2011 2012 2013 2014 2015 (e) Overseas visitors 3,413 3,739 3,641 3,998 4,119 4,660 % growth -11.9% 9.6% -2.6% 9.8% 3.0% 13.2% Domestic visitors 1,116 1,279 1,392 1,344 1,357 1,380 % growth - 14.6% 8.8% -3.4% 1.0% 1.7%
SOURCE: FÁILTE IRELAND
Domestic visits to Dublin are estimated to have grown by 25% between 2010 and 2015, from 1.1 mn to a
projected 1.4 mn. Growth in domestic visits rebounded strongly in 2011 and 2012, in particular, but fell in
2013, with more moderate growth experienced in the last two years.
Fáilte Ireland is projecting growth in overseas visitor numbers to Dublin over the five years to 2020 to be
slightly faster than for Ireland as a whole – an average annual rate of 5% (compared to 4% for Ireland), with
growth in domestic visitors more moderate (3% per annum on average).
TABLE 2.9: PROJECTED OVERSEAS AND DOMESTIC VISITORS TO DUBLIN 2016-20 (000s)
2016 2017 2018 2019 2020 Overseas visitors
4,940 5,190 5,450 5,740 6,040
Domestic visitors
1,420 1,470 1,510 1,560 1,600
SOURCE: FÁILTE IRELAND
2.4 Policy Context
2.4.1 National Policy
The new national tourism policy, “People, Place and Policy – Growing Tourism to 2025”, was launched by
Government in March 2015. It set the following overall goals for the sector:
by 2025, revenue from overseas visitors, excluding carrier receipts, will increase to €5.0 bn in real terms
(from a baseline of approximately €3.3 bn in 2013);
employment in the tourism sector will be 250,000 by 2025, compared with around 200,000 at present;
there will be 10 mn visits to Ireland annually by 2025 (in 2013, there were 6.7 mn overseas visitors).
The confluence of favourable factors over the last few years have raised expectations, however, and as
discussed above it is now expected that 2025 revenue targets will be surpassed before the end of this decade
and overseas visitor numbers (9.9 mn) will be close to the 10 mn target level.
The policy statement has five commitments at its core – i.e. that Government affirms, and has agreed that:
1. “It will place tourism as a key element of its economic strategy, with development in the tourism sector
reflecting the highest standards of environmental and economic sustainability, and the role of tourism
DUBLIN VISITOR ACCOMMODATION 2015-2020: REPORT TO FÁILTE IRELAND
9
in promoting peace and political co-operation on the island of Ireland will continue to be recognised
and encouraged.”
2. “Our people and our place remain our biggest assets in terms of our ability to attract an even greater
number of overseas visitors in the future. At the same time, these assets must be mobilised within a
robust and effective policy framework if Ireland is to reap the economic and social benefits of tourism.”
3. “To ensure that Ireland is successfully promoted overseas and our visitors’ expectations are met, the
marketing of Ireland as a visitor destination will aim to generate a balance of visitors from both mature
and developing markets; our heritage assets will be protected, and any public investment in tourism will
be based on evidenced need.”
4. “Ireland’s tourism industry will have the capacity and capability to meet the changing needs of visitors,
underpinned by a clear and coherent framework for the development of human capital in the industry.”
5. “There will be a clear understanding of the responsibilities and expectations of Government, State
agencies, Local Authorities, the tourism industry and other stakeholders in the development of our
tourism industry; with an enhanced role for Local Authorities and recognition of the contribution of
communities to tourism.”
In addition, the statement makes 51 policy proposals, under the following headings:
marketing Ireland as a visitor destination;
protecting key tourism assets;
supporting investment in the visitor experience;
the contribution of events to the quality of the visitor experience;
a changing approach to human resources and training in tourism;
competitiveness, research and innovation in the Irish tourism sector;
the regulatory structure for visitor accommodation;
local authorities supporting communities in tourism;
fiscal and enterprise policies and actions;
access to and within Ireland;
tourism risk management;
Ireland’s international activity to support tourism;
the role of the Department of Transport, Tourism and Sport and the tourism agencies;
tourism’s contribution to cross-border co-operation.
2.4.2 Dublin Policy
Directly relevant to this report, the Grow Dublin Taskforce (GDTF) was established by Fáilte Ireland in late
2012 with the aim of driving growth to Dublin in the period to 2020. To do this, the GDTF brought together
senior stakeholders from industry, State agencies and local authorities with international destination experts
to develop a seven-year strategy to achieve the shared goal of restoring growth from major markets, a
process that incorporated both extensive research in overseas markets (to find out what prospective visitors
look for when choosing a destination) and consultations with Dublin stakeholders (to assess Dublin’s
potential for meeting visitors’ requirements).
This strategy set out a clear roadmap for growing Dublin’s tourism in the years ahead, driven by an ambition
to catch up with and exceed the growth levels of its competitors, and based on the proposition of Dublin as a

DUBLIN VISITOR ACCOMMODATION 2015-2020: REPORT TO FÁILTE IRELAND
10
“... vibrant capital city bursting with a variety of surprising experiences – where city living thrives side by side
with the natural outdoors”. In this regard, the GDTF identified five “promotable” sectors and/or segments
that offer potential for significant growth and the best return on investment. These are:
“social energisers” – couples and adult groups looking for excitement, new experiences, and fun, social
getaways to novel destinations;
“culturally curious” – couples or solo travellers with time (and money) to spend;
conference and incentive visitors, whose expenditure is amongst the highest of all visitors and who are
more prone to visit in times when cash flow for Dublin businesses is critical – in the shoulder and off-
seasons;
cruise visitors, who come to Dublin as part of a European cruise;
event visitors, coming to Dublin specifically to attend an event or festival, whether sporting, cultural,
business or any other type of event.
Focusing on these sectors/segments represents a strategic decision to concentrate limited investment cost-
effectively in attracting Dublin’s best prospects, where the greatest return on investment is likely to be
generated. It is also anticipated, in turn, that success in other leisure segments will follow success in the key
sectors, which are typically early adopters of trends.
Under its most ambitious scenario, which assumes full implementation of its proposed strategy, the GDTF
also anticipated overseas visitors to Dublin could grow by as much as 6.8% per annum up to 2020.
“Implementation” in this regard envisages widespread collaboration, with public funding maintained plus
significant new private sector funding, with the funding model sustained throughout the target period, and
with overseas marketing of Dublin repurposed to project the new Dublin destination brand in key markets.
To activate implementation the GDTF proposed an alliance of all stakeholders, taking a sectoral approach, to
take its work forward. The intention was that the strategy document would serve as the template for the
work of what has since become the Grow Dublin Tourism Alliance (GDTA).
Outside of conference and incentive tourism, general corporate travel accounts for a substantial proportion
of visitors to Dublin. In this respect, the general policy to grow Dublin as a location for mobile foreign
investment will be a major contributor to visitor numbers over the next five years. IDA Ireland’s July 2014
Policy Statement on FDI in Ireland focused strongly on attracting new foreign investment into Dublin
highlighting that the role of cities is increasingly important in FDI flows. Its policy to 2020 aims to create
“globally connected city regions as attractors of investment and position Dublin as the leading European
hotbed for start-ups, fast growing firms and talent”.

DUBLIN VISITOR ACCOMMODATION 2015-2020: REPORT TO FÁILTE IRELAND
11
3. Visitor Accommodation – Demand Scenarios
3.1 Introduction
This Section addresses demand for visitor accommodation in Dublin. It begins by profiling existing demand,
using indicators that include paid bednights, occupancy and average daily rates in Dublin hotels. The hotel
sector accounts for around 9 in 10 visitors staying in paid accommodation in the city and is the focus of most
of Section 3.2.
Section 3.3 first considers key macro-economic factors likely to influence the achievement of these medium-
term demand forecasts and targets and then looks briefly at more specific drivers of visitor numbers to
Dublin. Finally, section 3.4 describes a range of future demand scenarios, quantified in terms of visitors and
paid bednights in Dublin up to 2020.
3.2 Existing Market for Visitor Accommodation in Dublin
3.2.1 Bednights, Occupancy and Average Daily Rates in Dublin Hotels
Trends in visitor (paid) bednights in approved accommodation, both for overseas and domestic visitors, are
available for 2013 through to 2015 (projected out-turn). Bednights in approved accommodation in Dublin
amounted to some 9.6 mn in 2015 (Table 3.1).
TABLE 3.1: TRENDS IN OVERSEAS AND DOMESTIC PAID BEDNIGHTS IN DUBLIN 2013-15 (000s)
2013 2014 2015 (e) Total bednights 8,059 8,959 9,585
Note: Estimates refer to paid bednights in approved accommodation only. 2015 full year estimates are 2014 data adjusted upwards, based on latest available overseas and domestic performance.
SOURCE: FÁILTE IRELAND
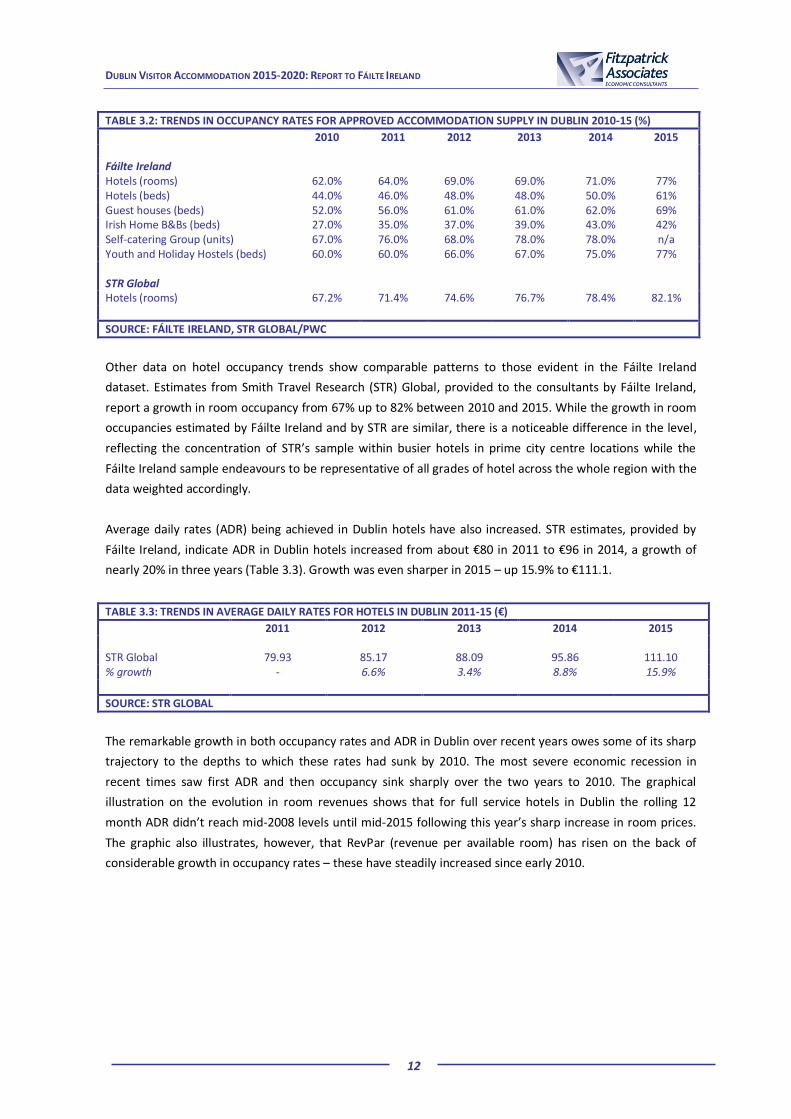
Fáilte Ireland data on occupancy rates in approved accommodation also show a rise across most
accommodation types, over the 2010-15 period. Bed occupancy in hotels has grown from 44% up to 61% in
the period, while room occupancy has grown from 62% to 77% (Table 3.2). Moreover, all other
accommodation types have similarly increased occupancy rates in the period, although the occupancy
increase in guest houses, Irish Home B&Bs and self-catering are partly attributable to the significant decline
in bedspaces available in these accommodation types over the period.
DUBLIN VISITOR ACCOMMODATION 2015-2020: REPORT TO FÁILTE IRELAND
12
TABLE 3.2: TRENDS IN OCCUPANCY RATES FOR APPROVED ACCOMMODATION SUPPLY IN DUBLIN 2010-15 (%)
2010 2011 2012 2013 2014 2015 Fáilte Ireland Hotels (rooms) 62.0% 64.0% 69.0% 69.0% 71.0% 77% Hotels (beds) 44.0% 46.0% 48.0% 48.0% 50.0% 61% Guest houses (beds) 52.0% 56.0% 61.0% 61.0% 62.0% 69% Irish Home B&Bs (beds) 27.0% 35.0% 37.0% 39.0% 43.0% 42% Self-catering Group (units) 67.0% 76.0% 68.0% 78.0% 78.0% n/a Youth and Holiday Hostels (beds) 60.0% 60.0% 66.0% 67.0% 75.0% 77% STR Global Hotels (rooms) 67.2% 71.4% 74.6% 76.7% 78.4% 82.1%
SOURCE: FÁILTE IRELAND, STR GLOBAL/PWC
Other data on hotel occupancy trends show comparable patterns to those evident in the Fáilte Ireland
dataset. Estimates from Smith Travel Research (STR) Global, provided to the consultants by Fáilte Ireland,
report a growth in room occupancy from 67% up to 82% between 2010 and 2015. While the growth in room
occupancies estimated by Fáilte Ireland and by STR are similar, there is a noticeable difference in the level,
reflecting the concentration of STR’s sample within busier hotels in prime city centre locations while the
Fáilte Ireland sample endeavours to be representative of all grades of hotel across the whole region with the
data weighted accordingly.
Average daily rates (ADR) being achieved in Dublin hotels have also increased. STR estimates, provided by
Fáilte Ireland, indicate ADR in Dublin hotels increased from about €80 in 2011 to €96 in 2014, a growth of
nearly 20% in three years (Table 3.3). Growth was even sharper in 2015 – up 15.9% to €111.1.
TABLE 3.3: TRENDS IN AVERAGE DAILY RATES FOR HOTELS IN DUBLIN 2011-15 (€)
2011 2012 2013 2014 2015 STR Global 79.93 85.17 88.09 95.86 111.10 % growth - 6.6% 3.4% 8.8% 15.9%
SOURCE: STR GLOBAL
The remarkable growth in both occupancy rates and ADR in Dublin over recent years owes some of its sharp
trajectory to the depths to which these rates had sunk by 2010. The most severe economic recession in
recent times saw first ADR and then occupancy sink sharply over the two years to 2010. The graphical
illustration on the evolution in room revenues shows that for full service hotels in Dublin the rolling 12
month ADR didn’t reach mid-2008 levels until mid-2015 following this year’s sharp increase in room prices.
The graphic also illustrates, however, that RevPar (revenue per available room) has risen on the back of
considerable growth in occupancy rates – these have steadily increased since early 2010.

DUBLIN VISITOR ACCOMMODATION 2015-2020: REPORT TO FÁILTE IRELAND
13
FIGURE 3.1: EVOLUTION OF ADR AND OCCUPANCY IN DUBLIN HOTELS, 2008-20151
SOURCE: STR GLOBAL
3.2.2 Dublin Hotels in a European Context
STR data (quoted by PWC) indicates the rapid growth experience in Dublin over the 2010-15 period is among
the highest in Europe and exceeds each of Dublin’s main “competitor destinations”. Room occupancy in
Dublin hotels, based on STR data, grew by almost 15 percentage points in the period with only Prague
(increasing by 14 percentage points and from a lower base) experiencing a similar scale of growth. Among
other competitor cities, the next highest growth in occupancy was recorded in Barcelona and Berlin (both at
8 percentage points) with other cities recording growth of 5 percentage points or lower. In addition, Dublin
had the highest level of room occupancy (82%) among competitor cities in 2015, with only Edinburgh
breaking the 80% barrier.
TABLE 3.4: TRENDS IN HOTEL OCCUPANCY RATES IN SELECTED EUROPEAN CITIES 2010-15 (%)
2010 2011 2012 2013 2014 2015
Dublin 67.2% 71.4% 74.6% 76.7% 78.4% 82.1% Prague 61.5% 66.5% 68.3% 69.0% 70.0% 75.0% Barcelona 67.6% 70.5% 71.3% 72.0% 73.0% 75.3% Berlin 68.5% 69.1% 72.5% 72.0% 74.0% 76.4% Amsterdam 73.1% 74.0% 73.9% 76.0% 77.0% 78.1% Brussels 66.9% 67.2% 66.8% 67.0% 69.0% 69.8%
Madrid 64.0% 66.3% 64.0% 62.0% 66.0% 69.3% Edinburgh 77.7% 80.0% 77.2% 80.0% 80.0% 81.4% Vienna 72.2% 71.6% 71.6% 71.0% 72.0% 72.6%
Note: Cities listed are based on the “Tier 2” competitor cities listed in Destination Dublin: A Collective Strategy for Growth to 2020.
SOURCE: PWC EUROPEAN CITIES HOTELS FORECASTS (VARIOUS YEARS)
1 12 Month Moving Average
DUBLIN VISITOR ACCOMMODATION 2015-2020: REPORT TO FÁILTE IRELAND
14
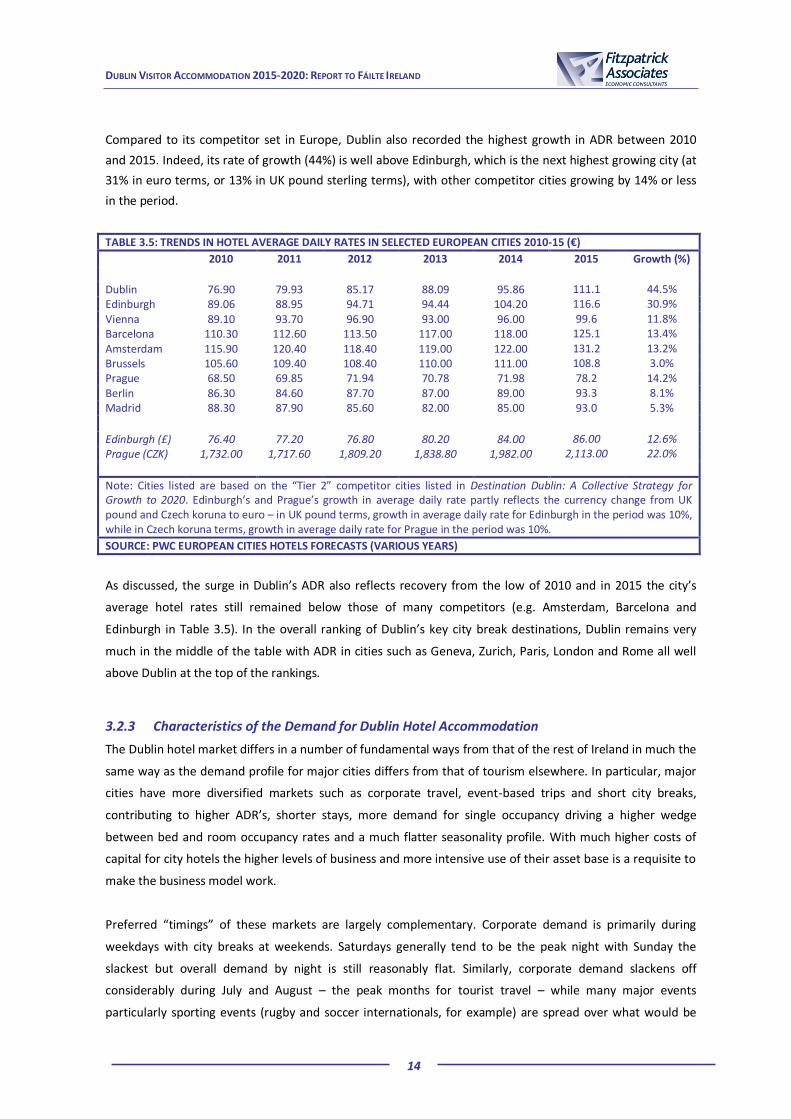
Compared to its competitor set in Europe, Dublin also recorded the highest growth in ADR between 2010
and 2015. Indeed, its rate of growth (44%) is well above Edinburgh, which is the next highest growing city (at
31% in euro terms, or 13% in UK pound sterling terms), with other competitor cities growing by 14% or less
in the period.
TABLE 3.5: TRENDS IN HOTEL AVERAGE DAILY RATES IN SELECTED EUROPEAN CITIES 2010-15 (€)
2010 2011 2012 2013 2014 2015 Growth (%)
Dublin 76.90 79.93 85.17 88.09 95.86 111.1 44.5% Edinburgh 89.06 88.95 94.71 94.44 104.20 116.6 30.9%
Vienna 89.10 93.70 96.90 93.00 96.00 99.6 11.8% Barcelona 110.30 112.60 113.50 117.00 118.00 125.1 13.4%
Amsterdam 115.90 120.40 118.40 119.00 122.00 131.2 13.2% Brussels 105.60 109.40 108.40 110.00 111.00 108.8 3.0% Prague 68.50 69.85 71.94 70.78 71.98 78.2 14.2% Berlin 86.30 84.60 87.70 87.00 89.00 93.3 8.1% Madrid 88.30 87.90 85.60 82.00 85.00 93.0 5.3%
Edinburgh (£) 76.40 77.20 76.80 80.20 84.00 86.00 12.6% Prague (CZK) 1,732.00 1,717.60 1,809.20 1,838.80 1,982.00 2,113.00 22.0%
Note: Cities listed are based on the “Tier 2” competitor cities listed in Destination Dublin: A Collective Strategy for Growth to 2020. Edinburgh’s and Prague’s growth in average daily rate partly reflects the currency change from UK pound and Czech koruna to euro – in UK pound terms, growth in average daily rate for Edinburgh in the period was 10%, while in Czech koruna terms, growth in average daily rate for Prague in the period was 10%.
SOURCE: PWC EUROPEAN CITIES HOTELS FORECASTS (VARIOUS YEARS)
As discussed, the surge in Dublin’s ADR also reflects recovery from the low of 2010 and in 2015 the city’s
average hotel rates still remained below those of many competitors (e.g. Amsterdam, Barcelona and
Edinburgh in Table 3.5). In the overall ranking of Dublin’s key city break destinations, Dublin remains very
much in the middle of the table with ADR in cities such as Geneva, Zurich, Paris, London and Rome all well
above Dublin at the top of the rankings.
3.2.3 Characteristics of the Demand for Dublin Hotel Accommodation
The Dublin hotel market differs in a number of fundamental ways from that of the rest of Ireland in much the
same way as the demand profile for major cities differs from that of tourism elsewhere. In particular, major
cities have more diversified markets such as corporate travel, event-based trips and short city breaks,
contributing to higher ADR’s, shorter stays, more demand for single occupancy driving a higher wedge
between bed and room occupancy rates and a much flatter seasonality profile. With much higher costs of
capital for city hotels the higher levels of business and more intensive use of their asset base is a requisite to
make the business model work.
Preferred “timings” of these markets are largely complementary. Corporate demand is primarily during
weekdays with city breaks at weekends. Saturdays generally tend to be the peak night with Sunday the
slackest but overall demand by night is still reasonably flat. Similarly, corporate demand slackens off
considerably during July and August – the peak months for tourist travel – while many major events
particularly sporting events (rugby and soccer internationals, for example) are spread over what would be

DUBLIN VISITOR ACCOMMODATION 2015-2020: REPORT TO FÁILTE IRELAND
15
regarded as off-season or shoulder based on traditional tourism classifications. Conference Centre Dublin
events and major concerts also tend to be relatively well spread out throughout the season and where these
events occur in the traditional high-season there is generally little scope, or even need, to switch them to
other times of the year. As indicated in Figure 3.2, occupancy rates in the peak summer months are matched
by those in both shoulder periods, and only significantly lower between late October and April.
FIGURE 3.2: MONTHLY DUBLIN HOTEL OCCUPANCY (%)
SOURCE: STR
3.2.4 Demand for Other Accommodation in Dublin
Our analysis of the demand for other types of accommodation in Dublin is largely based on discussions with
key operators in the marketplace and with sectoral representative associations. The caravan and camping
market is largely an outlier with just two operators, although some outside the area also service Dublin. Both
are located well away from the city centre and have a very different demand profile to the other Dublin
accommodation providers. The market is almost completely overseas tourists, is very seasonal, peaking
during the summer when occupancy can often hit 100% but doing very little off-season business. The market
grew in the 1990s but has been fairly stagnant since. With prices at their current level there is very little
prospect of growth in supply and for the purposes of this study further analysis of this sector is not very
relevant.
The hostel sector has become increasingly amorphous in recent years with some budget hotels marketing
themselves on hostel websites. The representative association Independent Holiday Hostels has just seven
members in Dublin and their recent experience has similarities to that described above for the hotel sector
with increasing occupancy in recent years. With little in the way of corporate demand, however, their
demand is more seasonal, averaging just over 70% for 2015 but peaking around 85% to 90% during the high
season.
0%
10%
20%
30%
40%
50%
60%
70%
80%
90%
100%

DUBLIN VISITOR ACCOMMODATION 2015-2020: REPORT TO FÁILTE IRELAND
16
Occupancy in approved guest houses, Irish Home B&Bs and self-catering accommodation have all grown in
recent years. However there is no hard statistical information specifically available on the performance of
Dublin short-stay apartments, but it is likely to have mirrored that of the hotel sector.
3.3 Drivers of Future Demand for Accommodation
3.3.1 Macro-economic drivers of future demand growth
Below we briefly assess the main macro-economic factors likely to affect demand prospects up to 2020.
Economic Growth in Source Markets
Future prospects for GDP growth in the key tourism source markets is likely to impact on outbound travel
from these markets, which will in turn impact on inbound travel to Ireland. Forecasts for GDP growth to
2019, sourced from the International Monetary Fund (IMF), suggest that growth in both the UK and US will
be between 2% and 3% per annum over 2016-19, while growth in the Euro Area will be close to 2% per
annum in the same period. Such economic prospects in key source markets remain relatively positive for
Ireland.
In Ireland itself, IMF forecasts suggest growth of between 2% and 4% per annum between 2016 and 2019.
This may result in continued positive growth in domestic tourism in Ireland, though it will also increase
demand for outbound overseas travel by Irish residents.
TABLE 3.6: PROJECTED GDP GROWTH IN IRELAND AND KEY OVERSEAS TOURISM MARKETS 2016-19 (%)
2016 2017 2018 2019 Ireland 3.8% 3.2% 3.0% 2.7% UK 2.2% 2.2% 2.2% 2.2% US 2.8% 2.8% 2.7% 2.2% Euro Area 1.6% 1.7% 1.6% 1.6% France 1.5% 1.6% 1.7% 1.9% Germany 1.6% 1.5% 1.3% 1.3%
Note: Figures refer to growth in constant prices.
SOURCE: INTERNATIONAL MONETARY FUND – WORLD ECONOMIC OUTLOOK OCTOBER 2015
Exchange Rates, Interest Rates and Inflation
As noted earlier, movements in exchange rates have helped to improve Ireland’s competitiveness as a
tourism destination in recent years. Forecasts from the Organisation for Economic Co-operation and
Development (OECD) and the Central Bank of Ireland suggest that Euro:Dollar exchange rates will continue
to remain broadly similar during 2016 and 2017 as they were in 2015, while Euro:Sterling rates will plateau
following the modest recent strengthening of the euro. At the same time, there can be no guarantees that
exchange rates will continue to trade at such favourable levels for Ireland indefinitely.

DUBLIN VISITOR ACCOMMODATION 2015-2020: REPORT TO FÁILTE IRELAND
17
Interest rates have been very low in recent years, both in Ireland and in its key tourism source markets, due
to the impact of the global financial and economic crisis and the need to stimulate growth. Low interest rates
have a positive impact on consumer spending, all other things being equal, and therefore help to boost
spending on both overseas and domestic tourism. However, given that rates have been at such historically
low levels in recent years, it would appear likely that rates will grow again as economic growth recovers,
particularly in the UK and US, which might affect consumer spending (including tourism). The OECD forecasts
that short-term interest rates in the UK will grow from 0.6% in 2015 up to 2% in 2017, while short-term rates
in the US are predicted to grow from 0.4% up to 1.7% in the same period.
Inflation forecasts up to 2019, provided by the IMF, are outlined in Table 3.7 below. In general, it shows that
inflation growth in Ireland is likely to be on a par with or slightly below the growth in both the UK and US up
to 2019, while being slightly above growth in the Euro Area generally. This would suggest that broadly-
defined inflation trends are unlikely to impact unduly negatively on Ireland’s price competitiveness vis-à-vis
key source markets, though sectoral inflation trends may obviously vary.
TABLE 3.7: PROJECTED INFLATION GROWTH IN IRELAND AND KEY OVERSEAS TOURISM MARKETS 2016-19 (%)
2016 2017 2018 2019 Ireland 1.5% 1.6% 1.7% 1.9% UK 1.5% 2.0% 2.0% 2.0% US 1.1% 1.8% 2.2% 2.3% Euro Area 1.0% 1.3% 1.4% 1.6% France 1.0% 1.1% 1.3% 1.5% Germany 1.2% 1.5% 1.6% 1.8%
SOURCE: INTERNATIONAL MONETARY FUND – WORLD ECONOMIC OUTLOOK APRIL 2015
EU and Euro Area Stability
The Euro Area in general has been subject to considerable instability in recent years, which has in turn had
negative consequences for economic growth. While growth within EU and eurozone economies has now
resumed in many cases, it is certainly the case that potential for further instability exists. In its Autumn 2015
Quarterly Economic Commentary, the Economic and Social Research Institute (ESRI), notes that the ongoing
situation in Greece continues to present downside risks for the Euro Area and wider EU. In this regard,
Greece and its international lenders reached an €85 billion bailout agreement in early August 2015, which
gives Greece some respite after a turbulent year marked by the imposition of capital controls and a three-
week shutdown of its banks. This period saw Greece falling back into a recession, and Greek commercial
banks still continue to operate under very strict capital controls. Furthermore, despite the recent agreement,
the ESRI suggests that it will be difficult to see how Greece will succeed in generating and sustaining a
sufficient surplus from 2018 onwards or how massive debts, set to peak at close to 200 per cent of GDP in
the next two years, will be reduced. Based on this outlook alone, therefore, the potential for further Euro
Area instability remains.
DUBLIN VISITOR ACCOMMODATION 2015-2020: REPORT TO FÁILTE IRELAND
18
Even closer to home the prospect of the UK exiting (Brexit) the European Union presents another threat to
general EU stability with particular consequences for Ireland given the close economic and social ties
between the two countries. There is some uncertainty about the extent to which Brexit would affect Ireland
but the general view is that it would be negative, and its tourism effects would be, at best, uncertain.
External Shocks
Finally, the general economic environment and demand for overseas tourism is always at risk from other
economic or even tourism specific “shocks”, which can weigh down on overseas tourism demand. A recent
example was the impact of the volcanic ash cloud from Iceland, which impacted on overseas tourism
demand to Ireland over 2010 and 2011, due to restrictions imposed on air transport. In a more general
economic context, recent falls in oil prices probably help to promote tourism demand, however any reversal
of price trends would have negative effects.
The Icelandic ash cloud is an example of a shock that can have a very temporary but immediate and deep
impact on visitor numbers. Incidents such as the recent terrorist outrages in Paris and Brussels can have a
similar but specific short-term effect. There is a danger, however, that a series of such events or the
particular characteristics (or social perceptions) can lead to much more lasting impacts e.g. the hijacking of
the Achille Laura cruise ship in 1985 and the video of a disabled US passenger thrown overboard (alongside a
weakening dollar) led to a collapse of the US visitor arrivals in Europe in 1986. Increased security measures
as a result of terrorist activities can also be a barrier to international travel.
The cost of international travel, however, looks unlikely to rise in the foreseeable future. The December 2015
OPEC meeting in Vienna ended without any decisions to curb production despite prices falling to their lowest
level in seven years. The prospect of the return of Iranian oil to international markets and increasing
efficiency of shale producers in the US also point to continued low fuel costs for the travel industry.
Also, in recent months, uncertainty regarding growth in China has been the cause of much concern for the
global economy, with evidence of a slowdown in Chinese economic growth, depreciation in the Chinese
currency (with knock-on effects for its trading partners) and stock market falls. Events that have a significant
negative impact at the global economy level, therefore, will continue to have the potential to impact
negatively on overseas tourism demand too.
3.3.2 Other drivers of demand growth for Dublin accommodation
The number of accommodation providers in Dublin, their marketing and promotional activities and wider
brand marketing campaigns carried out will have an important impact on the level of tourism business
attracted to Dublin over the next five years and beyond. As such the work of the GDTA, among others, of
positioning and promoting the city will be a key factor in the level, and spend, of visitors to the city. There
are, however, a number of other very important drivers from transport facilities to foreign investment that
are also of specific importance to the future of Dublin that are briefly discussed below.

DUBLIN VISITOR ACCOMMODATION 2015-2020: REPORT TO FÁILTE IRELAND
19
Growth in passenger numbers at Dublin airport mirrors the increase in accommodation sales in Dublin with
sharp increases in recent years. The future of tourism in Dublin is closely linked with developments at the
airport (and vice-versa). By end-November 2015, Dublin Airport had already surpassed the record number of
passenger arrivals established in the twelve months of 2008. Some 25 million passengers travelled through
the airport during the full year. The number of airlines servicing Dublin and the number of routes increased
considerably over the last two years and will continue to expand in 2016. In particular, the takeover of Aer
Lingus by International Consolidated Airlines Group (IAG) will see their services expand considerably in 2016
amid talk of the development of Dublin as an IAG hub airport. Dublin Airport Authority (DAA) already have
planning permission for a second runway. The DAA also have planning permission for a 400-bed hotel at
Terminal 2 and, as discussed in the following Chapter, other hotels in the immediate airport catchment area
also have permissions for major expansions in their accommodation stock, suggesting optimism about both
the future of the airport and tourist numbers into Dublin.
Improved transport between the city centre and the airport has been on the agenda for quite a number of
years. The recent coalition government resurrected the Metro North link but assuming it goes ahead it is not
scheduled for completion until 2026. Transport links around the city are a key driver of demand for Dublin
because an easy to understand and efficient system attracts (and helps retain) visitors. It is additionally
important because improved links open up new areas of the city for development of business, in particular
the location of visitor accommodation. The planned extension of the Luas, looping up and around O’Connell
Street, alongside the development of Conference Centre Dublin (CCD) has made that area of the city much
more attractive for visitors stays and hence for hotels to locate. These developments and the location of
supplementary attractions (Croke Park Skywalk, James Joyce Museum and plans for the GPO) have made the
area one of the hotspots for planned hotel development. Hence, in the next Chapter (on accommodation
supply) this area has been designated separately as “Dublin 1 Prime”.
Major conferences and events are also major drivers of demand for accommodation in Dublin - evidence of
the singular impact of the cancellation of the Garth Brookes’ concerts in July 2014 on occupancy and ADRs is
very evident from a cursory examination of the relevant statistics. The increasing importance of the CCD as a
generator of major events is also an important driver of growth and having only opened in September 2010
its contribution to Dublin tourism is still growing and the outlook for CCD events in 2016 is ahead of what
was a relatively strong 2015. Like the airport, the immediate vicinity of the CCD is also a hotspot for planned
additional accommodation including permission for a new hotel at the CCD itself.
In Chapter 2, the contribution of increasing foreign direct investment (FDI) flows into Dublin and IDA
Ireland’s placing of Dublin close to the centre of its strategy for increasing future investment flows into
Ireland was highlighted. The Authority does have a remit for regional development but the reality of the
international FDI market is that major companies, particularly in the service sector, prefer city locations. IDA
Ireland annual reports show the number of investments in Dublin and Cork ranged between 77% and 63% of
the total in the years 2011 to 2014. A recently published paper by the ESRI and Jones Lang LaSalle (JLL)
indicated that 70% of take-up of new office space in Dublin in the first half of 2015 was by FDI enterprises. It
also reported the trend for these companies to expand their requirements considerably shortly after initial

DUBLIN VISITOR ACCOMMODATION 2015-2020: REPORT TO FÁILTE IRELAND
20
establishment – multiples of 12 times initial requirements were indicated for Facebook and Salesforce, 7 for
Amazon and a massive 141 times (to 63,000 m2 over 9 buildings) for Google. The report warned of a
potential shortage of suitable modern office space militating against the growth of FDI over the next few
years.
After a number of fallow years with no construction of new offices, since 2013 the market has been racing to
cater for growing demand for space. Rental rates have doubled over the last three years and vacancy rates
have fallen sharply. The ESRI/JLL study suggests that between new build and refurbishments there was close
to 200,000 m2 of space (about 5% of total office accommodation in Dublin) under construction in 2015. In
contrast to the ESRI/JLL report’s concern about emerging shortages, considerable planned expansion over
the next few years of close to 500,000 m2 have led to predictions in some quarters (e.g. Green REIT) that by
2018 there may be an over-supply of office space. However, for the Dublin accommodation sector, growth in
the supply of office space and subsequent take-up, particularly by FDI-companies, will continue to generate
strong growth in corporate travel and overnight visitors. Indeed, all of the above Dublin-specific drivers
suggest further growth in accommodation demand in 2016 and beyond. However, another consequence of
the growth in construction of new offices is the competitive impact on available sites for new
accommodation development. This is explored in the next Chapter.
3.4 Demand Scenarios for Visitor Accommodation in Dublin
Table 3.8 below outlines four scenarios for growth in overseas, domestic and total visitors and bednights in
Dublin by the year 2020, using the Fáilte Ireland estimates for 2015 as a baseline. The projections are based
on likely demand in approved visitor accommodation in Dublin by 2020. As a basis for deriving scenarios
based on approved accommodation seems reasonable, given the trend of rising occupancy and average daily
rates cited in Section 3.1 above. In turn, this suggests that any shortfall in approved accommodation in
Dublin is not being substituted by unapproved supply.
In each scenario, the same growth rate for domestic visitors and bednights is assumed between 2016 and
2020 – 3% per annum – which is line with Fáilte Ireland projections for domestic visitor growth over the
2016-20 period. Growth rates for overseas visitors and bednights for the same period vary across the four
scenarios, as follows:
under Scenario 1, the lowest of the four scenarios presented, growth over the 2016-20 period is
projected at 2.2% per annum. This projection, while low in comparison to recent years, is in line with
World Tourism Organisation (UNWTO) forecasts for visitor growth in Northern Europe and Western
Europe over the 2010-20 period, and it is consistent with the “do nothing” scenario (re-based to 2015)
outlined in Destination Dublin: A Collective Strategy for Growth to 2020, the report of the GDTF;
under Scenario 2, growth over the 2016-20 period is projected at 2.5% per annum. This scenario is
effectively the annual average growth rate implicit in People, Policy & Place: Growing Tourism to 2025;
under Scenario 3, growth over the 2016-20 period is projected at 4.7% per annum. This scenario is
based on the “mid” growth scenario (re-based to 2015) outlined in Destination Dublin: A Collective
Strategy for Growth to 2020;

DUBLIN VISITOR ACCOMMODATION 2015-2020: REPORT TO FÁILTE IRELAND
21
finally, under Scenario 4, growth over the 2016-20 period is projected at 6.8% per annum. This scenario
is based on the “high” growth scenario (re-based to 2015) outlined in Destination Dublin: A Collective
Strategy for Growth to 2020.
Under the four scenarios, total bednights to Dublin are projected to grow to over 10.5 mn under Scenario 1,
over 10.6 mn under Scenario 2, 11.2 mn under Scenario 3 and over 11.8 mn under Scenario 4.
TABLE 3.8: DEMAND SCENARIOS FOR DUBLIN ACCOMMODATION BY 2020
Scenario 1 – Overseas Growth @
2.2% per Annum 2016-20
(UNWTO Scenario)
Scenario 2 – Overseas Growth @
2.5% per Annum 2016-20
(People, Policy & Place Scenario)
Scenario 3 – Overseas Growth @
4.7% per Annum 2016-20
(Destination Dublin Mid-Growth
Scenario)
Scenario 4 – Overseas Growth @
6.8% per Annum 2016-20
(Destination Dublin High-Growth
Scenario) Overseas Visitors (mn) 5.20 5.28 5.87 6.47 Paid bednights (mn) 5.46 5.54 6.16 6.80 Domestic Visitors (mn) 1.60 1.60 1.60 1.60 Paid bednights (mn) 5.05 5.05 5.05 5.05 TOTAL Visitors (mn) 6.80 6.88 7.47 8.08 Paid bednights (mn) 10.51 10.59 11.21 11.86
Note. Figures may not add due to rounding
SOURCE: FITZPATRICK ASSOCIATES ESTIMATES

DUBLIN VISITOR ACCOMMODATION 2015-2020: REPORT TO FÁILTE IRELAND
22
4. Visitor Accommodation – Supply Trends and Prospects
4.1 Introduction
This Section addresses accommodation supply. Section 4.2 begins by describing the current stock of paid
accommodation, and recent trends therein. Section 4.3 addresses future prospects in approved
accommodation supply, and presents our findings in relation to anticipated additions to the supply stock up
to 2020. Section 4.4 describes factors most affecting new supply in the current Dublin context.
4.2 Current Supply of Visitor Accommodation in Dublin
4.2.1 Approved Accommodation
A total of 148 hotels were registered with Fáilte Ireland at the end of 2015. Table 4.1 shows their breakdown
in respect of classification and broad location in Dublin. In terms of hotel classification, Dublin is dominated
by 4 Star (almost 46% of bedspaces), and 3 Star (41% of bedspaces), while in terms of location, Dublin 2 and
4 account for some 35% of bedspaces with quite an even spread across other parts of the city centre, the
airport vicinity and other suburban locations.
There were some 29 registered guest houses in 2015, and the register indicates:
approximately one third are classified as 4 Star, another third 3 Star, and the final third either 1 or 2
Star;
4 Star properties are in the main located in Dublin 2 or 4, while 3 Star properties extend into other
areas of the city centre and suburbs, and 2 and 1 Star properties are concentrated mainly in Dublin 1.
There were 68 Irish Home B&B establishments approved in 2015. Of these:
approximately 13% were classified 4 Star, 71% 3 Star, and 16% “approved”;
relatively few are located in the city centre. Dun Laoghaire, Malahide, Skerries, Howth, Portmarnock,
Swords, Rathcoole, and some locations closer to the city (e.g. Dublin 3, 5, 6 and 9) dominate among
their locations around Dublin.
There were 13 listed self-catering properties and just 4 group self-catering properties approved in Dublin in
2015, together accounting for a negligible proportion of bedspace capacity in the city. Predominantly 3 or 4
Star in classification, their locations cover many parts of the city and suburbs.
There were 17 approved youth and holiday hostels with Dublin 1, 2 and 7 the dominant locations. There
were just two approved caravan and camping outlets in 2015 – at Lusk and the Naas Road.

DUBLIN VISITOR ACCOMMODATION 2015-2020: REPORT TO FÁILTE IRELAND
23
TABLE 4.1 BREAKDOWN OF 2015 HOTEL STOCK BY CLASSIFICATION AND LOCATION
Classification Location Number Bedspaces % of
Hotels % of
Bedspaces
5 Star Total 11 3,485 7.4% 8.3%
..of which
Dublin 2 and 4 10 3,155 6.8% 7.5%
Other 1 330 0.7% 0.8%
4 Star Total 47 19,378 31.8% 46.3%
..of which
Dublin 2 and 4 16 6,037 10.8% 14.4%
Dublin 1 5 2,128 3.4% 5.1%
Dublin 8 3 1,108 2.0% 2.6%
Dublin 9 and 17, Airport, Swords 6 2,812 4.1% 6.7%
Other 17 7,293 11.5% 17.4%
3 Star Total 66 17,245 44.6% 41.2%
..of which
Dublin 2 and 4 25 5,068 16.9% 12.1%
Dublin 1 11 3,631 7.4% 8.7%
Dublin 8 2 360 1.4% 0.9%
Dublin 9 and 17, Airport, Swords 11 3,559 7.4% 8.5%
Other 17 4,627 11.5% 11.1%
2 Star Total 20 1,549 13.5% 3.7%
..of which
Dublin 2 and 4 7 425 4.7% 1.0%
Dublin 1 7 609 4.7% 1.5%
Dublin 8 - - 0.0% 0.0%
Dublin 9 and 17, Airport, Swords 2 58 1.4% 0.1%
Other 4 457 2.7% 1.1%
1 Star Total 4 159 2.7% 0.4%
..of which
Dublin 2 and 4 - - 0.0% 0.0%
Dublin 1 3 142 2.0% 0.3%
Dublin 8 - - 0.0% 0.0%
Dublin 9 and 17, Airport, Swords - - 0.0% 0.0%
Other 1 17 0.7% 0.0%
Total
148 41,816 100.0% 100.0%
SOURCE: FÁILTE IRELAND
The general trend since 2010 is of very moderate and intermittent decline up to 2014 followed by a very
moderate increase in 2015. Bedspaces available in approved hotel accommodation account for by far the
largest share of spaces, being equivalent to 87% of all approved accommodation in 2015, and hotels have
consistently maintained this share of accommodation supply throughout the 2010-15 period.

DUBLIN VISITOR ACCOMMODATION 2015-2020: REPORT TO FÁILTE IRELAND
24
TABLE 4.2: TRENDS IN REGISTERED ACCOMMODATION SUPPLY – BEDSPACES – IN DUBLIN 2010-15 (000s)
2010 2011 2012 2013 2014 2015 Hotels 44,929 43,845 43,207 43,004 41,065 41,816 Guest houses 1,459 1,376 1,410 1,316 1,235 1,262 Irish Home B&Bs 1,117 1,010 902 770 700 614 Listed self-catering* 207 165 151 112 110 99 Group self-catering* 252 252 252 252 200 193 Youth and Holiday Hostels 2,776 2,402 2,527 3,055 3,241 3,039 Caravan and camping* 500 730 730 730 1,150 1,150 TOTAL 51,240 49,779 49,179 49,239 47,701 48,173
* Bedspaces estimated up to 2014
SOURCE: FÁILTE IRELAND
The observable trends over the period for different accommodation types have been quite varied:
hotel bedspaces have declined over the full period, but showed very moderate growth in 2015;
bedspaces in guest houses have generally been in decline, although not in every year;
bedspaces in Irish Home B&Bs have shown consistent decline, and quite significantly so, with 2015
capacity just 55% of its 2010 level;
capacity in both listed and group self-catering have also shown general decline, quite dramatically in
the case of the former;
hostel bedspace capacity has increased as well as decreased in different years over the period, but
was 10% higher in 2015 than in 2010.
In addition to the above categories of approved accommodation, Fáilte Ireland has recently introduced the
Fáilte Ireland Welcome Standard, which provides scope for official recognition of forms of accommodation
that do not conform to the standard types within the established quality assurance framework. While this
standard was only launched in June 2015, the sector is growing and is expected to expand and consolidate in
the short to medium term.
4.2.2 Informal/Other Visitor Accommodation
Unapproved accommodation includes accommodation in categories for which there is no formal regulations,
registration requirements or quality standards governing, such as informal hosting, student accommodation
that may be provided for tourists on occasion, or short-stay apartments. It also arises where new forms of
conventional categories (e.g. hostels) are not approved for a variety of reasons. In both cases reliable
estimates of the supply these provide additional to approved supply are not possible to make, due to both a
lack of aggregated data as well as uncertainty about the extent of overlap with approved supply. However
here we describe findings regarding Airbnb and student accommodation.
In consultations for this study, Airbnb has provided indicative information about its activities in Dublin over
recent years in a number of respects:
its number of active hosts:

DUBLIN VISITOR ACCOMMODATION 2015-2020: REPORT TO FÁILTE IRELAND
25
the number of bedrooms offered by active hosts;
the extent of availability of this accommodation;
the general type of accommodation offered by hosts in Dublin; and
occupancy levels, in terms of days host accommodation is typically booked per year.
Table 4.3 provides data on indicative levels of active hosts and the bedrooms they provide in aggregate for
Dublin in recent years.
TABLE 4.3: AIRBNB – ACTIVE HOSTS AND BEDROOMS IN DUBLIN 2013-2015
2013 2014 2015 (Jan-Oct)
No. of Active Hosts in Dublin (Range) 250-500 500-1,300 1,300-2,200
No. of Bedrooms (Range) 500-830 830-2,300 2,300-4,000
Note: Range is from the minimum to the maximum number on any given day throughout the period
SOURCE: AIRBNB
Beyond these statistics, Airbnb has also indicated that:
in terms of availability, at any time between 35% and 65% of this accommodation is available for
booking, and that this range has been quite consistent over time;
approximately 55% of the accommodation is provided as private rooms in shared dwellings, while
45% is provided as entire homes; and
in 2015, host accommodation in Dublin has been booked for between 30 and 50 days per year (thus
far).
To put this level of provision into context, it can be very simply compared to hotel “capacity” as follows:
in 2014 there were estimated to be between 830 and 2,300 bedrooms offered by active Airbnb hosts.
The mid-point of this range is 1,565 bedrooms;
at any time between 35% and 65% of these were available. Again, taking a mid-point, for illustration
this can be simplified to suggest that the capacity was available approximately 50% of the time
throughout the year;
in terms of basic bedroom nights, this is equivalent to 782.5 bedrooms being fully available
throughout the year;
in sheer capacity terms (i.e. bedroom nights) the Airbnb “capacity” therefore available in 2014 was
equivalent to a 782 bedroom hotel open throughout the year, or just under four 200 room (i.e. mid-
size) hotels2.
2 It is worth noting that seasonal variation will affect this average – as Airbnb accommodation is predominantly aimed at pure tourists
rather than corporate visitors it is likely to be much stronger during peak periods than in the traditional off-season months.

DUBLIN VISITOR ACCOMMODATION 2015-2020: REPORT TO FÁILTE IRELAND
26
Student accommodation is generally not considered when analysing tourism accommodation and Fáilte
Ireland does not have data on bedspaces. By definition for most of the year it is used by students rather than
tourists. Traditionally, much of it is controlled by third level institutions and is targeted during the summer
period at academic conferences and visitors on study-related visits. Even the private sector providers of
student accommodation blocks that sell space during the summer holidays do so to education-related clients
such as visiting language students. Despite this, in the context of this report, which is looking at the capacity
of the Dublin accommodation sector to cope with growing demand for beds over a number of years when
supply may be unable to keep pace, the rapid growth in availability of tailored student accommodation is
worth mentioning. However its potential contribution may be limited by virtue of its non-suitability for
quality assurance, as well as its very seasonal and short period of availability in a context where Dublin’s
tourism and visitor demand is open to only limited seasonal influence relative to elsewhere in the country.
4.3 Future Prospects in Approved Accommodation Supply
4.3.1 Hotels
Through researching planning lists, public, corporate and press announcements, and our consultations with
hoteliers, banks, and professional advisors, we have compiled what we consider a comprehensive dataset of
prospective hotel developments and extensions that in aggregate number some 80 individual projects in
prospect in Dublin city and county. For each project we have considered its planning status and history, and
gathered market perspectives and insights regarding likelihood of proceeding, likely timing, and the addition
to room capacity generated if completed.
Any analysis of the dataset discussed below needs to be clear that this is a snapshot taken of the prospective
pipeline as of late March 2016. The overall picture is very fluid with projections changing from week to week,
mostly in an upward direction over recent months when a number of new potential projects were added as
investors took note of the ongoing growth, and brighter prospects for, the Dublin hotel sector3. Since the list
was first compiled in September 2015 there have also been reductions as some investors switch to other
possible uses and some projects are knocked back, usually with reduced room numbers, by planning
decisions.
Of the 80 hotel projects identified, 15 are considered unlikely to be completed, at least within the timeframe
of this study (up to 2020). The reasons are mixed, and include their speculative nature, planning challenges,
withdrawn applications etc.
The remaining 65 are considered likely to be completed within the timeframe under review.
3 In addition, hotels mooted at the Guinness Storehouse and at the Digital Hub may be added to this mix over the next few months as
plans for them take shape but they are not included at all in the current dataset nor has any assumptions been made about the future of
the existing Tara Hotel.
DUBLIN VISITOR ACCOMMODATION 2015-2020: REPORT TO FÁILTE IRELAND
27
Overall, including those we expect not to go ahead, or to arrive after the 2020 deadline, there are an
estimated 8,714 rooms. Across the projects considered likely to be completed and operational by end-2020,
there is a combined capacity of some 5,545 hotel bedrooms, made up of 3,796 (68%) in new hotels, and
1,749 (32%) in extensions to existing hotels.
Among the most significant new hotels in the planning pipeline are:
a facility at Dublin Airport (Terminal 2) with up to 400 bedrooms;
a hotel at the Convention Centre with approximately 300 bedrooms;
a hotel at the Coombe with c.260 bedrooms; and
projects of a scale close to 200 bedrooms at Bow Lane, Charlemont St, O’Connell St, Mill St, and
Spencer Dock.
Among the more significant hotel extensions in prospect are:
200 new bedrooms at the Clayton Hotel at Dublin Airport;
142 new bedrooms at the Gresham Hotel on O’Connell St;
146 new bedrooms at the Radisson Blu at Dublin Airport;
140 new bedrooms at the Red Cow Hotel;
112 new bedrooms at the Hilton Charlemont;
85 new bedrooms at Jury’s Custom House;
80 new bedrooms at the North Star Hotel on Amiens St;
75 new bedrooms at the Camden Court Hotel on Camden Street.
Of the total new hotel bedroom capacity in prospect by 2020, the classification mix is projected as follows:
66 rooms will be in 5 Star hotels;
3,163 rooms in 4 Star hotels; and
2,316 rooms in 3 Star hotels.
The likely timing of this new capacity becoming operational is shown in Figure 4.1. It can be seen that the
bulk of the new capacity is not expected until the years 2018-2020, with much more modest new capacity
expected to operationalise in 2016 or 2017.

DUBLIN VISITOR ACCOMMODATION 2015-2020: REPORT TO FÁILTE IRELAND
28
FIGURE 4.1 EXPECTED NEW HOTEL BEDROOM CAPACITY
SOURCE: FITZPATRICK ASSOCIATES ESTIMATES
Figure 4.2 indicates the location mix of the new hotel capacity anticipated (as between Dublin 2 and 4,
Dublin 1 “Prime” (meaning the Docklands and around the immediate retail and business area around or
proximate to O’Connell Street), other parts of Dublin 1 or Dublin 8, the general airport vicinity, or other
locations).
FIGURE 4.2 LOCATION OF NEW HOTEL BEDROOM CAPACITY
SOURCE: FITZPATRICK ASSOCIATES ESTIMATES
Finally, there is the prospect of some existing hotel capacity reduction in the city. The redevelopment of the
site of the Ballsbridge and Clyde Court Hotels in Ballsbridge is the single significant example currently known,
0
500
1,000
1,500
2,000
2,500
2016 2017 2018 2019 2020
0
200
400
600
800
1,000
1,200
1,400
1,600
1,800
2,000
D2 and D4 D1 Prime D1 and D8 Airport Remainder

DUBLIN VISITOR ACCOMMODATION 2015-2020: REPORT TO FÁILTE IRELAND
29
where there is the prospect of a net reduction of approximately 430 rooms, based on the proposal to have a
152-room hotel developed under the wider scheme.
4.3.2 Other Approved Accommodation
As of March 2016, there were two planning permissions for new hostels and six for new short-stay
apartment complexes lodged with Dublin local authorities. As such, the hostel sector is likely to make very
little contribution to the overall growth of Dublin accommodation stock over the next five years. Of the total
of 160 hostel bedspaces we expect 131 (all within Dublin 2 and 4) to come on stream over the 2016-2020
period4.
The number of units in short-stay apartments recorded across the six planning permissions is 765 but we do
not expect two of the larger applications – for 200 and for 127 apartments – to go ahead. They were refused
planning, have not yet been re-lodged and we have taken the view they will not be completed within the
time frame. Thus, we estimate an additional 438 short-stay apartment units to come on-stream by 2020 with
264 of these in 2019, 95 in 2018 and the remaining 79 in 2017. Of these 130 are planned for Dublin 1 and 8,
264 for Dublin 2 and 4, and 44 elsewhere in south Dublin.
Research suggests there is a pipeline of new student accommodation in the order of 5,500 bedrooms in
planning or design for Dublin over the period to 2020, most of which is earmarked for the city centre,
although largely outside the prime central business district. Timing wise, the Ziggurat will be available in
2016, but the remainder will not be on-stream until the middle to end of the 2016-2020 timeframe. The view
among parties consulted is that a proportion of this new accommodation would not only be suitable for non-
student commercial use by tourists and other visitors during the summer months (outside college terms), but
will be developed and promoted specifically so as be used as such.
For example, international providers such as Ziggurat and THSC will offer their accommodation to general
tourists during the summer months (this is the case in Edinburgh, for example). They can transfer from
standard student residential units for about ten weeks during the summer holidays with two weeks allocated
for cleaning and changeover, leaving 40 weeks as normal student residences. While this alternative type of
accommodation is not directly suitable for much of the current demand for accommodation in Dublin, it can
provide an overflow valve for certain visitors during the summer months. On the assumption that the
operators try to maximise use of their resources they are likely to also market themselves to attract
additional visitors to Dublin.
4 A number of key informants in the Dublin hostel sector suspected a 500 bed hostel is planned in Dublin 2 but our research found no
confirmation of this.
DUBLIN VISITOR ACCOMMODATION 2015-2020: REPORT TO FÁILTE IRELAND
30
4.4 Factors Affecting Supply
Core determinants of supply in the paid visitor accommodation market in Dublin mirror supply determinants
in other markets, and typically revolve around a combination of prospective profitability, costs, other input
availability, market access, finance, risks and entrepreneurial enthusiasm. From our research and
consultations a number of key issues are affecting supply of visitor accommodation in the current context in
Dublin, some of which relate to these more general considerations and some being quite context-specific.
Property Market Issues
A universally-held view amongst consultees and commentators is that in the current Dublin property market,
investment returns from hotel development in prime city centre sites cannot currently compete with those
achievable from other forms of development, primarily offices, residential and increasingly student
accommodation. Over the very recent past the general commercial and investment property market in the
city has been characterised by record levels of investment transactions, strongly appreciating asset values,
and a widening base of national and international investors and funding sources, following substantial de-
leveraging of commercial real estate by NAMA and Irish and non-Irish banks. Office development has been to
the forefront in this market buoyancy, where very robust demand for modern office space, particularly in the
central business district, occurred against a backdrop of very little new supply since the recession took hold
over six years ago. Rental growth and lease prospects and terms now make office development the most
attractive option for owners of lands zoned for commercial development. While residential development
competes less directly due to its zoning distinction, student accommodation is now an attractive
development opportunity given the sharp imbalance between demand and supply, and numerous projects
are in the pipeline.
The result for prospective hotel developers is that sites owned promise a greater and more certain return
from alternative forms, which can then attract greater levels of external funding on more cost efficient and
flexible terms. Alternatively where sites are acquired their value for other purposes and hence acquisition
cost for prospective hoteliers, renders hotel development significantly less feasible than otherwise. While a
number of major international hotel brands have moved into Dublin since the turn of the century, the city’s
hotel sector has a relatively low proportion of such hotels. The dearth of available sites has been one
obstacle stymying recent attempts to enter the market.
These factors can be seen in the location breakdown of new hotel capacity in planning, where much is being
pushed outside the prime central business district into areas such as Dublin 1 and Dublin 8, even though the
former is preferential for hoteliers and visitors alike. Similarly, from the point of view of hotel investors, the
existing costs of building hotels in central locations are extremely high when site costs are included, and this
makes the prospect of acquiring existing hotels significantly more economic than developing new ones, and
there are numerous examples where it is evidently the preferred option for such investors.
High site costs are also influencing the types of new hotels being built. New builds are more likely to be 3
Star budget-type hotels with limited services as the new enterprises try to maximise room numbers on their

DUBLIN VISITOR ACCOMMODATION 2015-2020: REPORT TO FÁILTE IRELAND
31
sites. Regulations on room sizes which are generally quite generous by European standards put a limit on the
extent to which prospective hoteliers can intensify the use of the available footprints, as do the height
restrictions which apply to most of central Dublin. Compared to many major European capitals, Dublin has
quite a low number of hotels relative to its population and its GDP and a fairly small average size of hotel.
Investment Finance
While there is widespread evidence and recognition of improvements in the markets for development
finance for hotels in the city (both debt and equity) since their retreat in this and wider commercial funding
markets following the economic crash, there are widely held views that:
the almost complete lack of lending by Irish financial institutions between 2010 and 2012 stymied all
construction in Dublin in those years;
from the lender’s perspective, funding for city centre commercial real estate is much more
attractive and low-risk for office than hotel development;
over the last few years the banking sector has begun to lend to the hotel sector again but this has
often been on terms that would still make new development difficult to finance with challenging
conditions (particularly for new buildings) whether in lending margins, loan-to-value and loan-to-
cost ratios, debt/equity requirements, or project-related criteria. With low LTVs from the traditional
banks, many prospective developers of new hotels are left with a funding gap to be filled by high
margin international specialist funds, by seeking funds from the market (e.g. Dalata), or the
postponement/abandonment of their plans.
With hotels reeling from the recession at the end of the 2000s and the difficulties finding suitable finance in
the first half of the 2010s the Dublin hotel sector has effectively seen no investment over the last eight years
and with so little in the pipeline for 2016 and 2017, the sector will effectively have experienced a decade
with little net addition to its room stock. This dearth of additions to the supply base is at the core of the
current concern over the lack of hotel rooms to cater for the recent resurgence in demand.
For existing operators seeking to expand their premises, finance was very difficult to source in the 2012 to
2013 period. For some there was, and still remain, legacy debts arising from investments during the 2000s.
Additionally, years of relatively low to non-existent operational profits made it difficult to provide robust
projections of EBITA5 growth to satisfy prospective financiers and relatively low hotel valuations constrained
the use of their existing assets as leverage. More recently, however, hotel values have appreciated and
profits have increased making it easier to access funds for refurbishment and extensions. Thus, quite a lot of
existing hotels are now in expansionary mode and finance is less of a problem than it is for new operators.
On the other hand, some major investments in new facilities are being delayed or postponed because the
disruption caused by construction activity, and possible temporary loss of rooms, has to be balanced against
loss of business at a time when RevPar is at an historical high.
5 Earnings before interest, tax and amortisation
DUBLIN VISITOR ACCOMMODATION 2015-2020: REPORT TO FÁILTE IRELAND
32
Profitability
While RevPar and other income streams are critical determinants of hotel and other accommodation
profitability, they are only one side of the rate of return calculation. There are very significant supply-side
determinants of future profitability that also need to be taken into account:
development cost, including site cost, construction cost (driven largely by design specification, which
in turn is closely linked to grading and quality assurance obligations), development contributions,
taxes on construction, etc.;
operational costs, particularly labour costs in a traditionally labour-intensive sector, but also debt
servicing, utilities, marketing, insurance, supplies, management or franchise fees, property
taxes/commercial rates, and indirect taxes, etc. Movements in these costs have been benign to
neutral in recent years with one glaring exception, namely commission costs. These rates have risen
very sharply as hoteliers increasingly rely on online travel agencies (e.g. Expedia) and the global
distribution system for their bookings – in a recent presentation in Dublin, CBRE’s UK Hotel Division
estimated that commission costs had risen from 1% of revenues in 2000 to 8% by 2015 and this cost is
likely to grow even higher for smaller independent (and new) operators heavily reliant on third-party
booking sites.
With profitability recovering steadily in recent years among Dublin hotels, and accelerating in 2015 on the
back of the increase in RevPar, new hotel development and capacity will depend on investors’ expectations
about all of these supply costs and their speed of appreciation. Site cost growth and potential construction
cost inflation in Dublin will also affect profitability forecasts. With the expected increase in construction
activity in Dublin in the coming years, building costs are likely to rise even higher over the 2016-20
timeframe.
Lead Times
The time typically required for a new hotel to come to the market is widely considered a supply constraint in
Dublin, given its effect on both cost and risk. Industry consultations suggest from conception to completion
can range from no less than 1.5 years to more than four (and perhaps 5 or more), with “typical” projects
closer to the latter than the former. Figure 4.3 illustrates typical elapsed periods that can apply, however the
conditions that would allow the speediest of developments (e.g. site ownership, simple, standardised design,
planning efficiency and lack of objection/appeal, development and operational contractual certainty, and a
lack of unforeseen delays at all other stages) are generally felt to be so rare as to be irrelevant.
Long lead times are a general feature of development in Dublin city centre however and not one particularly
unique to hotel development. While some phases may be somewhat shorter (e.g. funding and design) for
office development, the overall period is not likely to be appreciably shorter on average. Furthermore there
is no implication that lead times in Dublin are unduly lengthy relative to international norms – rather that
lead times as they are necessarily increase uncertainty, risk and cost.

DUBLIN VISITOR ACCOMMODATION 2015-2020: REPORT TO FÁILTE IRELAND
33
FIGURE 4.3 ESTIMATED LEAD TIMES FOR NEW HOTEL DEVELOPMENT IN DUBLIN (FROM CONCEPTION IN ELAPSED MONTHS)
SOURCE: FITZPATRICK ASSOCIATES ESTIMATES
Risks/Uncertainty
Finally, the degree of risk and uncertainty attaching to all of the above supply-side factors is itself a critical
determinant of development appetite and activity. Where any of the major phases or processes have great
uncertainty surrounding them (e.g. financing, site acquisition, planning, construction, management
contracting, etc.), whether in relation to their likely success, speed or cost, the prospects for development
proposals are weakened.
4.5 Factors Affecting Development Amongst Projects with Planning Approval
In addition to the general supply side considerations outlined above, there are a few specific reasons why
some visitor accommodation projects with full planning permission have yet to proceed to construction
stage. These reasons include:
revisions to the Dublin Development Plan: Following publication of the Draft Dublin City
Development Plan 2016-2022, some project promoters are reviewing their plans to see if
anticipated changes in the maximum allowable height will enable them to add to the number of
storeys and use their site more intensively, thereby generating more revenue from the same
footprint;
revisions to Visitor Accommodation Regulations: One of the actions in The Tourism Action Plan
2015-2018 called for a review of the regulations governing visitor accommodation to address
changing market needs. Any expected changes in regulations which could allow for more site
0 12 24 36 48 60
Most Efficient Schedule, No Delays
Efficient Schedule, Few Delays
Mid-Range Schedule
Extended Schedule
Site Acquisition Design, Financing Planning Contracting Construction

DUBLIN VISITOR ACCOMMODATION 2015-2020: REPORT TO FÁILTE IRELAND
34
intensification is likely to cause project promoters to delay project activation as they wait to see if
more revenue could be generated from the same site footprint;
multiple planning applications: In some cases project promoters submit more than one planning
application for a given site so as to allow them to keep their options open;
some existing hotels are delaying the construction of additional rooms to avoid disrupting their
existing business at a time when RevPAR is hitting unprecedented heights, and hotels that would
temporarily need to reduce room availability to extend their premises are particularly reluctant; and
finally, as also highlighted above, some new builds are finding it difficult to secure sufficient finance
to fund construction (e.g. because of lower than anticipated LTVs (loan-to-values) ratios.
DUBLIN VISITOR ACCOMMODATION 2015-2020: REPORT TO FÁILTE IRELAND
35
5. Conclusions and Policy Responses
5.1 Overall Conclusions
The Current Stock of Visitor Accommodation
The stock of visitor accommodation in Dublin is described in Section 4.2. It comprises accommodation
approved with Fáilte Ireland (hotels, guest houses, Irish Home B&Bs, self-catering, youth and holiday hostels,
caravan and camping and other forms approved under the Fáilte Ireland “Welcome” standard), as well as
other types of unapproved accommodation sold or made available to paying visitors (short-stay apartments,
private hosts using sites such as Airbnb, providers of student accommodation selling rooms out of the
academic term, etc.).
Approved accommodation in Dublin is dominated by hotels, of which there were 148 in 2015, providing
some 41,816 bedspaces (in 18,531 bedrooms). The hotel stock is predominantly in the 3-Star and 4-Star
classification (together they account for 87% of bedspaces), while most of the remainder are in the 5-Star
category.
Most non-hotel approved accommodation is provided by Youth and Holiday hostels (6% of approved
bedspaces in the city), followed by Guest houses, and caravan and camping sites. Approved Irish Home B&Bs
and self-catering providers supply less than 1% each of the total approved bedspace supply in the city.
Reliable data on the non-approved stock is not available. Data from Airbnb suggest its capacity contribution
in 2014 was equivalent to approximately 780 hotel bedrooms available year-round, however stock provided
via its online platform is more variable and complex to measure, while it is impossible to estimate the extent
of overlap with approved accommodation. Short-stay and serviced apartments are also present and probably
increasing in number, but their current stock is not known precisely. Similarly, some student accommodation
is made available to non-student visitors in periods out of student academic terms, and this is likely to
increase, however its extent and the resulting visitor accommodation stock it represents is not possible to
estimate currently.
The Pipeline of Additional Visitor Accommodation
Through researching planning lists, public, corporate and press announcements, and our consultations with
hoteliers, banks, and professional advisors, we estimate that there is a combined capacity of some 5,545
additional hotel bedrooms in the pipeline for Dublin likely to come on-stream between 2016 and 2020, 3,796
in new hotels and 1,749 in extensions to existing hotels (see Section 4.3). It should be noted however that
this is a snapshot taken of the prospective pipeline as of late March 2016, and that the overall picture is very
fluid with projections changing from week to week, with new projects added, existing ones becoming
unlikely or clearly abandoned, or the likely scale of projects changing, due to planning decisions or other
factors.

DUBLIN VISITOR ACCOMMODATION 2015-2020: REPORT TO FÁILTE IRELAND
36
There is also the prospect of some existing hotel capacity being removed, most notably in Ballsbridge, where
the proposed redevelopment of the Ballsbridge and Clyde Court (closed since January 2016) hotel sites
(under “Project Trinity”), is likely to result in a net reduction of some 430 hotel bedrooms on the overall site.
Our research does not indicate any significant increase in the accommodation stock from other approved
sectors (guest houses, youth and holiday hostels, etc.). However we expect some 438 additional bedrooms in
short-stay apartments to come on stream between now and 2020. The prospect of some 5,500 bedrooms in
student accommodation is also likely but of limited contribution due to its primary function.
Options to develop non-traditional hotel style accommodation could be considered by developing buildings
or using existing buildings with different size and style of rooms. This could potentially be Fáilte Ireland
approved but not under the current hotel sector registration.
Scale of Additional Accommodation Required to meet Demand
Section 3.4 presents four scenarios for demand for visitor accommodation in Dublin up to 2020. The
evolution of accommodation demand , along with the expected evolution of accommodation supply that the
existing stock and estimated pipeline would together provide (hotel and short-stay apartment additional
capacity net of expected capacity reductions), are shown below, along with the resulting number of paid
bednights per available bedspace (a measure of the demand/supply ratio resulting each year).
TABLE 5.1 DUBLIN VISITOR ACCOMMODATION SUPPLY AND DEMAND TRENDS AND OUTLOOK
2015 2016 2017 2018 2019 2020
Demand Scenarios (Bednights, mn) Scenario 1 9.59 9.89 10.02 10.18 10.34 10.51
Scenario 2 9.59 9.90 10.05 10.23 10.41 10.59
Scenario 3 9.59 10.01 10.28 10.58 10.89 11.21
Scenario 4 9.59 10.12 10.51 10.94 11.38 11.86
Supply Forecast (Bedspaces) 48,173 48,554 49,493 52,463 58,102 60,372
Paid Bednights per Available Bedspace Scenario 1 199.0 203.6 202.5 194.1 178.0 174.1
Scenario 2 199.0 203.9 203.1 195.0 179.1 175.5
Scenario 3 199.0 206.2 207.8 201.7 187.5 185.7
Scenario 4 199.0 208.4 212.3 208.4 195.9 196.4
SOURCE: FITZPATRICK ASSOCIATES
From a tourism policy perspective, the optimum growth in accommodation supply depends on the bednight
per bedspace ratio deemed optimal for any given level of demand (i.e. the supply/demand ratio). In Section
3.2.1 it was shown that the dramatic growth in both occupancy rates and ADR in Dublin over recent years
owes some of its strength to the depths to which these rates had sunk by 2010, and that average daily rates
have only recently recovered to 2008 levels, and done so at higher levels of occupancy than were achieved
then. Similarly, growth in daily rates has brought Dublin to a mid-table position among competitor city break
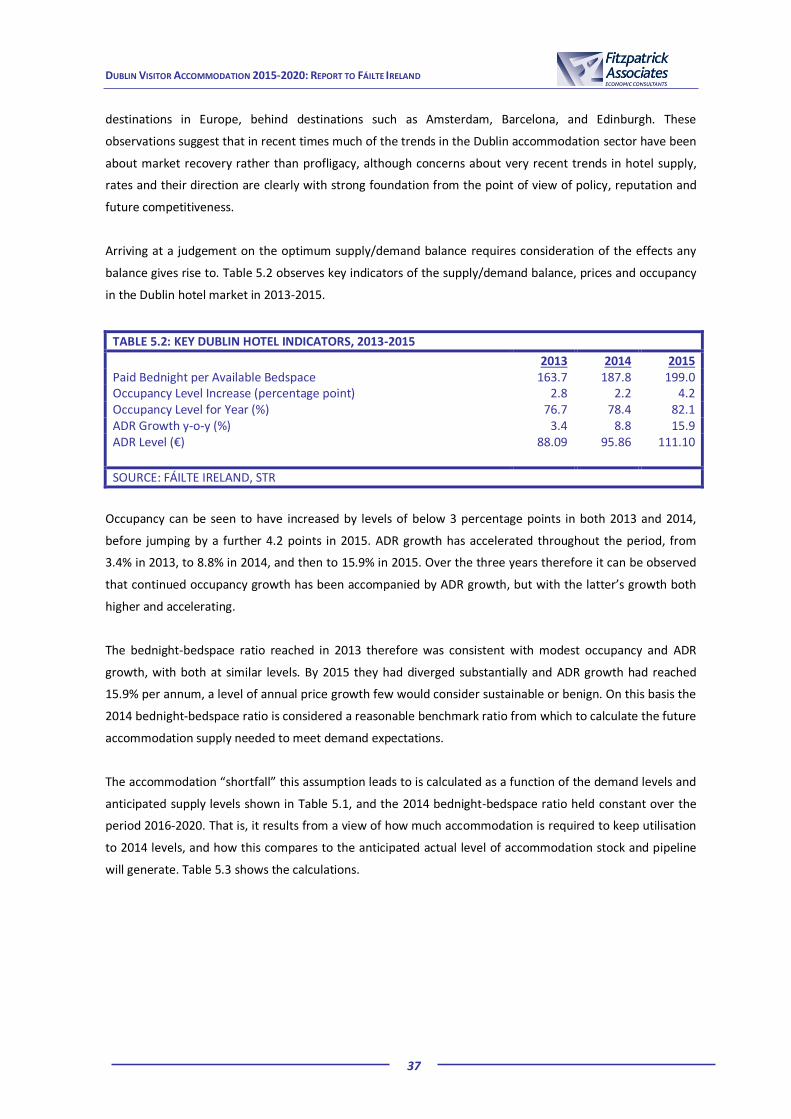
DUBLIN VISITOR ACCOMMODATION 2015-2020: REPORT TO FÁILTE IRELAND
37
destinations in Europe, behind destinations such as Amsterdam, Barcelona, and Edinburgh. These
observations suggest that in recent times much of the trends in the Dublin accommodation sector have been
about market recovery rather than profligacy, although concerns about very recent trends in hotel supply,
rates and their direction are clearly with strong foundation from the point of view of policy, reputation and
future competitiveness.
Arriving at a judgement on the optimum supply/demand balance requires consideration of the effects any
balance gives rise to. Table 5.2 observes key indicators of the supply/demand balance, prices and occupancy
in the Dublin hotel market in 2013-2015.
TABLE 5.2: KEY DUBLIN HOTEL INDICATORS, 2013-2015
2013 2014 2015 Paid Bednight per Available Bedspace 163.7 187.8 199.0 Occupancy Level Increase (percentage point) 2.8 2.2 4.2 Occupancy Level for Year (%) 76.7 78.4 82.1 ADR Growth y-o-y (%) 3.4 8.8 15.9 ADR Level (€)
88.09
95.86
111.10
SOURCE: FÁILTE IRELAND, STR
Occupancy can be seen to have increased by levels of below 3 percentage points in both 2013 and 2014,
before jumping by a further 4.2 points in 2015. ADR growth has accelerated throughout the period, from
3.4% in 2013, to 8.8% in 2014, and then to 15.9% in 2015. Over the three years therefore it can be observed
that continued occupancy growth has been accompanied by ADR growth, but with the latter’s growth both
higher and accelerating.
The bednight-bedspace ratio reached in 2013 therefore was consistent with modest occupancy and ADR
growth, with both at similar levels. By 2015 they had diverged substantially and ADR growth had reached
15.9% per annum, a level of annual price growth few would consider sustainable or benign. On this basis the
2014 bednight-bedspace ratio is considered a reasonable benchmark ratio from which to calculate the future
accommodation supply needed to meet demand expectations.
The accommodation “shortfall” this assumption leads to is calculated as a function of the demand levels and
anticipated supply levels shown in Table 5.1, and the 2014 bednight-bedspace ratio held constant over the
period 2016-2020. That is, it results from a view of how much accommodation is required to keep utilisation
to 2014 levels, and how this compares to the anticipated actual level of accommodation stock and pipeline
will generate. Table 5.3 shows the calculations.

DUBLIN VISITOR ACCOMMODATION 2015-2020: REPORT TO FÁILTE IRELAND
38
TABLE 5.3 CALCULATION OF ACCOMMODATION SUPPLY SHORTFALL/SURPLUS
2016 2017 2018 2019 2020
Demand Scenario 1 (Bednights, mn) 9.89 10.02 10.18 10.34 10.51
Demand Scenario 2 (Bednights, mn) 9.90 10.05 10.23 10.41 10.59
Demand Scenario 3 (Bednights, mn) 10.01 10.28 10.58 10.89 11.21
Demand Scenario 4 (Bednights, mn) 10.12 10.51 10.94 11.38 11.86
2014 Bednight-Bedspace Ratio 187.8 187.8 187.8 187.8 187.8
Supply Forecast (Bedspaces) 48,554 49,493 52,463 58,102 60,372
Supply Needed to Maintain 2014 Bednight-Bedspace Ratio (Bedspaces) Demand Scenario 1 52,644 53,364 54,223 55,082 55,977
Demand Scenario 2 52,726 53,529 54,473 55,421 56,406
Demand Scenario 3 53,321 54,751 56,355 57,997 59,710
Demand Scenario 4 53,889 55,942 58,227 60,611 63,134
Supply Shortfall/Surplus (Bedspaces) Demand Scenario 1 -4,090 -3,871 -1,760 3,019 4,395
Demand Scenario 2 -4,171 -4,036 -2,011 2,681 3,966
Demand Scenario 3 -4,767 -5,258 -3,893 105 661
Demand Scenario 4 -5,335 -6,449 -5,764 -2,509 -2,762
Supply Shortfall/Surplus (Bedrooms) Demand Scenario 1 -1,813 -1,715 -780 1,338 1,948
Demand Scenario 2 -1,848 -1,788 -891 1,188 1,757
Demand Scenario 3 -2,112 -2,330 -1,725 47 293
Demand Scenario 4 -2,364 -2,858 -2,555 -1,112 -1,224
Supply Shortfall/Surplus (Bedrooms) (Rounded to Nearest 50) Demand Scenario 1 -1,800 -1,700 -800 1,350 1,950
Demand Scenario 2 -1,850 -1,800 -900 1,200 1,750
Demand Scenario 3 -2,100 -2,350 -1,750 50 300
Demand Scenario 4 -2,350 -2,850 -2,550 -1,100 -1,200
* Bedspaces per bedroom calculated on the basis of the actual 2015 ratio within approved hotel accommodation stock
SOURCE: FITZPATRICK ASSOCIATES
The resulting accommodation “shortfalls” when this 2014 bednight-bedspace ratio is taken as the benchmark
for future years, are shown in Figure 5.1.
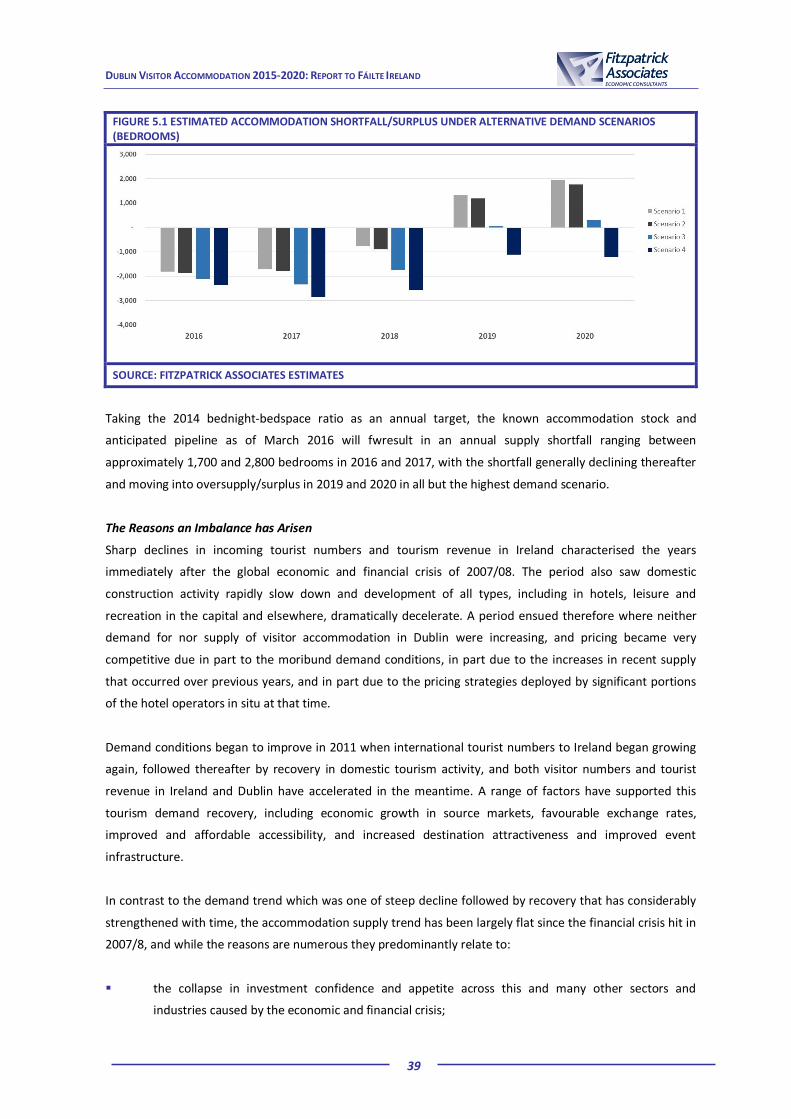
DUBLIN VISITOR ACCOMMODATION 2015-2020: REPORT TO FÁILTE IRELAND
39
FIGURE 5.1 ESTIMATED ACCOMMODATION SHORTFALL/SURPLUS UNDER ALTERNATIVE DEMAND SCENARIOS (BEDROOMS)
SOURCE: FITZPATRICK ASSOCIATES ESTIMATES
Taking the 2014 bednight-bedspace ratio as an annual target, the known accommodation stock and
anticipated pipeline as of March 2016 will fwresult in an annual supply shortfall ranging between
approximately 1,700 and 2,800 bedrooms in 2016 and 2017, with the shortfall generally declining thereafter
and moving into oversupply/surplus in 2019 and 2020 in all but the highest demand scenario.
The Reasons an Imbalance has Arisen
Sharp declines in incoming tourist numbers and tourism revenue in Ireland characterised the years
immediately after the global economic and financial crisis of 2007/08. The period also saw domestic
construction activity rapidly slow down and development of all types, including in hotels, leisure and
recreation in the capital and elsewhere, dramatically decelerate. A period ensued therefore where neither
demand for nor supply of visitor accommodation in Dublin were increasing, and pricing became very
competitive due in part to the moribund demand conditions, in part due to the increases in recent supply
that occurred over previous years, and in part due to the pricing strategies deployed by significant portions
of the hotel operators in situ at that time.
Demand conditions began to improve in 2011 when international tourist numbers to Ireland began growing
again, followed thereafter by recovery in domestic tourism activity, and both visitor numbers and tourist
revenue in Ireland and Dublin have accelerated in the meantime. A range of factors have supported this
tourism demand recovery, including economic growth in source markets, favourable exchange rates,
improved and affordable accessibility, and increased destination attractiveness and improved event
infrastructure.
In contrast to the demand trend which was one of steep decline followed by recovery that has considerably
strengthened with time, the accommodation supply trend has been largely flat since the financial crisis hit in
2007/8, and while the reasons are numerous they predominantly relate to:
the collapse in investment confidence and appetite across this and many other sectors and
industries caused by the economic and financial crisis;

DUBLIN VISITOR ACCOMMODATION 2015-2020: REPORT TO FÁILTE IRELAND
40
sharp falls in hotel occupancy and profitability in the wake of steep demand falls, and perceptions of
over supply due to irrational expansion over previous years accompanied by little prospect of
proportionate supply decreases as hotels were kept operational even though non-viable in their
immediate operating environment;
a strong retreat from speculative or development lending by the main financial institutions in Dublin
commercial property and a significantly altered risk appetite among lenders that has remained in
the period since;
strong non-hotel competition for attractive hotel sites (or a severe lack of them), in prime city
locations;
long lead-times and uncertainty and risk associated with many phases in the development cycle (site
acquisition, planning, design, funding, contracting, etc.); and
asset deleveraging among investors faced with legacy debts.
Macro Factors Affecting Future Demand
A number of macro-economic factors are fundamentally important determinants of the demand for visitor
accommodation in Dublin, over the period to 2020 and beyond:
economic growth in Ireland is important given its strong relationship with domestically-generated
hotel demand in Dublin, its relationship to business travel to Dublin, as well as its effect on tourism
product investment and tourism marketing. Currently the outlook for the Irish economy is positive
and the recovery is clearly strengthening, although there are uncertainties associated with future
projections as always;
economic growth in core source markets will impact on inbound visits to Ireland and Dublin. As in
Ireland’s case current economic expectations over the short and medium term are relatively
positive in the case of the US and UK, although somewhat less strong for the Eurozone, and also
similarly to Ireland, each carry downside risks and are vulnerable to unforeseen shocks;
exchange rates, particularly Euro:US Dollar and Euro:Sterling, have been supportive macro factors
for inbound tourism to Ireland and Dublin in recent years, and any reversal of their trend would
reverse that effect;
the economic stability of the euro area remains an uncertainty and any set of events that brought
its survival into question would create substantial economic uncertainty and diminish business,
consumer and tourist confidence;
a range of other shocks each have the proven capacity to dramatically affect tourism demand
internationally and in Ireland, including terrorism, natural disasters and geopolitical developments;
cost factors, most notably oil price trends, affect tourism demand by altering the relative costs of
travel, particularly international air travel. While current expectations are of benign price trends,
any shift to a period of oil price growth would negatively impact visitor numbers to Dublin quite
directly.
DUBLIN VISITOR ACCOMMODATION 2015-2020: REPORT TO FÁILTE IRELAND
41
5.2 Possible Policy Responses
The accommodation shortfalls estimated vary somewhat depending on the demand projections adopted,
however all estimates project the most significant shortfalls in the period 2016-2018. They then decline
significantly in the years 2019 and 2020, the period in which the currently-projected pipeline of new stock is
likely to materialise most substantially (and in a number of scenarios become a surplus).
Regardless of any possible policy response, the following considerations are worth keeping in mind:
the scale and range of projected “shortfalls” decline sharply as 2020 approaches;
while occupancy is likely to be very high in 2016 and 2017 in prime hotels and locations, there is very
little that can address that by way of new supply initiatives that could affect those years;
the pipeline of new development in prospect or planning in the market is changing frequently, is
reacting to demand growth, and may have fully reacted to demand expectations by the latter years of
the period. In effect, after a period of imbalance the market appears to be working and seems likely to
eliminate the need for a public policy response by the time one could have an effect;
while the market has shown strong growth in occupancy and average daily rates in recent years, both
had much upward scope, they were very much in a “recovery” mode, and were coming from a low
base following the economic crisis;
demand uncertainty increases the further into the future forecasts are made, and while demand
conditions and expectations are currently strong, there is no certainty they will remain as strong over
the full period.
While not recommending an immediate intervention in the market designed to generate accommodation
additional to that anticipated from the current private sector pipeline, there is a range of policy initiatives
and actions that
(a) should be undertaken as a means of monitoring market trends and the supply/demand relationship
more closely, frequently and objectively;
(b) should be considered as a means of addressing rigidities in the accommodation supply market and
ensuring a greater degree of responsiveness over the medium and long term;
(c) should be considered (individually or in combination) in the event that expectations about the
sufficiency of supply in the medium term (i.e. the next five years) were to worsen rather than
improve; and
(d) should be considered to help manage the effects of the next two to three years of supply shortage
during periods of peak demand that currently seem in prospect.
These are listed in Figure 5.2.

DUBLIN VISITOR ACCOMMODATION 2015-2020: REPORT TO FÁILTE IRELAND
42
FIGURE 5.2 POTENTIAL POLICY RESPONSES
Market Monitoring
Objectively measure and monitor the demand/supply balance and outlook regularly and with reasonable precision, and begin regular reviews with the trends, expectations and policy implications reported and published.
Site Intensification
Update existing statutory accommodation regulations, particularly those of hotels, so that they reflect contemporary consumer preferences and facilitate competition with new types of offerings in the accommodation market internationally. This should include, at minimum, bedroom size in line with international norms, greater web access and connectivity, less generous spatial requirements, and more flexible services and facilities.
Planning
Review the efficiency of the planning system for visitor accommodation in Dublin, and consider ways of streamlining or fast-tracking the process, for example through adoption of strategic development zone approaches that specify where hotels should be developed, facilitate their increased height, and reduce uncertainty regarding planning objections and appeals.
Take initiatives to support the case for planning approval of accommodation projects on the grounds of sustainable tourism development in the city.
Short Term Initiatives
Research and Identify formal initiatives that could help manage peak demand for accommodation in the city over the period to 2018 (e.g. through improving transport links to visitor accommodation outside the city centre and suburbs).
DUBLIN VISITOR ACCOMMODATION 2015-2020: REPORT TO FÁILTE IRELAND
Annexes
DUBLIN VISITOR ACCOMMODATION 2015-2020: REPORT TO FÁILTE IRELAND
Annex 1 List of Consultees
Airbnb
Allied Irish Bank
An Óige
Bank of Ireland
CBRE
Choice Hotels Group
Dalata
Dublin City Council
Dublinia
Fingal County Council
Independent Holiday Hostels of Ireland
Irish Caravan and Camping Council
Irish Hotels Federation
Irish Self Catering Federation
Irish Tour Operators’ Association
Irish Tourist Industry Confederation
Jones Lang Lasalle
National Asset Management Agency
PREM Group

DUBLIN VISITOR ACCOMMODATION 2015-2020: REPORT TO FÁILTE IRELAND


![Indecon+Report+on+EFL+Sector.+November+07+Amended[1] 23-9-09 Failte Ireland Website](https://static.fdocuments.us/doc/165x107/54687d81b4af9fe7768b4be5/indeconreportoneflsectornovember07amended1-23-9-09-failte-ireland-website.jpg)