Title of Presentation · 2017-11-03 · This presentation is provided by Bernstein. ... Based on...
41
This presentation is provided by Bernstein. This presentation booklet has been provided to you for use in a private and confidential meeting to discuss a potential or existing investment-advisory relationship. This presentation is not an advertisement and is not intended for public use or distribution beyond our private meeting. Bernstein does not provide tax, legal, or accounting advice. In considering this material, you should discuss your individual circumstances with professionals in those areas before making any decisions. Bridging Generations
Transcript of Title of Presentation · 2017-11-03 · This presentation is provided by Bernstein. ... Based on...

This presentation is provided by Bernstein. This presentation booklet has been provided to you for use in a private and confidential meeting to discuss a potential or existing investment-advisory relationship. This presentation is not an advertisement and is not intended for public use or distribution beyond our private meeting. Bernstein does not provide tax, legal, or accounting advice. In considering this material, you should discuss your individual circumstances with professionals in those areas before making any decisions.
Bridging Generations

Bernstein does not provide tax, legal, or accounting advice. In considering this material,
you should discuss your individual circumstances with professionals in those areas before making
any decisions.
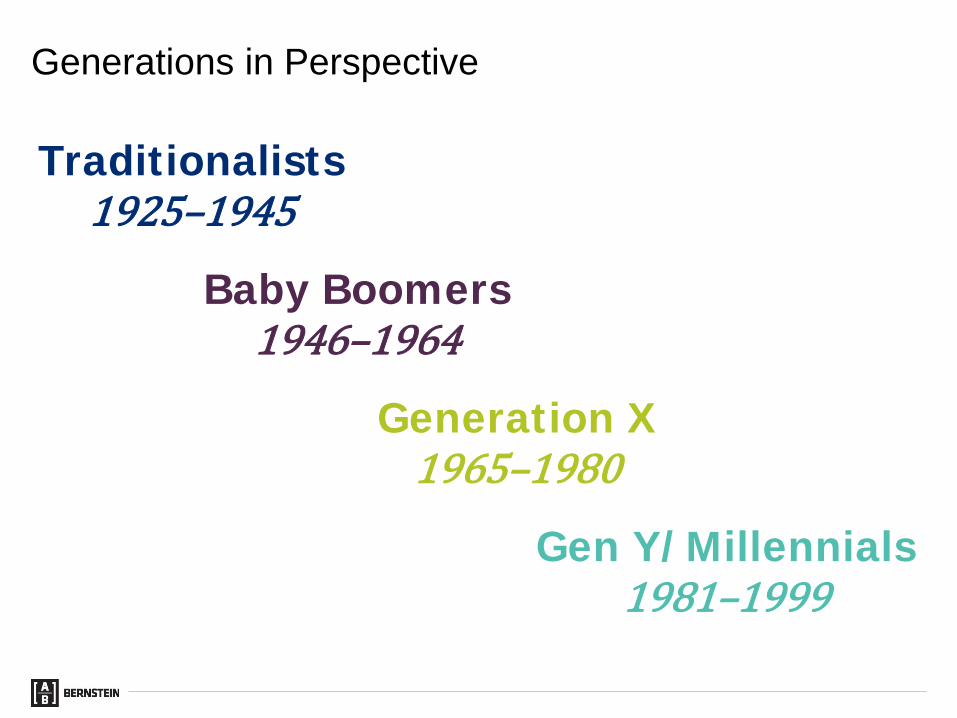
Traditionalists1925–1945
Baby Boomers1946–1964
Generation X1965–1980
Gen Y/Millennials1981–1999
Generations in Perspective

TraditionalistsPopulation: 75 Million
1925–1945
Events andCircumstances
The Great DepressionWorld War IIHolocaustKorean WarSegregationMovies
“Save for a Rainy Day”
TeamPlayers
Respect for Authority
Trust in Community, Religion, and Country
Loyalty, Hard Work
Patriotism

Baby BoomersPopulation: 80 Million
1946–1964
Events andCircumstances
Post-war economic growthCivil rights movementWomen’s liberationAnti-war movementSpace ProgramCold War, Vietnam WarJFK, MLK assassinations
Value Material Wealth
Highly Competitive
Activists
EqualRights
Idealistic
Optimistic

Generation XPopulation: 46 Million
1965–1980
Events andCircumstances
Watergate, Iran ContraMTVCorporate downsizingLatchkey kidsSingle-parent homesAIDS, drug warsAdvent of internet
Belief They Are Misunderstood
Value Flexibility
Technologically Savvy
Resourceful
Independent
Skeptical
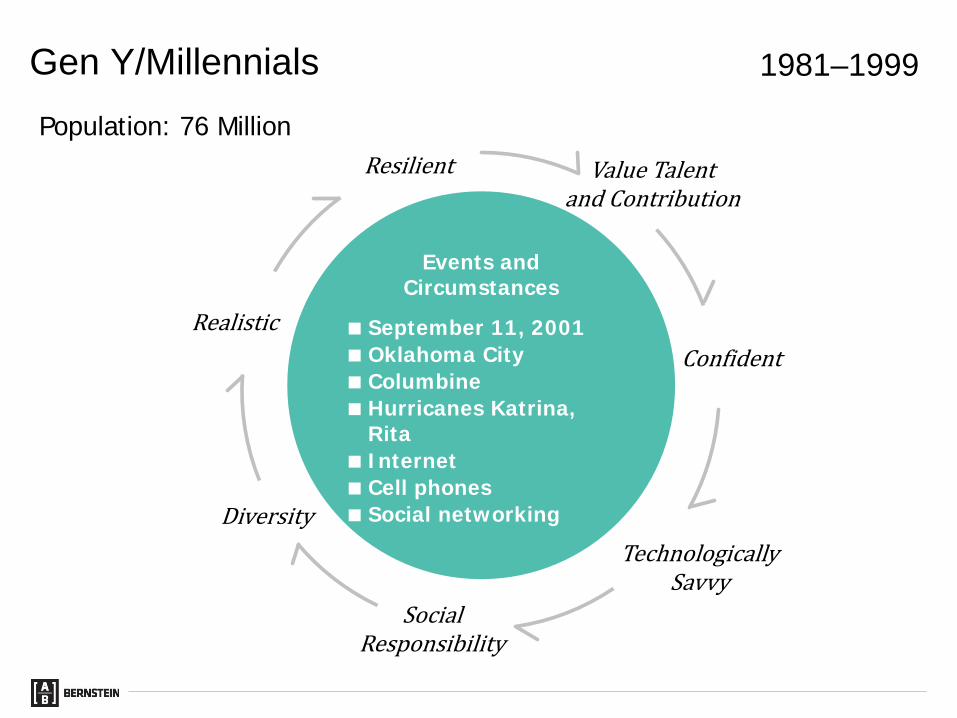
Gen Y/MillennialsPopulation: 76 Million
1981–1999
Events and Circumstances
September 11, 2001Oklahoma CityColumbineHurricanes Katrina,
RitaInternetCell phonesSocial networking
Value Talent and Contribution
Confident
Technologically Savvy
Social Responsibility
Diversity
Realistic
Resilient

Always wired and connectedExpectation of immediacy
Meet and communicate on their terms In-person
Skype, videoconference
Phone, text, email
Seek meaning in their life Job
Investing
Community and world
Value advice, not information
What the Younger Client Wants
Source: AB
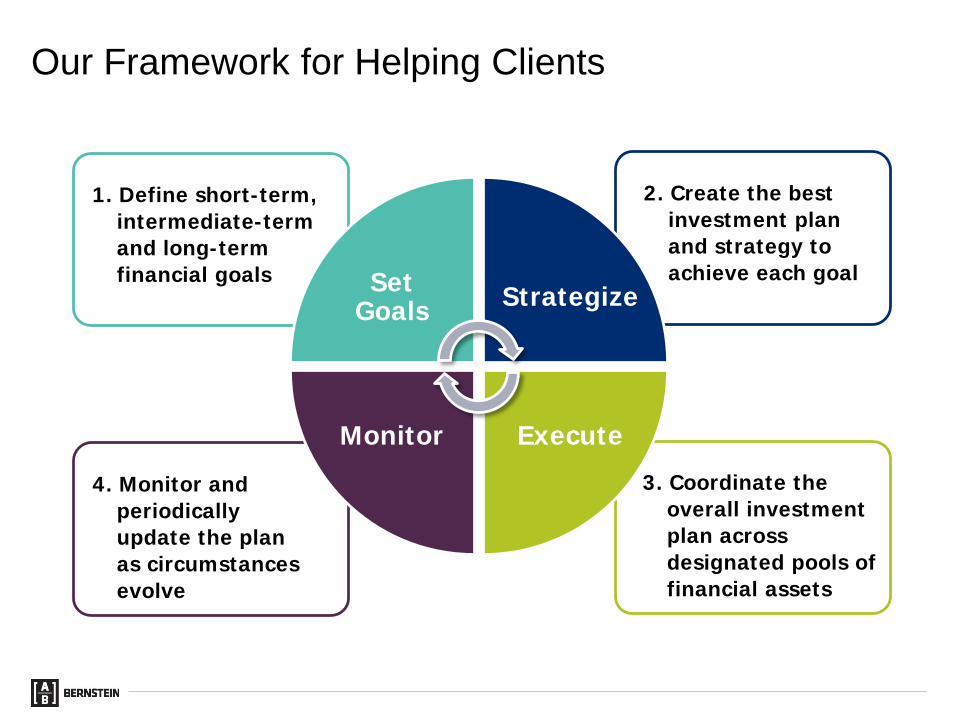
Our Framework for Helping Clients
3. Coordinate the overall investment plan across designated pools of financial assets
4. Monitor and periodically update the plan as circumstances evolve
2. Create the best investment plan and strategy to achieve each goal
1. Define short-term, intermediate-term and long-term financial goals Set
Goals Strategize
ExecuteMonitor
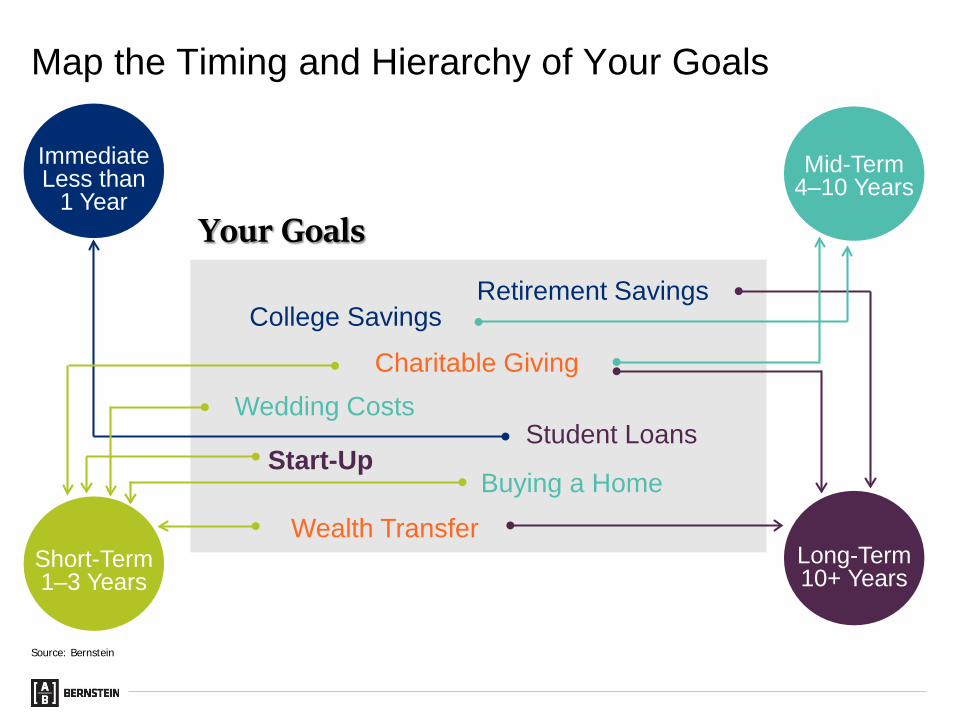
Map the Timing and Hierarchy of Your Goals
Your Goals
Buying a HomeStart-Up
Student Loans
Retirement Savings
Charitable Giving
College Savings
Wealth Transfer
Wedding Costs
ImmediateLess than
1 Year
Short-Term1–3 Years
Mid-Term4–10 Years
Long-Term10+ Years
Source: Bernstein

Grad SchoolJob Career Retirement...Childhood College
Investing in Human Capital Can Generate Financial CapitalHypothetical Example
FinancialCapital
HumanCapital
Financial capital is defined as cumulative financial assets; human capital is defined as capacity to generate financial capital over the rest of your life; individual lives may vary.Source: Bernstein

Growing Your Target Financial Capital
$ GreatReturn Pattern
Accumulation Phase Withdrawal Phase
Typical Return Pattern
Hostile Return PatternAge
Core Capital
Target Financial Capital
Contribution
Target financial capital is based on the growth of a portfolio, plus cumulative additional savings, until retirement, assuming a confidence level that glides up as human capital declines, so that at retirement it is expected to support sustainable future spending after taxes and inflation.Based on Bernstein’s estimates of the range of returns for the applicable capital markets as of December 31, 2014. Data do not represent past performance and are not a promise of actual future results or a range of future results. See Notes on Wealth Forecasting System in the Appendix.Source: Bernstein

Gain Perspective: Stock Markets
“I’m investing in cash. The stock market hasn’t done anything, and I’ve
seen two major declines in the last 10 years.”
INVESTING BIAS
Source: AB
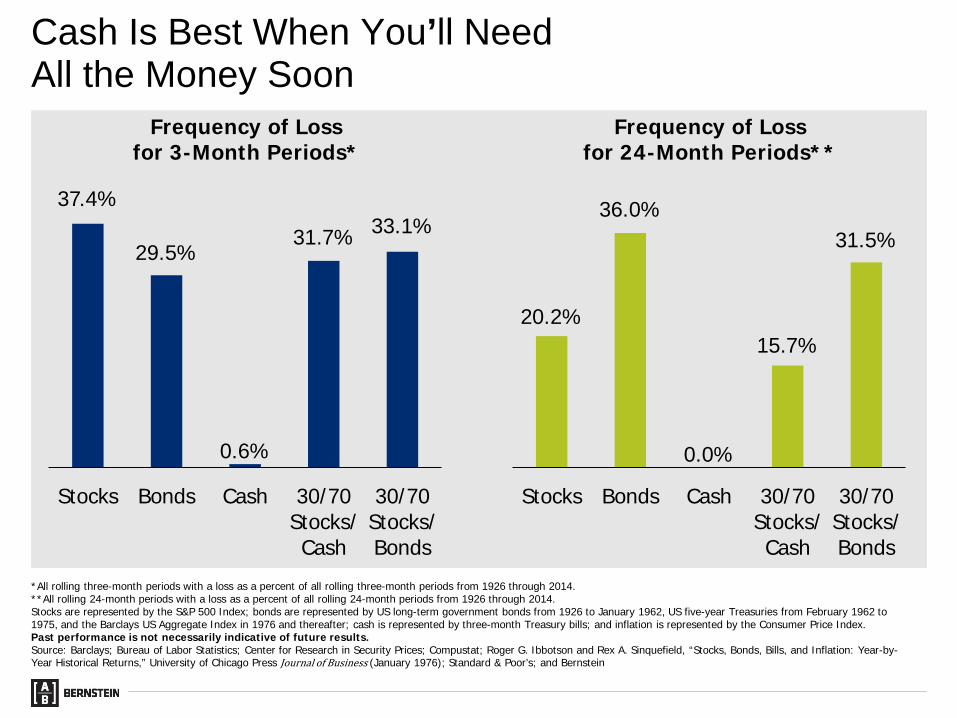
Cash Is Best When You’ll Need All the Money Soon
Frequency of Loss for 3-Month Periods*
Frequency of Loss for 24-Month Periods**
37.4%
29.5%
0.6%
31.7% 33.1%
Stocks Bonds Cash 30/70Stocks/Cash
30/70Stocks/Bonds
20.2%
36.0%
0.0%
15.7%
31.5%
Stocks Bonds Cash 30/70Stocks/Cash
30/70Stocks/Bonds
*All rolling three-month periods with a loss as a percent of all rolling three-month periods from 1926 through 2014. **All rolling 24-month periods with a loss as a percent of all rolling 24-month periods from 1926 through 2014.Stocks are represented by the S&P 500 Index; bonds are represented by US long-term government bonds from 1926 to January 1962, US five-year Treasuries from February 1962 to 1975, and the Barclays US Aggregate Index in 1976 and thereafter; cash is represented by three-month Treasury bills; and inflation is represented by the Consumer Price Index. Past performance is not necessarily indicative of future results.Source: Barclays; Bureau of Labor Statistics; Center for Research in Security Prices; Compustat; Roger G. Ibbotson and Rex A. Sinquefield, “Stocks, Bonds, Bills, and Inflation: Year-by-Year Historical Returns,” University of Chicago Press Journal of Business (January 1976); Standard & Poor’s; and Bernstein

3-Year Annualized Return Projections
1.7% 1.0%0.2%0.1% 0.1%
(2.6)%
0.7% 0.4%
(1.0)%
Pretax* After-Tax After Taxesand Inflation
Holding Cash Has a Cost, Even over Short Time Periods
2.6%
5.8%
(2.9)% (2.6)%
0.2%1.6%
Cash Bonds 30/70
After Taxesand Inflation
GreatReturnPattern
TypicalReturnPattern
PoorReturnPattern
5%10%50%90%95%
Probability
**
** **
*Represents projected pretax compound annual growth rates.**Assumes top marginal federal income tax rates and a 6.5% state income tax rate. Growth rates calculated based on the estimated market value; if the assets were liquidated, additional capital gains or losses would be realized that are not reflected here.“30/70” means 30% stocks and 70% bonds. Stocks are modeled as 21% US diversified, 21% US value, 21% US growth, 7% US small- and mid-cap, 22.5% developed international, and 7.5% emerging market. Bonds are modeled as intermediate-term diversified municipals.Based on Bernstein’s estimates of the range of returns for the applicable capital markets as of December 31, 2014. Data do not represent past performance and are not a promise of actual future results or a range of future results. See Notes on Wealth Forecasting in the Appendix.Source: Bernstein

Bonds and Cash Provide Stability; Stocks Provide Growth
Through September 30, 2017Past performance is not necessarily indicative of future results. US stocks are represented by the S&P 500 Index; bonds are represented by US long-term government bonds from 1926 to January 1962, US five-year Treasuries from February 1962 to 1975, and the Barclays US Aggregate Index in 1976 and thereafter; cash is represented by three-month Treasury bills; and inflation is represented by the Consumer Price Index. Source: Barclays; Bureau of Labor Statistics; Center for Research in Security Prices; Compustat; Roger G. Ibbotson and Rex A. Sinquefield, “Stocks, Bonds, Bills, and Inflation: Year-by-Year Historical Returns,” University of Chicago Press Journal of Business (January 1976); Standard & Poor’s; and Bernstein
Stocks: $6,866
26 32 38 44 50 56 62 68 74 80 86 92 98 04 10 16
Bonds: $121
Cash: $26Inflation: $14
Annualized ReturnsStocks 10.1%Bonds 5.4T-Bills 3.6Inflation 2.9
Growth of $1

Gain Perspective: Single Stock Exposure
“I’m 28 years old, and the start-up I work for just IPO’d. I never thought
I’d be this wealthy. I’m riding the stock and am not interested in selling it.”
RISK APPETITE
Source: AB

Stock Concentration Adds to Target Financial Capital Needed
Target Financial Capital Required per $100,000 of Future SpendingUSD Millions
$2.4 $2.5$2.8
$3.3
0% 25% 50% 75%Single-Stock Weight in Portfolio
+35%
Financial capital is based on the growth of a portfolio with no withdrawals until retirement assuming a confidence level that glides up as human capital declines, so that at retirement it is expected to support a sustainable future spending rate of $100,000 per year after taxes and inflation. Non-single-stock assets are allocated 70% stocks/30% bonds. Stocks are modeled as 21% US diversified, 21% US value, 21% US growth, 7% US small- and mid-cap, 22.5% developed international, and 7.5% emerging market. Bonds are modeled as intermediate-term diversified municipals. Single stock is modeled with 35% volatility, 1.2 beta, and a 1% dividend rate. Assumes top marginal federal income tax rates and a 6.5% state income tax rate. Based on Bernstein’s estimates of the range of returns for the applicable capital markets as of December 31, 2014. Data do not represent past performance and are not a promise of actual future results or a range of future results. See Notes on Wealth Forecasting System in the Appendix.Source: Bernstein

Single-Stock Risk Trumps All Other Investment Risks
Probability of 30% Loss in a Portfolio with 50% Single StockOver 10 Years
56% 53% 55% 57% 61%
Cash 10/90 30/70 50/50 70/30Stock/Bond Mix of the Other Half of the Portfolio
Projections indicate the probability of a peak-to-trough decline in pretax, pre-cash-flow cumulative returns of 30% over a 10-year period. Stocks are modeled as 21% US diversified, 21% US value, 21% US growth, 7% US small- and mid-cap, 22.5% developed international, and 7.5% emerging market. Bonds are modeled as intermediate-term diversified municipals.Because the Wealth Forecasting System uses annual capital-market returns, the probability of peak-to-trough losses measured on a more frequent basis (such as daily or monthly) may be understated. The probabilities depicted above include an upward adjustment intended to account for peak-to-trough losses that do not last an exact number of years. Assumes no rebalancing between single stock and diversified assets. The single stock is assumed to have 35% volatility, 1.2 beta, and a 1% dividend rate. Based on Bernstein’s estimates of the range of returns for the applicable capital markets as of December 31, 2014. Data do not represent past performance and are not a promise of actual future results or a range of future results. See Notes on Wealth Forecasting System in the Appendix.Source: Bernstein

You Can Optimize Value by Actively Managing Your Options
80% 70% 60% 50% 40% 30% 20% 10% 0%
Optimal Exercise Window
Time Is 30% of Total Value
Time Is 10% of Total Value
10%Time Value
Intrinsic ValueRi
sk-A
djus
ted
Retu
rn
Time Value as Percent of Total Value
30%
Risk-adjusted return calculated as the median excess return over cash divided by the standard deviation of the excess return over cash; return calculated as the implied logarithmic growth rate; potential exercise considered on a monthly basis for a vested option; exercise proceeds assumed to be invested in 100% stocks. Stocks are modeled as 21% US diversified, 21% US value, 21% US growth, 7% US small- and mid-cap, 22.5% developed international, and 7.5% emerging market. Based on Bernstein’s estimates of the range of returns for the applicable capital markets as of December 31, 2014. Data do not represent past performance and are not a promise of actual future results or a range of future results.Source: Bernstein

Gain Perspective: Community and World
“Doing well by doing good is my motto. Giving back is very important to me, and I want
my portfolio to reflect my values as well.”
RESPONSIBILITY
Source: AB
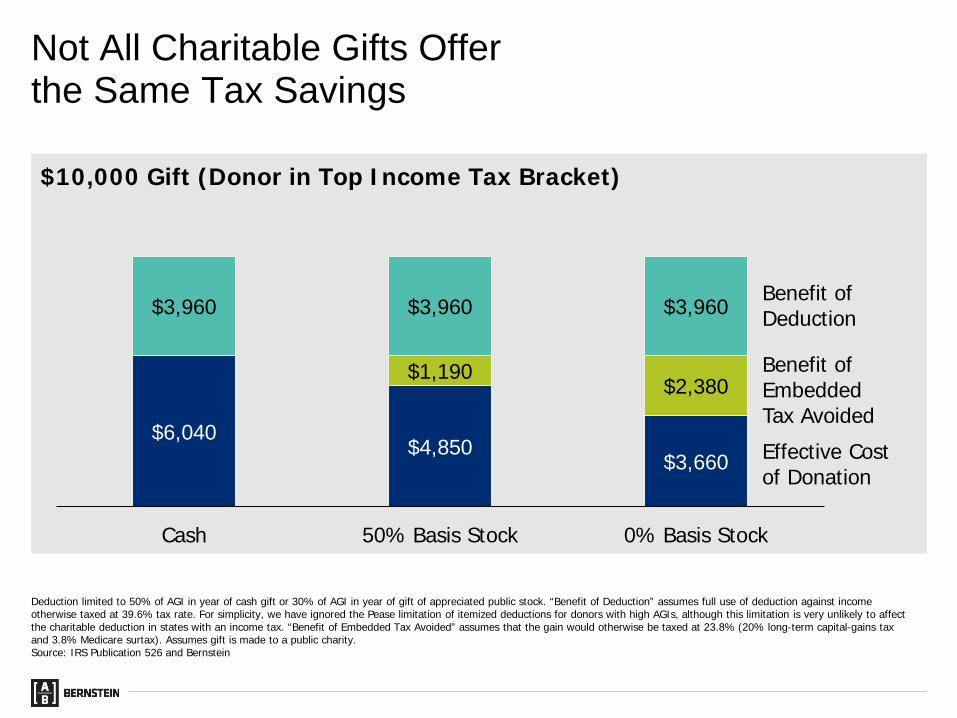
Not All Charitable Gifts Offer the Same Tax Savings
$10,000 Gift (Donor in Top Income Tax Bracket)
$6,040 $4,850 $3,660
$1,190 $2,380
$3,960 $3,960 $3,960
Cash 50% Basis Stock 0% Basis Stock
Benefit of Deduction
Benefit of Embedded Tax AvoidedEffective Cost of Donation
Deduction limited to 50% of AGI in year of cash gift or 30% of AGI in year of gift of appreciated public stock. “Benefit of Deduction” assumes full use of deduction against income otherwise taxed at 39.6% tax rate. For simplicity, we have ignored the Pease limitation of itemized deductions for donors with high AGIs, although this limitation is very unlikely to affect the charitable deduction in states with an income tax. “Benefit of Embedded Tax Avoided” assumes that the gain would otherwise be taxed at 23.8% (20% long-term capital-gains tax and 3.8% Medicare surtax). Assumes gift is made to a public charity.Source: IRS Publication 526 and Bernstein
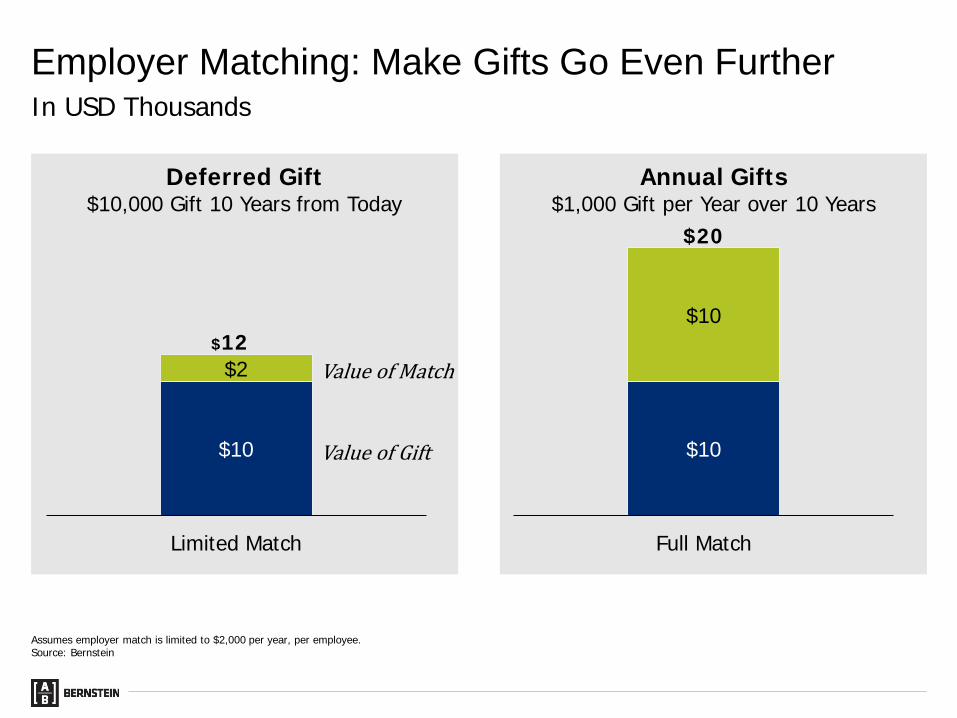
Annual Gifts$1,000 Gift per Year over 10 Years
Employer Matching: Make Gifts Go Even Further
Deferred Gift$10,000 Gift 10 Years from Today
$10
$2
Limited Match
Value of Match
$10
$10
Full Match
$12
$20
Value of Gift
In USD Thousands
Assumes employer match is limited to $2,000 per year, per employee.Source: Bernstein

Bernstein Integrates ESG Principles into the Investment Research Process
External Research Providers
Investment Decisions
Meet withManagement,Employees,
Suppliers, andCustomers
Meet with Industry and Local Experts
CompanyEngagement
OngoingMonitoring
Country andLegal Analysis
Review,Monitor Mediaand Internet
Source: Bernstein

Gain Perspective: Financial Plan
“I need advice on how to save and plan for my future
financial independence.”
SECURING FINANCIAL INDEPENDENCE
Source: AB
About Priya30-year-old professional
Currently works at top law firm
Engaged to be married next year to a musician
They do not plan to have children
About Priya’s AssetsSince graduating from law school 4 years ago, she has focused on paying
off her student loans
Contributed modestly to company’s 401(k) plan; Value today is $40,000
The Younger Investor: A Case Study
Based on information supplied by the client. Bernstein is not a legal, tax or estate advisor. Investors should consult these professionals as appropriate before making any decisions.Source: AB
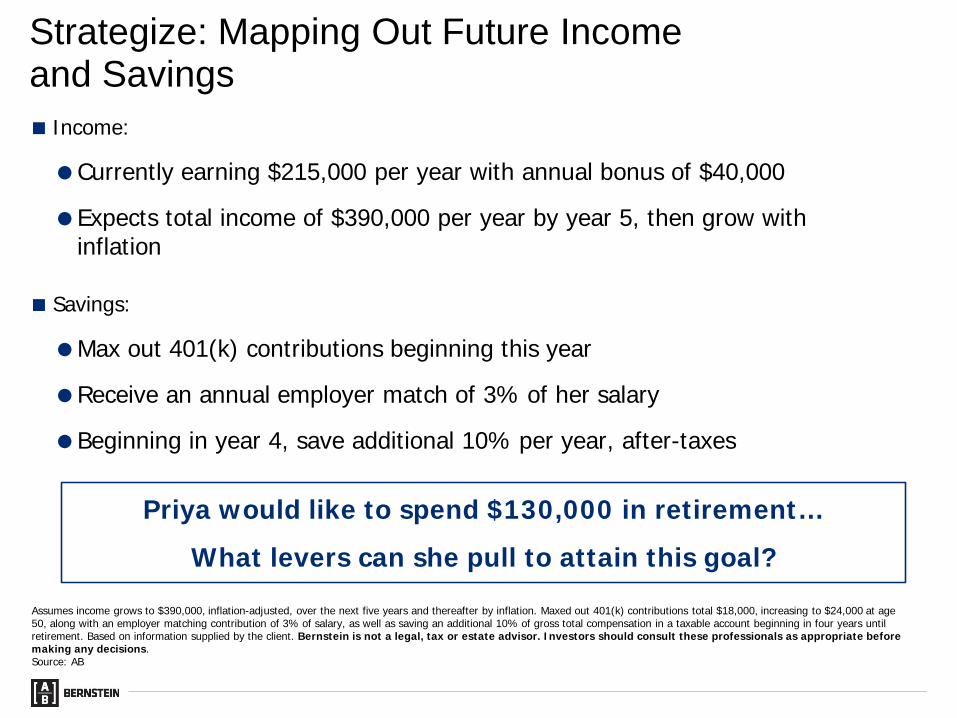
Income:
Currently earning $215,000 per year with annual bonus of $40,000
Expects total income of $390,000 per year by year 5, then grow with inflation
Savings:
Max out 401(k) contributions beginning this year
Receive an annual employer match of 3% of her salary
Beginning in year 4, save additional 10% per year, after-taxes
Strategize: Mapping Out Future Income and Savings
Assumes income grows to $390,000, inflation-adjusted, over the next five years and thereafter by inflation. Maxed out 401(k) contributions total $18,000, increasing to $24,000 at age 50, along with an employer matching contribution of 3% of salary, as well as saving an additional 10% of gross total compensation in a taxable account beginning in four years until retirement. Based on information supplied by the client. Bernstein is not a legal, tax or estate advisor. Investors should consult these professionals as appropriate before making any decisions.Source: AB
Priya would like to spend $130,000 in retirement…What levers can she pull to attain this goal?
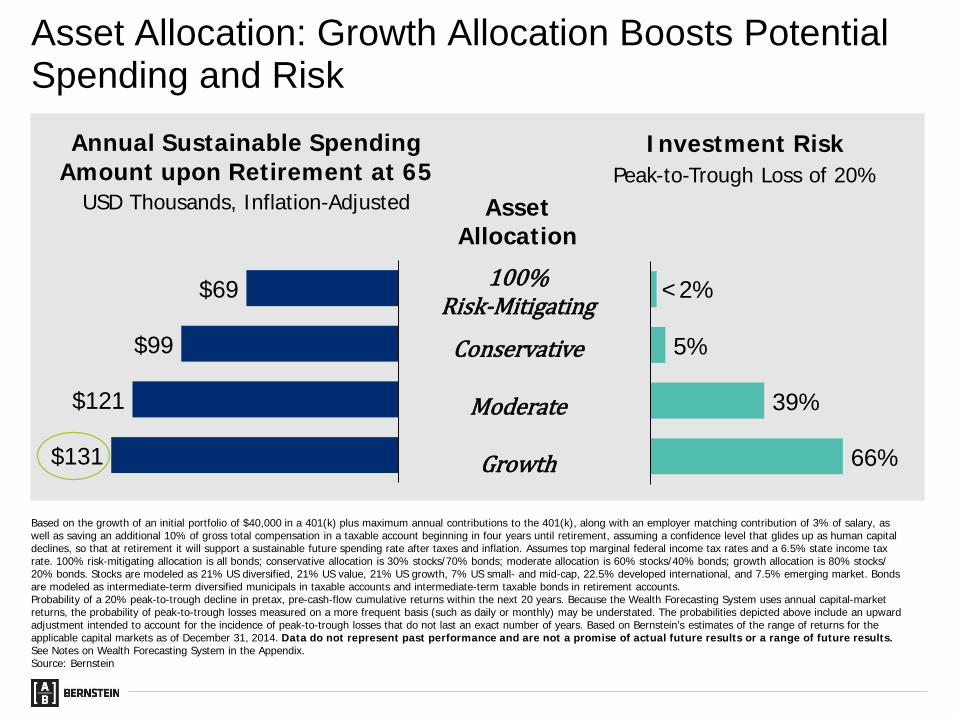
Asset Allocation: Growth Allocation Boosts Potential Spending and Risk
$69
$99
$121
$131
<2%
5%
39%
66%
AssetAllocation
100% Risk-Mitigating
Conservative
Moderate
Growth
Annual Sustainable Spending Amount upon Retirement at 65
USD Thousands, Inflation-Adjusted
Investment RiskPeak-to-Trough Loss of 20%
Based on the growth of an initial portfolio of $40,000 in a 401(k) plus maximum annual contributions to the 401(k), along with an employer matching contribution of 3% of salary, as well as saving an additional 10% of gross total compensation in a taxable account beginning in four years until retirement, assuming a confidence level that glides up as human capital declines, so that at retirement it will support a sustainable future spending rate after taxes and inflation. Assumes top marginal federal income tax rates and a 6.5% state income tax rate. 100% risk-mitigating allocation is all bonds; conservative allocation is 30% stocks/70% bonds; moderate allocation is 60% stocks/40% bonds; growth allocation is 80% stocks/20% bonds. Stocks are modeled as 21% US diversified, 21% US value, 21% US growth, 7% US small- and mid-cap, 22.5% developed international, and 7.5% emerging market. Bonds are modeled as intermediate-term diversified municipals in taxable accounts and intermediate-term taxable bonds in retirement accounts. Probability of a 20% peak-to-trough decline in pretax, pre-cash-flow cumulative returns within the next 20 years. Because the Wealth Forecasting System uses annual capital-market returns, the probability of peak-to-trough losses measured on a more frequent basis (such as daily or monthly) may be understated. The probabilities depicted above include an upward adjustment intended to account for the incidence of peak-to-trough losses that do not last an exact number of years. Based on Bernstein’s estimates of the range of returns for theapplicable capital markets as of December 31, 2014. Data do not represent past performance and are not a promise of actual future results or a range of future results.See Notes on Wealth Forecasting System in the Appendix.Source: Bernstein

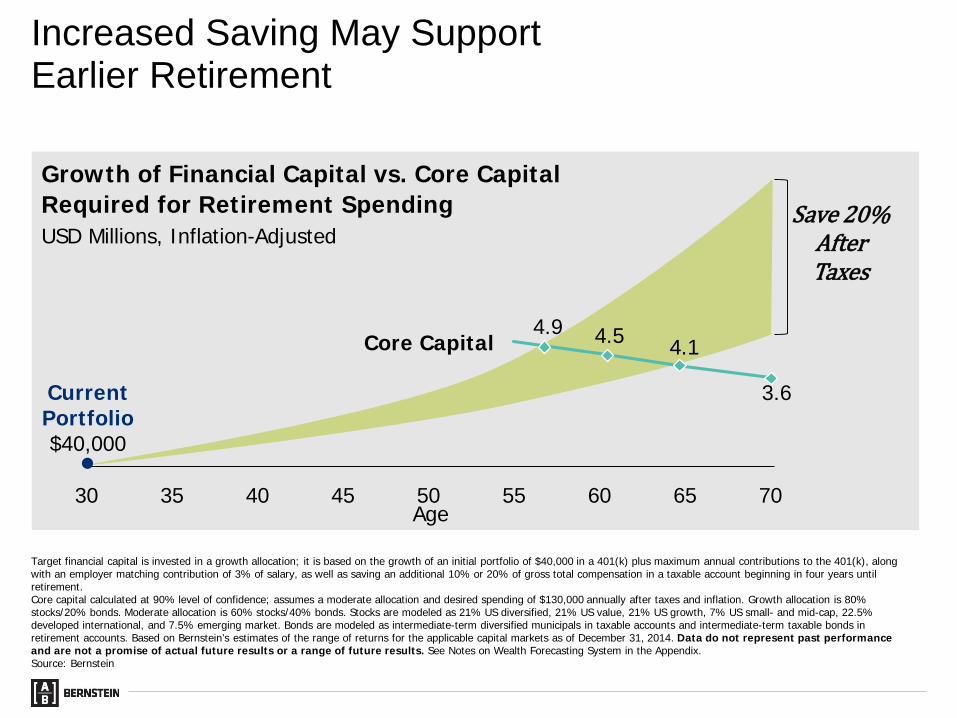
Growth of Financial Capital vs. Core Capital Required for Retirement SpendingUSD Millions, Inflation-Adjusted
4.9 4.5 4.1
3.6
30 35 40 45 50 55 60 65 70Age
Save 20% After Taxes
Save 10% After Taxes
Increased Saving May Support Earlier Retirement
Current Portfolio$40,000
Core Capital
Target financial capital is invested in a growth allocation; it is based on the growth of an initial portfolio of $40,000 in a 401(k) plus maximum annual contributions to the 401(k), along with an employer matching contribution of 3% of salary, as well as saving an additional 10% or 20% of gross total compensation in a taxable account beginning in four years until retirement.Core capital calculated at 90% level of confidence; assumes a moderate allocation and desired spending of $130,000 annually after taxes and inflation. Growth allocation is 80% stocks/20% bonds. Moderate allocation is 60% stocks/40% bonds. Stocks are modeled as 21% US diversified, 21% US value, 21% US growth, 7% US small- and mid-cap, 22.5% developed international, and 7.5% emerging market. Bonds are modeled as intermediate-term diversified municipals in taxable accounts and intermediate-term taxable bonds in retirement accounts. Based on Bernstein’s estimates of the range of returns for the applicable capital markets as of December 31, 2014. Data do not represent past performance and are not a promise of actual future results or a range of future results. See Notes on Wealth Forecasting System in the Appendix.Source: Bernstein
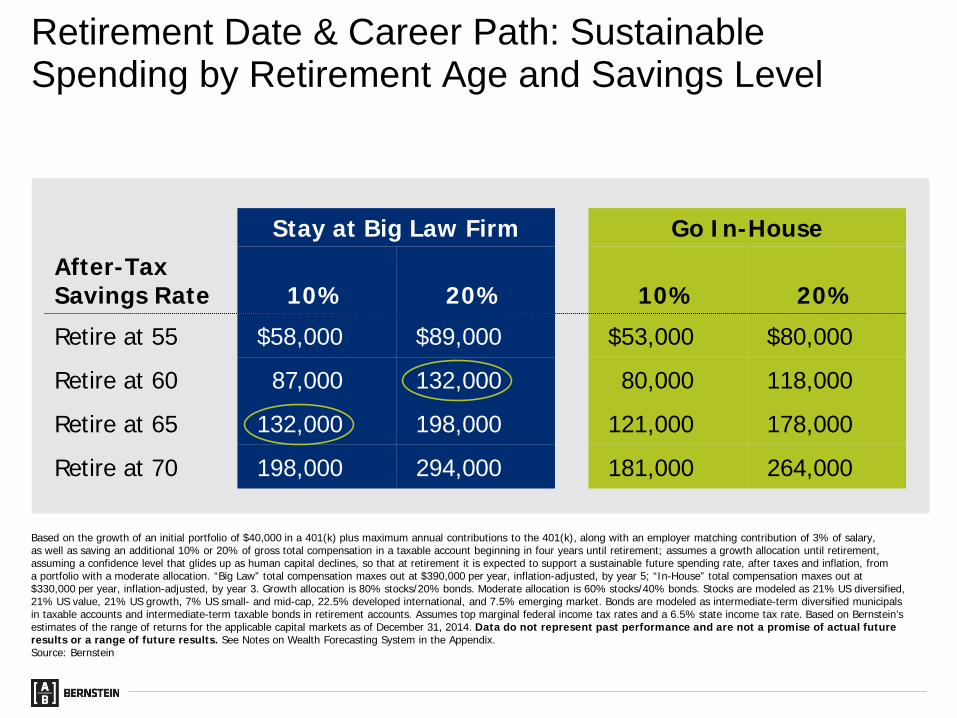
Retirement Date & Career Path: Sustainable Spending by Retirement Age and Savings Level
Stay at Big Law Firm Go In-HouseAfter-TaxSavings Rate 10% 20% 10% 20%Retire at 55 $58,000 $89,000 $53,000 $80,000
Retire at 60 87,000 132,000 80,000 118,000
Retire at 65 132,000 198,000 121,000 178,000
Retire at 70 198,000 294,000 181,000 264,000
Based on the growth of an initial portfolio of $40,000 in a 401(k) plus maximum annual contributions to the 401(k), along with an employer matching contribution of 3% of salary, as well as saving an additional 10% or 20% of gross total compensation in a taxable account beginning in four years until retirement; assumes a growth allocation until retirement, assuming a confidence level that glides up as human capital declines, so that at retirement it is expected to support a sustainable future spending rate, after taxes and inflation, froma portfolio with a moderate allocation. “Big Law” total compensation maxes out at $390,000 per year, inflation-adjusted, by year 5; “In-House” total compensation maxes out at $330,000 per year, inflation-adjusted, by year 3. Growth allocation is 80% stocks/20% bonds. Moderate allocation is 60% stocks/40% bonds. Stocks are modeled as 21% US diversified, 21% US value, 21% US growth, 7% US small- and mid-cap, 22.5% developed international, and 7.5% emerging market. Bonds are modeled as intermediate-term diversified municipals in taxable accounts and intermediate-term taxable bonds in retirement accounts. Assumes top marginal federal income tax rates and a 6.5% state income tax rate. Based on Bernstein’s estimates of the range of returns for the applicable capital markets as of December 31, 2014. Data do not represent past performance and are not a promise of actual future results or a range of future results. See Notes on Wealth Forecasting System in the Appendix.Source: Bernstein
Work with younger investors to map and define financial goals
Strategize to stress-test plans that will provide high confidence level of achieving goals
Implement customized investment plan
Revisit and adapt plan as needs and goals change in the future
Partner with younger investors providing on-going education and research
How Bernstein Can Help?
Based on information supplied by the client. Bernstein is not a legal, tax or estate advisor. Investors should consult these professionals as appropriate before making any decisions.Source: AB

Appendix

Growth of Financial Capital vs. Core Capital Required for Retirement SpendingUSD Millions, Inflation-Adjusted
4.9 4.5 4.1
3.6
30 35 40 45 50 55 60 65 70Age
Save 10% After Taxes
Savings Rate: Conservative Savings Plan Pointing Toward Retirement at 65
Current Portfolio$40,000
Core Capital
Target financial capital is invested in a growth allocation; it is based on the growth of an initial portfolio of $40,000 in a 401(k) plus maximum annual contributions to the 401(k), along with an employer matching contribution of 3% of salary, as well as saving an additional 10% or 20% of gross total compensation in a taxable account beginning in four years until retirement.Core capital calculated at 90% level of confidence; assumes a moderate allocation and desired spending of $130,000 annually after taxes and inflation. Growth allocation is 80% stocks/20% bonds. Moderate allocation is 60% stocks/40% bonds. Stocks are modeled as 21% US diversified, 21% US value, 21% US growth, 7% US small- and mid-cap, 22.5% developed international, and 7.5% emerging market. Bonds are modeled as intermediate-term diversified municipals in taxable accounts and intermediate-term taxable bonds in retirement accounts. Based on Bernstein’s estimates of the range of returns for the applicable capital markets as of December 31, 2014. Data do not represent past performance and are not a promise of actual future results or a range of future results. See Notes on Wealth Forecasting System in the Appendix.Source: Bernstein
Growth of Financial Capital vs. Core Capital Required for Retirement SpendingUSD Millions, Inflation-Adjusted
4.9 4.5 4.1
3.6
30 35 40 45 50 55 60 65 70Age
Save 20% After Taxes
Increased Saving May Support Earlier Retirement
Current Portfolio$40,000
Core Capital
Target financial capital is invested in a growth allocation; it is based on the growth of an initial portfolio of $40,000 in a 401(k) plus maximum annual contributions to the 401(k), along with an employer matching contribution of 3% of salary, as well as saving an additional 10% or 20% of gross total compensation in a taxable account beginning in four years until retirement.Core capital calculated at 90% level of confidence; assumes a moderate allocation and desired spending of $130,000 annually after taxes and inflation. Growth allocation is 80% stocks/20% bonds. Moderate allocation is 60% stocks/40% bonds. Stocks are modeled as 21% US diversified, 21% US value, 21% US growth, 7% US small- and mid-cap, 22.5% developed international, and 7.5% emerging market. Bonds are modeled as intermediate-term diversified municipals in taxable accounts and intermediate-term taxable bonds in retirement accounts. Based on Bernstein’s estimates of the range of returns for the applicable capital markets as of December 31, 2014. Data do not represent past performance and are not a promise of actual future results or a range of future results. See Notes on Wealth Forecasting System in the Appendix.Source: Bernstein

1. Purpose and Description of Wealth Forecasting System Bernstein’s Wealth Forecasting SystemSM is designed to assist investors in making their long-term investment decisions as to their allocation of investments among categories of financial assets. Our planning tool consists of a four-step process: (1) Client-Profile Input: the client’s asset allocation, income, expenses, cash withdrawals, tax rate, risk-tolerance level, goals, and other factors; (2) Client Scenarios: in effect, questions that the client would like our guidance on, which may touch on issues such as when to retire, what his/her cash-flow stream is likely to be, whether his/her portfolio can beat inflation long-term, and how different asset allocations might affect his/her long-term security; (3) The Capital Markets Engine: our proprietary model that uses our research and historical data to create a vast range of hypothetical market returns, which takes into account the linkages within and among the capital markets, as well as their unpredictability; and (4) A Probability Distribution of Outcomes: based on the assets invested pursuant to the stated asset allocation, 90% of the estimated ranges of probable returns and asset values that the client could experience are represented within the range established by the 5th and 95th percentiles on “box-and-whiskers” graphs. However, outcomes outside this range are expected to occur 10% of the time; thus, the range does not guarantee results or establish the boundaries for all outcomes. Estimated market returns on bonds are derived taking into account yield and other criteria. An important assumption is that stocks will, over time, outperform long bonds by a reasonable amount, although this is in no way a certainty. Moreover, actual future results may not meet Bernstein’s estimates of the range of market returns, as these results are subject to a variety of economic, market, and other variables. Accordingly, the analysis should not be construed as a promise of actual future results, the actual range of future results, or the actual probability that these results will be realized. Of course, no investment strategy or allocation can eliminate risk or guarantee returns.
2. Retirement VehiclesEach retirement plan is modeled as one of the following vehicles: traditional IRA, 401(k), 403(b), Keogh, or Roth IRA/401(k). One of the significant differences among these vehicle types is the date at which mandatory distributions commence. For traditional IRA vehicles, mandatory distributions are assumed to commence during the year in which the investor reaches the age of 70.5; for 401(k), 403(b), and Keogh vehicles, mandatory distributions are assumed to commence at the later of: (1) the year in which the investor reaches the age of 70.5; or (2) the year in which the investor retires. In the case of a married couple, these dates are based on the date of birth of the older spouse. The minimum mandatory withdrawal is estimated using the Minimum Distribution Incidental Benefit tables, as published on www.irs.gov. For Roth IRA/401(k) vehicles, there are no mandatory distributions. Distributions from a Roth IRA/401(k) that exceed principal will be taxed and/or penalized if the distributed assets are less than five years old and the contributor is less than 59.5 years old. All Roth 401(k) plans will be rolled into a Roth IRA plan when the investor turns 59.5 years old, to avoid minimum distribution requirements.
3. RebalancingAnother important planning assumption is how the asset allocation varies over time. We attempt to model how the portfolio would actually be managed. Cash flows and cash generated from portfolio turnover are used to maintain the selected asset allocation between cash, bonds, stocks, REITs, and hedge funds over the period of the analysis. Where this is not sufficient, an optimization program is run to trade off the mismatch between the actual allocation and targets against the cost of trading to rebalance. In general, the portfolio is expected to be maintained reasonably close to the target allocation. In addition, in later years, there may be contention between the total relationship’s allocation and those of the separate portfolios. For example, suppose an investor (in the top marginal federal tax bracket) begins with an asset mix consisting entirely of municipal bonds in his/her personal portfolio and entirely of stocks in his/her retirement portfolio. If personal assets are spent, the mix between stocks and bonds will diverge from targets. We put primary weight on maintaining the overall allocation near target, which may result in an allocation to taxable bonds in the retirement portfolio as the personal assets decrease in value relative to the retirement portfolio’s value.
Notes on Wealth Forecasting System

4. Expenses and Spending Plans (Withdrawals)All results are generally shown after applicable taxes and after anticipated withdrawals and/or additions, unless otherwise noted. Liquidations may result in realized gains or losses, which will have capital-gains tax implications.
5. Modeled Asset ClassesThe following assets or indexes were used in this analysis to represent the various model classes:
Notes on Wealth Forecasting System (cont.)
Asset Class Modeled as... Annual Turnover Rate
Cash Equivalents 3-month Treasury bills 100%
Intermediate-Term Diversified Municipals AA-rated diversified municipal bonds of 7-year maturity 30
Intermediate-Term In-State Municipals AA-rated in-state municipal bonds of 7-year maturity 30
Intermediate-Term Taxables Taxable bonds of 7-year maturity 30
US Diversified Stocks S&P 500 Index 15
US Value Stocks S&P/Barra Value Index 15
US Growth Stocks S&P/Barra Growth Index 15
US Small-/Mid-Cap Stocks Russell 2500 Index 15
Developed International Stocks MSCI EAFE Unhedged Index 15
Emerging-Market Stocks MSCI Emerging Markets Index 20
Real Assets 1/3 FTSE NAREIT Index, 1/3 MSCI ACWI Commodity Producers Index, 1/3 DJ-UBS Commodity Index 30
Diversified Hedge-Fund Portfolio Diversified hedge-fund asset class 33
6. VolatilityVolatility is a measure of dispersion of expected returns around the average. The greater the volatility, the more likely it is that returns in any one period will be substantially above or below the expected result. The volatility for each asset class used in this analysis is listed on the Capital-Market Projections page at the end of these Notes. In general, two-thirds of the returns will be within one standard deviation. For example, assuming that stocks are expected to return 8.0% on a compounded basis and the volatility of returns on stocks is 17.0%, in any one year it is likely that two-thirds of the projected returns will be between (8.9)% and 28.8%. With intermediate government bonds, if the expected compound return is assumed to be 5.0% and the volatility is assumed to be 6.0%, two-thirds of the outcomes will typically be between (1.1)% and 11.5%. Bernstein’s forecast of volatility is based on historical data and incorporates Bernstein’s judgment that the volatility of fixed-income assets is different for different time periods.
7. Technical AssumptionsBernstein’s Wealth Forecasting System is based on a number of technical assumptions regarding the future behavior of financial markets. Bernstein’s Capital Markets Engine is the module responsible for creating simulations of returns in the capital markets. These simulations are based on inputs that summarize the current condition of the capital markets as of December 31, 2014. Therefore, the first 12-month period of simulated returns represents the period from December 31, 2014, through December 31, 2015, and not necessarily the calendar year of 2015. A description of these technical assumptions is available on request.

8. Tax Implications Before making any asset-allocation decisions, an investor should review with his/her tax advisor the tax liabilities incurred by the different investment alternatives presented herein, including any capital gains that would be incurred as a result of liquidating all or part of his/her portfolio, retirement-plan distributions, investments in municipal or taxable bonds, etc. Bernstein does not provide tax, legal, or accounting advice. In considering this material, you should discuss your individual circumstances with professionals in those areas before making any decisions.
9. Tax RatesBernstein’s Wealth Forecasting System has used various assumptions for the income tax rates of investors in the case studies. See the assumptions in each case study (including footnotes) for details. The federal income tax rate is Bernstein’s estimate of either the top marginal tax bracket or an “average” rate calculated based upon the marginal rate schedule. For 2014 and beyond, the maximum federal tax rate on investment income is 43.4% and the maximum federal long-term capital-gains tax rate is 23.8%. Federal tax rates are blended with applicable state tax rates by including, among other things, federal deductions for state income and capital-gains taxes. The state tax rate generally represents Bernstein’s estimate of the top marginal rate, if applicable.
10. Target Financial Capital AnalysisThe term “target financial capital” means the money you invest to grow over decades during the accumulation phase so that in retirement you will have the amount of money necessary to cover anticipated lifetime net spending. All financial assets in excess of this target financial capital are “potential surplus capital.” Bernstein estimates target financial capital by putting information supplied by the client, including current and expected future income and spending, into our Wealth Forecasting System, which simulates a vast range of potential market returns over the client’s anticipated life span. From these simulations we develop an estimate of the target financial capital the client will require today to grow over time to required core capital. Variations in actual income, applicable tax rates, and market returns may substantially impact the likelihood that a target financial capital estimate will be sufficient to grow to the desired level of core capital. Accordingly, the estimate should not be construed as a promise of actual future results, the actual range of future results, or the actual probability that the results will be realized.
11. Core Capital AnalysisThe term “core capital” means the amount of money necessary to cover anticipated lifetime net spending. All non-core-capital assets are termed “surplus capital.” Bernstein estimates core capital by inputting information supplied by the client, including expected future income and spending, into our Wealth Forecasting System, which simulates a vast range of potential market returns over the client’s anticipated life span. From these simulations we develop an estimate of the core capital the client will require to maintain his/her spending level over time. Variations in actual income, spending, applicable tax rates, life span, and market returns may substantially impact the likelihood that a core capital estimate will be sufficient to provide for future expenses. Accordingly, the estimate should not be construed as a promise of actual future results, the actual range of future results, or the actual probability that the results will be realized.
12. MortalityIn our mortality-adjusted analyses, the life span of an individual varies in each of our 10,000 trials in accordance with mortality tables. To reflect that high-net-worth individuals live longer than average, we subtract three years from each individual’s age (e.g., a 65-year-old would be modeled as a 62-year-old). Mortality simulations are based on the Society of Actuaries Retirement Plan Experience Committee Mortality Tables RP-2000.
Notes on Wealth Forecasting System (cont.)
13. Taxable TrustThe taxable trust is modeled as an irrevocable tax-planning or estate-planning vehicle with one or more current beneficiaries and one or more remainder beneficiaries. Annual distributions to the current beneficiary may be structured in a number of different ways, including: (1) an amount or a percentage of fiduciary accounting income (FAI) (which may be defined to include part or all of realized capital gains); (2) FAI plus some amount of principal, expressed as a percentage of trust assets or as an amount; (3) an annuity, or fixed dollar amount, which may be increased annually by inflation or by a fixed percentage; (4) a unitrust, or annual payment of a percentage of trust assets, based on the trust’s value at the beginning of the year or averaged over several years; or (5) any combination of the above four payout methods. The trust will pay income taxes on retained income and will receive an income distribution deduction for income paid to the current beneficiaries. Capital gains may be taxed in one of three ways, as directed: (1) taxed entirely to the trust; (2) taxed to the current beneficiaries to the extent the distributions exceed traditional income; or (3) taxed to the current beneficiaries on a pro rata basis with traditional income.
14. EndowmentThe endowment is modeled as a nontaxable permanent fund bestowed upon an institution to be used to support a specific purpose in perpetuity. The endowment may receive an initial donation and periodic funding from either the personal portfolio modeled in the system or an external source. Annual distributions from the endowment may be structured in a number of different ways, including: (1) an annuity or fixed dollar amount, which may be increased annually by inflation or by a fixed percentage; (2) a unitrust, or annual payout of a percentage of endowment assets, based on a single year or averaged over several years; (3) a linear distribution of endowment assets, determined each year by dividing the endowment assets by the remaining number of years; or (4) the greater of the previous year’s distribution or any of the above methods. These distribution policies can be varied in any given year.
15. Intentionally Defective Grantor Trust The intentionally defective grantor trust (IDGT) is modeled as an irrevocable trust whose assets are treated as the grantor’s for income tax purposes but not for gift or estate tax purposes. Some income tax and transfer tax consequences associated with transfers to, and the operation of, an IDGT remain uncertain, and the strategy may be subject to challenge by the IRS. Hence, this technique requires substantial guidance from tax and legal advisors. The grantor may give assets to the trust, which will require using gift tax exemptions or exclusions, or paying gift taxes. The IDGT is modeled with one or more current beneficiaries and one or more remainder beneficiaries. Distributions to the current beneficiaries are not required, but the system permits the user to structure annual distributions in a number of different ways, including: (1) an amount or a percentage of fiduciary accounting income (FAI) (which may be defined to include some or all realized capital gains); (2) FAI plus some principal, expressed either as a percentage of trust assets or as a dollar amount; (3) an annuity, or fixed dollar amount, which may be increased annually by inflation or by a fixed percentage; (4) a unitrust, or annual payment of a percentage of trust assets, based on the trust’s value at the beginning of the year or averaged over several years; or (5) any combination of the above four payout methods. Because the IDGT is modeled as a grantor trust, the system calculates all taxes on income and realized capital gains that occur in the IDGT portfolio each year, based on the grantor’s tax rates and other income, and pays them from the grantor’s personal portfolio. The IDGT may continue for the duration of the analysis, or the trust assets may be distributed in cash or in kind at a specific point in time or periodically to: (1) a non-modeled recipient; (2) a taxable trust; or (3) a taxable portfolio for someone other than the grantor. If applicable, an installment sale to an IDGT may be modeled as a user-entered initial “seed” gift followed by a sale of additional assets to the trust. The system will use one of two methods to repay the value of the sale assets plus interest (less any user-specified discount to the grantor): (1) user-defined payback schedule; or (2) annual interest-only payments at the applicable federal rate (AFR) appropriate for the month of sale and the term of the installment note, with a balloon payment of principal plus any unpaid interest at the end of the specified term.
Notes on Wealth Forecasting System (cont.)
16. Grantor Retained Annuity TrustThe grantor retained annuity trust (GRAT) is a wealth transfer vehicle that receives its initial funding from the grantor and transfers annuity payments to the grantor’s personal portfolio each year. The annuity amounts, which are determined in advance, may be fixed (the same amount each year) or increasing (growing each year by no more than 20% of the previous year’s amount). The annuity payment is made first from available cash, and then from other portfolio assets in kind. Because the GRAT is modeled as a grantor trust, the system calculates all taxes on income and realized capital gains that occur in the GRAT portfolio each year, based on the grantor’s tax rates and other income, and pays them from the grantor’s personal portfolio. When the GRAT term ends, the remainder, if any, may be transferred in cash or in kind (as the user specifies) to: (1) a non-modeled recipient; (2) a continuing grantor trust; or (3) a taxable trust. If the remainder is transferred in kind, the assets will have carryover basis.
17. Rolling Grantor Retained Annuity Trust The rolling grantor retained annuity trust (GRAT) is a wealth transfer strategy that consists of a series of GRATs. Each GRAT is a wealth transfer vehicle that receives its initial funding from the grantor and transfers annuity payments to the grantor’s personal portfolio. Each year, the annuity payments from all existing GRATs are used to establish a new GRAT. The annuity amounts, which are determined in advance, may be fixed (the same amount each year) or increasing (growing each year by no more than 20% of the previous year’s amount). Because the GRAT is modeled as a grantor trust, the system calculates all taxes on income and realized capital gains that occur in all GRAT portfolios each year, based on the grantor’s tax rates and other income, and pays them either from the grantor’s personal portfolio or, if specified, from annuity payments before funding the next GRAT. The remainders of all individual GRATs may be transferred in cash or in kind to: (1) a non-modeled recipient; (2) a continuing grantor trust; (3) a taxable trust; or (4) a taxable portfolio for someone other than the grantor. In each year in which a new GRAT is to be created (aside from year 1), we use our Capital Markets Engine to generate an IRS Section 7520 rate that is consistent with the concurrent yield-curve environment. Using this rate as a discount rate, we are able to continually construct new “zeroed-out” GRATs in an ever-changing interest-rate environment.
18. Charitable Remainder TrustThe charitable remainder trust (CRT) is modeled as a tax-planning or an estate-planning vehicle, which makes an annual payout to the recipient(s) specified by the grantor, and at the end of its term (which may be the recipient’s lifetime), transfers any remaining assets, as a tax-free gift, to a charitable organization. Depending on the payout’s structure, the CRT can be modeled as either a charitable remainder unitrust (CRUT) or a charitable remainder annuity trust (CRAT). The CRUT’s payout is equal to a fixed percentage of the portfolio’s beginning-year value, whereas the CRAT’s payout consists of a fixed dollar amount. In the inception year of the CRT, its grantor receives an income tax deduction typically equal to the present value of the charitable donation, subject to the applicable adjusted gross income (AGI) limits on charitable deductions and phaseout of itemized deductions, as well as the rules regarding reduction to basis of gifts to private foundations. Unused charitable deductions are carried forward up to five years. Although the CRT does not pay taxes on its income or capital gains, its payouts are included in the recipient’s AGI using the following four accounting tiers: Tier 1—Ordinary Income (Taxable Interest/Dividends); Tier 2—Realized Long-Term Capital Gains; Tier 3—Other Income (Tax-Exempt Interest); and Tier 4—Principal. CRTs are required to pay out all current and previously retained Tier 1 income first, all current and previously retained Tier 2 income second, all current and previously retained Tier 3 income third, and Tier 4 income last.
Notes on Wealth Forecasting System (cont.)

Median 30-Year Growth Rate
Mean Annual Return
Mean Annual Income
One-YearVolatility
30-Year Annual Equivalent Volatility
Cash Equivalents 3.1% 3.5% 3.5% 0.3% 10.1%
Intermediate-Term Taxables 4.3 4.7 5.9 4.5 8.5
Intermediate-TermDiversified Municipals 3.3 3.5 3.4 3.6 7.7
Intermediate-TermIn-State Municipals 3.2 3.5 3.4 3.6 7.7
US Diversified Stocks 7.1 8.7 2.8 14.4 19.5
US Value Stocks 7.4 8.9 3.3 14.3 19.2
US Growth Stocks 6.8 8.8 2.3 15.6 20.7
US Small-/Mid-Cap Stocks 7.2 9.3 2.4 16.1 21.6
Developed International Stocks 7.8 9.9 3.3 15.7 20.5
Emerging-Market Stocks 5.9 9.8 3.9 20.6 25.8
Real Assets 6.5 7.7 3.9 11.7 17.1
Diversified Hedge-Fund Portfolio 5.9 6.5 3.3 9.5 15.9
Inflation 2.9 3.3 N/A 1.1 11.5
19. Charitable Lead TrustThe charitable lead trust (CLT) is modeled as a portfolio that receives its initial funding from the grantor and transfers payments to one or more charitable recipients each year for a specified number of years or for the life or lives of certain individuals. The annual payments may be a fixed dollar amount (charitable lead annuity trust or CLAT) or a percentage of the trust’s assets as valued every year (charitable lead unitrust or CLUT). In the case of a CLAT, annuities may be fixed (the same amount each year), or increasing. The annual payment is generally made first from available cash and then from other trust assets in kind. In a non-grantor CLT, the trust itself is subject to income taxation, and generally pays income tax with respect to retained income and receives a charitable income tax deduction with respect to certain income paid to the charitable recipient(s). Realized capital gains may be taxable to the trust or treated as a distribution to charitable recipient(s) (and therefore eligible for a charitable income tax deduction), depending upon the provisions of the trust instrument and other factors. In a grantor CLT, the trust is a “grantor” trust for income tax purposes such that the grantor is personally taxed an all items of trust income. The grantor is entitled to a charitable income tax deduction upon funding for the portion of the CLT then calculated to be payable to the charitable recipient(s) over its term (often the entire funding amount). This charitable income tax deduction is subject to recapture rules if the grantor dies during the term of the CLT. For both the non-grantor and grantor CLT, when the CLT term ends, the remainder, if any, may be transferred as directed by the trust agreement, including to a non-modeled recipient, a taxable trust, or a beneficiary’s portfolio. The assets transferred from the CLT will have carryover cost basis.
20. Capital-Market Projections
Notes on Wealth Forecasting System (cont.)