Title: Feasibility Demonstration of Automated Sampling...
12
www.eppendorf.com Eppendorf, Inc. 175 Freshwater Boulevard Tel.: +1 860 253 3400 Enfield, CT 06082-4444, USA [email protected] Purpose: To provide a solution for automated glucose monitoring and feeding during a bioprocess run. For this phase, buffer and glucose were used to establish and validate the procedure. Introduction: This project is a collaborative effort between Roche, Flownamics, and Eppendorf. The following equipment was contributed by each company, including resources for set up and training on-site: Roche: Cedex Bio HT Analyzer (herein referred to as the Bio HT). The analyzer was equipped with reagents to measure glucose, lactate, glutamine, ammonia, and human IgG. In addition, Flownamics included a “flow cell” that allowed a sample from the bioreactor to be delivered to the Bio HT sample rack and accessed by the automated sampling system on board the Bio HT. Flownamics: SegFlow 4800, SegMod, and dip tube assembly. This automatic sampling device was used to deliver a sample of the bioreactor to the Bio HT for analysis. Furthermore, the software communicated with the Bio HT to collect data and deliver it via OPC to BioCommand Batch Control. Eppendorf: BioFlo 320, BioBLU® 3c Single-Use Vessel, BioCommand Batch Control SCADA software. The BioFlo 320 was used to control the BioBLU 3c Single-Use Vessel. BioCommand Batch Control was used to communicate via OPC with the SegFlow 4800 software, and also as a SCADA software to control and trend data from the BioFlo 320. BioCommand was able to capture data from the Bio HT via the connection to the SegFlow, and also to read/write other parameters such as the sample rate, sample and purge volume, etc. The goal of this project was to demonstrate that the instruments could be integrated in such a way that the following feedback loop was established: 1. Deliver a sample from bioreactor to the Bio HT using the SegFlow 4800. 2. Receive accurate glucose concentration measured from the Bio HT in BioCommand. 3. Implement a control program in BioCommand to use the newly acquired glucose concentration to automate the adjustment of the bioreactor glucose concentration using an external glucose stock solution. Title: Feasibility Demonstration of Automated Sampling and Glucose Control Using the BioFlo® 320, BioCommand®, SegFlow® 4800, and Cedex® Bio HT. Date: 4/20/2017 Prepared by: Stacey Willard, PhD; Senior Technical Applications Specialist
Transcript of Title: Feasibility Demonstration of Automated Sampling...

www.eppendorf.com
Eppendorf, Inc. 175 Freshwater Boulevard Tel.: +1 860 253 3400
Enfield, CT 06082-4444, USA [email protected]
Purpose:
To provide a solution for automated glucose monitoring and feeding during a bioprocess run. For
this phase, buffer and glucose were used to establish and validate the procedure.
Introduction:
This project is a collaborative effort between Roche, Flownamics, and Eppendorf. The following
equipment was contributed by each company, including resources for set up and training on-site:
Roche: Cedex Bio HT Analyzer (herein referred to as the Bio HT). The analyzer was equipped with
reagents to measure glucose, lactate, glutamine, ammonia, and human IgG. In addition, Flownamics
included a “flow cell” that allowed a sample from the bioreactor to be delivered to the Bio HT sample
rack and accessed by the automated sampling system on board the Bio HT.
Flownamics: SegFlow 4800, SegMod, and dip tube assembly. This automatic sampling device was
used to deliver a sample of the bioreactor to the Bio HT for analysis. Furthermore, the software
communicated with the Bio HT to collect data and deliver it via OPC to BioCommand Batch Control.
Eppendorf: BioFlo 320, BioBLU® 3c Single-Use Vessel, BioCommand Batch Control SCADA software.
The BioFlo 320 was used to control the BioBLU 3c Single-Use Vessel. BioCommand Batch Control was
used to communicate via OPC with the SegFlow 4800 software, and also as a SCADA software to
control and trend data from the BioFlo 320. BioCommand was able to capture data from the Bio HT
via the connection to the SegFlow, and also to read/write other parameters such as the sample rate,
sample and purge volume, etc.
The goal of this project was to demonstrate that the instruments could be integrated in such a way
that the following feedback loop was established:
1. Deliver a sample from bioreactor to the Bio HT using the SegFlow 4800.
2. Receive accurate glucose concentration measured from the Bio HT in BioCommand.
3. Implement a control program in BioCommand to use the newly acquired glucose
concentration to automate the adjustment of the bioreactor glucose concentration using an
external glucose stock solution.
Title: Feasibility Demonstration of Automated Sampling and Glucose Control Using the
BioFlo® 320, BioCommand®, SegFlow® 4800, and Cedex® Bio HT.
Date: 4/20/2017
Prepared by: Stacey Willard, PhD; Senior Technical Applications Specialist

www.eppendorf.com
4. Sample the bioreactor again to confirm the correct target concentration was achieved.
The setup is pictured in Figure 1and critical components are detailed in Figure 2.
Materials and Methods
Equipment
Consumables
Procedure
Results
Figure 1. A snapshot of the setup.
BioFlo 320
SegFlow 4800
Cedex Bio HT
www.eppendorf.com
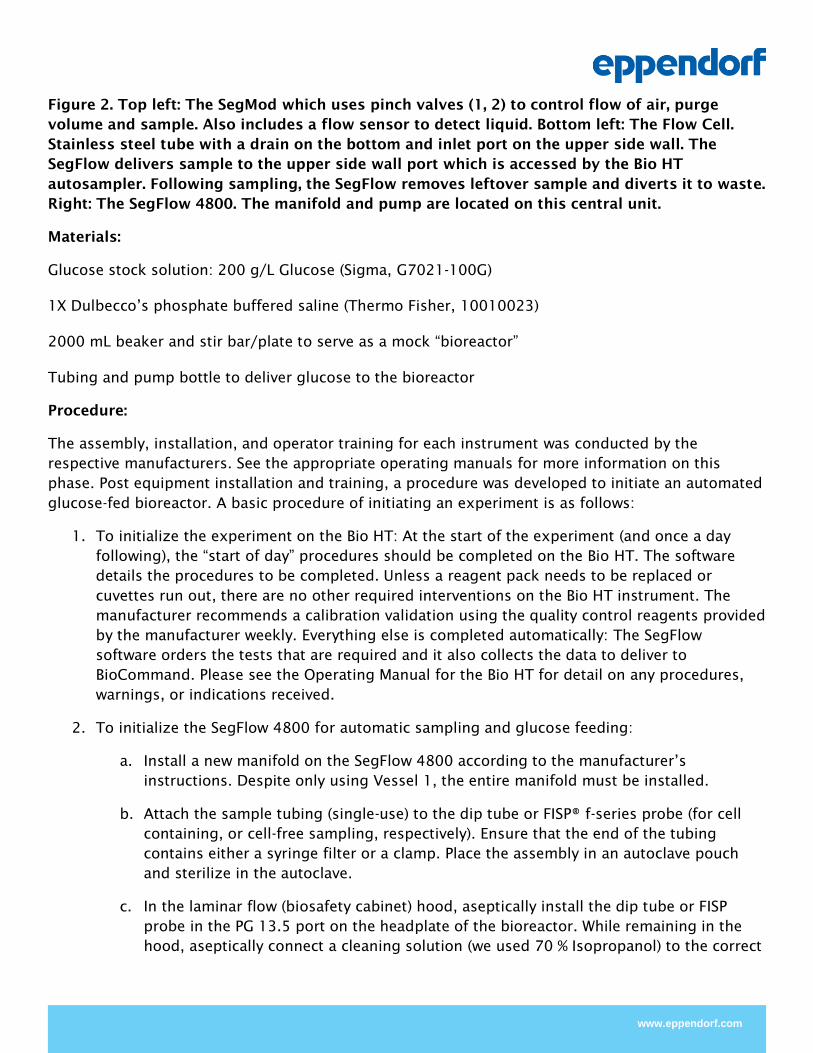
Figure 2. Top left: The SegMod which uses pinch valves (1, 2) to control flow of air, purge
volume and sample. Also includes a flow sensor to detect liquid. Bottom left: The Flow Cell.
Stainless steel tube with a drain on the bottom and inlet port on the upper side wall. The
SegFlow delivers sample to the upper side wall port which is accessed by the Bio HT
autosampler. Following sampling, the SegFlow removes leftover sample and diverts it to waste.
Right: The SegFlow 4800. The manifold and pump are located on this central unit.
Materials:
Glucose stock solution: 200 g/L Glucose (Sigma, G7021-100G)
1X Dulbecco’s phosphate buffered saline (Thermo Fisher, 10010023)
2000 mL beaker and stir bar/plate to serve as a mock “bioreactor”
Tubing and pump bottle to deliver glucose to the bioreactor
Procedure:
The assembly, installation, and operator training for each instrument was conducted by the
respective manufacturers. See the appropriate operating manuals for more information on this
phase. Post equipment installation and training, a procedure was developed to initiate an automated
glucose-fed bioreactor. A basic procedure of initiating an experiment is as follows:
1. To initialize the experiment on the Bio HT: At the start of the experiment (and once a day
following), the “start of day” procedures should be completed on the Bio HT. The software
details the procedures to be completed. Unless a reagent pack needs to be replaced or
cuvettes run out, there are no other required interventions on the Bio HT instrument. The
manufacturer recommends a calibration validation using the quality control reagents provided
by the manufacturer weekly. Everything else is completed automatically: The SegFlow
software orders the tests that are required and it also collects the data to deliver to
BioCommand. Please see the Operating Manual for the Bio HT for detail on any procedures,
warnings, or indications received.
2. To initialize the SegFlow 4800 for automatic sampling and glucose feeding:
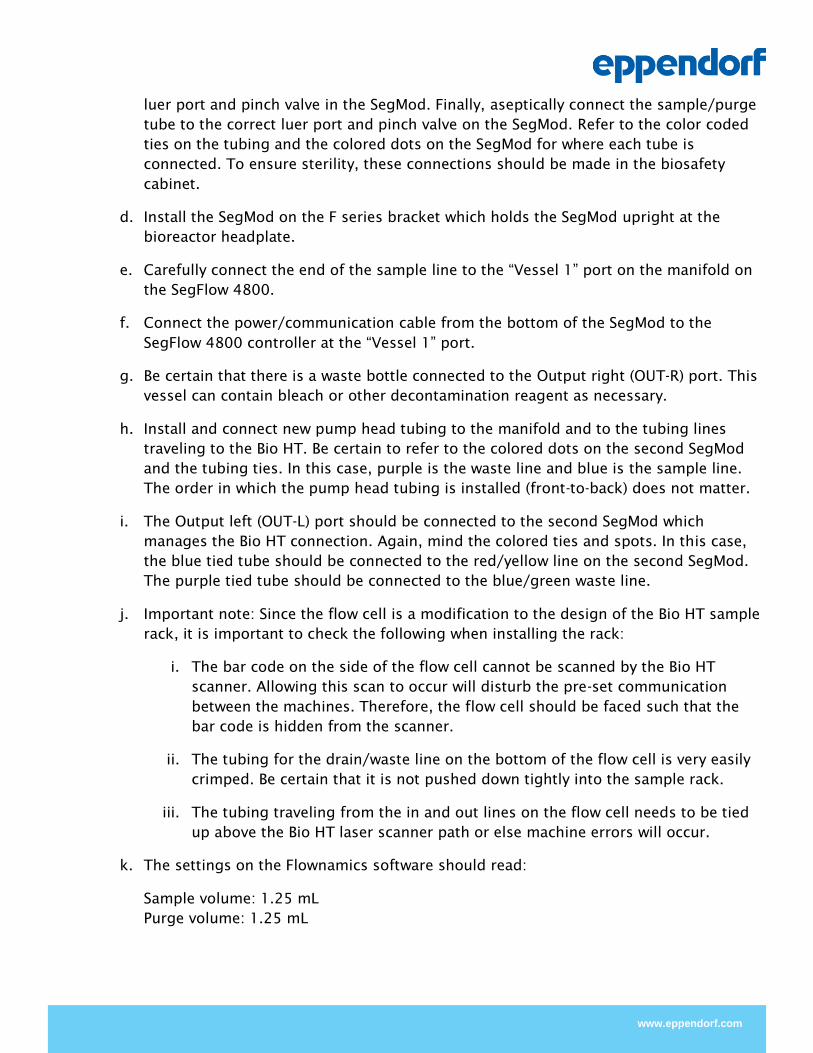
a. Install a new manifold on the SegFlow 4800 according to the manufacturer’s
instructions. Despite only using Vessel 1, the entire manifold must be installed.
b. Attach the sample tubing (single-use) to the dip tube or FISP® f-series probe (for cell
containing, or cell-free sampling, respectively). Ensure that the end of the tubing
contains either a syringe filter or a clamp. Place the assembly in an autoclave pouch
and sterilize in the autoclave.
c. In the laminar flow (biosafety cabinet) hood, aseptically install the dip tube or FISP
probe in the PG 13.5 port on the headplate of the bioreactor. While remaining in the
hood, aseptically connect a cleaning solution (we used 70 % Isopropanol) to the correct
www.eppendorf.com
luer port and pinch valve in the SegMod. Finally, aseptically connect the sample/purge
tube to the correct luer port and pinch valve on the SegMod. Refer to the color coded
ties on the tubing and the colored dots on the SegMod for where each tube is
connected. To ensure sterility, these connections should be made in the biosafety
cabinet.
d. Install the SegMod on the F series bracket which holds the SegMod upright at the
bioreactor headplate.
e. Carefully connect the end of the sample line to the “Vessel 1” port on the manifold on
the SegFlow 4800.
f. Connect the power/communication cable from the bottom of the SegMod to the
SegFlow 4800 controller at the “Vessel 1” port.
g. Be certain that there is a waste bottle connected to the Output right (OUT-R) port. This
vessel can contain bleach or other decontamination reagent as necessary.
h. Install and connect new pump head tubing to the manifold and to the tubing lines
traveling to the Bio HT. Be certain to refer to the colored dots on the second SegMod
and the tubing ties. In this case, purple is the waste line and blue is the sample line.
The order in which the pump head tubing is installed (front-to-back) does not matter.
i. The Output left (OUT-L) port should be connected to the second SegMod which
manages the Bio HT connection. Again, mind the colored ties and spots. In this case,
the blue tied tube should be connected to the red/yellow line on the second SegMod.
The purple tied tube should be connected to the blue/green waste line.
j. Important note: Since the flow cell is a modification to the design of the Bio HT sample
rack, it is important to check the following when installing the rack:
i. The bar code on the side of the flow cell cannot be scanned by the Bio HT
scanner. Allowing this scan to occur will disturb the pre-set communication
between the machines. Therefore, the flow cell should be faced such that the
bar code is hidden from the scanner.
ii. The tubing for the drain/waste line on the bottom of the flow cell is very easily
crimped. Be certain that it is not pushed down tightly into the sample rack.
iii. The tubing traveling from the in and out lines on the flow cell needs to be tied
up above the Bio HT laser scanner path or else machine errors will occur.
k. The settings on the Flownamics software should read:
Sample volume: 1.25 mL
Purge volume: 1.25 mL

www.eppendorf.com
Sample frequency: continuous (for this test, continuous sampling was used, but this
parameter is adjustable for customer-desired sample rates). Note that each cycle takes
about 45 min to complete, therefore continuous sampling is actually every 45 min.
3. To initiate a new experiment in BioCommand, be certain to establish a new Recipe that
includes the correct connection to the BioFlo 320 and the block logic program detailed in the
next section. Start a new Batch in the software for the current experiment. When the organism
is inoculated, be certain to both “run all programs” in the programming window and to “reset
EFT” in the batch control window (see below for details).
4. A protocol for initiating a bioreactor run using the BioFlo 320 is not detailed. Please refer to
the established protocol in your laboratory or the BioFlo 320 Operating Manual.
Automated Glucose Feeding
Once the hardware is confirmed to be connected properly and functioning, the software
communication can be established. This involves the following loops:
1. Bio HT & SegFlow 4800 Communication: Flownamics has established a method of
communication between the two instruments by which the SegFlow can order tests on the Bio
HT automatically and using the Flownamics OPC server, can transfer that data to a bioprocess
SCADA software. For detail on this link, please refer to Flownamics.
2. SegFlow 4800 and BioCommand Batch Control SCADA software Communication: Using the
Flownamics OPC server, certain control loops are read/write enabled and tags are available to
be brought into BioCommand for programming/scripting/track & trending purposes. The
following information was provided by Flownamics as a guide to what OPC tags are available:
a. The Bio HT has 43 different possible tests and each test has four tags associated with it
for a possible total of 172 Bio HT tags per vessel. The four tags are the time of the
sample, the value of the data, the unit of the data, and flags for the analysis (errors,
warnings, etc.). If no flags exist the Flags OPC tag will display 0-0-0-0. The formats of the
four different test tags are shown here:
SegFlow1.HT_Data.Vessel1.Chemistry_Type.Time
SegFlow1.HT_Data.Vessel1.Chemistry_Type.Value
SegFlow1.HT_Data.Vessel1.Chemistry_Type.Unit
SegFlow1.HT_Data.Vessel1.Chemistry_Type.Flags
A test tag will only appear on the available tags list in the OPC server after the SegFlow has
run a sample with that specific test activated and received that data from the Bio HT. Once the
SegFlow has received a specific test’s data, the test’s tags will be available permanently. So if
a test of interest is not listed as an available tag, the SegFlow will need to run a sample with
that test activated before creating a program.

www.eppendorf.com
It is recommended to have the B and D tests for an individual test activated on the SegFlow
interface and to have the Automatic Dilution on the Bio HT interface unchecked. This saves
half the time in the case where the B test is out of range. The B test is more accurate than the
D test, so if there are no flags for either test then use the B test value. If there is a flag for the
B test, but not the D test then use the D test value and vice-versa. Note: for this experiment,
we used only the B tag data for programming, but continued to track/trend the other tags.
b. Start/Stop tag. There are four tags per vessel that can be used to start/stop a vessel on
the SegFlow. It is recommended by Flownamics to use the Continuous NCommand tag.
The “resting position” of this tag is -1. Writing 1 to this tag will start the vessel and writing
0 will stop it. If the SegFlow is in the middle of sampling, it won’t stop until it finishes the
sample cycle. Note: When writing a 1/0 to the tag, the 1/0 value only stays that value for a
few seconds and then switches back to the -1 value. The format of the Continuous
NCommand tag is shown below.
SegFlow1.Vessel1.Continuous.NCommand
c. Sample frequency tag. The sample frequency of the SegFlow can be changed with this tag.
The units are in minutes. The format of the sample frequency tag is shown below. For the
purposes of this experiment, the ability to change sample frequency was not used, but it
is described here for future use.
SegFlow1.Vessel1.SampleFrequency
When establishing a BioCommand Recipe using data from the Flownamics software, the Flownamics
OPC server must be installed on the same computer as BioCommand Batch Control. In the Recipe
creation wizard, loops window, the required loops from the BioFlo 320 are added to the recipe, and
at the same time, loops can be established using the available OPC tags from the Flownamics OPC
server. To establish a new loop, drag the appropriate tag into the corresponding blank. For example,
to establish a loop to track the results of the glucose test without dilution, perform the following in
the indicated order:
1. In the OPC servers panel in the loops screen, navigate to:
Flownamics OPC server>SegFlow1>Vessel1.
2. Drag SegFlow1.HT_Data.Vessel1.GLC3B.Value into the PV blank FIRST.
3. Type a loop name into the name field: be sure to name the loop something recognizable and
short (this allows easy identification in the trend or programming screens). In this case,
simply GLC3B is appropriate.
4. Drag the SegFlow1.HT_Data.Vessel1.GLC3B.Unit into the Units blank.
5. Click ADD to add this loop to the recipe loops list.
For tracking and trending of process data, and for automated glucose feeding, the following OPC
tags were used to create control loops in the loops screen of the recipe wizard:

www.eppendorf.com
SegFlow1.HT_Data.Vessel1.GLC3B.Value & .Unit
SegFlow1.HT_Data.Vessel1.GLC3D.Value & .Unit
SegFlow1.HT_Data.Vessel1.GLN2B.Value & .Unit
SegFlow1.HT_Data.Vessel1.GLN2D.Value & .Unit
SegFlow1.HT_Data.Vessel1.IGGHB.Value & .Unit
SegFlow1.HT_Data.Vessel1.IGGHD.Value & .Unit
SegFlow1.HT_Data.Vessel1.LAC2B.Value & .Unit
SegFlow1.HT_Data.Vessel1.LAC2D.Value & .Unit
SegFlow1.HT_Data.Vessel1.LDH2B.Value & .Unit
SegFlow1.HT_Data.Vessel1.LDH2D.Value & .Unit
SegFlow1.HT_Data.Vessel1.NH3B.Value & .Unit
SegFlow1.Vessel1.Continuous.NCommand
SegFlow1.Vessel1.SampleVolume
SegFlow1.Vessel1.SampleFrequency
SegFlow1.Vessel1.PurgeVolume
Once the loops are added and the recipe created, the “programming” feature can be utilized to use
the loop data to trigger a glucose feed. This requires the following programs, broken into steps for
ease of explanation.
STEP 1: Validate that the incoming data is within the accuracy range provided by Roche for the
glucose test (GLC3B). This portion of the program determines if the provided concentration is above
the minimum of 0.02 g/L and below the maximum of 7.5 g/L glucose. If this comparison is TRUE,
the value is deposited into a user-defined loop called “GLC_VAL.” If it is FALSE, a value of -10 is
populated in GLC_VAL. The second line deposits the glucose concentration (GLC3B) into the user-
defined loop “GLC_CALC” only if the value of GLC_VAL is positive. Therefore, GLC_CALC is >0 only if
it passed the validation test. In this way, feeding will only occur if the value is within the accurate
measurable range of the instrument. If a 0 value is used in GLC_CALC, the result of the rest of the
equations will be 0 and no feeding will occur.
Figure 3. Step 1 of the block logic program to control glucose feeding: Validation.
Step 2. Calculate the amount of glucose to feed and convert that value into a time that the glucose
feed pump needs to run for in minutes. There are many ways to use block logic or visual basic

www.eppendorf.com
programming to accomplish a nutrient feed. The way that is shown here is only one option. The
following assumptions were made for this example – the user should keep in mind that any
numerical field is customizable to the current process requirements:
A. Glucose target concentration in the bioreactor: 3 g/L
B. Concentration of the glucose stock solution used for feeing: 200 g/L
C. Bioreactor current working volume: 1 L
D. Variable speed pump setpoint: 5 mL/min
These variables can be adjusted to meet the needs of different culture methods (batch, fed-batch
etc.). See the letter designations on the program below to illustrate which numerical value
corresponds to which variable.
The following equations are illustrated in the block logic program pictured in Figure 4:
(1) GLCtarget – GLC_CALC * WV = GLC_FEED_CALC
Where:
GLCtarget = the target glucose concentration (A)
GLC_CALC = Validated glucose concentration from Step 1 in g/L
WV = working volume of the bioreactor in L (C)
GLC_FEED_CALC = user-defined loop to store the amount of glucose in grams required to feed
the bioreactor to target concentration
(2) GLC_FEED_CALC / GLCstock / PumpSP = PUMP_DUR
Where:
GLC_FEED_CALC = user-defined loop representing grams of glc necessary to feed the bioreactor
to target concentration
GLCstock = concentration in g/L of the feed stock (B)
PumpSP = setpoint of the pump in mL/min (D)
PUMP_DUR = user-defined loop to store the number of min the pump needs to run to feed the
appropriate amount of GLC
Next Steps (If Any)
Figure 4. Equations to calculate pump run duration (min) in block logic programming format.
Equation 1 Equation 2 A
C
B
D
www.eppendorf.com
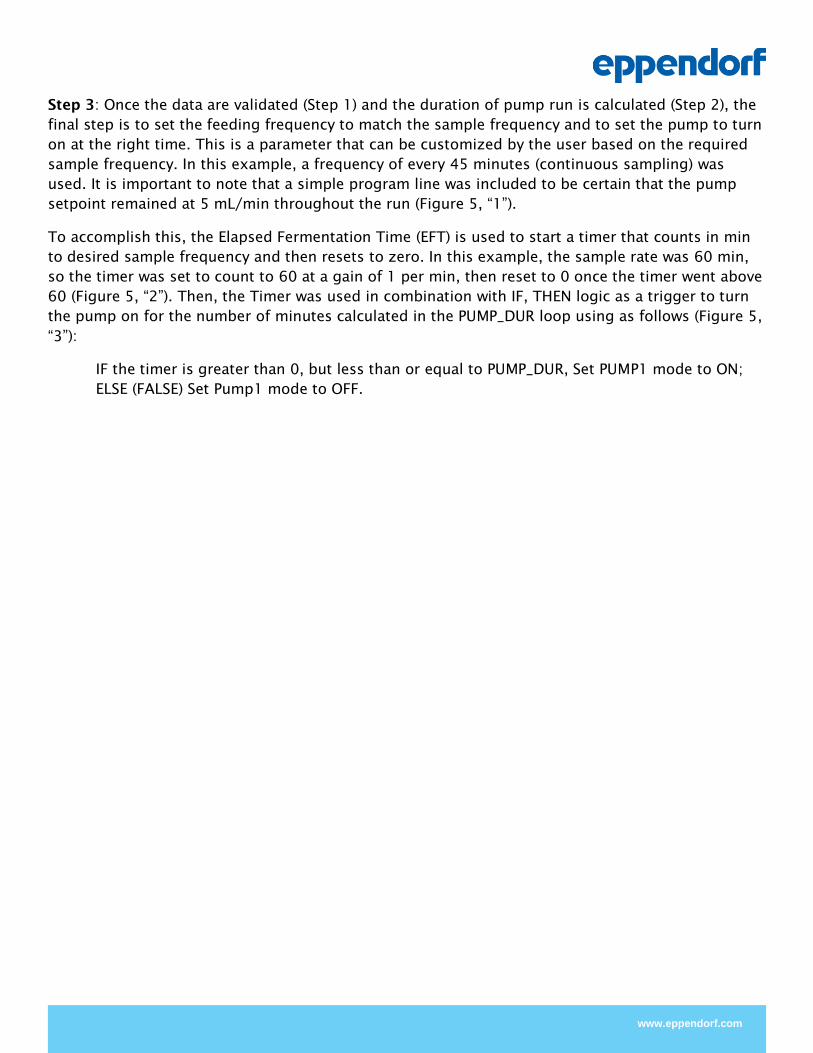
Step 3: Once the data are validated (Step 1) and the duration of pump run is calculated (Step 2), the
final step is to set the feeding frequency to match the sample frequency and to set the pump to turn
on at the right time. This is a parameter that can be customized by the user based on the required
sample frequency. In this example, a frequency of every 45 minutes (continuous sampling) was
used. It is important to note that a simple program line was included to be certain that the pump
setpoint remained at 5 mL/min throughout the run (Figure 5, “1”).
To accomplish this, the Elapsed Fermentation Time (EFT) is used to start a timer that counts in min
to desired sample frequency and then resets to zero. In this example, the sample rate was 60 min,
so the timer was set to count to 60 at a gain of 1 per min, then reset to 0 once the timer went above
60 (Figure 5, “2”). Then, the Timer was used in combination with IF, THEN logic as a trigger to turn
the pump on for the number of minutes calculated in the PUMP_DUR loop using as follows (Figure 5,
“3”):
IF the timer is greater than 0, but less than or equal to PUMP_DUR, Set PUMP1 mode to ON;
ELSE (FALSE) Set Pump1 mode to OFF.

www.eppendorf.com
Figure 5. Step 3 in using block logic programming to automatically maintain a glucose target concentration in
the bioreactor.
Finally, the programs must all be “RUN” by right clicking on any red oval and selecting “RUN ALL” when feeding
should begin.
Results
To test this setup and the block logic automatic feeding program, we ran an experiment with a “mock”
bioreactor (see materials). To validate that the correct glucose concentration was being delivered, an
independent analyzer (Roche Cedex Bio) was used to test glucose concentration at various random timepoints.
Table 1 presents these data. Figure 6 shows the glucose concentration in graphical form with the glucose
pump process value (Pump 1 PV) also displayed. Each time the glucose concentration is under the target (3.0
g/L) when the trigger timer resets to 0, the pump runs at the appropriate time to return the concentration to 3
g/L. A simulated glucose “demand” was created by replacing some of the bioreactor volume with 1X PBS and
each time, the program feeds as appropriate.
1
2
3

www.eppendorf.com
Table 1: Correlation between Bio HT data that was autosampled from the bioreactor using the SegFlow 4800
and the data from a manual sample analyzed with the Bio. The table also notes when the pump was
automatically turned on to feed, and what interventions were performed to create a glucose “demand.”
Time
(min)
[GLC] (g/L)
Bio HT
[GLC] (g/L)
Bio
Pump
Action
Note
0 3.24 3.1 N/A replace volume with 1X PBS
45 0.14 Feed
90 2.3 2.55 Feed
135 3 N/A
180 2.9 2.89 Feed
225 3.13 2.89 N/A
270 1.63 1.64 Feed replace 1/2 volume with 1X PBS
315 2.73 Feed
360 2.98 3.13 N/A

www.eppendorf.com
Figure 6. The graph above represents the glucose concentration from the SegFlow autosampler and the Pump
process value (PV).
Conclusions
As shown in the graph and table above, there is sufficient correlation between the offline analyzer data and
the autosampler data to conclude that a running bioreactor can be automatically maintained at a chosen
glucose target concentration using this setup. The BioCommand block logic program was designed in such a
way to allow maximum flexibility and customization.
It is important to note that in this experiment using a mock bioreactor, no cells or particulates were present,
therefore we used the flow sensors and a standard open dip tube to for sampling. If a live cell run is
performed, the FISP probe is necessary to remove cells and debris from the supernatant to allow the SegFlow
4800 to function properly. However, as long as conditions are maintained such that no clogging or flow
restrictions occur, this setup works quite well for automated glucose feeding without human intervention. Our
success so far comes from the setup that utilized inline flow sensors. Attempts were also made to estimate
flow volume using pump rotations without the flow sensor to allow for cell-containing sampling, however
those attempts were not successful. The use of inline fluid sensors requires FISP probe in a live cell culture
environment, which may reduce the capability in sampling robustness. The ability to collect large numbers of
samples using FISP probe without clogging in a prolonged culture such as perfusion may be challenging.
The ability to remove the need for manual sampling to maintain glucose concentration in a growing bioreactor
presents many advantages. First, less manual sampling reduces the contamination risk throughout the run.
Second, less human intervention and calculation reduces the error rate in feeding the bioreactor. Third, the
ability to set the sample frequency for as often or desired allows flexibility that is difficult to achieve with
manual sampling. If a sample is required in the middle of the night, FTE resources need not be spent.
For these reasons, this project is of high value to all of the involved companies and our data illustrates that the
setup works as predicted.