Time 7.30 pm Kenton Porker – SARDI ‘A new look at barley ...
16
Speakers Kenton Porker – SARDI ‘A new look at barley agronomy – how to make more money growing barley!’ Michael Zerner – SARDI Ben Fleet – University of Adelaide ‘Clethodim tolerance in canola’ Michael will present some interesting findings on this topic and Ben will tackle alternatives to Clethodim resistance. Paul Telfer - AGT ‘Heat stress in wheat’ Paul will discuss heat stress tolerance in different wheat varieties, including the timing of the stress and what actually causes the damage to yields and quality. ABN: 68 746 893 290 NEWSLETTER No. 290 FEBRUARY, 2014 EDITOR – Tony Rathjen, articles welcome; fax: (08) 8303 6735 Ph: 0408 816 533 email: [email protected] TREASURER – Subscriptions SECRETARY – Correspondence Susan Fuss Larn McMurray [email protected] PO Box 822 Ph: 0407 900 055 Clare 5453 Ph: (08) 8842 6265 Next Meeting ‘Agronomy, there’s always more to learn!’ Venue Richardson Theatre, Roseworthy Campus Date WEDNESDAY 19 th FEBRUARY Time 7.30 pm
Transcript of Time 7.30 pm Kenton Porker – SARDI ‘A new look at barley ...
Speakers Kenton Porker – SARDI
‘A new look at barley agronomy – how to make more money growing barley!’ Michael Zerner – SARDI Ben Fleet – University of Adelaide
‘Clethodim tolerance in canola’ Michael will present some interesting findings on this topic and Ben will tackle alternatives to Clethodim resistance. Paul Telfer - AGT
‘Heat stress in wheat’
Paul will discuss heat stress tolerance in different wheat varieties, including the timing of the stress and what actually causes the damage to yields and quality.
ABN: 68 746 893 290
NEWSLETTER No. 290 FEBRUARY, 2014 EDITOR – Tony Rathjen, articles welcome; fax: (08) 8303 6735 Ph: 0408 816 533 email: [email protected]
TREASURER – Subscriptions SECRETARY – Correspondence Susan Fuss Larn McMurray [email protected] PO Box 822
Ph: 0407 900 055 Clare 5453 Ph: (08) 8842 6265 Next Meeting ‘Agronomy, there’s always more to learn!’ Venue Richardson Theatre, Roseworthy Campus
Date WEDNESDAY 19th FEBRUARY
Time 7.30 pm
Land Speculators of SA, 1834 to 1845
It has often been a matter of local pride that South Australia did not have its origin as a penal colony as was the case with most of the other Australian states. But the actual motives of those who were so anxious to establish a colony have been glossed over. If we begin with a quote from Morphett, a very prominent early settler, their motives become apparent, 'The purchase of land in new colonies experience has shown to be one of the most profitable modes of employing capital which commercial enterprise on speculation has ever discovered....' (D Pike, Paradise of Dissent, recommended read for those who wish to follow SA history). The land speculation is illustrated on the accompanying map which was enthusiastically examined by our morning tea gang. The study of SA history has almost entirely fallen out of the curriculum This history can be discussed in three distinct phases: • 1834 to 1840 - unbridled land speculation and complete disregard for Indigenous
land ownership, • 1840 and 1841 - SA bankruptcy and realisation of the Indigenous ownership, • 1841 to 1845 - the Colonial Office (UK) takes over, Grey as Governor, austerity and
SA set on firm foundation. The coterie of land speculators gathered, initially, around EG Wakefield, who perhaps should be regarded as an accomplished, aristocratic spiv, and evolved through several versions until their colonisation proposal was accepted by the Colonial Office. The original Act passed in 1834, failed to mention the Indigenous inhabitants. Gouger was the messenger scurrying between the various versions of the committees and the Colonial Office seeking a legislative compromise. 1834 - 1840 Some aspects of the plan need to be mentioned • The Government insisted that the colony should be self-funding and that such
funds should be in hand (£35,000) before emigration began. This was achieved by pre-selling 437 preliminary land orders at £81, each entitling the purchaser to a country section of 80 acres and a town allotment of one acre. First choice of selection was a privilege offered to these preliminary purchasers.
• Proceeds from the land sales were to be solely used to fund the migration of labourers who were to work for the 'superior' settlers. A hierarchal society was clearly envisaged. Perkins, (who wrote the other useful history 'An Agricultural and Pastoral State in the Making') suggested that this was a reaction to the Reform Bill of 1832.
• A duel system of government was implemented. The accompanying land sales and funding were the province of the Crown Commissioners and the Governor responsible to the Colonial Office, but were appointed in consultation with the Crown commissioners. Official appointments by the Crown Commissions were generally among the unedifying inept and drawn from the final version of the coterie of Land speculators, the Adelphi Planners.
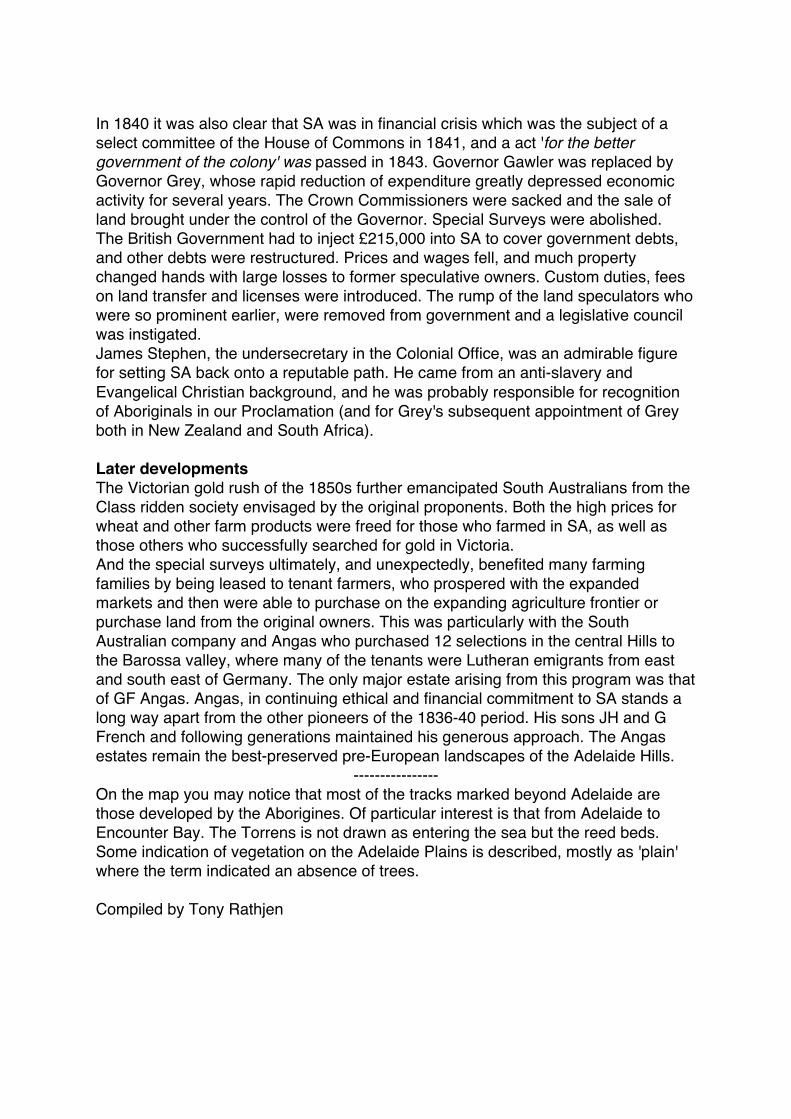
R Torrens, as Chairman of the Crown Commissioners, and O Gilles as Colonial Treasurer were the major figures and primarily responsible for the 1840 bankruptcy, but Governor Gawler has generally been blamed. On the map six districts, A- F inland from the coast from Adelaide to Encounter Bay, are outlined. These were successively surveyed and released for selection from 1837-1840, with those with preliminary land orders having the first choice. An astonishing agitation for rapid surveying and release is a feature of the politics of the period and indicative of preoccupation with land selection. Light, the Surveyor General who was both capable and reputable, was subject to intense criticism even as he was unwell and understaffed. After his demise, an inaccurate 'running surveying' method was adopted with surveying costs ultimately reduced to 3.5d per acre. Mostly it failed to record significant land features, which would have informed the original purchasers and now even those interested in landscape changes. In July 1838 the resident commissioner expanded the area from 150 square miles in District A, immediately adjacent to Adelaide, to an additional 1,000 square miles in southern Districts to meet dissatisfaction of preliminary purchasers! By late 1839 200,000 acres had been marked out. As to be expected from this history, few of the sections were taken up for farming, many sections were sold much later, and there was little speculation in rural land. But this was not the case with the town allotments where there was an enormous financial bubble with town acres commonly selling for up to £300 and even to £1,500. Another astonishing scramble for land occurred in 1839 and early 1840 with the implementation of the Special Surveys (marked in red on the map) further into the Adelaide Hills and beyond. Basically the purchaser outlined an area of 15,000 acres, paid £4,000, and became entitled to choose some 4,000 acres from the survey. This scheme was dormant until Dutton, McFarlane and Finnis applied for a special survey near Mt Barker in January 1839; two hundred and forty acres were on sold to the Hahndorf settlers at £7per acre. By the end of 1840 a total of 37 Special Selections had been purchased. Even at the time the Scheme was viewed as unscrupulous. Frome, the Surveyor General, described them 'as a vicious system of cutting up the country' and Sturt wrote 'Certainly the country here has been deliberately and recklessly sacrificed... The Special Surveys have acquired all that is valuable in the shape of water to a few individuals and rendered invaluable more than one third of the provincial lands...'. 1840/45 In July 1840 it became incontestable to ignore Indigenous land ownership with the publication of the 'Aboriginal Language of South Australia' by the Lutheran Missionaries, Teichelmann and Schurmann. Burka, the owner of the land, and 'Pangkarra', the district or tract of country belonging to an individual which he inherits from his father, were defined. Encounter Bay Bob applied for and was granted three sections and a intense debate erupted in the Government Gazette and Register. We can assume that virtually everyone in the state knew of the ownership issue and the Register published the first scurrilous denigration of Indigenous People from an Old Settler in the following issue. It marks the beginning of our communityʼs amnesia on this issue.
In 1840 it was also clear that SA was in financial crisis which was the subject of a select committee of the House of Commons in 1841, and a act 'for the better government of the colony' was passed in 1843. Governor Gawler was replaced by Governor Grey, whose rapid reduction of expenditure greatly depressed economic activity for several years. The Crown Commissioners were sacked and the sale of land brought under the control of the Governor. Special Surveys were abolished. The British Government had to inject £215,000 into SA to cover government debts, and other debts were restructured. Prices and wages fell, and much property changed hands with large losses to former speculative owners. Custom duties, fees on land transfer and licenses were introduced. The rump of the land speculators who were so prominent earlier, were removed from government and a legislative council was instigated. James Stephen, the undersecretary in the Colonial Office, was an admirable figure for setting SA back onto a reputable path. He came from an anti-slavery and Evangelical Christian background, and he was probably responsible for recognition of Aboriginals in our Proclamation (and for Grey's subsequent appointment of Grey both in New Zealand and South Africa). Later developments The Victorian gold rush of the 1850s further emancipated South Australians from the Class ridden society envisaged by the original proponents. Both the high prices for wheat and other farm products were freed for those who farmed in SA, as well as those others who successfully searched for gold in Victoria. And the special surveys ultimately, and unexpectedly, benefited many farming families by being leased to tenant farmers, who prospered with the expanded markets and then were able to purchase on the expanding agriculture frontier or purchase land from the original owners. This was particularly with the South Australian company and Angas who purchased 12 selections in the central Hills to the Barossa valley, where many of the tenants were Lutheran emigrants from east and south east of Germany. The only major estate arising from this program was that of GF Angas. Angas, in continuing ethical and financial commitment to SA stands a long way apart from the other pioneers of the 1836-40 period. His sons JH and G French and following generations maintained his generous approach. The Angas estates remain the best-preserved pre-European landscapes of the Adelaide Hills.
---------------- On the map you may notice that most of the tracks marked beyond Adelaide are those developed by the Aborigines. Of particular interest is that from Adelaide to Encounter Bay. The Torrens is not drawn as entering the sea but the reed beds. Some indication of vegetation on the Adelaide Plains is described, mostly as 'plain' where the term indicated an absence of trees. Compiled by Tony Rathjen
1839 – 1841 map of Districts A to F, showing along the coastline of St Vincent’s Gulf and the special selections (1839-40) further inland into the Adelaide Hills
Do we need to revisit potassium? Rob Norton
International Plant Nutrition Institute, http://anz.ipni.net Take home messages
• Potassium is one of the essential macronutrients, along with N, P and S. • Sandy, acid soils in high rainfall areas are most prone to K deficiency, particularly if
cut for hay. • Critical Colwell-K soil test ranges have been better defined for wheat, canola and
lupins from the Better Fertilizer Decisions project. • Sample depth, soil CEC, yield potential, soil water content, row width, presence of
other cations and crop species all affect the critical soil test range.
Potassium in soils and plants As management improves and yields increase, the extraction and relocation of nutrients also increases. Regional nutrient budgets show a progressive drawdown of potassium (K) as it is removed in plant products, and depending on cropping system and soils, there may be a need to consider the role of K. Use of K in Australia declined from 183 kt K in 2003 to 149 kt K in 2011 but did recover somewhat in 2012. At present around 75% of the K used is muriate of potash (MOP), also called sylvite (KCl) and about 1/3rd is used in WA, 1/3rd in Queensland and the balance across the other states. Potassium (K) is a mineral nutrient essential to both plants and animals. Most of our annual crops contain about the same amounts of N and K, but K content of many high-yielding crops can demand more K than N. Unlike other nutrients, K does not form compounds in plants, but remains free in ionic form to 'regulate' many essential processes including enzyme activa-tion, photosynthesis, water use efficiency, starch formation and protein synthesis. Potassium plays a significant role in stomatal control so adequate K is often associated with some drought tolerance, and small grain can be a consequence of deficiency. Within general limits, neither grain protein (cereals) nor oil content (canola) are affected by K supply. Table1. Potassium uptake by crops (Brennan pers. comm., Reuter pers. comm.)
Crop Use N uptake kg/t
K content
kg/t
Yield t/ha
K removal kg/ha
Wheat Growth 25 Wheat Grain 5 3 15 Wheat Straw 15 5 75
Wheat Hay 20 6 120 Canola Growth 30
Canola Grain 10 2 20 Canola Straw 25 4 14
Canola Hay 35 5 175 In South Australia about 10% of top 10 cm soil test values were less than a general lower limit of 100 mg/kg Colwell K, so the deficiency is not widespread. Low soil K values are predominately on the sandy grazing soils of the South East region (especially along the Coorong), parts of the Mount Lofty Ranges, Kangaroo Island and southern Mallee regions. Soils with marginal status are sandier soils on Eyre region. Consistently high values were
observed in the northern and Yorke Peninsula cropping regions (Australian Agricultural Assessment 2001). Table 1 shows K contents in wheat and canola crops cut for hay or left for grain. The K content of hay is much higher than the K content of grain, and as well the biomass in a hay crop will be more than the mass of grain removed so that around ten times more K will be removed in hay than grain. Potassium concentration in the stubble of both canola and wheat is higher than in the seed, and if the stubble is burned, 30-40% of this K will be lost (Heard et al. 2006). If the stubble is retained, a lot of the K will be recycled through the topsoil, and unless the straw is spread, K can accumulate under the windrows, which is a reasonable field observation to diagnose K limitation. As well as the amount of K demanded, the pattern of K uptake varies among crops. Some crops like maize takes up 50% of its K when it has accumulated only 30% of its peak biomass. In this crop, early K supply is important and early K stress cannot be remedied by tactical K applications. Rose et al. (2006) found that maximum K accumulation in wheat was around anthesis, but canola peaked a little later and had around 20% more K than wheat. Because K demand is quite high early, K should be applied early rather than later, and applications at booting in wheat or bud formation in canola are ineffective. Lupin is less responsive to applied K than either wheat or canola (Brennan 2012) and this is reflected in the lower critical Colwell K values (Table 2). Horticultural crops such as potatoes have very high demands. Plants take up potassium actively and there are two mechanisms that operate depending on K concentration. Competition for uptake occurs between K and other monovalent ions such as sodium, and also between K and calcium and magnesium. The result can be low tissue Mg which is grazed pastures can induce grass tetany (if soil K/(Ca+Mg)<0.07, grass tetany is likely). The interactions among cations are quite complex and Na can replace part of the K demand of crops in mildly stressed cereals (Ma et al. 2011). Potassium Deficiency Symptoms One of the most common K deficiency symptoms is scorching or firing along leaf margins, usually appearing on older leaves first. Potassium deficient plants grow slowly and develop poor root systems. Stalks are weak and lodging is common. Crops show lower resistance to disease and moisture stress. Potassium in Soils Most soils contain large amounts of K, which is present in clay minerals such as smectites, which are rich in K. However, probably less than 2% of the total soil K content is available to plants over the growing season, as most of it is a structural part of the clays. K exists in four forms.
• Structural K – held in the lattice of soil minerals such as micas and feldspars. This is unavailable except over geologic time scales.
• Fixed or interlayer K is trapped between layers of certain soil clays. This K is only very slowly available. The availability of this fraction is least reliably measured in soil tests, but it is the fraction that can be slowly depleted over time and this depletion will not show up in exchangeable or solution K soil tests.
• Exchangeable K is present on the surface of clay and organic colloids and the size of this fraction depends on the CEC of the soil as well as its pH. K is displaced in acid soils.
• Solution K is found in soil water and moves by diffusion to the plant root.
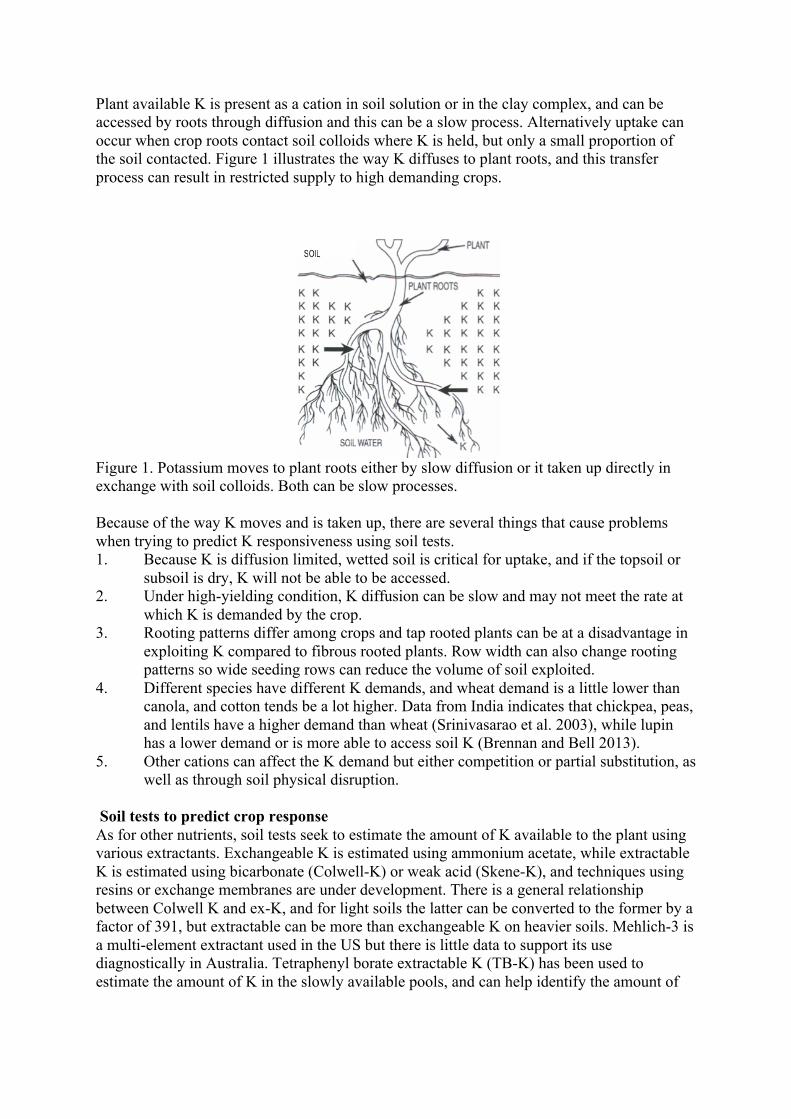
Plant available K is present as a cation in soil solution or in the clay complex, and can be accessed by roots through diffusion and this can be a slow process. Alternatively uptake can occur when crop roots contact soil colloids where K is held, but only a small proportion of the soil contacted. Figure 1 illustrates the way K diffuses to plant roots, and this transfer process can result in restricted supply to high demanding crops.
Figure 1. Potassium moves to plant roots either by slow diffusion or it taken up directly in exchange with soil colloids. Both can be slow processes. Because of the way K moves and is taken up, there are several things that cause problems when trying to predict K responsiveness using soil tests. 1. Because K is diffusion limited, wetted soil is critical for uptake, and if the topsoil or
subsoil is dry, K will not be able to be accessed. 2. Under high-yielding condition, K diffusion can be slow and may not meet the rate at
which K is demanded by the crop. 3. Rooting patterns differ among crops and tap rooted plants can be at a disadvantage in
exploiting K compared to fibrous rooted plants. Row width can also change rooting patterns so wide seeding rows can reduce the volume of soil exploited.
4. Different species have different K demands, and wheat demand is a little lower than canola, and cotton tends be a lot higher. Data from India indicates that chickpea, peas, and lentils have a higher demand than wheat (Srinivasarao et al. 2003), while lupin has a lower demand or is more able to access soil K (Brennan and Bell 2013).
5. Other cations can affect the K demand but either competition or partial substitution, as well as through soil physical disruption.
Soil tests to predict crop response As for other nutrients, soil tests seek to estimate the amount of K available to the plant using various extractants. Exchangeable K is estimated using ammonium acetate, while extractable K is estimated using bicarbonate (Colwell-K) or weak acid (Skene-K), and techniques using resins or exchange membranes are under development. There is a general relationship between Colwell K and ex-K, and for light soils the latter can be converted to the former by a factor of 391, but extractable can be more than exchangeable K on heavier soils. Mehlich-3 is a multi-element extractant used in the US but there is little data to support its use diagnostically in Australia. Tetraphenyl borate extractable K (TB-K) has been used to estimate the amount of K in the slowly available pools, and can help identify the amount of
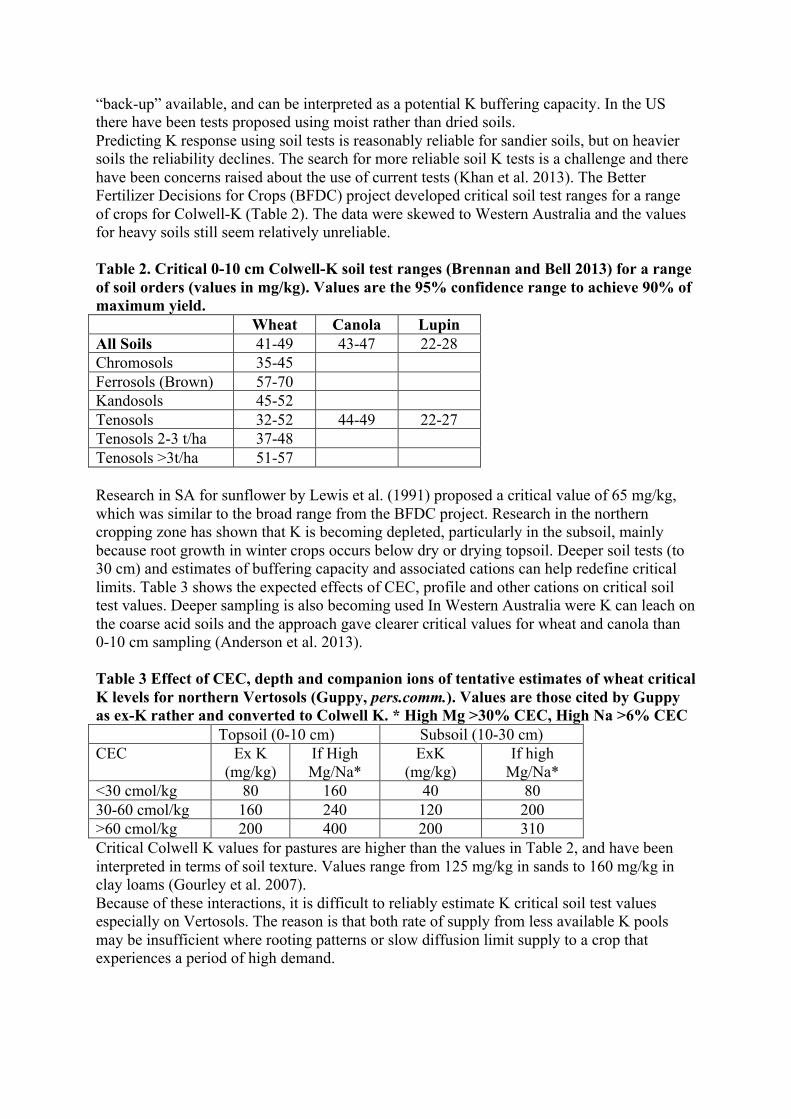
“back-up” available, and can be interpreted as a potential K buffering capacity. In the US there have been tests proposed using moist rather than dried soils. Predicting K response using soil tests is reasonably reliable for sandier soils, but on heavier soils the reliability declines. The search for more reliable soil K tests is a challenge and there have been concerns raised about the use of current tests (Khan et al. 2013). The Better Fertilizer Decisions for Crops (BFDC) project developed critical soil test ranges for a range of crops for Colwell-K (Table 2). The data were skewed to Western Australia and the values for heavy soils still seem relatively unreliable. Table 2. Critical 0-10 cm Colwell-K soil test ranges (Brennan and Bell 2013) for a range of soil orders (values in mg/kg). Values are the 95% confidence range to achieve 90% of maximum yield. Wheat Canola Lupin All Soils 41-49 43-47 22-28 Chromosols 35-45 Ferrosols (Brown) 57-70 Kandosols 45-52 Tenosols 32-52 44-49 22-27 Tenosols 2-3 t/ha 37-48 Tenosols >3t/ha 51-57 Research in SA for sunflower by Lewis et al. (1991) proposed a critical value of 65 mg/kg, which was similar to the broad range from the BFDC project. Research in the northern cropping zone has shown that K is becoming depleted, particularly in the subsoil, mainly because root growth in winter crops occurs below dry or drying topsoil. Deeper soil tests (to 30 cm) and estimates of buffering capacity and associated cations can help redefine critical limits. Table 3 shows the expected effects of CEC, profile and other cations on critical soil test values. Deeper sampling is also becoming used In Western Australia were K can leach on the coarse acid soils and the approach gave clearer critical values for wheat and canola than 0-10 cm sampling (Anderson et al. 2013). Table 3 Effect of CEC, depth and companion ions of tentative estimates of wheat critical K levels for northern Vertosols (Guppy, pers.comm.). Values are those cited by Guppy as ex-K rather and converted to Colwell K. * High Mg >30% CEC, High Na >6% CEC Topsoil (0-10 cm) Subsoil (10-30 cm) CEC Ex K
(mg/kg) If High Mg/Na*
ExK (mg/kg)
If high Mg/Na*
<30 cmol/kg 80 160 40 80 30-60 cmol/kg 160 240 120 200 >60 cmol/kg 200 400 200 310 Critical Colwell K values for pastures are higher than the values in Table 2, and have been interpreted in terms of soil texture. Values range from 125 mg/kg in sands to 160 mg/kg in clay loams (Gourley et al. 2007). Because of these interactions, it is difficult to reliably estimate K critical soil test values especially on Vertosols. The reason is that both rate of supply from less available K pools may be insufficient where rooting patterns or slow diffusion limit supply to a crop that experiences a period of high demand.
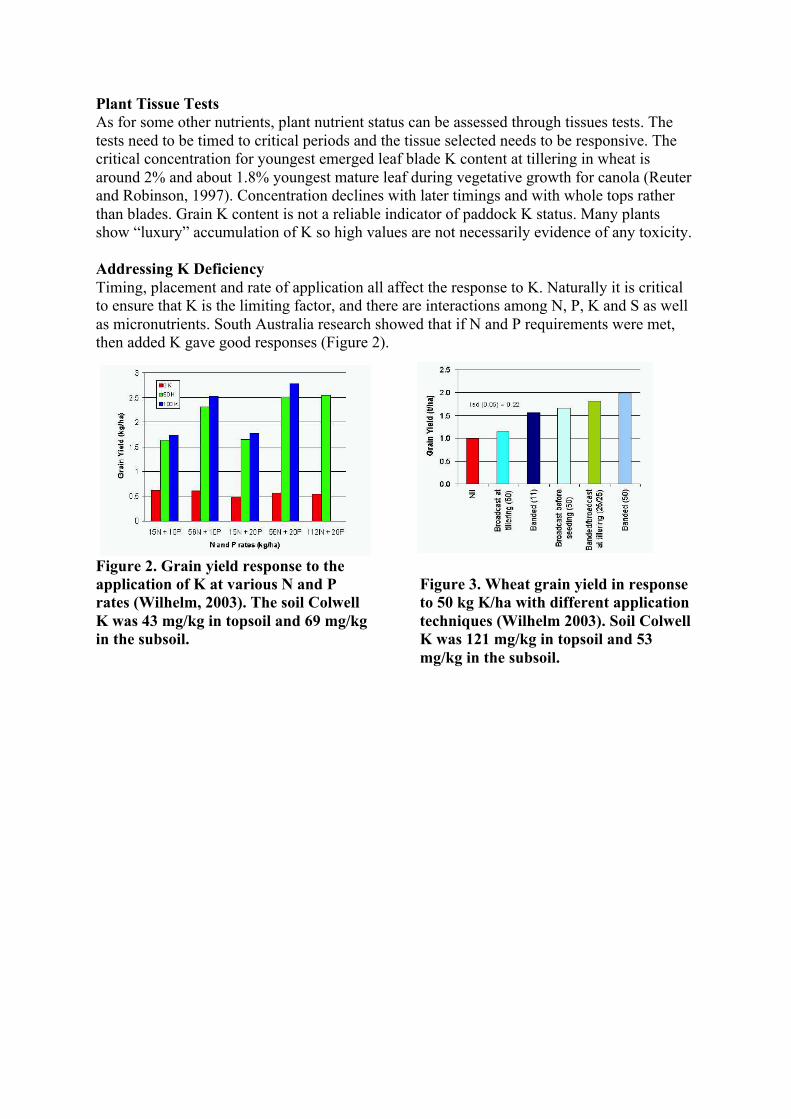
Plant Tissue Tests As for some other nutrients, plant nutrient status can be assessed through tissues tests. The tests need to be timed to critical periods and the tissue selected needs to be responsive. The critical concentration for youngest emerged leaf blade K content at tillering in wheat is around 2% and about 1.8% youngest mature leaf during vegetative growth for canola (Reuter and Robinson, 1997). Concentration declines with later timings and with whole tops rather than blades. Grain K content is not a reliable indicator of paddock K status. Many plants show “luxury” accumulation of K so high values are not necessarily evidence of any toxicity. Addressing K Deficiency Timing, placement and rate of application all affect the response to K. Naturally it is critical to ensure that K is the limiting factor, and there are interactions among N, P, K and S as well as micronutrients. South Australia research showed that if N and P requirements were met, then added K gave good responses (Figure 2).
Figure 2. Grain yield response to the application of K at various N and P rates (Wilhelm, 2003). The soil Colwell K was 43 mg/kg in topsoil and 69 mg/kg in the subsoil.
Figure 3. Wheat grain yield in response to 50 kg K/ha with different application techniques (Wilhelm 2003). Soil Colwell K was 121 mg/kg in topsoil and 53 mg/kg in the subsoil.
The Right Time and Right Place to give the best responses are with K at seeding rather than topdressing. Muriate of potash is a salt and can cause damage to sensitive seeds when place together in the sowing row. The amount of damage will depend on row width, seeding points, soil texture and moisture. There is more information and access to the on-line damage tool at http://anz.ipni.net/article/ANZ-3076. Banding below the seed at planting has been shown to give much better results than topdressing or prespreading (Wilhelm 2003, Figure 3). The Right Rate will need to be higher than replacement because K is relatively immobile. If the K buffering capacity is high, and the non-exchangeable K pool is strongly depleted, the competition between the soil and plant can mean minimum rates of 50 to 100 kg K/ha are needed to see responses. If using test-strips run out at seeding, then use a high rate to see if K supply is adequate. Another consequence of the low mobility – especially in alkaline soils – is that high rates can be used to cover two or three or even more crops. Work in Queensland using 200 kg K/ha deep (20 cm) banded is used before the most responsive crops and then cropped down over the seasons. So, it is better to use higher rates less frequently than lower rates every year. The Right Source is usually MOP, mainly because it is significantly cheaper than sulfate of potash, potassium nitrate or potassium magnesium sulfate (langbenite). All commercially available K fertilizers are imported, although there is one current development to exploit greensands deposits of glauconite in WA. Some growers are concerned about adding extra chloride, but the amounts added are of little agronomic or environmental significance in adding to salt loads. Conclusions Potassium deficiency has been confirmed in South Australia in grain cropping regions. As K reserves are drawn down with higher yields, K replacement may need to be more widely addressed as it has been in Western Australia. The first evidence could be seen as good growth in windrows. Soil tests are reliable on sandy soils but less so on heavy soils. Responses to 50 to 100 kg K/ha banded below the seed at seeding where soil tests are below critical concentrations should give economic responses.
Disc Seeders and Pre-Emergence Herbicides
1Sam Kleemann, 2Jack Desbiolles, 1Gurjeet Gill & 1Chris Preston 1University of Adelaide & 2University of South Australia [email protected], (M) 0418 256 475
An increasing proportion of no-till farmers are making transition to disc-based zero-till cropping. Disc seeding systems can significantly reduce soil disturbance than knife-point seeding systems, enable greater stubble retention, allow faster sowing and can result in more uniform crop establishment. However, use of pre-emergence herbicides with disc seeders can result in crop damage and consequently most pre-emergent herbicide labels do not recommend their use with disc seeders. There is a wide range of disc seeders available in Australia and growers are unsure about their suitability for use with pre-emergence herbicides. Field trials were undertaken at Roseworthy Campus in the Mid North of South Australia in 2012 and 2013 to investigate the behaviour of pre-emergence herbicides with disc seeders. More specifically the trials were designed to evaluate the effect of different seeding systems on pre-emergence herbicide control of annual ryegrass and their phytotoxicity to wheat. The disc systems comprised KHart and Bertini triple discs, and JD (90 series), NDF (650 series) and DayBreak (Duodec) single discs. Use of triple disc seeders with pre-emergence herbicides provided similar crop safety to standard knife-point press wheel system. Of the herbicides examined, Sakura® caused no damage to wheat and provided >90% control of ryegrass and appears to be the most suitable pre-emergence herbicide for use with discs. In contrast, trifluralin significantly reduced wheat emergence with single discs (<50%) but not with triple discs. However, inclusion of residue managers fitted ahead of the single disc openers significantly reduced the risk of herbicide damage from trifluralin and Boxer Gold®. The residue managers were set to remove crop residue from a 3-4 cm wide band in front of the discs, which resulted in partial removal of herbicide treated soil from the crop furrow and improved crop safety. Increasing the sowing depth of single discs (i.e. by 1-2 cm) was also shown to improve crop safety, which was most likely due to an increase in herbicide displacement by soil disturbance.
Key messages: • Due to crop safety concerns most pre-emergence herbicides are not
recommended for use with disc seeders. • Wheat was seriously damaged by the use of trifluralin under single discs. In
contrast Sakura®, which caused no damage to wheat and was highly effective on ryegrass, appears to be the best pre-emergence herbicide option for use with discs.
• Pre-emergence herbicides were consistently safer under triple disc than single disc.
• Use of residue managers in front of single disc blade significantly improved the level of crop safety.
Acknowledgments:
The assistance of Dean Thiele in trial preparation and GRDC for providing project funding (UA00105) is gratefully acknowledged.
Pulse Varietal Herbicide Tolerance – 2012 Results Michael Zerner, SARDI, Waite Campus, (08) 8303 9479, [email protected] Rob Wheeler, SARDI, Waite Campus, (08) 83039480, [email protected] Larn McMurray, SARDI, Clare, (08) 8842 6265, [email protected] Key Outcomes from 2012
• Group C post-sowing pre-emergent herbicides were the most damaging herbicides in lentils and Nipper was the most sensitive variety.
• Chickpea variety, CICA0857 was found to be more sensitive to Broadstrike (flumetsulam) than the other varieties tested, incurring an 11% yield loss when applied at the label recommended rate and timing.
• No significant yield reductions were found from any herbicide treatment in all field pea varieties evaluated.
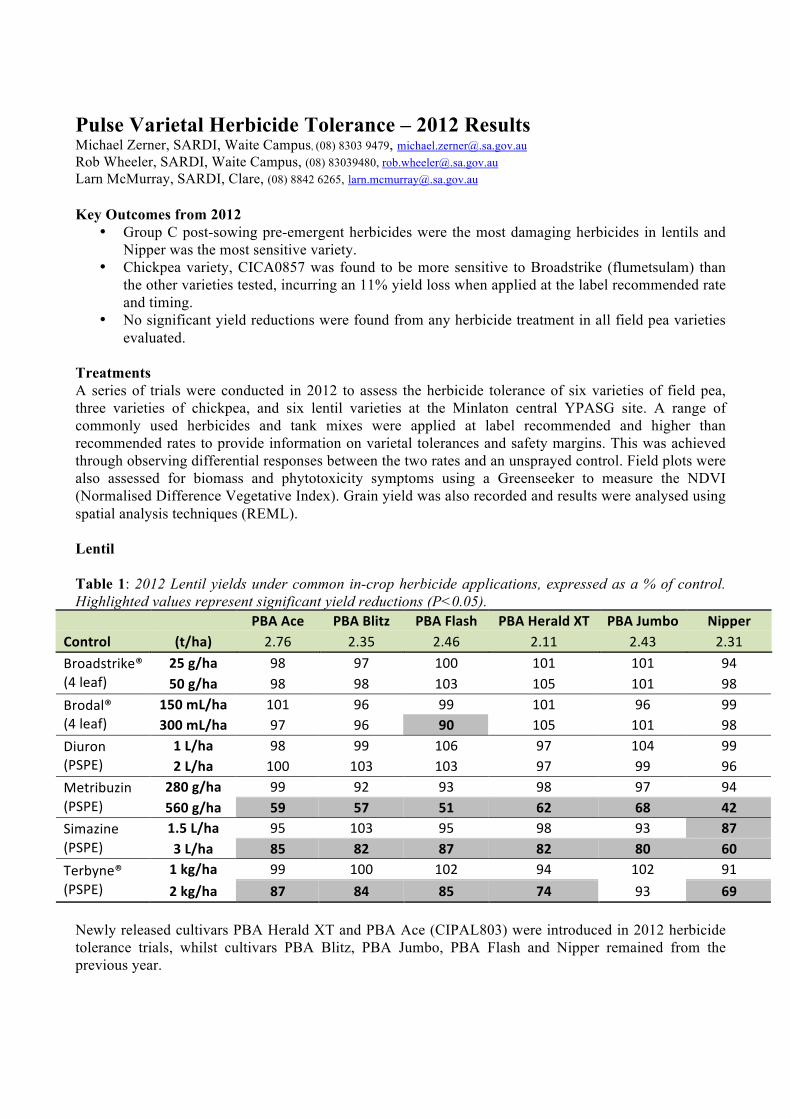
Treatments A series of trials were conducted in 2012 to assess the herbicide tolerance of six varieties of field pea, three varieties of chickpea, and six lentil varieties at the Minlaton central YPASG site. A range of commonly used herbicides and tank mixes were applied at label recommended and higher than recommended rates to provide information on varietal tolerances and safety margins. This was achieved through observing differential responses between the two rates and an unsprayed control. Field plots were also assessed for biomass and phytotoxicity symptoms using a Greenseeker to measure the NDVI (Normalised Difference Vegetative Index). Grain yield was also recorded and results were analysed using spatial analysis techniques (REML). Lentil Table 1: 2012 Lentil yields under common in-crop herbicide applications, expressed as a % of control. Highlighted values represent significant yield reductions (P<0.05).
PBA Ace PBA Blitz PBA Flash PBA Herald XT PBA Jumbo Nipper Control (t/ha) 2.76 2.35 2.46 2.11 2.43 2.31
25 g/ha 98 97 100 101 101 94 Broadstrike® (4 leaf) 50 g/ha 98 98 103 105 101 98
150 mL/ha 101 96 99 101 96 99 Brodal® (4 leaf) 300 mL/ha 97 96 90 105 101 98
1 L/ha 98 99 106 97 104 99 Diuron (PSPE) 2 L/ha 100 103 103 97 99 96
280 g/ha 99 92 93 98 97 94 Metribuzin (PSPE) 560 g/ha 59 57 51 62 68 42
1.5 L/ha 95 103 95 98 93 87 Simazine (PSPE) 3 L/ha 85 82 87 82 80 60
1 kg/ha 99 100 102 94 102 91 Terbyne® (PSPE) 2 kg/ha 87 84 85 74 93 69
Newly released cultivars PBA Herald XT and PBA Ace (CIPAL803) were introduced in 2012 herbicide tolerance trials, whilst cultivars PBA Blitz, PBA Jumbo, PBA Flash and Nipper remained from the previous year.
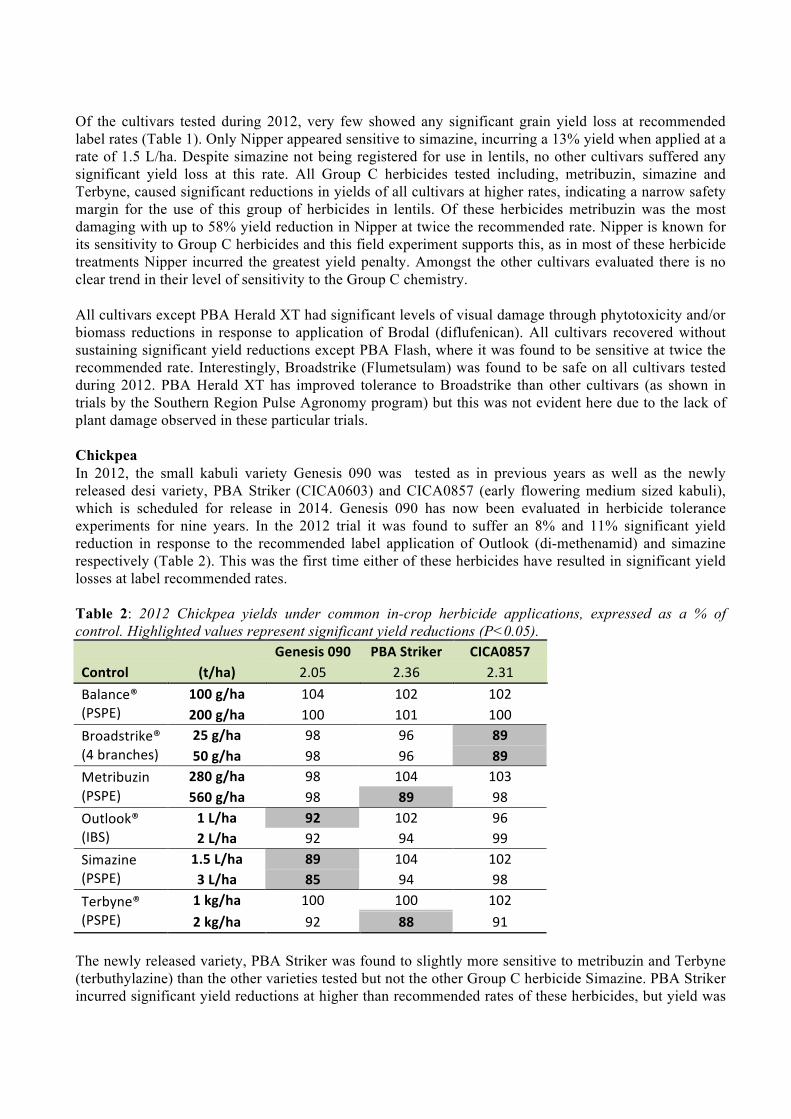
Of the cultivars tested during 2012, very few showed any significant grain yield loss at recommended label rates (Table 1). Only Nipper appeared sensitive to simazine, incurring a 13% yield when applied at a rate of 1.5 L/ha. Despite simazine not being registered for use in lentils, no other cultivars suffered any significant yield loss at this rate. All Group C herbicides tested including, metribuzin, simazine and Terbyne, caused significant reductions in yields of all cultivars at higher rates, indicating a narrow safety margin for the use of this group of herbicides in lentils. Of these herbicides metribuzin was the most damaging with up to 58% yield reduction in Nipper at twice the recommended rate. Nipper is known for its sensitivity to Group C herbicides and this field experiment supports this, as in most of these herbicide treatments Nipper incurred the greatest yield penalty. Amongst the other cultivars evaluated there is no clear trend in their level of sensitivity to the Group C chemistry. All cultivars except PBA Herald XT had significant levels of visual damage through phytotoxicity and/or biomass reductions in response to application of Brodal (diflufenican). All cultivars recovered without sustaining significant yield reductions except PBA Flash, where it was found to be sensitive at twice the recommended rate. Interestingly, Broadstrike (Flumetsulam) was found to be safe on all cultivars tested during 2012. PBA Herald XT has improved tolerance to Broadstrike than other cultivars (as shown in trials by the Southern Region Pulse Agronomy program) but this was not evident here due to the lack of plant damage observed in these particular trials. Chickpea In 2012, the small kabuli variety Genesis 090 was tested as in previous years as well as the newly released desi variety, PBA Striker (CICA0603) and CICA0857 (early flowering medium sized kabuli), which is scheduled for release in 2014. Genesis 090 has now been evaluated in herbicide tolerance experiments for nine years. In the 2012 trial it was found to suffer an 8% and 11% significant yield reduction in response to the recommended label application of Outlook (di-methenamid) and simazine respectively (Table 2). This was the first time either of these herbicides have resulted in significant yield losses at label recommended rates. Table 2: 2012 Chickpea yields under common in-crop herbicide applications, expressed as a % of control. Highlighted values represent significant yield reductions (P<0.05). Genesis 090 PBA Striker CICA0857 Control (t/ha) 2.05 2.36 2.31
100 g/ha 104 102 102 Balance® (PSPE) 200 g/ha 100 101 100
25 g/ha 98 96 89 Broadstrike® (4 branches) 50 g/ha 98 96 89
280 g/ha 98 104 103 Metribuzin (PSPE) 560 g/ha 98 89 98
1 L/ha 92 102 96 Outlook® (IBS) 2 L/ha 92 94 99
1.5 L/ha 89 104 102 Simazine (PSPE) 3 L/ha 85 94 98
1 kg/ha 100 100 102 Terbyne® (PSPE) 2 kg/ha 92 88 91
The newly released variety, PBA Striker was found to slightly more sensitive to metribuzin and Terbyne (terbuthylazine) than the other varieties tested but not the other Group C herbicide Simazine. PBA Striker incurred significant yield reductions at higher than recommended rates of these herbicides, but yield was
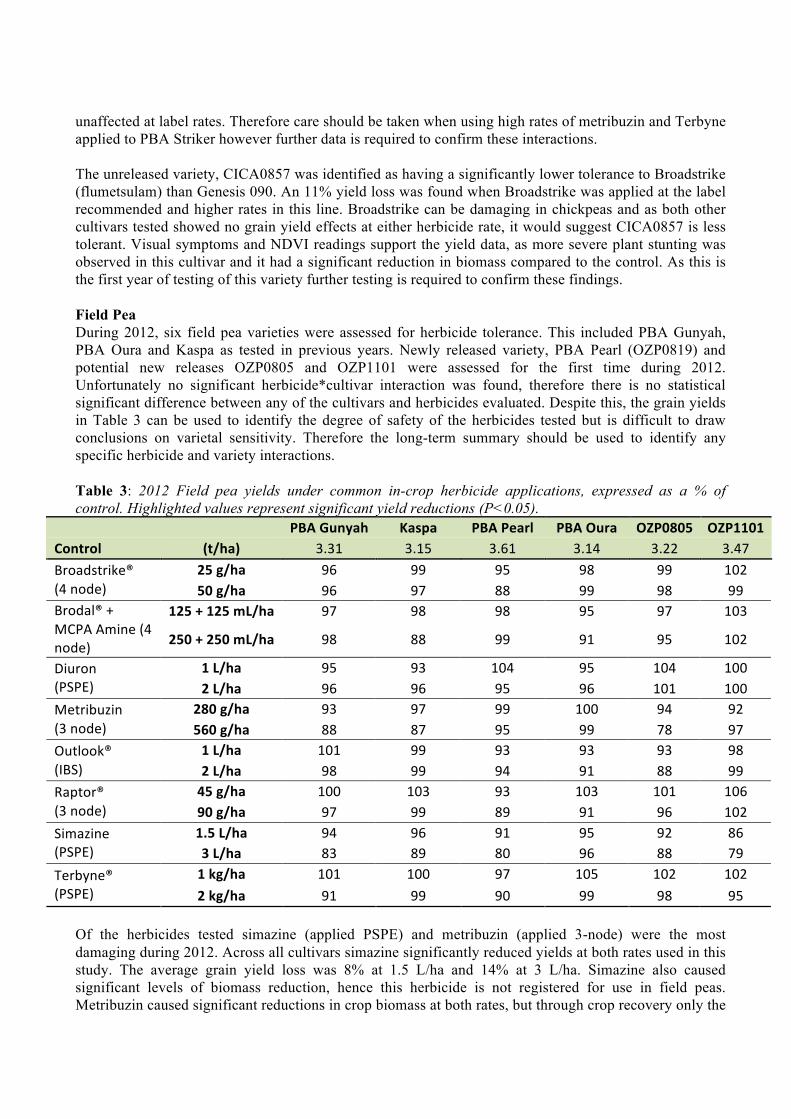
unaffected at label rates. Therefore care should be taken when using high rates of metribuzin and Terbyne applied to PBA Striker however further data is required to confirm these interactions. The unreleased variety, CICA0857 was identified as having a significantly lower tolerance to Broadstrike (flumetsulam) than Genesis 090. An 11% yield loss was found when Broadstrike was applied at the label recommended and higher rates in this line. Broadstrike can be damaging in chickpeas and as both other cultivars tested showed no grain yield effects at either herbicide rate, it would suggest CICA0857 is less tolerant. Visual symptoms and NDVI readings support the yield data, as more severe plant stunting was observed in this cultivar and it had a significant reduction in biomass compared to the control. As this is the first year of testing of this variety further testing is required to confirm these findings. Field Pea During 2012, six field pea varieties were assessed for herbicide tolerance. This included PBA Gunyah, PBA Oura and Kaspa as tested in previous years. Newly released variety, PBA Pearl (OZP0819) and potential new releases OZP0805 and OZP1101 were assessed for the first time during 2012. Unfortunately no significant herbicide*cultivar interaction was found, therefore there is no statistical significant difference between any of the cultivars and herbicides evaluated. Despite this, the grain yields in Table 3 can be used to identify the degree of safety of the herbicides tested but is difficult to draw conclusions on varietal sensitivity. Therefore the long-term summary should be used to identify any specific herbicide and variety interactions. Table 3: 2012 Field pea yields under common in-crop herbicide applications, expressed as a % of control. Highlighted values represent significant yield reductions (P<0.05).
PBA Gunyah Kaspa PBA Pearl PBA Oura OZP0805 OZP1101 Control (t/ha) 3.31 3.15 3.61 3.14 3.22 3.47
25 g/ha 96 99 95 98 99 102 Broadstrike® (4 node) 50 g/ha 96 97 88 99 98 99
125 + 125 mL/ha 97 98 98 95 97 103 Brodal® + MCPA Amine (4 node) 250 + 250 mL/ha 98 88 99 91 95 102
1 L/ha 95 93 104 95 104 100 Diuron (PSPE) 2 L/ha 96 96 95 96 101 100
280 g/ha 93 97 99 100 94 92 Metribuzin (3 node) 560 g/ha 88 87 95 99 78 97
1 L/ha 101 99 93 93 93 98 Outlook® (IBS) 2 L/ha 98 99 94 91 88 99
45 g/ha 100 103 93 103 101 106 Raptor® (3 node) 90 g/ha 97 99 89 91 96 102
1.5 L/ha 94 96 91 95 92 86 Simazine (PSPE) 3 L/ha 83 89 80 96 88 79
1 kg/ha 101 100 97 105 102 102 Terbyne® (PSPE) 2 kg/ha 91 99 90 99 98 95
Of the herbicides tested simazine (applied PSPE) and metribuzin (applied 3-node) were the most damaging during 2012. Across all cultivars simazine significantly reduced yields at both rates used in this study. The average grain yield loss was 8% at 1.5 L/ha and 14% at 3 L/ha. Simazine also caused significant levels of biomass reduction, hence this herbicide is not registered for use in field peas. Metribuzin caused significant reductions in crop biomass at both rates, but through crop recovery only the
high rate caused a significant 9% yield loss across all cultivars. Although no statistical differences between varieties, PBA Oura showed a trend of increased tolerance to metribuzin, which supports previous year’s results. Conclusion and into the paddock This research has shown pulse varieties can differ substantially in their sensitivity to important selective herbicides when applied at registered label rates and timings. Therefore it becomes important to check the safety of various herbicide and variety combinations prior to sowing and spraying. Long-term summaries should also be used to identify herbicide and crop varietal combinations for potential grain yield penalties, as herbicide tolerance is strongly influenced by seasonal conditions. Information pertaining to varieties, which have been tested in one year only, should be treated with caution pending further trials over multiple growing seasons. Long-term summaries of herbicide tolerance testing for all crops can be found online from the NVT website (www.nvtonline.com.au). Acknowledgements SARDI New Variety Agronomy Groups based at Clare and Waite are greatly acknowledged for their support in management of the trials. This project is jointly funded by GRDC and the South Australian Government and is supported by cooperating farmers (Bruce Cook and Michael Richards, Minlaton).