Tieback Wall Stabilization of Railroad Embankments · the soil or rock by adhesion of the grouted...
9
Transportation Research Record 1030 29 Tieback Wall Stabilization of Railroad Embankments HUBERT DEATON III ABSTRACT Tieback walls are used to stabilize railroad embankments. Frequently, they can be built without interrupting traffic or relocating the tracks. The walls elim- inate the temporary excavation support that may be required to construct other methods of stabilization. They may be built close to tracks or structures be- cause they limit long-term soil movements. Tieback walls can stabilize embank- ments with deep failure surface. The design of a tieback wall for a railroad embankment is performed in a manner similar to that of other tieback walls. A geotechnical investigation should provide the design properties including loca- tion of the failure surface, unit weights of material, internal strength prop- erties of material, strength properties along the failure surface, soil or rock classification, and groundwater information. In addition, tests must be made to determine the levels of corrosion protection that will be adequate to ensure that the tieback and the wall components will not corrode. A railroad embank- ment in the Blue Ridge Mountains was stabilized with a tieback, driven H-pile wall 40 ft high. Track traffic was not interrupted and future maintenance was reduced. Monitoring of the wall has indicated that it is performing as expected. Grouted rock and soil anchors typically called tie- backs were originally developed as an alternate to bracing or massive cantilever sheeting for temporary excavation support. Their good performance and the ease with which their capacities may be verified has led to their use as a permanent means of supporting retaining walls. These walls are typically called tieback walls or permanently anchored walls. Their use is increasing throughout the United States both on public and on private works (!_). Tieback walls have several structural members (Figure 1) • The tieback itself is a grouted anchor that transmits force from the wall through a post- tensioned tendon. The tendon force is developed in the soil or rock by adhesion of the grouted anchor over a zone called the anchor length. The portion of the tendon that is between the anchor and the wall is called the unbonded length, and it elongates elastically during posttensioning <ll· Tieback walls may have horizontal support members called elements (Figure 2) or vertical support members called sol- dier beams. The space between support members may be covered to further reduce soil movement or erosion. This cover is called the facing and it is typically d la = ANCHOR LENGTH 1 1 = TIEBACK LENGTH 11 5 = UNBONDED LENGTH d = SHAFT DIAMETER TENDON FIGURE 1 Components of a tieback. ... ':' ANCHORAGE - CONNECTION WALL cast-in-place or precast concrete, shotcrete, or treated timber. APPLICATION Tiebacks can offer significant advantages in the stabilization of existing embankments that support critical loads such as railroad traffic. Many rail- road embankments have been constructed by dumping with no special compaction or selection of materi- als. Then fills are subject to slope failures that are normally repaired by dumping additional mate- rial. This may overload a marginally stable slope and further movement can result. Construction of a conventional retaining wall may require removal of a large portion of the embankment. Temporary shoring of the excavation may be required. Figure 3 shows a comparison of a conventional retaining wall with temporary shoring and a tieback wall. Alternately, relocation of the tracks away from the wall con- struction may be required. With the use of a tieback wall, the temporary shoring can become a permanent part of the wall, and relocation of the tracks is not necessary. In many cases, train traffic can pro- ceed uninterrupted while the wall is being con- structed because construction proceeds from the top down (Figure 4). In cases in which embankment movement is gener- ated by landslide conditions, tieback walls can be even more advantageous. Whereas nontieback walls must penetrate the landslide's failure surface, with a tieback wall only the tieback anchors are required to extend beyond the plane of movement. The wall it- self may stop at whatever level produces stable slopes above and below the wall (3) • Because tieback walls are pretested to overloads in excess of anticipated service loads, their capac- ities are verified and soil movements may be kept small. By the use of instrumentation actual loads taken by the wall may be compared with design as- sumptions. The ease of verifying performance and the small magnitude of movement allow tieback walls to be located close to movement-sensitive facilities.
Transcript of Tieback Wall Stabilization of Railroad Embankments · the soil or rock by adhesion of the grouted...

Transportation Research Record 1030 29
Tieback Wall Stabilization of Railroad Embankments
HUBERT DEATON III
ABSTRACT
Tieback walls are used to stabilize railroad embankments. Frequently, they can be built without interrupting traffic or relocating the tracks. The walls eliminate the temporary excavation support that may be required to construct other methods of stabilization. They may be built close to tracks or structures because they limit long-term soil movements. Tieback walls can stabilize embankments with deep failure surface. The design of a tieback wall for a railroad embankment is performed in a manner similar to that of other tieback walls. A geotechnical investigation should provide the design properties including location of the failure surface, unit weights of material, internal strength properties of material, strength properties along the failure surface, soil or rock classification, and groundwater information. In addition, tests must be made to determine the levels of corrosion protection that will be adequate to ensure that the tieback and the wall components will not corrode. A railroad embankment in the Blue Ridge Mountains was stabilized with a tieback, driven H-pile wall 40 ft high. Track traffic was not interrupted and future maintenance was reduced. Monitoring of the wall has indicated that it is performing as expected.
Grouted rock and soil anchors typically called tiebacks were originally developed as an alternate to bracing or massive cantilever sheeting for temporary excavation support. Their good performance and the ease with which their capacities may be verified has led to their use as a permanent means of supporting retaining walls. These walls are typically called tieback walls or permanently anchored walls. Their use is increasing throughout the United States both on public and on private works (!_).
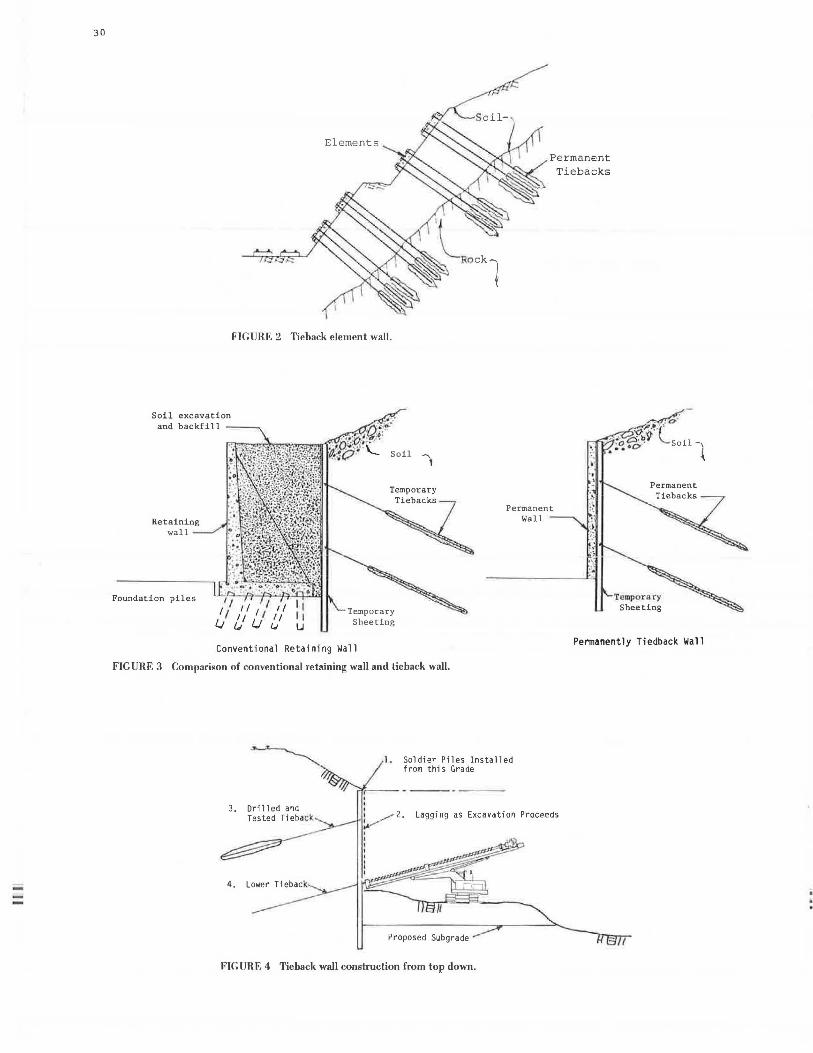
Tieback walls have several structural members (Figure 1) • The tieback itself is a grouted anchor that transmits force from the wall through a posttensioned tendon. The tendon force is developed in the soil or rock by adhesion of the grouted anchor over a zone called the anchor length. The portion of the tendon that is between the anchor and the wall is called the unbonded length, and it elongates elastically during posttensioning <ll· Tieback walls may have horizontal support members called elements (Figure 2) or vertical support members called soldier beams. The space between support members may be covered to further reduce soil movement or erosion. This cover is called the facing and it is typically
d
la = ANCHOR LENGTH 11 = TIEBACK LENGTH 11
5 = UNBONDED LENGTH
d = SHAFT DIAMETER
TENDON
FIGURE 1 Components of a tieback.
... ':'
ANCHORAGE - CONNECTION
WALL
cast-in-place or precast concrete, shotcrete, or treated timber.
APPLICATION
Tiebacks can offer significant advantages in the stabilization of existing embankments that support critical loads such as railroad traffic. Many railroad embankments have been constructed by dumping with no special compaction or selection of materials. Then fills are subject to slope failures that are normally repaired by dumping additional material. This may overload a marginally stable slope and further movement can result. Construction of a conventional retaining wall may require removal of a large portion of the embankment. Temporary shoring of the excavation may be required. Figure 3 shows a comparison of a conventional retaining wall with temporary shoring and a tieback wall. Alternately, relocation of the tracks away from the wall construction may be required. With the use of a tieback wall, the temporary shoring can become a permanent part of the wall, and relocation of the tracks is not necessary. In many cases, train traffic can proceed uninterrupted while the wall is being constructed because construction proceeds from the top down (Figure 4).
In cases in which embankment movement is generated by landslide conditions, tieback walls can be even more advantageous. Whereas nontieback walls must penetrate the landslide's failure surface, with a tieback wall only the tieback anchors are required to extend beyond the plane of movement. The wall itself may stop at whatever level produces stable slopes above and below the wall (3) •
Because tieback walls are pretested to overloads in excess of anticipated service loads, their capacities are verified and soil movements may be kept small. By the use of instrumentation actual loads taken by the wall may be compared with design assumptions. The ease of verifying performance and the small magnitude of movement allow tieback walls to be located close to movement-sensitive facilities.
30
--
Soil excavation and backfill
Retaining wall__/
Foundation piles
Elements
FIGURE 2 Tieback element wall.
Permanent Tiebacks
Permanent Wall
Tempor ary Sheeting
Conventional Retaining Wall Permanently Tiedback Wall
FIG URE 3 Comparison of conventional retaining wall and tieback wall.
3.
4.
'
1. Soldier Piles Installed from this Grade
~~2 . Lagging as Excavation Proceeds
Proposed Subgrade
FIGURE 4 Tieback wall construction from top down.

Deaton
Tieback walls may be desirable in any cut situation, but they are particularly useful when traffic cannot be interrupted, relocated, or where large deflections cannot be tolerated.
In evaluating the use of tiebacks for embankment stabilization, there are important preliminary considerations. It must be physically possible to install tiebacks and underground easements must exist or be secured. It must be possible to develop tieback capacity in the anchor length, and the soil must not be subject to excessive creep. Most fills and some in situ soils are not suitable for anchors. In rare cases the ground is so aggressive that tiebacks cannot be adequately protected from corrosion. If it appears to be feasible to use permanent anchors, their cost can then be compared with that of other possible stabilization methods.
DESIGN
Obviously, the design of tieback walls requires a thorough geotechnical investigation. It must be determined if the wall will be loaded by conventional lateral earth pressure or if the embankment is moving as a landslide. Among the information required for estimating design forces is the angle of internal friction, cohesion, depth to groundwater surface, and traffic surcharges. This geotechnical investigation should be made early in the design phase. To determine in situ properties of soil and rock, borings should be taken in the areas where the anchors will be made. For soils, standard penetration resistance, atterberg limits, and unconfined compression tests should be made. Rock cores should be taken with core recovery and rock quality designation (RQD) noted. The potential for corrosion in the embankment must be investigated. Levels of resistivity, soil and groundwater pH, soluble sulfate content, and presence of sulfide must be known to determine the degree of corrosion protection required for the work (4). A summary of some basic permanent anchor criteria follows.
Criteria to be examined in the preliminary evaluation of a tieback wall (_!) :
1. Geometry • Overburden depth greater than 15 ft (above
anchor) Tieback no steeper than 45 degrees below horizontal
2. Soil strength
where
• For coarse-grained soils: standard penetration resistance greater than 10 blows/ft.
• For fine-grained soils: unconfined compressive strength greater than 1.0 ton/ft2 and consistency index (Icl greater than 0.8:
w natural water content, WL liquid limit, and WP plastic limit.
If it is decided to anchor in fills or soils that do not satisfy these criteria, a precontract testing program is recommended.
3. Aggressiveness of soil • Encapsulation of the tendon will be neces
sary if soil surrounding anchor has pH < 4.5, resistivity < 2000 ohm-cm, and any sulfides are present.
• If soluble sulfate content is greater than 2000 mg/kg use ASTM Type V cement. If nearby
31
buried concrete structures show signs of acid attack, portland cement grouts should not be used.
If the wall is subject to conventional lateral earth pressures, apparent earth pressure envelopes similar to those proposed by Terzaghi and Peck and discussed by Peck et al. (5) have been found to be appropriate in most soils -(6) (Figure 5). If the wall is acting as a landslide restraint, the restraining force that will be supplied by the tieback must be estimated. This is typically done by limit equilibrium analysis. The location of the failure surface and the strength properties along the failure must be known Cll. If an embankment is failing as a landslide, inclinometers may be necessary to determine the sequence and rate of movement. It is necessary to compare both sets of forces and design the wall for the controlling loading. The engineer must also determine what factors of safety are present in the method used to estimate forces. The calculated loads can then be adjusted to the desired factor of safety dictated by proper comparison of economics and risk. A final check must be made for overall external mass stability. The unbonded length of the tieback must extend behind the critical failure surface previously determined in the geotechnical investigation. The length of anchor behind the critical failure surface must result in the total tieback length being such that the soil or rock mass between the wall facing and the ends of the tiebacks will be stable. Thus the factor of safety along any potential failure surface behind the ends of the tiebacks will be greater than or equal to the factor of safety along the critical surface. The soil mass will be both internally and externally stable (_!!) (Figure 6).
TESTING
Although the capacity of tieback anchors may be estimated using empirical values, it is imperative that each tieback be tested after installation to verify the ability of the anchor to perform as expected. It is not economical to design tiebacks to such low capacities that variations in soil properties, material qualities, or workmanship may be ignored. There are three types of common tieback tests: the creep test (Figures 7 and 8) that estimates long-term load-carrying capacity, the performance test (Figure 9) that determines residual movement of the anchor at increments of load, and the proof test that verifies proper tendon elongation and ability of the anchor to carry the proof load (Figure 10). Typically 90 to 95 percent of the tiebacks may be proof tested only. A center-hole hydraulic jack and pump are used to apply the load in such a way that the entire tieback tendon is loaded simultaneously during testing. The tieback movement is measured by a dial gauge or a vernier scale independent of the tieback structure. Measuring the jack ram travel is not an accurate way to monitor movement.
The first few tiebacks and a selected percentage of the remaining tiebacks should be performance tested. The performance test is used to establish the load-deformation behavior of the tiebacks at a particular site. It also is used to separate and identify the causes of tieback movement and to check that the unbonded length has been established. The movement patterns developed during the performance test are used to interpret the results of the simpler proof test.
Performance testing is conducted by measuring the load applied to the tieback and its movement during

-iiiiiiii
32
~0.2H
0.6H H 0.5H
0.2H 0.25H
i.f.o,____ __ >j 0. 657' HKa ?'H/C~4
0.27' H to 0,4 H
Schnabel
Sa.
Terzaghi and Peck Sand
Sb.
Comparison of Several "Apparent" Earth-Pressure Envelopes
1. Pressures based on construction sequence from top to bottom.
2. These diagrams do not apply to softer soils or to unusual soils .
30 Th~s~ diagrams do r!ot include major surche:rge~ as buildings, railroads, etc.
FIGURE 5 Typical lateral earth pressures (6).
--- _,,,.. /
4.
s.
Terzaghi and Peck Clay
Sc.
These diagrams do not 1 ncl ude water pressure or special conditions such as ice lenses, tidal heads, etc.
These diagrams are more empirical than theoretical and cannot be used blindly.
Critical Fa11ure Surface
Potential Failure Surface Behl nd The Ends of The
Tiebacks
FIGURE 6 Stability analysis for determining unbonded and total tieback length.
~
" .. .c ~ 0 .... ... ~ 0 e ~ ii 0 ... .. ~
c.> 0
0
0 l
I l I I o.o ) inches
·- '- ~- ...
---
--
I 60 tons
_.._+ H-'4 ·- t ,./
+
.... i.· -t- -+- ·- ... ._ ' 0 tone 111
·- -+-·- 111 + 40 tons
I • -+- 30 tonil
l I + -+ 20 tons
10 tons
10 100 300 Time (minutes)
FIGURE 7 Creep test (1.0 ton= 8.9 kN, 1.0 in.= 25.4 mm).

Deaton
+J
" Q)
~ > 0
:E
0. Q) Q) ....
<.)
33
(a)
Log Time
FIGURE 8 Characteristic creep curves.
Test Load (tons) 0 20 40 60 80 100 120 140 160
~ .. Q)
.c u s: .....
2 +J s: Q)
a Q)
> 4 0 ::t ..... ., +J
6 0 H
~ .... ., 0 0 Q)
.c .c u u ~ .~
20 40
~~~~-~ ::::~ ~ ~~ ~~~:: ~:·: ::: · ··: :
160
..... · ··· ·· · · · :·.: . ...... ~9 vement . :.~· :.;_;:;-; : : . • .. -- · ...• . ..... ' ........ 1.. . . . . .. +J
" s: • .• ..•. . • ..., ,.__ .. .... , . •. . ••. ! .. • .... . ··· ·--... -- - .... . .. . . -··--· - ...... -.. . .,,, Q) ..... a .. Q) <U >
- ···,...---·· · ···- ·--- . ... .. . . . . -· .._ .... --- . . . ··- -· -··- . . . .._ .... .
"' 0 :E b) Residual Anchor Movement Curve
FIGURE 9 Performance test (LO ton= 8.9 kN, LO in.= 25.4 mm).
(/)
<U .c u
" +J
" <U s <U > 0
:E
0
2
4
Test Load (tons) 2 0 40 60 80
FIGURE 10 Proof test (LO ton= 8.9 kN, 1.0 in.= 25.4 mm).
100
incremental loading and unloading. Figure 9 shows a plot of a typical performance test. The upper graph in the figure shows the total tieback movement as a function of load, and the lower graph shows the residual movement of the anchor as a function of load. The residual movement (permanent set) of the anchor is the nonelastic or unrecoverable movement of the anchor that is measured whe n the load is released after each loading increment. The maximum load applied during the performance test is held constant for 10 min, and the movements are measured and recorded at 1, 2, 3, 4, 5, 7, and 10 min. If the tieback is not creep susceptible, the elongation between 1 min and 10 min normally will be less than 0.04 in. If so, the test can be discontinued. If the movements exceed 0.04 in., the maximum load should be held for 60 min so a creep curve can be plotted.
Each production tieback that is not performance tested should be proof tested. A proof test is a simple test that is used to measure the total movement of the tieback. Proof testing is conducted by measuring the load applied to the tieback and its movement during incremental loading. Figure 10 shows a typical proof test plot.
The load increments are the same as those used in the performance test, except that the maximum increment is normally equal to 1. 20 times the design load. The maximum load applied during a proof test is held constant for 5 min and the tieback movement is recorded. If the movement during the 5-min observation period is less than 0. 03 in., the test is discontinued. If the movement exceeds 0.03 in., the load should be maintained until the creep rate can be determined and compared to the creep behavior observed during the performance or creep tests.
Creep tests are performed to evaluate the longterm load-carrying capacity of tiebacks installed in cohesive soils and soft shales. They normally are made on the initial two performance-tested tiebacks. During a creep test, each increment of load is held constant for a certain time period and the elongations are recorded and plotted. Figure 7 shows a typical plot of creep movement versus time on a semilogarithmic graph, with each curve representing the creep movement at each load increment. Figure B shows the three characteristic types of creep curves observed during t i eback testing. Curve s (a) and (b) indicate acceptable behavior, provided that the creep movement estimated by projecting the creep rate over the life of the structure is not exces-

=
34
sive. A creep rate of 0.08 in. per log cycle would produce a creep movement of approximately O. 5 in. over a period of 50 years. Curve (c) indicates that the tieback would continue to creep until it failed.
The primary purpose of any tieback test is to determine whether the tieback will carry the required load without unacceptable movement. Proper tieback testing will include
• Testing of tieback to an overload, typically 120 to 150 percent,
• Comparison of actual elastic elongation versus theoretical,
• Determination that the rate of creep is acceptable,
• Examination of the residual anchor movement, and
• Verification that all components of the tieback connections perform satisfactorily at an overload.
Any tieback that does not perform as designed must be replaced or incorporated in the wall at a reduced capacity.
CASE HISTORY: 4TH ROCKY FILL SLIDE STABILIZATION
Exis ting Conditions
A busy line of track of the Clinchfield Railroad C2l crossed on an embankment of uncontrolled fill. This
Uostobfe slope
Mica s chis!
slope
T!ehgck wg!I
Q 10 20 30 t~,jO feel w Id
0 5 10 15 '1==::31t:::=j'=:=:=!I mete rs
FIGURE 11 Fourth rocky fill slide profiles.
Transportation Research Record 1030
fill blocked natural drainage paths and developed seepage pressures. The resulting slides were repaired by dumping additional material that increased embankment heiqht and the POtential for further movement. This method of maintenance increased the likelihood of a failure that would halt use of the line (Figure 11).
Geotechnic a l I nvestigation
The railroad first had a comprehensive geotechnical investigation performed. This investiqation established the bottom of the shear surface, shear strength, and groundwater levels. It was verified that the fill was failing in a landslide mode and that movement was continuing.
The geotechnical consultant recommended use of a tieback wall to stabilize the embankment on the basis of the following project requirements:
1. The method of construction must not interrupt rail traffic or increase slope instability,
2. Train surcharge must be supported with small deflections,
3 • Embankments above and below the wall must be stable,
4. 5. 6.
Drainage must not be obs tructed, Maintenance must be reduced, Construction schedule must allow completion
during dry season, and 7. Costs must be competitive with other options.
Fine micaceous sand1
c' • 200 psi (9 .58 kPa) <1i' • 2 7. 5 deg
100 pcf (15 .7 kN/m5)
dcoio

Deaton
Re- roded
Exlstin Grouno
Chimne Oroln
CMP
Fine Mlcoc ooue Sand
Mica Schist
Shear Surface
35
FIGURE 12 Active side hill embankment slide threatens main-line Clinchfield Railroad tracks.
Several contractors were invited to submit detailed proposals for a design-build tieback wall under a performance specification (Figure 12). The design selected called for the following
1. Design height of 40 ft, 2. Driven H-piles to rock, 3. Tiebacks penetrating the failure surface, 4. Stability of the embankment below the wall
ignored, 5. Comparison of lateral earth pressure and
landslide forces, 6. Treated timber lagging, 7. Chimney drains with drainage fabric to pre
vent loss of ground, B. Regrading of embankments above and below the
wall to more stable slopes, 9. All tiebacks tested to overloads, and
10. Wall instrumented and its performance monitored.
a. Stability Analysis
18'
Lateral earth pressures were computed by a conventional trapezoidal earth pressure diagram (Figure 13). The landslide stability analysis, which controlled in this case, used Janbu's (10) method to estimate the restraint force (Figure 14). This force was then distributed into the tiebacks. Tieback angles were selected and the capacity of soldier piles to support the vertical loads was examined. Tieback anchorage was required to be behind the shear surface. Because a possibility existed that the embankment below the wall could fail in some later slide, no passive resistance or stability factors were allotted to the lower embankment.
Construction
Soldier piles were driven from a bench cut into the embankment. Installation of wood lagging and drainage fabric proceeded concurrently with excavation down to the first tieback level. wood lagging was not designed but was sized on the basis of judgment
b. Lateral Support
ft = 3. 28 m
kip = 4.45 kN
\, psf = 47. 9 kN/m2
40 ' --+---4-'7._9 kips +--+---'-46;...;'_;_4 kips
4'7. 9 • 1 ,000 = l 200 f 40 ' ps
I· i ,4so , 1 psf
46.4 x \1000 x 0.8 -o = l ,450 psf
FIGURE 13 Design earth pressure envelopes for fourth rocky fill tieback slide control wall.

iiiiii
36 Transportation Research Record 1030
LANDSLIDE CONTROL PROBLEMS
¢ rr !rock
~ Roil pile wall
Slide control wall
Q • 47.9 kips If
0 10 20 30
'"' 0 5 10
meters
t . I
z
Slice Free Body
z q
FIGURE 14 Model for stability analysiR of fourth ror.ky fill.
for the soldier pile spacing used. The choice of a timber facing was dictated by economics. Tiebacks were installed, tested to an overload, and locked off, Any tiebacks that failed were replaced.
This procedure was repeated for the lower rows of tiebacks. Lagging and drainage were installed to the top of rock. Horizontal drains were connected to the chimney drains to conduct water down slope. By this method the water surface is kept at the top of rock. The lower slope was then regraded to approximately half-way between the second and third levels of tiebacks, burying the lagging, wales, and tiebacks. At the same time the upper slope was graded from top of pile to track elevation. All slopes were then seeded to protect them from erosion.
Performance
Initially the piles moved into the fill when the upper level of ties was tensioned. At the top of the pile, movements of as much as 8 in. were recorded. This is not unusual for tiebacks tensioned against fill.
Reference tapes were installed at the top of the piles and a reference line was established after all tiebacks had been tensioned and excavation was completed. Total outward movement of the piles in the first 7 months averaged 0. 021 ft or approximately 1/4 in.
Two vertical rows of load cells were provided, The six load cells were monitored for a year after

Transportation Research Record 1030
lock-off. These load cells showed an average of 4 percent increase in load over a 12-month period, most of which occurred in the first 3 months. Some maintenance of the timber lagging has been required. In general, performance of the wood facing has been as expected.
CONCLUSIONS
Tieback walls can be an economical way to stabilize railroad embankment.
Their construction usually does not interrupt railroad traffic.
A thorough geotechnical study is required. The machanism by which the wall will be loaded
must be known. Tiebacks must be tested to verify design assump
tion. Evaluation of wood lagging facings must include
costs of periodic maintenance.
REFERENCES
1.
2.
D.E. 047. July
Weatherby. Tiebacks. Report FHWA/RD-02/ FHWA, U.S. Department of Transportation, 1902.
T,C. Anderson. Earth Retention Systems Temporary and Permanent. Proc., 32nd Annual Soil Mechanics and Foundation Engineering Conference, 1904.
3. R.B. Reeves. Control of Landslide with Permanent Tiebacks. .!._!!. Slope Stability and Land-
37
slides, University of Wisconsin Extension, Madison, Jan. 1902.
4. D.E. Weatherby and P.J. Nicholson. Tiebacks used for Landslide Stabilization. ASCE Proc., Application of Walls to Landslide Control Problems, Las Vegas, Nev., April 1902.
5. R.B. Peck, W.E. Hanson, and T.H. Thornburn. Foundation Engineering, 2nd ed. John Wiley and Sons, Inc., New York, 1974.
6. H, Schnabel, Jr, Tiebacks in Foundation Engineering and Construction. McGraw-Hill Book Company, New York, 1902.
7. N.R. Morganstern and D.A. Sangrey. Methods of Stability Analysis. In Landslides Analysis and Control, R.L. Schuster and R.J. Krizek, eds., National Academy of Sciences, Washington, D.C., 1970, pp. 155-171.
0. H. Schnabel, Jr. Stability of Tiedback Excavations. Presented at ASCE Construction Excavation Meeting, Harrisburg, Pa., April 1902.
9. G.L. Tysinger. Slide Stabilization 4th Rocky Fill, Clinchfield R.R. ASCE Proc., Application of Walls to Landslide Control Problems, Las Vegas, Nev., April 1902.
10. N. Janbu. Slope Stability Computations. !!l_ Embankment Dam Engineering, R.C. Hirschfeld and S.J. Poulos, eds., John Wiley and Sons, New York, 1973, pp. 47-06.
Publication of this paper sponsored by Committee on Railway Maintenance.
Methodology for Allocating Loss and
Damage to the Railroad Transport Cycle
PETER J. WONG
ABSTRACT
A methodology for allocating loss and damage costs to various parts of the railroad transport cycle is presented. Specific estimates of loss and damage attributed to line-haul shock and vibration and flat and hump yard coupling impacts are developed. In addition, loss and damage estimates are provided for various levels of overspeed impacts in hump yards.
In calendar year 1903, Association of American Railroads (AAR) statistics indicate that North American railroads paid out a total of $162 million in freight loss and damage (L&D) (from Information and Public Affairs, AAR). Industry sources indicate that the indirect costs to railroads and shippers of processing and handling L&D claims may be as much as
eight times greater than the direct L&D payments (1). If this is true, the total costs of L&D to r~ilroads and shippers may be on the order of $1.3 billion per year.
Even though the railroad industry has been vitally concerned with L&D for many years--the 1903 loss is the lowest since 1965--these figures indi-