TIBCO Spotfire 3D Visualization and Analysis of G&G Data · Troy Ruths – CEO Ruths.ai Matt Kulow...
9
Troy Ruths – CEO Ruths.ai Matt Kulow – TIBCO Solutions Consultant September 7, 2016 TIBCO Spotfire 3D Visualization and Analysis of G&G Data
Transcript of TIBCO Spotfire 3D Visualization and Analysis of G&G Data · Troy Ruths – CEO Ruths.ai Matt Kulow...
Troy Ruths – CEO Ruths.ai
Matt Kulow – TIBCO Solutions Consultant
September 7, 2016
TIBCO Spotfire 3D Visualization and Analysis of G&G Data
© Copyright 2000-2016 TIBCO Software Inc.
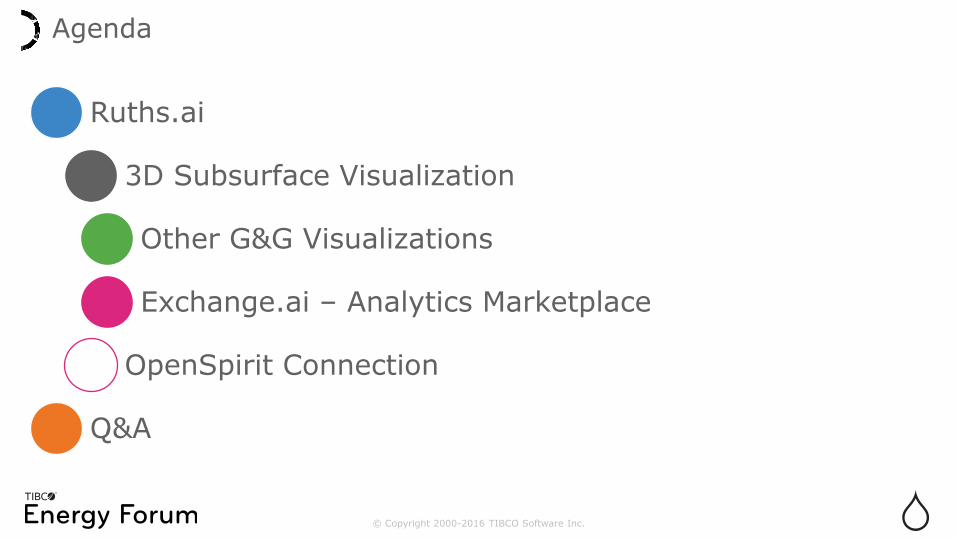
Agenda
Ruths.ai
3D Subsurface Visualization
Other G&G Visualizations
Exchange.ai – Analytics Marketplace
OpenSpirit Connection
Q&A

© Copyright 2000-2016 TIBCO Software Inc.
Ruths.ai
Do More with Data.
We deliver data-driven solutions for the upstream.
© Copyright 2000-2016 TIBCO Software Inc.
• The only place you can bring:
• Operations
• GnG
• DnC
• Forecast
• Finance
• …
• Rapid development of novel methods:
• % Landing Zone
• Seismic aggregation along wellbore
• Type Curves
Why bring GnG data into TIBCO Spotfire?

© Copyright 2000-2016 TIBCO Software Inc.
Build a complete picture of your asset

© Copyright 2000-2016 TIBCO Software Inc.
• Spotfire provides a
flexible data model
• Merge
“unconventional” data
types
• Compare seismic
attributes at each
stage
Merge seismic, stage, and production

© Copyright 2000-2016 TIBCO Software Inc.
Other GnG Visualizations from Ruths.ai
Well Log Ternary Chart Radar Chart

© Copyright 2000-2016 TIBCO Software Inc.
• Extensions
• Templates
Get them on the only Analytics App Store

© Copyright 2000-2016 TIBCO Software Inc.
OpenSpirit Connection