TIBCO Spotfire Operations Analytics 1
23
TIBCO Spotfire ® Operations Analytics 1.1 User’s Manual Revision date: 23 June 2009
Transcript of TIBCO Spotfire Operations Analytics 1
TIBCO Spotfire® Operations Analytics 1.1
User’s Manual
Revision date: 23 June 2009
Important InformationSOME TIBCO SOFTWARE EMBEDS OR BUNDLES OTHER TIBCO SOFTWARE. USE OF SUCH EMBEDDED OR BUNDLED TIBCO SOFTWARE IS SOLELY TO ENABLE THE FUNCTIONALITY (OR PROVIDE LIMITED ADD-ON FUNCTIONALITY) OF THE LICENSED TIBCO SOFTWARE. THE EMBEDDED OR BUNDLED SOFTWARE IS NOT LICENSED TO BE USED OR ACCESSED BY ANY OTHER TIBCO SOFTWARE OR FOR ANY OTHER PURPOSE. USE OF TIBCO SOFTWARE AND THIS DOCUMENT IS SUBJECT TO THE TERMS AND CONDITIONS OF A LICENSE AGREEMENT FOUND IN EITHER A SEPARATELY EXECUTED SOFTWARE LICENSE AGREEMENT, OR, IF THERE IS NO SUCH SEPARATE AGREEMENT, THE CLICKWRAP END USER LICENSE AGREEMENT WHICH IS DISPLAYED DURING DOWNLOAD OR INSTALLATION OF THE SOFTWARE OR IF THERE IS NO SUCH SOFTWARE LICENSE AGREEMENT OR CLICKWRAP END USER LICENSE AGREEMENT, THE LICENSE(S) LOCATED IN THE "LICENSE" FILE(S) OF THE SOFTWARE. USE OF THIS DOCUMENT IS SUBJECT TO THOSE TERMS AND CONDITIONS, AND YOUR USE HEREOF SHALL CONSTITUTE ACCEPTANCE OF AND AN AGREEMENT TO BE BOUND BY THE SAME. This document contains confidential information that is subject to U.S. and international copyright laws and treaties. No part of this document may be reproduced in any form without the written authorization of TIBCO Software Inc. TIBCO and Spotfire are either registered trademarks or trademarks of TIBCO Software Inc. and/or subsidiaries of TIBCO Software Inc. in the United States and/or other countries. All other product and company names and marks mentioned in this document are the property of their respective owners and are mentioned for identification purposes only. This software may be available on multiple operating systems. However, not all operating system platforms for a specific software version are released at the same time. Please see the readme.txt file for the availability of this software version on a specific operating system platform. THIS DOCUMENT IS PROVIDED "AS IS" WITHOUT WARRANTY OF ANY KIND, EITHER EXPRESS OR IMPLIED, INCLUDING, BUT NOT LIMITED TO, THE IMPLIED WARRANTIES OF MERCHANTABILITY, FITNESS FOR A PARTICULAR PURPOSE, OR NON-INFRINGEMENT. THIS DOCUMENT COULD INCLUDE TECHNICAL INACCURACIES OR TYPOGRAPHICAL ERRORS. CHANGES ARE PERIODICALLY ADDED TO THE INFORMATION HEREIN; THESE CHANGES WILL BE INCORPORATED IN NEW EDITIONS OF THIS DOCUMENT. TIBCO SOFTWARE INC. MAY MAKE IMPROVEMENTS AND/OR CHANGES IN THE PRODUCT(S) AND/OR THE PROGRAM(S) DESCRIBED IN THIS DOCUMENT AT ANY TIME. Copyright © 1996- 2009 TIBCO Software Inc. ALL RIGHTS RESERVED. THE CONTENTS OF THIS DOCUMENT MAY BE MODIFIED AND/OR QUALIFIED, DIRECTLY OR INDIRECTLY, BY OTHER DOCUMENTATION WHICH ACCOMPANIES THIS SOFTWARE, INCLUDING BUT NOT LIMITED TO ANY RELEASE NOTES AND "READ ME" FILES. TIBCO Spotfire is covered by U.S. Patent No. 6,014,661 and U.S. Patent No. 7, 216,116. Other patent(s) pending. TIBCO Software Inc. Confidential Information
2 (23) TIBCO Spotfire® Operations Analytics 1.1
Contents1 Introduction 4
2 Limits 52.1 Creating Limits 52.2 Importing Limits 72.3 Editing Limits 92.4 Exporting Limits 102.5 Publishing Limits 11
3 Visualizations 133.1 Limits and Metrics Table 133.2 Bar Chart 143.3 Run Chart 143.4 Limit Lines 15
4 Outliers 194.1 Removing Outliers 19
5 Notifications 21
6 Metrics 22
TIBCO Spotfire® Operations Analytics 1.1 3 (23)
Introduction
1 IntroductionWelcome to TIBCO Spotfire® Operations Analytics!
Operations Analytics helps you monitor, analyze and set rules for your process data.
When something goes wrong in your process you want to know what has gone wrong, and why, as soon as possible. Using Operations Analytics, you can define the rules for acceptable measurement results in your process data. When these rules are breached Operations Analytics will notify you of what has gone wrong. It allows you to analyze the process data and change the rules if necessary.
4 (23) TIBCO Spotfire® Operations Analytics 1.1
Limits
2 LimitsLimits are a fundamental part of Operations Analytics. They define which measured values in your processes that differs or are not of a required quality or standard.
You can define these limits by analyzing your process data in TIBCO Spotfire and setting the limits accordingly.
The limits are then used by server components to analyze all your process data and to notify you when measurements are registered outside the limits you have defined.
2.1 Creating LimitsIn order to use limits for your process data, the limits must be created first. When you create limits you create a Limits and Metrics table. This contains a limits data table and the metrics you chose to include for the process data table.
The limits data table contains an upper and a lower limit that are set when you create the limits. It is used to calculate the lines visualizing the limits in the visualizations and to set a target value for the data. It will also be used to evaluate the measurements in your process data when the limits have been published to the server.
To Create Limits:1 Select Tools > Operations Analytics > Create Limits...
2 If you have more than one process data table in the document, select which one to calculate the limits on.
3 Select if you want to calculate limits based on the mean or the median values in the data table, and type a value for how far apart you want the limits to be.
4 Select which columns from the process data table you want to create limits for by selecting them in the Available columns field and click Add >.
5 Select which metrics you want to display in the Limits and Metrics table that will be created by clicking Select... next to the Included metrics field.
6 Select if you want the metrics to be static or updated dynamically. Note: You can change this option in the visualization later.
7 Click OK.
TIBCO Spotfire® Operations Analytics 1.1 5 (23)
Limits
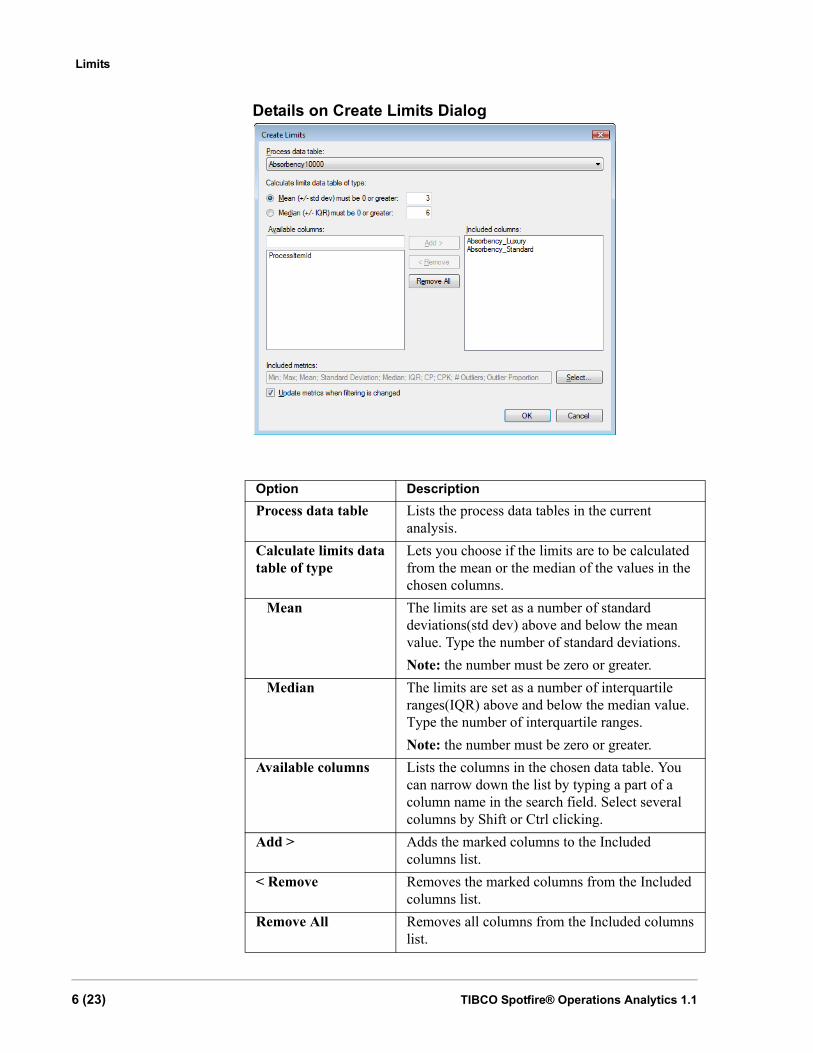
Details on Create Limits Dialog
Option DescriptionProcess data table Lists the process data tables in the current
analysis.Calculate limits data table of type
Lets you choose if the limits are to be calculated from the mean or the median of the values in the chosen columns.
Mean The limits are set as a number of standard deviations(std dev) above and below the mean value. Type the number of standard deviations.Note: the number must be zero or greater.
Median The limits are set as a number of interquartile ranges(IQR) above and below the median value. Type the number of interquartile ranges.Note: the number must be zero or greater.
Available columns Lists the columns in the chosen data table. You can narrow down the list by typing a part of a column name in the search field. Select several columns by Shift or Ctrl clicking.
Add > Adds the marked columns to the Included columns list.
< Remove Removes the marked columns from the Included columns list.
Remove All Removes all columns from the Included columns list.
6 (23) TIBCO Spotfire® Operations Analytics 1.1
Limits
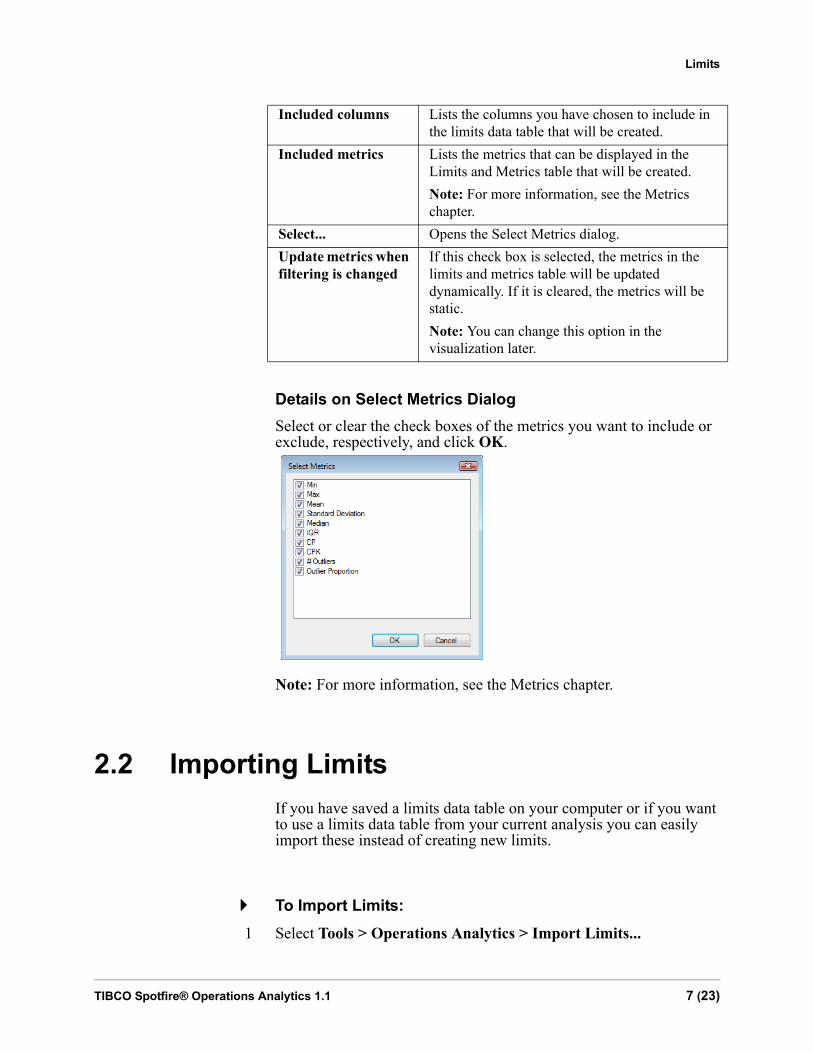
Details on Select Metrics DialogSelect or clear the check boxes of the metrics you want to include or exclude, respectively, and click OK.
Note: For more information, see the Metrics chapter.
2.2 Importing LimitsIf you have saved a limits data table on your computer or if you want to use a limits data table from your current analysis you can easily import these instead of creating new limits.
To Import Limits:1 Select Tools > Operations Analytics > Import Limits...
Included columns Lists the columns you have chosen to include in the limits data table that will be created.
Included metrics Lists the metrics that can be displayed in the Limits and Metrics table that will be created. Note: For more information, see the Metrics chapter.
Select... Opens the Select Metrics dialog.Update metrics when filtering is changed
If this check box is selected, the metrics in the limits and metrics table will be updated dynamically. If it is cleared, the metrics will be static.Note: You can change this option in the visualization later.
TIBCO Spotfire® Operations Analytics 1.1 7 (23)
Limits
2 If you have more than one process data table in the document, select which one to calculate the limits on.
3 Select an existing limits data table in the analysis. OR Select a file on your computer with an exported limits data table.
4 Select which metrics you want to display in the Limits and Metrics table that will be created by clicking Select... next to the Included metrics field.
5 Select if you want the metrics to be static or updated dynamically. Note: You can change this option in the visualization later.
6 Click OK.
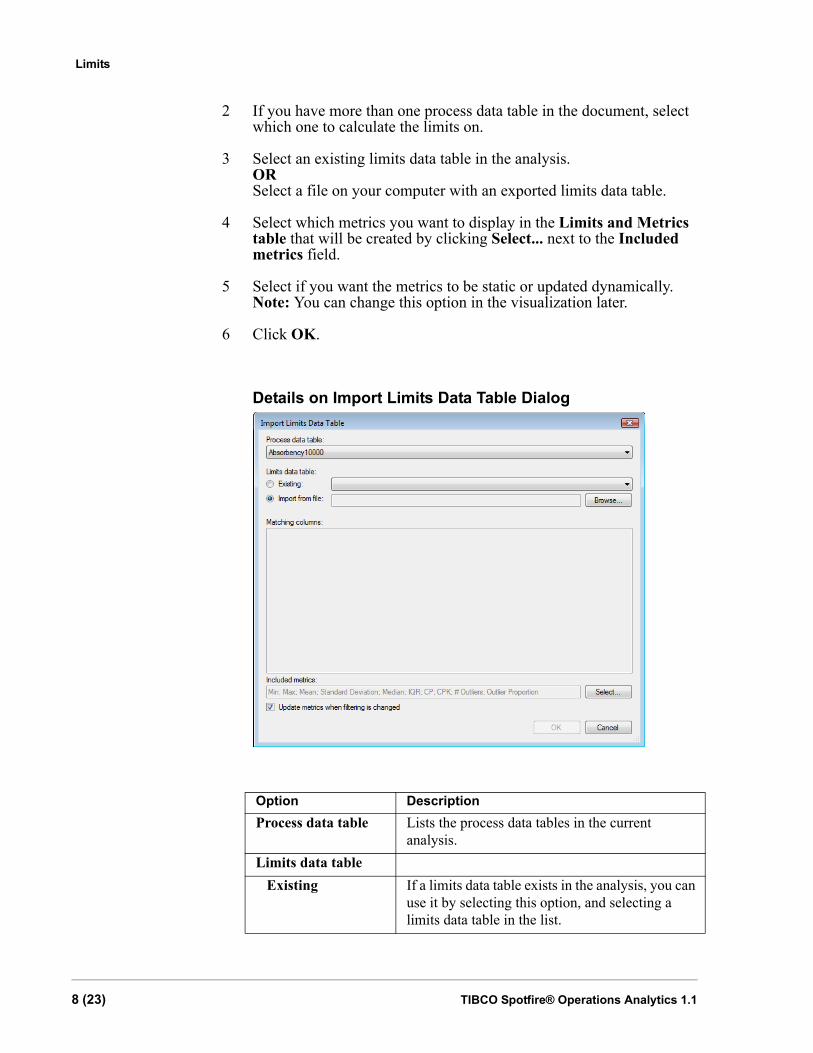
Details on Import Limits Data Table Dialog
Option DescriptionProcess data table Lists the process data tables in the current
analysis.Limits data table Existing If a limits data table exists in the analysis, you can
use it by selecting this option, and selecting a limits data table in the list.
8 (23) TIBCO Spotfire® Operations Analytics 1.1
Limits
2.3 Editing LimitsIf you want to adjust the limits you have set for the data table, this can easily be done in the Edit Limits dialog, where you can set the limits to whatever values you want.
To Edit Limits:1 Right-click on the row in the Limits and Metrics table you want to
edit the limits for.
2 Select Operations Analytics > Edit Limits...
3 Type a lower and/or upper limit value in the respective fields. Note: Changing the upper or lower limits will also affect the target value since that value is the mean of the upper and lower limits.
4 Click OK. Note: If no limits have been calculated, the Edit Limits... option will be grayed out in the menu.
Import from file If you have calculated limits before and saved them on your computer, you can import these limits by selecting this option.
Browse... Lets you browse for a file with a limits data table.Matching columns Lists the columns in the process data table that
matches the columns in the selected limits data table.
Included metrics Lists the metrics that can be displayed in the Limits and Metrics table that will be created. Note: For more information, see the Metrics chapter.
Select... Opens the Select Metrics dialog.Update metrics when filtering is changed
If this check box is selected, the metrics in the limits and metrics table will be updated dynamically. If it is cleared, the metrics will be static.Note: You can change this option in the visualization later.
TIBCO Spotfire® Operations Analytics 1.1 9 (23)
Limits
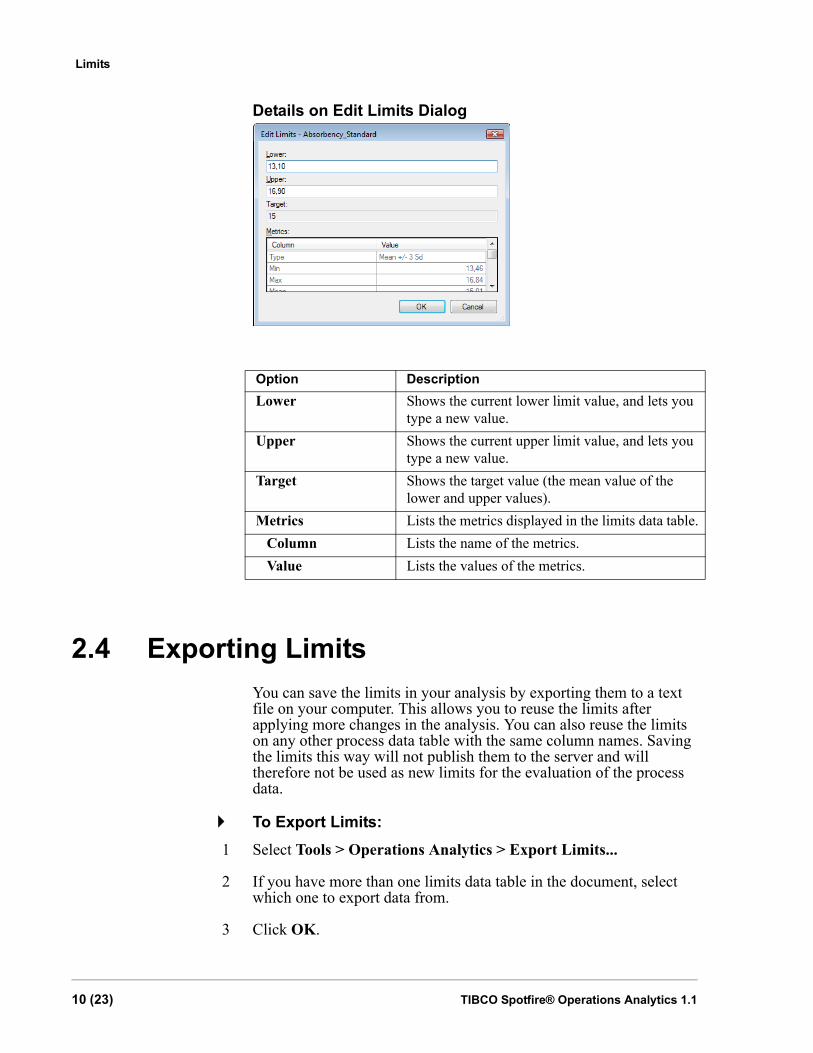
Details on Edit Limits Dialog
Option DescriptionLower Shows the current lower limit value, and lets you
type a new value.Upper Shows the current upper limit value, and lets you
type a new value.Target Shows the target value (the mean value of the
lower and upper values).Metrics Lists the metrics displayed in the limits data table. Column Lists the name of the metrics. Value Lists the values of the metrics.
2.4 Exporting LimitsYou can save the limits in your analysis by exporting them to a text file on your computer. This allows you to reuse the limits after applying more changes in the analysis. You can also reuse the limits on any other process data table with the same column names. Saving the limits this way will not publish them to the server and will therefore not be used as new limits for the evaluation of the process data.
To Export Limits:1 Select Tools > Operations Analytics > Export Limits...
2 If you have more than one limits data table in the document, select which one to export data from.
3 Click OK.
10 (23) TIBCO Spotfire® Operations Analytics 1.1
Limits
4 Type a name for the text file where the limits will be saved.
5 Select the location to save the file to.
6 Click Save. Note: If no limits have been calculated, the Export Limits... option will be grayed out in the menu.
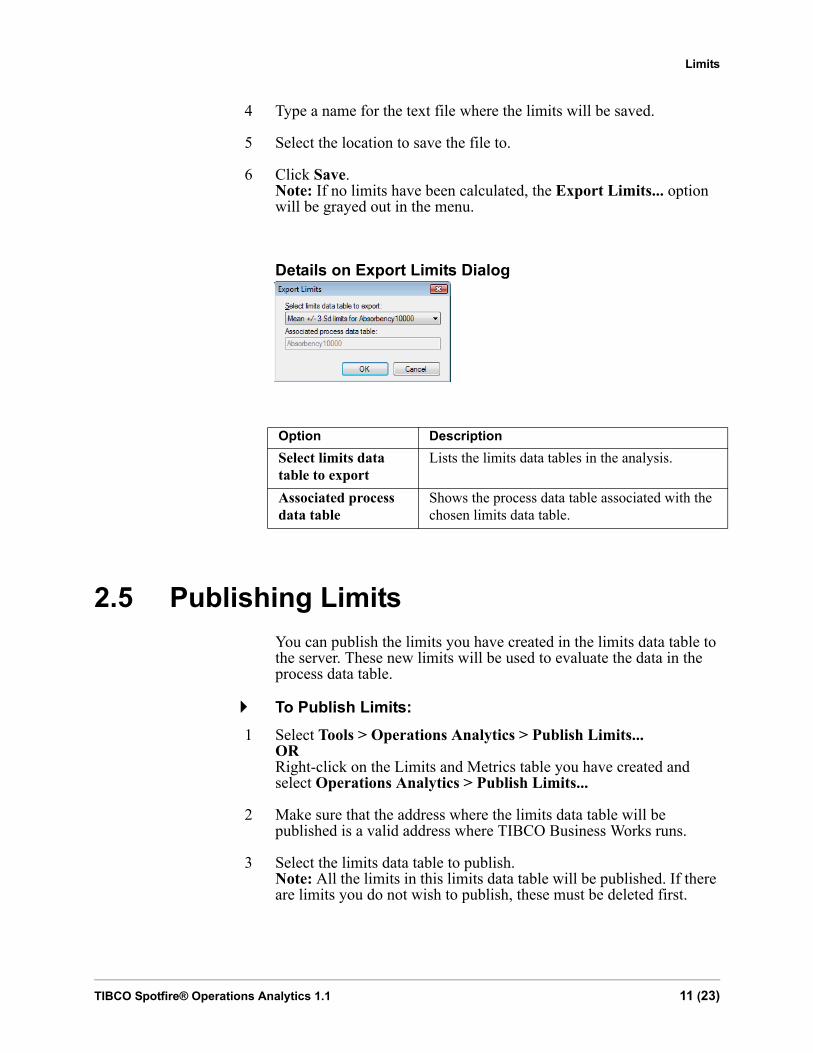
Details on Export Limits Dialog
Option DescriptionSelect limits data table to export
Lists the limits data tables in the analysis.
Associated process data table
Shows the process data table associated with the chosen limits data table.
2.5 Publishing LimitsYou can publish the limits you have created in the limits data table to the server. These new limits will be used to evaluate the data in the process data table.
To Publish Limits:1 Select Tools > Operations Analytics > Publish Limits...
OR Right-click on the Limits and Metrics table you have created and select Operations Analytics > Publish Limits...
2 Make sure that the address where the limits data table will be published is a valid address where TIBCO Business Works runs.
3 Select the limits data table to publish. Note: All the limits in this limits data table will be published. If there are limits you do not wish to publish, these must be deleted first.
TIBCO Spotfire® Operations Analytics 1.1 11 (23)
Limits
4 Click OK. Note: If no limits have been calculated, the Publish Limits... option will be grayed out in the menu.
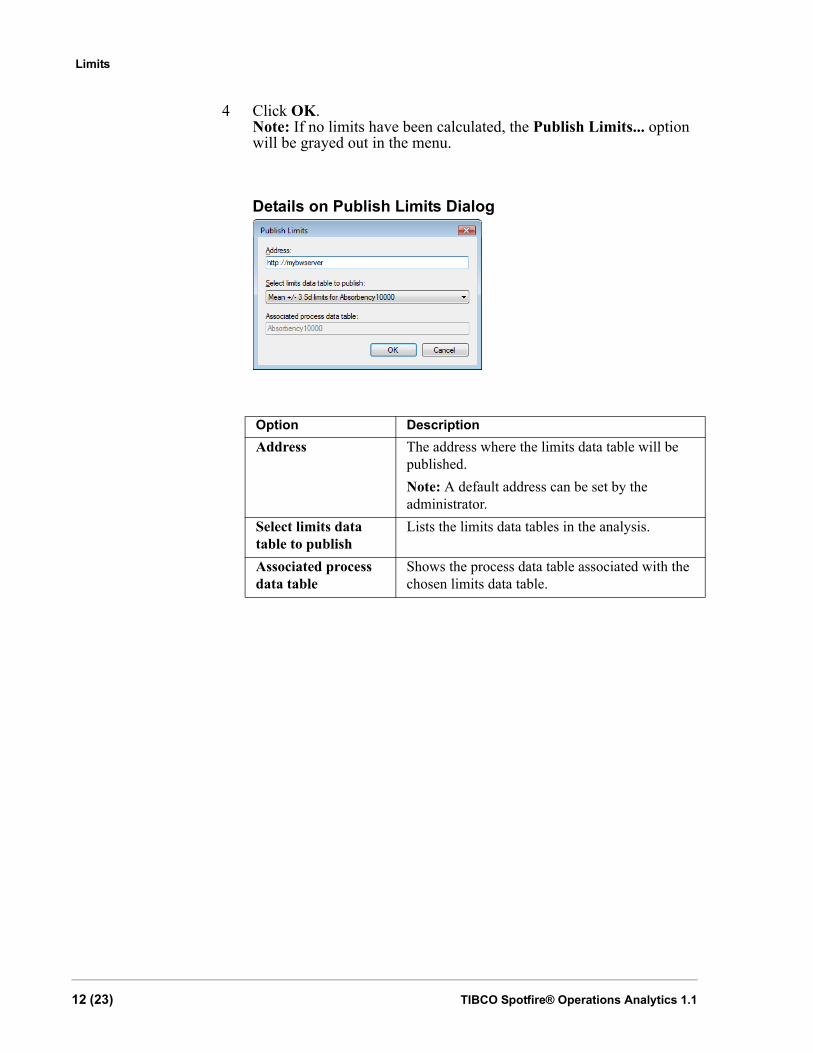
Details on Publish Limits Dialog
Option DescriptionAddress The address where the limits data table will be
published.Note: A default address can be set by the administrator.
Select limits data table to publish
Lists the limits data tables in the analysis.
Associated process data table
Shows the process data table associated with the chosen limits data table.
12 (23) TIBCO Spotfire® Operations Analytics 1.1
Visualizations
3 VisualizationsWhen you have created limits from your process data table, you can analyze the data in TIBCO Spotfire. When the limits have been set, three visualizations are created; a Limits and Metrics table, a Bar chart and a Run chart.
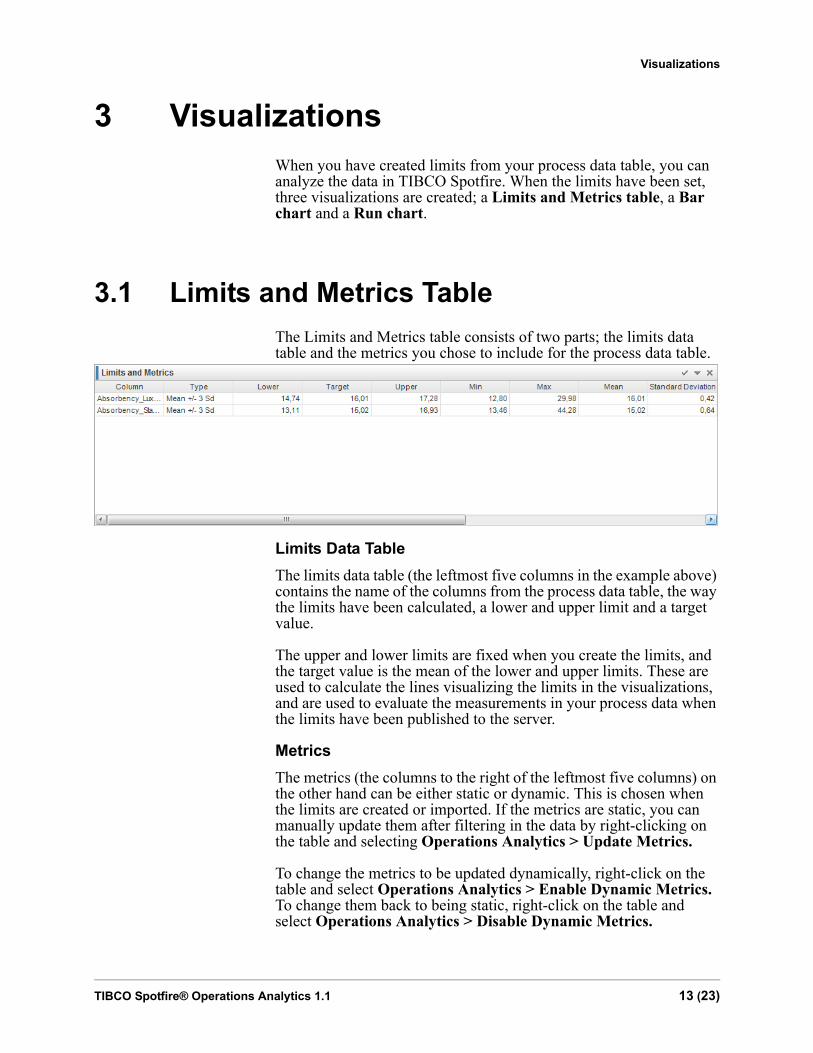
3.1 Limits and Metrics TableThe Limits and Metrics table consists of two parts; the limits data table and the metrics you chose to include for the process data table.
Limits Data TableThe limits data table (the leftmost five columns in the example above) contains the name of the columns from the process data table, the way the limits have been calculated, a lower and upper limit and a target value.
The upper and lower limits are fixed when you create the limits, and the target value is the mean of the lower and upper limits. These are used to calculate the lines visualizing the limits in the visualizations, and are used to evaluate the measurements in your process data when the limits have been published to the server.
MetricsThe metrics (the columns to the right of the leftmost five columns) on the other hand can be either static or dynamic. This is chosen when the limits are created or imported. If the metrics are static, you can manually update them after filtering in the data by right-clicking on the table and selecting Operations Analytics > Update Metrics.
To change the metrics to be updated dynamically, right-click on the table and select Operations Analytics > Enable Dynamic Metrics. To change them back to being static, right-click on the table and select Operations Analytics > Disable Dynamic Metrics.
TIBCO Spotfire® Operations Analytics 1.1 13 (23)
Visualizations
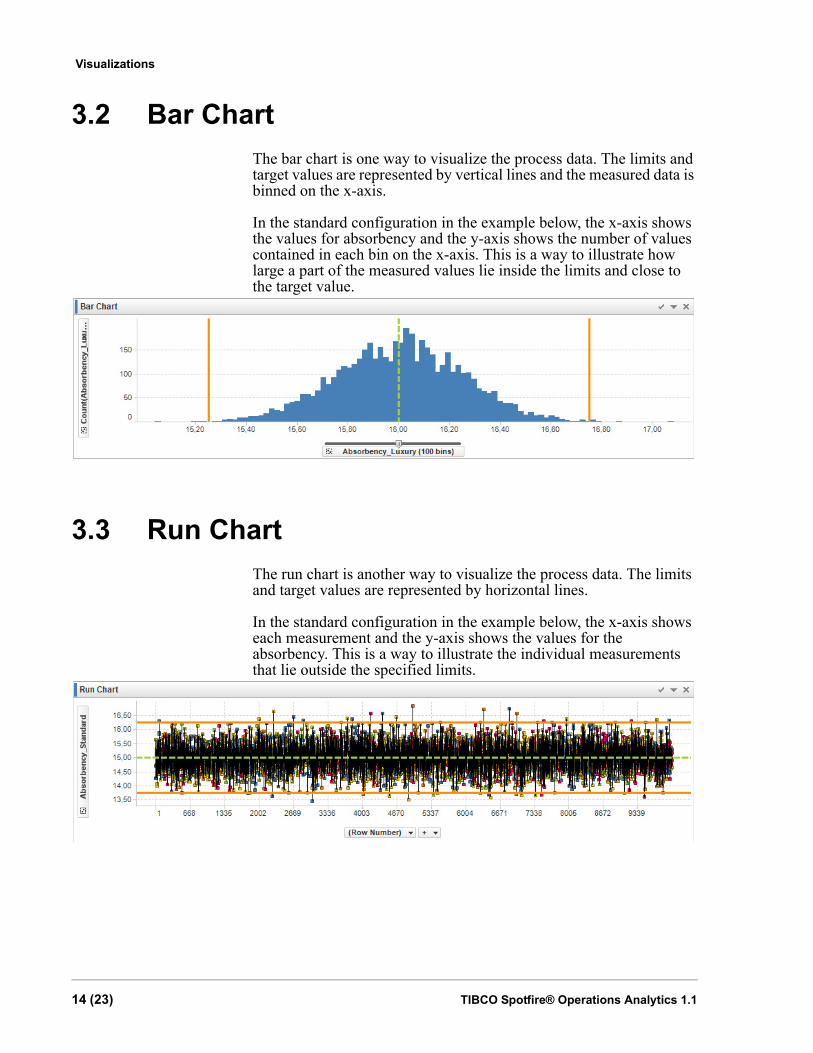
3.2 Bar ChartThe bar chart is one way to visualize the process data. The limits and target values are represented by vertical lines and the measured data is binned on the x-axis.
In the standard configuration in the example below, the x-axis shows the values for absorbency and the y-axis shows the number of values contained in each bin on the x-axis. This is a way to illustrate how large a part of the measured values lie inside the limits and close to the target value.
3.3 Run ChartThe run chart is another way to visualize the process data. The limits and target values are represented by horizontal lines.
In the standard configuration in the example below, the x-axis shows each measurement and the y-axis shows the values for the absorbency. This is a way to illustrate the individual measurements that lie outside the specified limits.
14 (23) TIBCO Spotfire® Operations Analytics 1.1
Visualizations
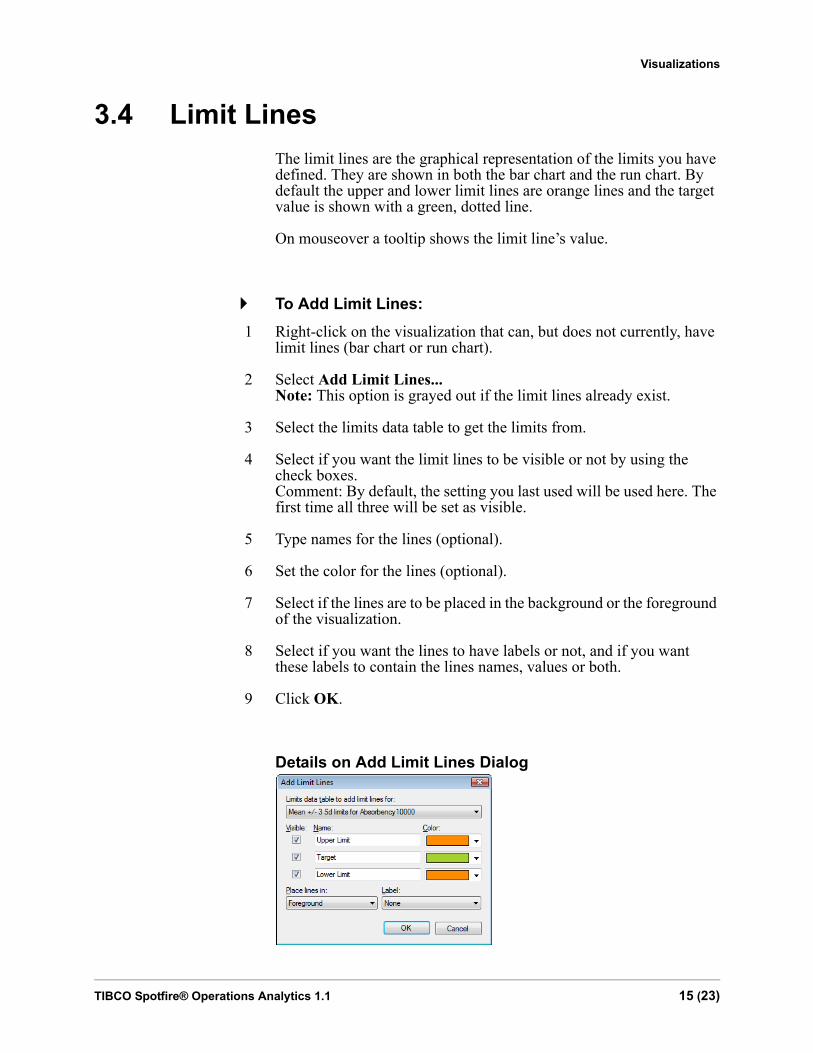
3.4 Limit LinesThe limit lines are the graphical representation of the limits you have defined. They are shown in both the bar chart and the run chart. By default the upper and lower limit lines are orange lines and the target value is shown with a green, dotted line.
On mouseover a tooltip shows the limit line’s value.
To Add Limit Lines:1 Right-click on the visualization that can, but does not currently, have
limit lines (bar chart or run chart).
2 Select Add Limit Lines... Note: This option is grayed out if the limit lines already exist.
3 Select the limits data table to get the limits from.
4 Select if you want the limit lines to be visible or not by using the check boxes. Comment: By default, the setting you last used will be used here. The first time all three will be set as visible.
5 Type names for the lines (optional).
6 Set the color for the lines (optional).
7 Select if the lines are to be placed in the background or the foreground of the visualization.
8 Select if you want the lines to have labels or not, and if you want these labels to contain the lines names, values or both.
9 Click OK.
Details on Add Limit Lines Dialog
TIBCO Spotfire® Operations Analytics 1.1 15 (23)
Visualizations
Option DescriptionLimits data table to add limits for
Lists the limits data tables in the analysis.
Visible Select or clear the check boxes for each line to set if they are to be visible or not in the visualization.
Name Shows suggested names for the lines and lets you type a name for each line.
Color Lists the colors you can set for each line.Place lines in Lets you choose if you want to place the lines in
the background or the foreground of the visualization.
Label Lets you choose if you want the lines to have labels or not, and if you want these labels to contain the lines’ names, values or both.
To Remove Limit Lines:1 Right-click on the visualization with the limit lines you want to
remove (bar chart or run chart).
2 If there are more than one limits data table, select the one you want to remove the lines for.
3 Click OK.
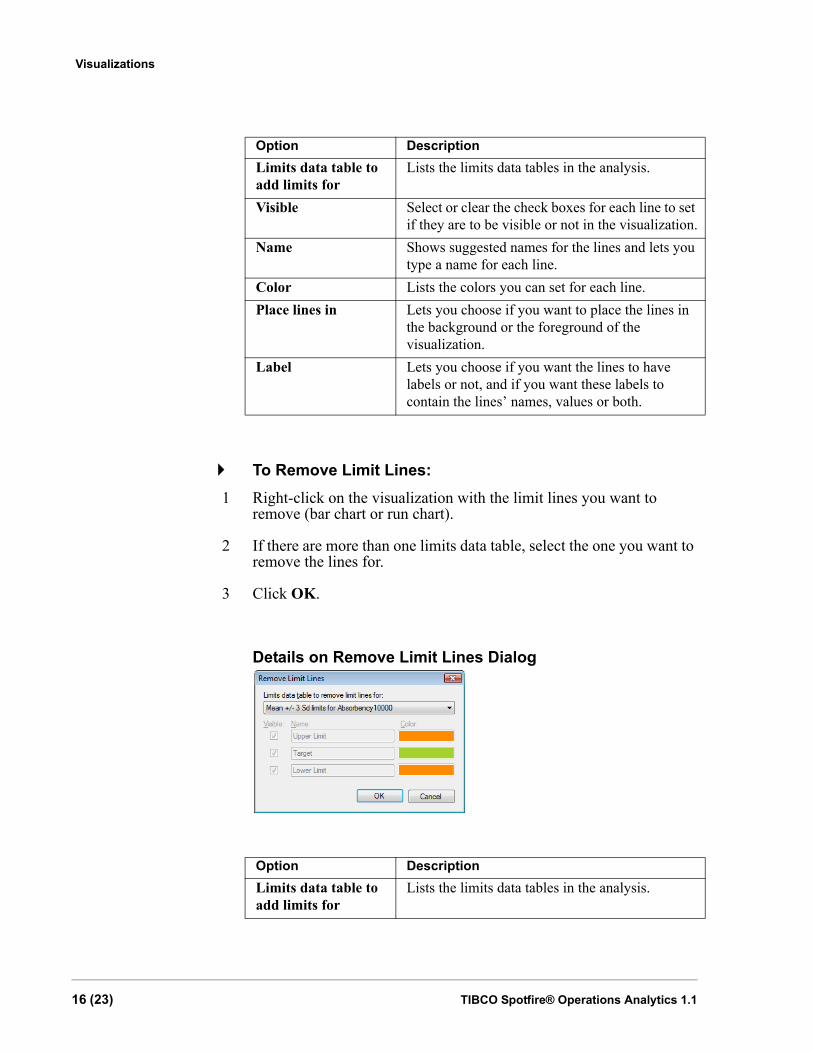
Details on Remove Limit Lines Dialog
Option DescriptionLimits data table to add limits for
Lists the limits data tables in the analysis.
16 (23) TIBCO Spotfire® Operations Analytics 1.1
Visualizations
To Edit Limit Lines:1 Right-click on the visualization with the limit lines you want to edit
(bar chart or run chart).
2 Select Edit Limit Lines...
3 If there are more than one limits data table, select the one you want to edit the lines for.
4 Select if you want the limit lines to be visible or not by using the check boxes.
5 Change the names of the lines (optional).
6 Change the color for the lines (optional).
7 Select if the lines are to be placed in the background or the foreground of the visualization.
8 Select if you want the lines to have labels or not, and if you want these labels to contain the lines’ names, values or both.
9 Click OK.
Visible Shows which of the lines that are visible in the visualization.Note: This option is grayed out and only there for you to see which lines you are about to remove from the visualization.
Name Shows the names of the lines.Note: This option is grayed out and only there for you to see which lines you are about to remove from the visualization.
Color Shows the colors of the lines.Note: This option is grayed out and only there for you to see which lines you are about to remove from the visualization.
TIBCO Spotfire® Operations Analytics 1.1 17 (23)
Visualizations
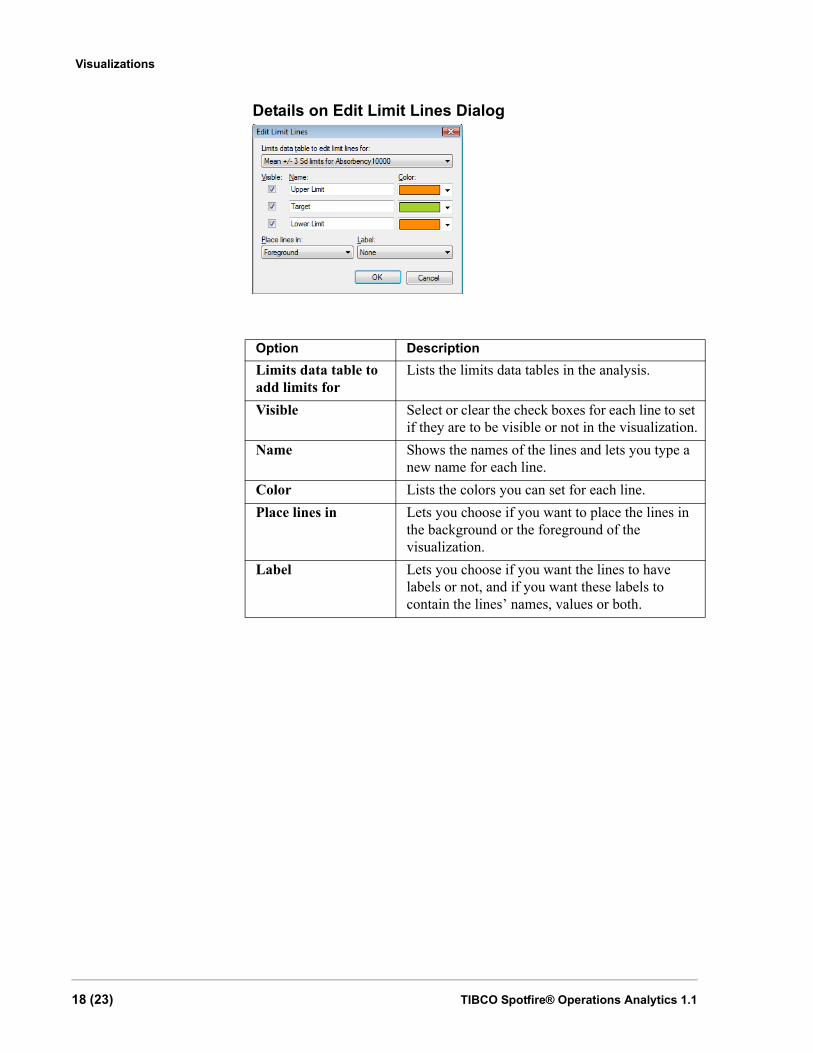
Details on Edit Limit Lines Dialog
Option DescriptionLimits data table to add limits for
Lists the limits data tables in the analysis.
Visible Select or clear the check boxes for each line to set if they are to be visible or not in the visualization.
Name Shows the names of the lines and lets you type a new name for each line.
Color Lists the colors you can set for each line.Place lines in Lets you choose if you want to place the lines in
the background or the foreground of the visualization.
Label Lets you choose if you want the lines to have labels or not, and if you want these labels to contain the lines’ names, values or both.
18 (23) TIBCO Spotfire® Operations Analytics 1.1
Outliers
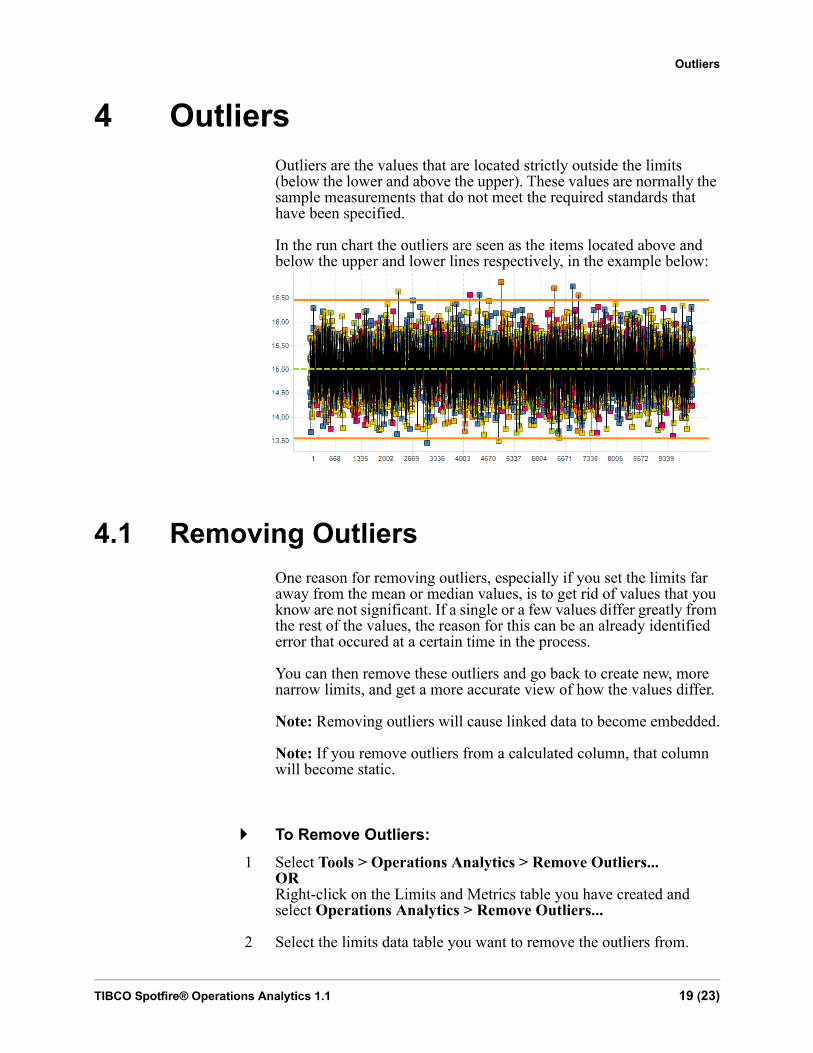
4 OutliersOutliers are the values that are located strictly outside the limits (below the lower and above the upper). These values are normally the sample measurements that do not meet the required standards that have been specified.
In the run chart the outliers are seen as the items located above and below the upper and lower lines respectively, in the example below:
4.1 Removing OutliersOne reason for removing outliers, especially if you set the limits far away from the mean or median values, is to get rid of values that you know are not significant. If a single or a few values differ greatly from the rest of the values, the reason for this can be an already identified error that occured at a certain time in the process.
You can then remove these outliers and go back to create new, more narrow limits, and get a more accurate view of how the values differ.
Note: Removing outliers will cause linked data to become embedded.
Note: If you remove outliers from a calculated column, that column will become static.
To Remove Outliers:1 Select Tools > Operations Analytics > Remove Outliers...
OR Right-click on the Limits and Metrics table you have created and select Operations Analytics > Remove Outliers...
2 Select the limits data table you want to remove the outliers from.
TIBCO Spotfire® Operations Analytics 1.1 19 (23)
Outliers
3 Select which columns in the limits data table you want to remove the outliers from.
4 Click OK.
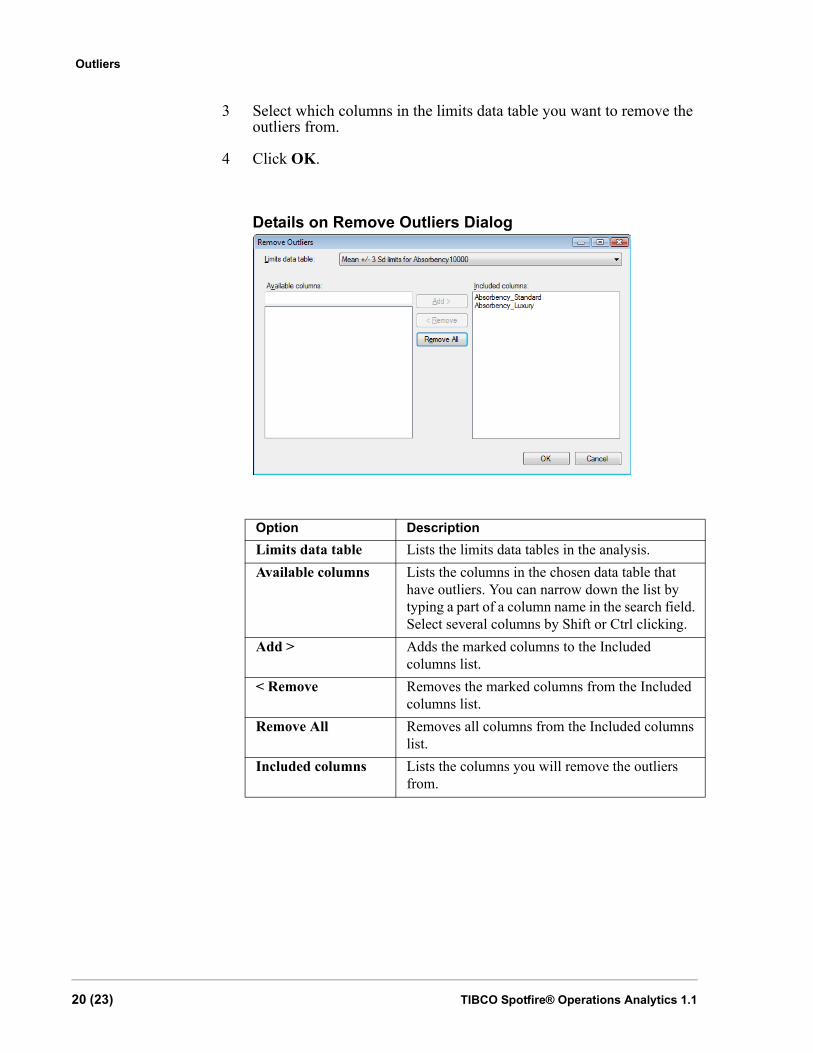
Details on Remove Outliers Dialog
Option DescriptionLimits data table Lists the limits data tables in the analysis.Available columns Lists the columns in the chosen data table that
have outliers. You can narrow down the list by typing a part of a column name in the search field. Select several columns by Shift or Ctrl clicking.
Add > Adds the marked columns to the Included columns list.
< Remove Removes the marked columns from the Included columns list.
Remove All Removes all columns from the Included columns list.
Included columns Lists the columns you will remove the outliers from.
20 (23) TIBCO Spotfire® Operations Analytics 1.1
Notifications
5 NotificationsWhen limits are published to the server, they will be used as rules for the process data. If these rules are breached, the system will notify you on what has happened.
You will recieve an email containing information on which rule has been breached and where.
It will also contain a link to a Spotfire analysis file with the relevant process data. This file lets you analyze the data again and decide if the limits should be updated.
TIBCO Spotfire® Operations Analytics 1.1 21 (23)
Metrics
6 MetricsThese are the metrics that can be included in the limits data table you create when you calculate limits. For more information, see the Limits chapter.
MinThe minimum value included in the column of the process data table.
MaxThe maximum value included in the column of the process data table.
MeanThe mean, or average, is calculated as the sum of all values in the column divided by the number of values.
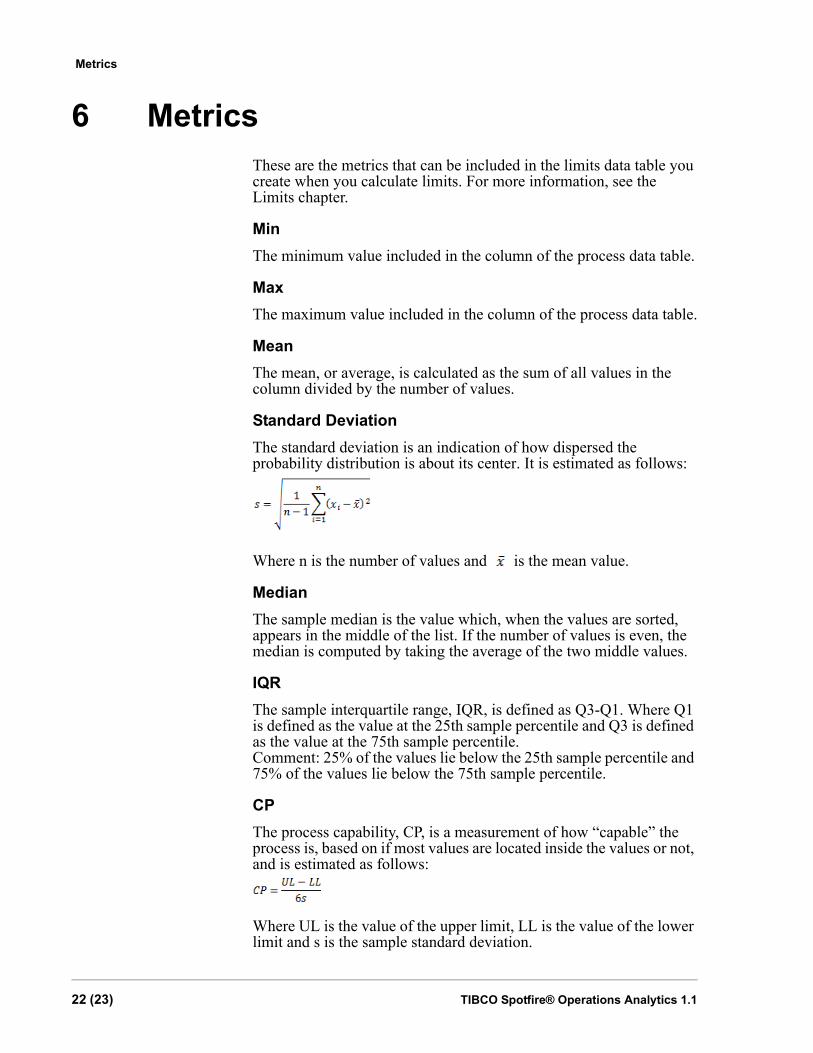
Standard DeviationThe standard deviation is an indication of how dispersed the probability distribution is about its center. It is estimated as follows:
Where n is the number of values and is the mean value.
MedianThe sample median is the value which, when the values are sorted, appears in the middle of the list. If the number of values is even, the median is computed by taking the average of the two middle values.
IQRThe sample interquartile range, IQR, is defined as Q3-Q1. Where Q1 is defined as the value at the 25th sample percentile and Q3 is defined as the value at the 75th sample percentile. Comment: 25% of the values lie below the 25th sample percentile and 75% of the values lie below the 75th sample percentile.
CPThe process capability, CP, is a measurement of how “capable” the process is, based on if most values are located inside the values or not, and is estimated as follows:
Where UL is the value of the upper limit, LL is the value of the lower limit and s is the sample standard deviation.
22 (23) TIBCO Spotfire® Operations Analytics 1.1
Metrics
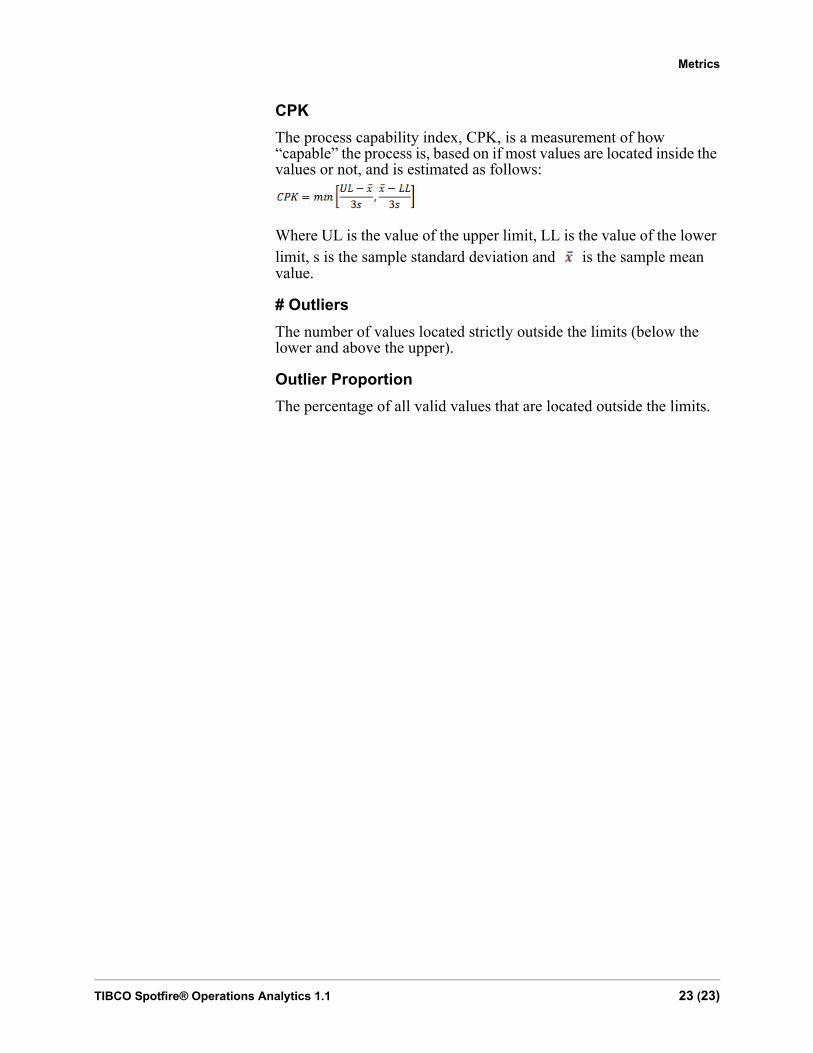
CPKThe process capability index, CPK, is a measurement of how “capable” the process is, based on if most values are located inside the values or not, and is estimated as follows:
Where UL is the value of the upper limit, LL is the value of the lower limit, s is the sample standard deviation and is the sample mean value.
# OutliersThe number of values located strictly outside the limits (below the lower and above the upper).
Outlier ProportionThe percentage of all valid values that are located outside the limits.
TIBCO Spotfire® Operations Analytics 1.1 23 (23)