Thrombolysis in Myocardial Infarction (TIMI) Study Group/media/Files/Activity Files/Research... ·...
30
Institute of Medicine Workshop: Transforming Clinical Research in the United States Investigator, TIMI Study Group Associate Physician, Cardiovascular Division, BWH Assistant Professor of Medicine, Harvard Medical School Marc S. Sabatine, MD, MPH Marc S. Sabatine, MD, MPH October 7, 2009 Thrombolysis in Myocardial Infarction (TIMI) Study Group
Transcript of Thrombolysis in Myocardial Infarction (TIMI) Study Group/media/Files/Activity Files/Research... ·...

Institute of Medicine Workshop:Transforming Clinical Research in the United States
Investigator, TIMI Study GroupAssociate Physician, Cardiovascular Division, BWH
Assistant Professor of Medicine, Harvard Medical School
Marc S. Sabatine, MD, MPHMarc S. Sabatine, MD, MPH
October 7, 2009
Thrombolysis in Myocardial Infarction (TIMI) Study Group

Disclosure Statement
The TIMI Study Group received research grant support from: Accumetrics, Amgen,
AstraZeneca, Bayer Healthcare, Beckman Coulter, Biosite, Bristol-Myers Squibb, CV
Therapeutics, Eli Lilly and Company, GlaxoSmithKline, Inotek Pharmaceuticals,
Integrated Therapeutics, Merck & Co., Millennium Pharmaceuticals, Novartis
Pharmaceuticals, Nuvelo, Ortho-Clinical Diagnostics, Pfizer, Roche Diagnostics, sanofi-
aventis, Schering-Plough Research Institute.
Astra Zeneca (research grant, scientific advisory boards)
Bristol-Myers-Squibb (honoraria, scientific advisory boards)
Eli Lilly & Daiichi-Sankyo (honoraria)
Eisai (research grant)
sanofi-aventis (research grant, honoraria, scientific advisory boards)
Schering-Plough (research grant support)

Description
3
The Thrombolysis in Myocardial Infarction (TIMI) Study
Group is an Academic Research Organization (ARO)
devoted to conducting clinical trials to improve outcomes
in patients with cardiovascular disease.
The group is headquartered at
Brigham and Women’s Hospital & Harvard Medical School
Boston, MA

Trials to Date
• Phase I to Phase IV studies
• Initial trials NHLBI-funded, now trials industry-funded
• NIH grant support for ancillary studies
• 30 to 25,000 subjects
• Trial Status– 45 completed trials
– 6 ongoing trials
– 7 trials in various stages of planning
4

Current Staff
• Physician Staff– Eugene Braunwald, MD – Study Chairman
– 12 Staff Cardiologists
– 3 Senior Cardiology Fellows (2-year research fellowships)
– Rotating BWH Research Residents
• Operational Staff– Carolyn McCabe, BS – Director
– 8 Project Directors & Managers
– Research Assistants, etc.
• Biostatistical Core– Charles Contant, PhD – Director
– Programmers
5

Services
• Academic Leadership
• Project Management
• Biostatistics
• Site Management
• Medical Hotline
• Regulatory Services
• Safety Reporting
• Clinical Events Committee
6

Academic Leadership (1)
• Review the Compound– Pharmacokinetics & Pharmacodynamics
– Animal & Phase I Data
• Refine Scientific Question– Unmet clinical need
– Potential utility of compound
– Current and evolving concomitant treatments
• Initiation of study– Investigator-initiated
– Industry-initiated
7
Clopidogrel in STEMI
15.0
21.7
0
5
10
15
20
25
Oc
clu
de
d A
rte
ry o
r D
ea
th/M
I (
%)
PlaceboPlaceboClopidogrelClopidogrel
n=1752 n=1739
36%Odds Reduction
P<0.0001
36%Odds Reduction
P<0.0001
Sabatine MS et al. NEJM 2005;352:1179
days
CV
Death
, M
I, U
rgen
t R
evasc (
%)
CV
Death
, M
I, U
rgen
t R
evasc (
%)
05
10
15
0 5 10 15 20 25 30
PlaceboPlacebo
ClopidogrelClopidogrel
Odds Ratio 0.80Odds Ratio 0.80
(95% CI 0.65(95% CI 0.65--0.97)0.97)
P=0.026P=0.026
20%20%20%
Angiographic Clinical
0
20
40
60
80
100
120
0
10
20
30
40
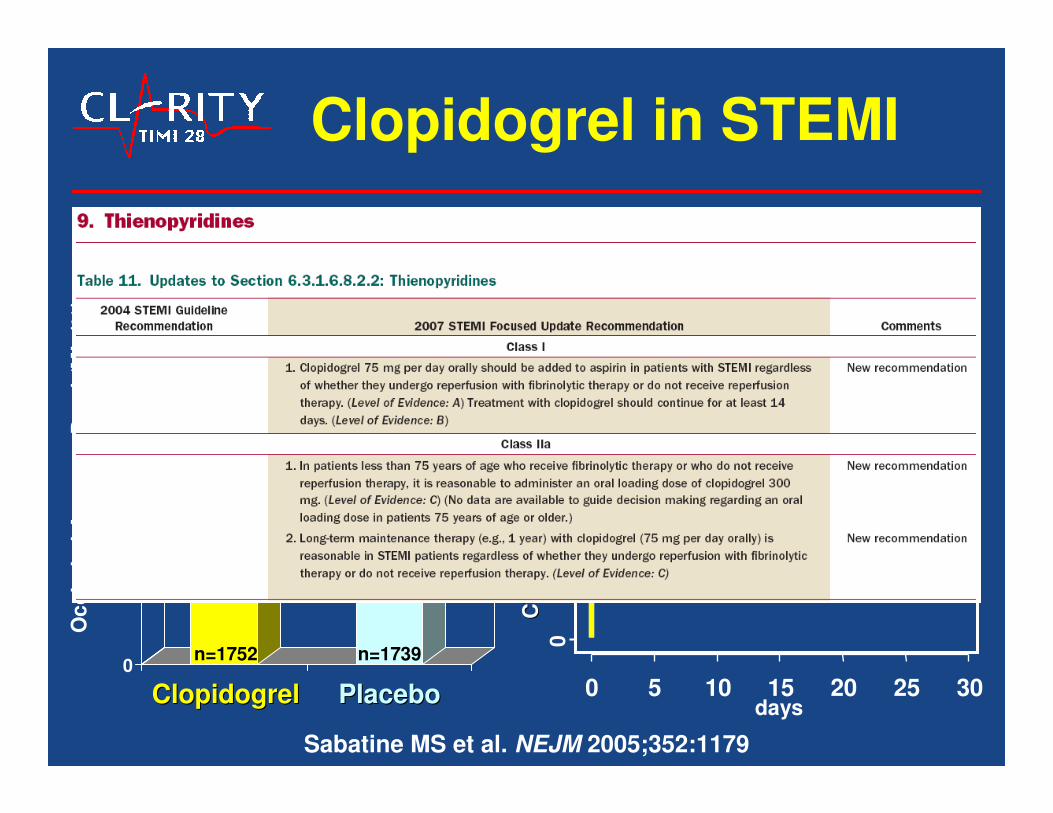
5 µM ADP-induced Platelet Aggregation Death/ACS/CVA by 6 mo
Days
1 2 3 4 5 6
Baselin
e (
%)
Quartiles of response
Q1
Q2
Q3
Q4
Clop resist 40
6.7
0 0
Perc
en
t
P = 0.007
Q1 Q2 Q3 Q4
Matetzky S et al. Circulation. 2004;109:3171-3175. Wiviott SD, Antman EM. Circulation. 2004;109:3064-3067.
Clopidogrel Response Variability andClopidogrel Response Variability and
Increased Risk of Ischemic Events Increased Risk of Ischemic Events Primary PCI for STEMI (N = 60)Primary PCI for STEMI (N = 60)
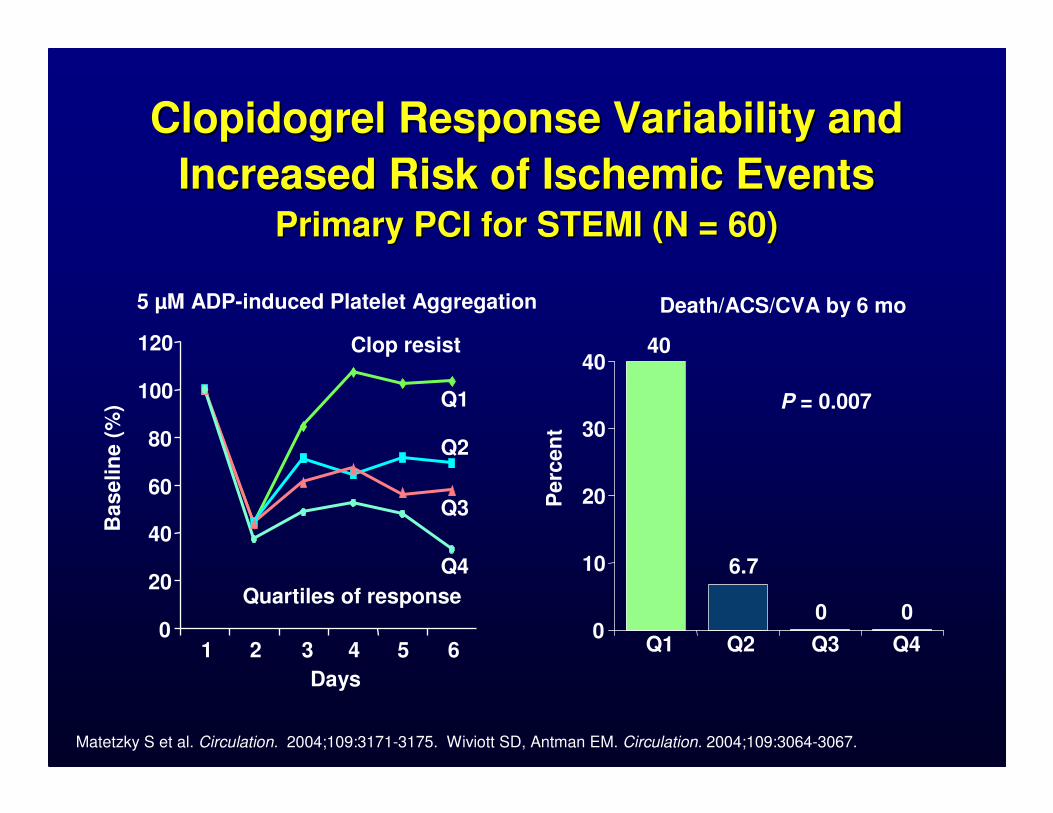
Prasugrel: more potent and predictable Prasugrel: more potent and predictable
platelet inhibitionplatelet inhibition
--20.020.0
0.00.0
20.020.0
40.040.0
60.060.0
80.080.0
100.0100.0
Inh
ibit
ion
of
Pla
tele
t A
gg
reg
ati
on
(%
)In
hib
itio
n o
f P
late
let
Ag
gre
gati
on
(%
)
Response to PrasugrelResponse to PrasugrelResponse to ClopidogrelResponse to Clopidogrel
Clopidogrel Responder
Clopidogrel Non-responder
*Responder = ≥25% IPA at 4 and 24 h
Inte
rpati
en
tV
ari
ab
ilit
y
Inte
rpati
en
tV
ari
ab
ilit
y
Brandt JT et al. Am Heart J. 2007;153:66.e9-e16.

11
Prasugrel: Phase II EfficacyPrasugrel: Phase II Efficacy
4.0%
5.7%
7.0%6.5%
7.9%
0.0%
2.0%
4.0%
6.0%
8.0%
10.0%
Clop Pras 40/7.5 60/10 60/15
P= NS
20/254 37/650 14/199 13/200 10/251R/N
RR=0.72 [0.4,1.2]
P = 0.23
Prasugrel LD/MDTreatment Group
Wiviott SD Circulation 2005
MI at
30 d
ays

0
5
10
15
0 30 60 90 180 270 360 450
HR 0.81
(0.73-0.90)P=0.0004
Prasugrel
Clopidogrel
Days
En
dp
oin
t (%
)
12.1
9.9
HR 1.32
(1.03-1.68)P=0.03
Prasugrel
Clopidogrel1.8
2.4
13,608 Patients with ACS and Planned PCI Randomized to Prasugrel (60/10) vs. Clopidogrel (300/75)
CV Death / MI / Stroke
TIMI Major Non-CABG Bleeds
Wiviott SD et al. NEJM 2007;357:2001-15
7/2009
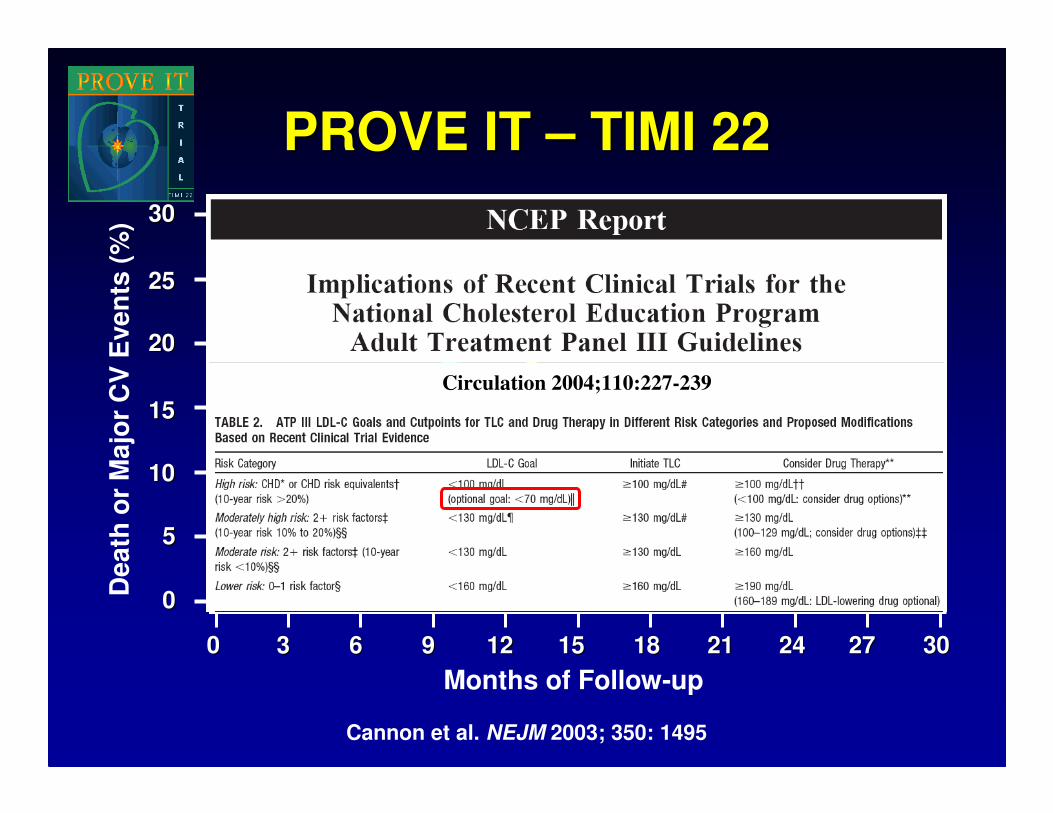
PROVE IT PROVE IT –– TIMI 22TIMI 22
00 33 1818 2121 2424 2727 303066 99 1212 1515
Death
or
Majo
r C
V E
ven
ts (
%)
Months of Follow-up
Pravastatin 40 mgPravastatin 40 mg(avg achieved LDL = 95 mg/dl)(avg achieved LDL = 95 mg/dl)
Atorvastatin 80 mgAtorvastatin 80 mg(avg achieved LDL = 62 mg/dl)(avg achieved LDL = 62 mg/dl)
16% RR16% RR
(P = 0.005)(P = 0.005)
3030
2525
2020
1515
1010
55
00
Cannon et al. NEJM 2003; 350: 1495
Circulation 2004;110:227-239

Academic Leadership (2)
• Develop Study Design– Study population
– Timing of intervention
– Control arm
– Background therapy
– Endpoint(s) and timing of ascertainment
– Statistical analysis plan
• Develop Key Trial Documents– Protocol
– Case Report Form
– Clinical Events Committee (CEC) Charter
– Data Safety and Monitoring Board (DSMB) Charter
14

Academic Leadership (3)
• Study Startup– Country & site selection
• Applicability to U.S.
• Acceptability to other countries
• Cost
– Steering Committee of National Lead Investigators
– Investigator Training
15

U.S. Enrollment
59
13
83
71
1 411
30
512
0
10
20
30
40
50
60
70
80
90
9B 17 18 22 25 28 36 38 42 46
TIMI Study Group Trial
En
roll
me
nt
fro
m U
.S.
(%)
3491324113,6086560349120,5064162222015,0783002N
Ranolaz.
vs. pbo
NSTE-ACS
Prasugrel
vs. clopi
ACS
Phase II:
OTAM
vs. UFH
NSTE-ACS
INV
vs. CONS
NSTE-ACS
Atorva
vs. Prava
Post
ACS
ENOX
vs. UFH
STEMI
w/ lytic
Clopi
vs. pbo
STEMI
w/ lytic
Phase II:
Rivarox.
vs. pbo
nPA
vs. TPA
Hirudin
vs. Heparin
Intervent.
Post
ACS
STEMI
w/ lytic
STEMI
w/ lytic
Population

K-M estimate of time to first primary efficacy event (composite of CV death, MI or stroke)
No. at risk
Clopidogrel
Ticagrelor
9,291
9,333
8,521
8,628
8,362
8,460
8,124
Days after randomisation
6,743
6,743
5,096
5,161
4,047
4,147
0 60 120 180 240 300 360
12
1110
9
87
65
432
10
13
Cu
mu
lati
ve i
ncid
en
ce (
%)
9.8
11.7
8,219
HR 0.84 (95% CI 0.77–0.92), p=0.0003
Clopidogrel
Ticagrelor
K-M = Kaplan-Meier; HR = hazard ratio; CI = confidence interval
Wallentin L et al. NEJM 2009;361:1045-57.

Academic Leadership (4)
• Monitor Study Progress– Enrollment
– Changes in medical landscape
– Aggregate event rates (efficacy & safety)
– Retention
• Lead Study Analysis– Data analysis
– Separate copy of the database
– Rapidly move to presentation of data at scientific meeting
– Drafting of primary manuscript and subsequent analyses
18

CV
death
, M
I o
r str
oke
Days
CLOPIDOGREL PPI vs no PPI: Adj HR 0.94, 95% CI 0.80-1.11
PPI use at randomization (n= 4529)
Clopidogrel
Prasugrel
PRASUGREL PPI vs no PPI: Adj HR 1.00, 95% CI 0.84-1.20
PPI Use & Thienopyridines
O’Donoghue M et al. Lancet 2009.

Clinical Events Committee
• Physician Staff– Stephen D. Wiviott, MD – Director
– Board-certified cardiologists, neurologists, oncologists, endocrinologists, hepatologists
– Seamless integration with eCRF
• Adjudicate Key Endpoints– Efficacy & Safety, including non-cardiovascular events
– 2 Independent reviewers with 3rd as needed
– Consistent application of definitions
– High-level of granularity
20
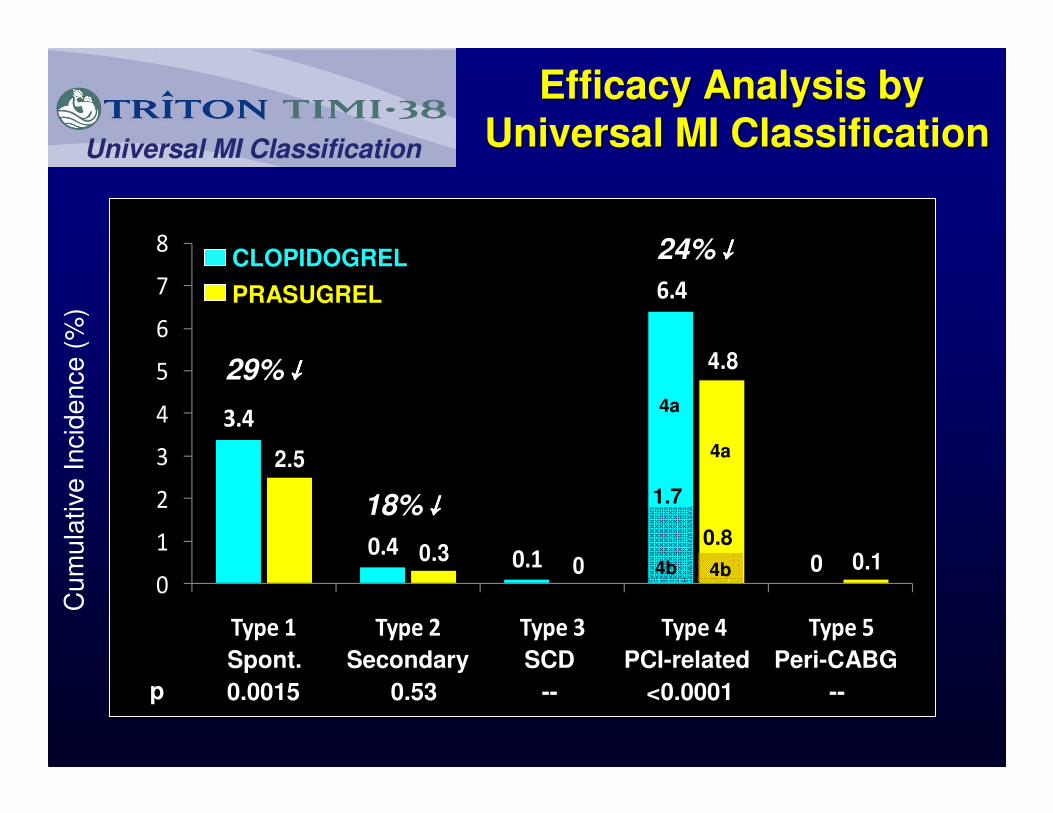
Cum
ula
tive Incid
ence (
%)
3.4
0.40.1
6.4
0
2.5
0.30
4.8
0.10
1
2
3
4
5
6
7
8
Type 1 Type 2 Type 3 Type 4 Type 5
Universal MI Classification
CLOPIDOGREL
PRASUGREL
29%↓↓↓↓
18%↓↓↓↓
24%↓↓↓↓
-- --0.0015 0.53p <0.0001
1.7
4b 4b
0.8
4a
4a
Spont. Secondary SCD PCI-related Peri-CABG
Efficacy Analysis byEfficacy Analysis by
Universal MI ClassificationUniversal MI Classification

Core Labs – Biomarker
• Laboratory– David A. Morrow, MD, MPH - Director
– 2000 sq ft CLIA-accredited lab with state-of-the-art equipment
• Samples– Baseline
– Follow-up
• Analytes– Existing protein biomarkers
– Discovery using proteomics & metabolomics
• Analysis– Independent risk prediction
– Guiding therapy22

Troponin levels in NSTE-ACS
11.7
3.4 3.7
6
7.5
0
1
2
3
4
5
6
7
8
0 to <0.4 0.4 to <1.0 1.0 to <2.0 2.0 to <5.0 5.0 to <9.0 >9.0
Cardiac Troponin I
Mo
rtali
ty a
t 42 d
ays (
%)
831 174 148 134 50 67
Antman et al. NEJM 1996; 335: 1342
P<0.001
χχχχ2 for trend
N=1404
TIMI IIIBTIMI IIIB

14.5
24.2
16.914.3
0
5
10
15
20
25
30
TnT - TnT +
D/M
I/A
CS
at
6 m
os
(%)
CONS INV
Troponin T: Treatment Interaction
TnT cut point = 0.01 ng/ml (54% of Pts TnT +)
OR=0.52OR=0.52p<0.001p<0.001
p=NSp=NS
N= 414 396 463 495
InteractionInteractionP<0.001P<0.001
Cannon NEJM 2001; 344: 1879

17.6
21.8 22.6 22.6
26.4
0
5
10
15
20
25
30
Q1 Q2 Q3 Q4 Q5
MV Model: age, index MV Model: age, index dxdx, prior MI, DM, renal, Rx arm, 30d LDL, 30d CRP, prior MI, DM, renal, Rx arm, 30d LDL, 30d CRP
AdjAdj HR = 1.33 HR = 1.33
(1.01(1.01--1.74)1.74)
Ev
en
t R
ate
(%
)E
ve
nt
Ra
te (
%)
P trend = 0.002P trend = 0.002
654 649 657 654 651
Lp-PLA2 Levels and Risk ofMajor Adverse CV Events
O’Donoghue M et al., Circulation 2006;113:1745

26
Hypothesis Targeting Lp-PLA2 a Key Player in Atherosclerosis
Lumen
Intima
native LDL
carrier of Lp-PLA2
Oxidized LDL
substrate for Lp-PLA2
Sustained
Inflammation
Necrotic Core
Expansion
Leukocyte
Darapladib(Lp-PLA2 inhibitor)
Atheroma
Lp-PLA2
Lp-PLA2
Macphee, Biochem J 1999; Zalewski and Macphee. ATVB. 2005; Shi Atherosclerosis 2007; Kolodgie, ATVB 2006
Core Labs – Pharmacogenetics
• Laboratory– Marc S. Sabatine, MD, MPH - Director
– Multiple core genotyping laboratories at Harvard & MIT
• Genotyping– Candidate genes
– Arrays
• Analysis– Risk prediction
– Response to therapy
27

Hazard Ratio 1.53
(95% CI 1.07-2.19)
P=0.014
8.0
12.1
1064 1009 999 980 870 755 542
Number at Risk:
Days After Randomization
Non-Carrier
395 364 360 348 306 270 181Carrier
CV
De
ath
, M
I, o
r S
tro
ke
(%
)
0
1
2
3
4
5
6
7
8
9
10
11
12
13
14
0 30 90 180 270 360 450
Non-carriers
CarriersCYP2C19 Reduced-Function
Allele Carriers
Non-carriers
HR 1.53(95% CI 1.07-2.19)
P=0.014
* Carriers ~30% of the population
CYP2C19 & Clinical Outcomes
Mega JL et al. & Sabatine MS. N Engl J Med 2009;360:354-62.
1477 Patients w/ ACS and planned PCI Rx’d w/ clopidogrel
Hazard Ratio 3.09
(95% CI 1.19-8.00)
P=0.015
0.8
2.6
1014 1004 1001 989 885 765 547
375 368 366 359 316 279 186
De
fin
ite o
r P
rob
ab
le S
ten
tT
hro
mb
os
is (
%)
0
1
2
3
4
0 30 90 180 270 360 450
Number at Risk:
Days After Randomization
Non-Carrier
Carrier
Non-carriers
Carriers
HR 3.09
(95% CI 1.19-8.00)P=0.015
CYP2C19 Reduced-FunctionAllele Carriers
Non-carriers

Plavix Prescribing Information, Revised May 2009

Value Added by ARO
• Internal validity of a clinical trial– Compliance with the protocol
– Data collection & adjudication
– Statistical analyses
• External validity or generalizability of a clinical trial– Hypothesis to be tested
– Study population (including location)
– Endpoints
• Answering additional questions– Well-characterized dataset
– Embedded mechanistic studies
30