Three‐Dimensional Synaptic Analyses of Mitral Cell and ... example, TCs are more sensitive and...
18
Three-Dimensional Synaptic Analyses of Mitral Cell and External Tufted Cell Dendrites in Rat Olfactory Bulb Glomeruli Jennifer N. Bourne 1 and Nathan E. Schoppa 1,2 * 1 Department of Physiology and Biophysics, University of Colorado School of Medicine, Aurora, Colorado 80045 2 Neuroscience Program, University of Colorado School of Medicine, Aurora, Colorado 80045 ABSTRACT Recent studies have suggested that the two excitatory cell classes of the mammalian olfactory bulb, the mitral cells (MCs) and tufted cells (TCs), differ markedly in physiological responses. For example, TCs are more sensitive and broadly tuned to odors than MCs and also are much more sensitive to stimulation of olfactory sensory neurons (OSNs) in bulb slices. To examine the morphological bases for these differences, we per- formed quantitative ultrastructural analyses of glomeruli in rat olfactory bulb under conditions in which specific cells were labeled with biocytin and 3,3 0 -diaminobenzi- dine. Comparisons were made between MCs and exter- nal TCs (eTCs), which are a TC subtype in the glomerular layer with large, direct OSN signals and capable of mediating feedforward excitation of MCs. Three-dimensional analysis of labeled apical dendrites under an electron microscope revealed that MCs and eTCs in fact have similar densities of several chemical synapse types, including OSN inputs. OSN synapses also were distributed similarly, favoring a distal localiza- tion on both cells. Analysis of unlabeled putative MC dendrites further revealed gap junctions distributed uni- formly along the apical dendrite and, on average, proxi- mally with respect to OSN synapses. Our results suggest that the greater sensitivity of eTCs vs. MCs is due not to OSN synapse number or absolute location but rather to a conductance in the MC dendrite that is well positioned to attenuate excitatory signals passing to the cell soma. Functionally, such a mechanism could allow rapid and dynamic control of OSN-driven action potential firing in MCs through changes in gap junction properties. J. Comp. Neurol. 000:000–000, 2016. V C 2016 Wiley Periodicals, Inc. INDEXING TERMS: olfaction; glomerulus; serial section electron microscopy; gap junctions; reconstructions; sensory neuron; RRID:SCR_002716 Within the mammalian olfactory bulb, olfactory senso- ry neurons (OSNs) transmit information onto output mitral cells (MCs) and various subpopulations of tufted cells (TCs) that differ in location of their cell bodies and arborization (Macrides and Schneider, 1982; Orona et al., 1984; Schoenfeld et al., 1985; Antal et al., 2006; Imai, 2014). Recent physiological studies have sug- gested that MCs and TCs in fact have quite distinct odor-evoked responses. Compared with TCs, MCs are less sensitive to odors, more odor selective, and display significantly delayed action potentials (spikes; Nagayama et al., 2004, Igarishi et al., 2012, Fukunaga et al., 2012; Otazu et al., 2015). Differences have also been observed in synaptic responses in brain slice experiments. For example, in response to stimulation of OSNs at a given intensity, MCs display much weaker somatic current and voltage responses with the rapid time course expected for direct OSN-to-MC transmis- sion (De Saint Jan et al., 2009; Najac et al., 2011; Gire et al., 2012; Burton and Urban, 2014; Vaaga and West- brook, 2016). MCs also have much smaller optogeneti- cally evoked currents that are insensitive to the sodium channel blocker tetrodotoxin (Gire et al., 2012), often used to assay monosynaptic excitation (Petreanu et al., 2009). Among TCs, the largest direct OSN currents appear to be in superficial TCs, a class of output cells Grant sponsor: National Institutes of Health; Grant number: R01 DC006640 (to N.E.S.). *CORRESPONDENCE TO: Nathan E. Schoppa, PhD, University of Colora- do School of Medicine, 12800 East 19th Ave., Rm. P18-7115, Aurora, CO 80045. E-mail: [email protected] Received March 15, 2016; Revised June 13, 2016; Accepted July 28, 2016. DOI 10.1002/cne.24089 Published online Month 00, 2016 in Wiley Online Library (wileyonlinelibrary.com) V C 2016 Wiley Periodicals, Inc. The Journal of Comparative Neurology | Research in Systems Neuroscience 00:00–00 (2016) 1 RESEARCH ARTICLE
-
Upload
truongtruc -
Category
Documents
-
view
216 -
download
2
Transcript of Three‐Dimensional Synaptic Analyses of Mitral Cell and ... example, TCs are more sensitive and...

Three-Dimensional Synaptic Analyses of Mitral Celland External Tufted Cell Dendrites in Rat OlfactoryBulb Glomeruli
Jennifer N. Bourne1 and Nathan E. Schoppa1,2*1Department of Physiology and Biophysics, University of Colorado School of Medicine, Aurora, Colorado 800452Neuroscience Program, University of Colorado School of Medicine, Aurora, Colorado 80045
ABSTRACTRecent studies have suggested that the two excitatory
cell classes of the mammalian olfactory bulb, the mitral
cells (MCs) and tufted cells (TCs), differ markedly in
physiological responses. For example, TCs are more
sensitive and broadly tuned to odors than MCs and
also are much more sensitive to stimulation of olfactory
sensory neurons (OSNs) in bulb slices. To examine the
morphological bases for these differences, we per-
formed quantitative ultrastructural analyses of glomeruli
in rat olfactory bulb under conditions in which specific
cells were labeled with biocytin and 3,30-diaminobenzi-
dine. Comparisons were made between MCs and exter-
nal TCs (eTCs), which are a TC subtype in the
glomerular layer with large, direct OSN signals and
capable of mediating feedforward excitation of MCs.
Three-dimensional analysis of labeled apical dendrites
under an electron microscope revealed that MCs and
eTCs in fact have similar densities of several chemical
synapse types, including OSN inputs. OSN synapses
also were distributed similarly, favoring a distal localiza-
tion on both cells. Analysis of unlabeled putative MC
dendrites further revealed gap junctions distributed uni-
formly along the apical dendrite and, on average, proxi-
mally with respect to OSN synapses. Our results
suggest that the greater sensitivity of eTCs vs. MCs is
due not to OSN synapse number or absolute location
but rather to a conductance in the MC dendrite that is
well positioned to attenuate excitatory signals passing
to the cell soma. Functionally, such a mechanism could
allow rapid and dynamic control of OSN-driven action
potential firing in MCs through changes in gap junction
properties. J. Comp. Neurol. 000:000–000, 2016.
VC 2016 Wiley Periodicals, Inc.
INDEXING TERMS: olfaction; glomerulus; serial section electron microscopy; gap junctions; reconstructions; sensory
neuron; RRID:SCR_002716
Within the mammalian olfactory bulb, olfactory senso-
ry neurons (OSNs) transmit information onto output
mitral cells (MCs) and various subpopulations of tufted
cells (TCs) that differ in location of their cell bodies and
arborization (Macrides and Schneider, 1982; Orona
et al., 1984; Schoenfeld et al., 1985; Antal et al., 2006;
Imai, 2014). Recent physiological studies have sug-
gested that MCs and TCs in fact have quite distinct
odor-evoked responses. Compared with TCs, MCs are
less sensitive to odors, more odor selective, and display
significantly delayed action potentials (spikes;
Nagayama et al., 2004, Igarishi et al., 2012, Fukunaga
et al., 2012; Otazu et al., 2015). Differences have also
been observed in synaptic responses in brain slice
experiments. For example, in response to stimulation of
OSNs at a given intensity, MCs display much weaker
somatic current and voltage responses with the rapid
time course expected for direct OSN-to-MC transmis-
sion (De Saint Jan et al., 2009; Najac et al., 2011; Gire
et al., 2012; Burton and Urban, 2014; Vaaga and West-
brook, 2016). MCs also have much smaller optogeneti-
cally evoked currents that are insensitive to the sodium
channel blocker tetrodotoxin (Gire et al., 2012), often
used to assay monosynaptic excitation (Petreanu et al.,
2009). Among TCs, the largest direct OSN currents
appear to be in superficial TCs, a class of output cells
Grant sponsor: National Institutes of Health; Grant number: R01DC006640 (to N.E.S.).
*CORRESPONDENCE TO: Nathan E. Schoppa, PhD, University of Colora-do School of Medicine, 12800 East 19th Ave., Rm. P18-7115, Aurora, CO80045. E-mail: [email protected]
Received March 15, 2016; Revised June 13, 2016;Accepted July 28, 2016.DOI 10.1002/cne.24089Published online Month 00, 2016 in Wiley Online Library(wileyonlinelibrary.com)VC 2016 Wiley Periodicals, Inc.
The Journal of Comparative Neurology | Research in Systems Neuroscience 00:00–00 (2016) 1
RESEARCH ARTICLE

with cell bodies in the outer external plexiform layer,
and external TCs (eTCs), which are glutamatergic inter-
neurons in the glomerular layer that lack lateral den-
drites. The difference in synaptic responses between
MCs and eTCs also extends to inhibitory synapses;
eTCs have substantially larger inhibitory currents that
reflect inputs from glomerular layer interneurons in
direct comparisons (Gire and Schoppa, 2009; Whitesell
et al., 2013; Banerjee et al., 2015).
At an ultrastructural level, very little is known about
the synaptic organization of MC and TC apical dendrites
that could give rise to the different physiological
responses. One limitation has been that the vast major-
ity of ultrastructural studies of OSN synapses have not
differentiated whether the postsynaptic dendrites were
from MCs or TCs (Pinching and Powell, 1971; White,
1972; Hinds and Hinds, 1976; Kasowski et al., 1999).
Thus, simple issues such as the number of OSN synap-
tic contacts onto MCs (Kosaka et al., 2001; Najac
et al., 2011) or TCs have never been addressed. A den-
drite’s complement of ion channels can also impact the
size of synaptic signals at the cell soma, as reflected in
both current and voltage measurements (Rall, 1967;
Williams and Mitchell, 2008). In this context, it is inter-
esting that MCs have a large (�1 nS) gap junctional
conductance in their apical dendritic tufts (Schoppa
and Westbrook, 2002; Christie et al., 2005; Pimental
and Margrie, 2008; Maher et al., 2009) that is present
at a much lower level in eTCs (Hayar et al., 2005; Gire
et al., 2012). Furthermore, knockout (KO) of the gap
junction protein connexin (Cx) 36 results in the emer-
gence of large, direct OSN currents in MCs and rapid
spiking (Gire et al., 2012). However, the distribution of
gap junctions in MC apical dendrites is not known.
Here we conducted ultrastructural analyses to under-
stand the synaptic organization of the apical dendrites
of MCs and eTCs. eTCs, and not other TC subtypes,
were chosen for the analysis because of their much
larger monosynaptic OSN current vs. MCs in paired-cell
recordings (Gire et al., 2012; Vaaga and Westbrook,
2016) and large inhibitory synaptic currents. eTCs can
also mediate feedforward excitation of MCs (OSN-to-
eTC-to-MC; De Saint Jan et al., 2009; Najac et al.,
2011; Gire et al., 2012), so their comparative synaptic
organization vs. that of MCs will likely contribute to
whether MCs are excited via eTCs or directly by OSNs.
We labeled MCs and eTCs in olfactory bulb slices with
biocytin, which was then converted into an electron-
dense substrate using an avidin-biotin complex and
3,30-diaminobenzidine (DAB). Serial section electron
microscopy was used to create three-dimensional
reconstructions of DAB-labeled MC and eTC dendrites
in which the density and distribution of OSN synapses
as well as other chemical synapse types could be quan-
tified. In addition, for a population of unlabeled putative
MC dendrites, we examined the distribution of gap
junctions and their spatial relationship with respect to
OSN synapses and presynaptic sites of neurotransmit-
ter release.
MATERIALS AND METHODS
Cell labeling in olfactory bulb slicesHorizontal olfactory bulb slices (330-mm thickness)
were prepared from three young Sprague Dawley rats
(postnatal day [P]8–14; male and female) following gen-
eral isofluorane anesthesia and decapitation. Slices
were then transferred to a recording chamber with oxy-
genated (95% O2, 5% CO2) extracellular solution con-
taining (in mM): 125 NaCl, 25 NaHCO3, 1.25 NaH2PO4,
25 glucose, 3 KCl, 2 CaCl2, 1 MgCl2 (pH 7.3). Patch pip-
ettes for whole-cell fills contained (in mM): 125 K-
gluconate, 2 MgCl2, 0.025 CaCl2, 1 EGTA, 2 NaATP, 0.5
NaGTP, 10 HEPES (pH 7.3 with KOH), and biocytin (1%).
Intracellular solutions were supplemented with 100 mM
Alexa 488 dye (Invitrogen, Carlsbad, CA) to establish
cellular morphology during the fills.
Olfactory bulb slices were visualized on an upright
fluorescence microscope (Zeiss Axioskop) equipped
with DIC optics. MCs and eTCs were patched and
allowed to fill for 10–15 minutes. Patch pipettes were
then gently removed from the cell body, allowing the
membrane to reseal. All cell fills were performed
between 32 8C and 35 8C. Once cells with intact den-
dritic arbors had been filled in a given slice, slices were
fixed overnight at 4 8C in 1% paraformaldehyde and
2.5% glutaraldehyde in 0.1 M phosphate buffer (pH 7.4).
On the next day, slices were rinsed in 0.1 M phos-
phate buffer and incubated in a 3% H2O2 solution for
30 minutes. The tissue was then cryoprotected in
increasing concentrations of sucrose solution (10%/
20%/30%) and freeze/thawed in liquid nitrogen five or
six times. Slices were incubated in 1% ABC Solution
(Vectastain Elite ABC kit; Vector, Burlingame, CA) at
room temperature for 1 hour and then overnight at
4 8C. After rinsing of the tissue in 0.1 M phosphate buff-
er, slices were incubated in a 1% DAB solution for 30
minutes before 3% H2O2 was added to catalyze the
reaction. Once cells filled with biocytin had turned
brown/black (30–60 seconds), the reaction was
stopped by transferring the slices back to 0.1 M phos-
phate buffer (Fig. 1A).
Electron microscopySlices were embedded in 5% agarose in 0.1 M phos-
phate buffer and sliced on a vibratome into 80-mm-thick
J.N. Bourne and N.E. Schoppa
2 The Journal of Comparative Neurology |Research in Systems Neuroscience

Figure 1. Characterization of apical
dendrites of mitral cells (MCs) and
external tufted cells (eTCs). A: Exam-
ple MC labeled with biocytin following
incubation with an avidin-biotin com-
plex and reaction with DAB. B: Apical
dendritic tuft from same MC shown in
A after treatment with osmium tetrox-
ide. C,D: Example reconstructions of
DAB-labeled dendrites (light yellow) of
MCs (C) and eTCs (D). Olfactory sen-
sory neuron (OSN; red) synapses are
indicated, as are non-OSN putative
excitatory axonal synapses (orange;
orange arrows) and putative inhibitory
dendrodendritic synapses (gray; black
arrows). E: Example electron micro-
graph (EM) of a DAB-labeled MC den-
drite receiving an axodendritic
synapse from an OSN as indicated by
the docked presynaptic vesicles
(example at red arrowhead) and active
zone (red bracket). F: Example EM of
a DAB-labeled MC dendrite receiving
a putative inhibitory dendrodendritic
synapse as indicated by docked pre-
synaptic vesicles (example at white
arrowhead) and active zone (white
bracket). The putative inhibitory den-
drite is also receiving an asymmetric
axodendritic synapse from an OSN
(red arrow). G,H: Spine-like protru-
sions with putative excitatory synap-
ses and nonsynaptic filopodia-like
structures emerging from the dendritic
shaft of MCs (G) and eTCs (H). Scale
bars 5 100 mm in A,B; 0.5 mm in E,F;
scale cubes 5 1mm3.
Synaptic Analyses Of Olfactory Bulb Glomeruli
The Journal of Comparative Neurology | Research in Systems Neuroscience 3
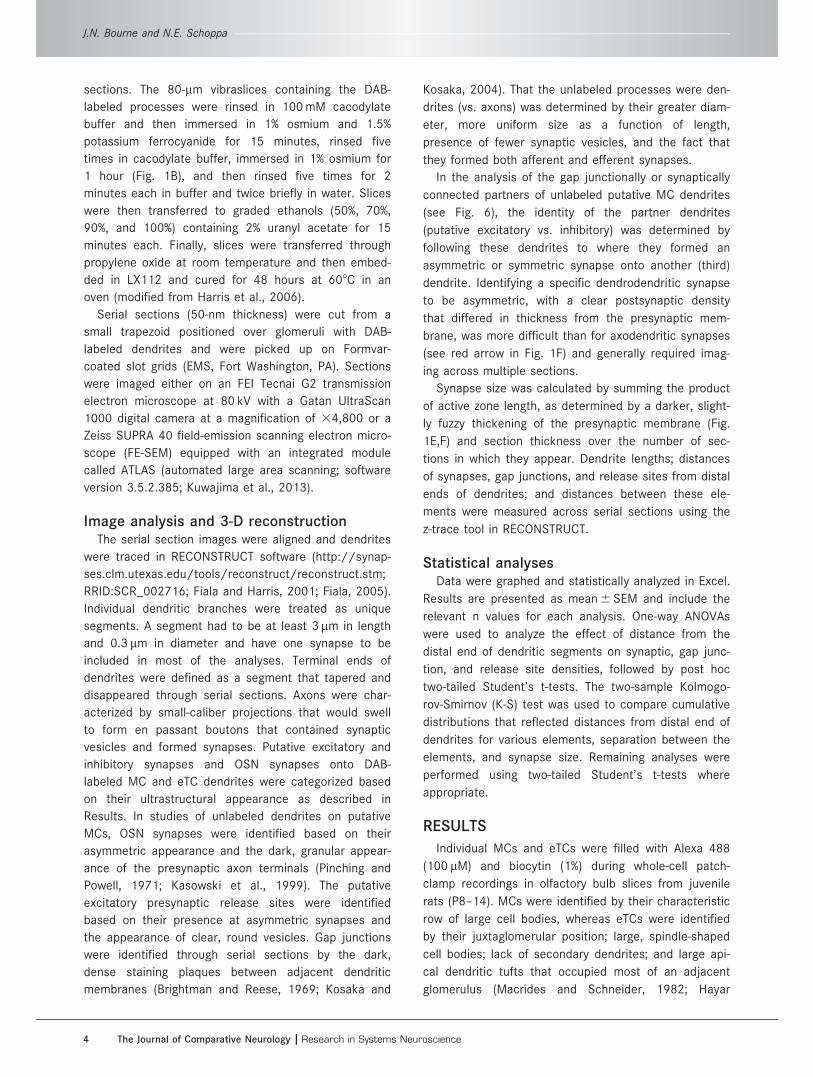
sections. The 80-mm vibraslices containing the DAB-
labeled processes were rinsed in 100 mM cacodylate
buffer and then immersed in 1% osmium and 1.5%
potassium ferrocyanide for 15 minutes, rinsed five
times in cacodylate buffer, immersed in 1% osmium for
1 hour (Fig. 1B), and then rinsed five times for 2
minutes each in buffer and twice briefly in water. Slices
were then transferred to graded ethanols (50%, 70%,
90%, and 100%) containing 2% uranyl acetate for 15
minutes each. Finally, slices were transferred through
propylene oxide at room temperature and then embed-
ded in LX112 and cured for 48 hours at 608C in an
oven (modified from Harris et al., 2006).
Serial sections (50-nm thickness) were cut from a
small trapezoid positioned over glomeruli with DAB-
labeled dendrites and were picked up on Formvar-
coated slot grids (EMS, Fort Washington, PA). Sections
were imaged either on an FEI Tecnai G2 transmission
electron microscope at 80 kV with a Gatan UltraScan
1000 digital camera at a magnification of 34,800 or a
Zeiss SUPRA 40 field-emission scanning electron micro-
scope (FE-SEM) equipped with an integrated module
called ATLAS (automated large area scanning; software
version 3.5.2.385; Kuwajima et al., 2013).
Image analysis and 3-D reconstructionThe serial section images were aligned and dendrites
were traced in RECONSTRUCT software (http://synap-
ses.clm.utexas.edu/tools/reconstruct/reconstruct.stm;
RRID:SCR_002716; Fiala and Harris, 2001; Fiala, 2005).
Individual dendritic branches were treated as unique
segments. A segment had to be at least 3 mm in length
and 0.3 mm in diameter and have one synapse to be
included in most of the analyses. Terminal ends of
dendrites were defined as a segment that tapered and
disappeared through serial sections. Axons were char-
acterized by small-caliber projections that would swell
to form en passant boutons that contained synaptic
vesicles and formed synapses. Putative excitatory and
inhibitory synapses and OSN synapses onto DAB-
labeled MC and eTC dendrites were categorized based
on their ultrastructural appearance as described in
Results. In studies of unlabeled dendrites on putative
MCs, OSN synapses were identified based on their
asymmetric appearance and the dark, granular appear-
ance of the presynaptic axon terminals (Pinching and
Powell, 1971; Kasowski et al., 1999). The putative
excitatory presynaptic release sites were identified
based on their presence at asymmetric synapses and
the appearance of clear, round vesicles. Gap junctions
were identified through serial sections by the dark,
dense staining plaques between adjacent dendritic
membranes (Brightman and Reese, 1969; Kosaka and
Kosaka, 2004). That the unlabeled processes were den-
drites (vs. axons) was determined by their greater diam-
eter, more uniform size as a function of length,
presence of fewer synaptic vesicles, and the fact that
they formed both afferent and efferent synapses.
In the analysis of the gap junctionally or synaptically
connected partners of unlabeled putative MC dendrites
(see Fig. 6), the identity of the partner dendrites
(putative excitatory vs. inhibitory) was determined by
following these dendrites to where they formed an
asymmetric or symmetric synapse onto another (third)
dendrite. Identifying a specific dendrodendritic synapse
to be asymmetric, with a clear postsynaptic density
that differed in thickness from the presynaptic mem-
brane, was more difficult than for axodendritic synapses
(see red arrow in Fig. 1F) and generally required imag-
ing across multiple sections.
Synapse size was calculated by summing the product
of active zone length, as determined by a darker, slight-
ly fuzzy thickening of the presynaptic membrane (Fig.
1E,F) and section thickness over the number of sec-
tions in which they appear. Dendrite lengths; distances
of synapses, gap junctions, and release sites from distal
ends of dendrites; and distances between these ele-
ments were measured across serial sections using the
z-trace tool in RECONSTRUCT.
Statistical analysesData were graphed and statistically analyzed in Excel.
Results are presented as mean 6 SEM and include the
relevant n values for each analysis. One-way ANOVAs
were used to analyze the effect of distance from the
distal end of dendritic segments on synaptic, gap junc-
tion, and release site densities, followed by post hoc
two-tailed Student’s t-tests. The two-sample Kolmogo-
rov-Smirnov (K-S) test was used to compare cumulative
distributions that reflected distances from distal end of
dendrites for various elements, separation between the
elements, and synapse size. Remaining analyses were
performed using two-tailed Student’s t-tests where
appropriate.
RESULTS
Individual MCs and eTCs were filled with Alexa 488
(100 lM) and biocytin (1%) during whole-cell patch-
clamp recordings in olfactory bulb slices from juvenile
rats (P8–14). MCs were identified by their characteristic
row of large cell bodies, whereas eTCs were identified
by their juxtaglomerular position; large, spindle-shaped
cell bodies; lack of secondary dendrites; and large api-
cal dendritic tufts that occupied most of an adjacent
glomerulus (Macrides and Schneider, 1982; Hayar
J.N. Bourne and N.E. Schoppa
4 The Journal of Comparative Neurology |Research in Systems Neuroscience

et al., 2004). After incubation with an avidin-biotin com-
plex, tissue was reacted with DAB to form an electron-
dense substrate (see MC example in Fig. 1A,B) and
then processed for electron microscopy.
Basic characterization of DAB-labeleddendrites and synapses
Serial sections (50–150 sections, 50-nm thickness)
of glomeruli containing DAB-labeled MC or eTC den-
drites were cut and imaged on a transmission electron
microscope. Images of the dendrites and their synapses
were then aligned, traced, and reconstructed. Dendritic
segments from both MCs (Fig. 1C) and eTCs (Fig. 1D)
varied in length and synaptic density. Thirteen dendritic
segments from two labeled MCs ranged in length from
4.1 to 34.8mm, with overall synaptic densities that
ranged from 0.16 to 1.38 synapses (syn)/mm. Ten den-
drites from two labeled eTC cells ranged in length from
3.5 to 22.2 mm and had synaptic densities varying from
0.29 to 1.12 syn/mm. The two example cells represent-
ing MCs or eTCs did not differ in the length of their
reconstructed segments (P� 0.12) nor their total syn-
aptic density (P� 0.52), so their data for each cell type
were pooled. The average lengths of the dendritic seg-
ments sampled were similar for MCs vs. eTCs (MC,
11.2 6 2.1 mm; eTC, 8.6 6 1.4 mm; P 5 0.38). Dendrites
from eTCs were more likely to be branched than MC
dendrites (83% of eTC dendrites vs. 30% of MC
dendrites).
The categorization of synapses onto the DAB-labeled
dendrites was complicated by the fact that the DAB
precipitate obscured possible postsynaptic densities.
This made it difficult to determine whether the synap-
ses were asymmetric or symmetric, which is one of the
ultrastructural criteria typically used to distinguish puta-
tive excitatory vs. inhibitory synapses (Gray, 1959;
Colonnier, 1968). Instead, we defined a synapse onto
labeled dendrites to be “putatively excitatory” if it had
round, clear vesicles at the presynaptic membrane (Fig.
1E). Additionally, when the processes containing these
presynaptic elements were followed, they formed asym-
metric synapses onto unlabeled dendrites (for examples
of asymmetric synapsessee Figs. 1F [red arrow], 6Aii).
Similarly, “putatively inhibitory” synapses had pleomor-
phic, flattened vesicles (Fig. 1F), and their associated
processes formed symmetric synapses onto unlabeled
dendrites (for example of symmetric synapse see
Fig. 6B2). These methods for categorizing synapses
assumed that an individual process making synapses
onto the DAB-labeled dendrite was homotypic for
functional type (either excitatory or inhibitory), but this
was generally reasonable given available data. Both
putative excitatory and inhibitory synapses were inter-
mingled on the dendritic segments from MCs (Fig. 1C)
and eTCs (Fig. 1D).
The large majority of putative excitatory synapses
were formed directly onto the dendritic shafts of both
cell types (90% of synapses on MCs, 92% of synapses
on eTCs), although examples on spine-like protrusions
were also observed (Fig. 1G,H). All of the putative excit-
atory synapses on the spine-like protrusions had the
ultrastructural characteristics of OSN synapses (see
below). Spine-like protrusions were characterized by a
bulbous head, some extending small membranous pro-
jections, and a narrower neck that connected back to
the dendritic shaft. Unlike typical dendritic spines in
the cortex or hippocampus (Bourne and Harris, 2008),
the synapses were usually not on the end of the spine-
like protrusions. Putative inhibitory synapses were
always on the dendritic shaft. In addition, both MC and
eTC dendrites had nonsynaptic filopodia-like structures
that were long (>0.5 mm), thin projections arising from
the dendritic shaft (Fig. 1G,H), although they were more
common on MCs (46% of MC dendrites vs. 20% of eTC
dendrites).
Our analysis of the apical dendrites of MCs and eTCs
focused on the ultrastructure of dendrites in the glo-
merular tuft and did not examine properties of the api-
cal dendritic trunk. Prior dendritic patch recordings
(Urban and Sakmann, 2002) indicated that the relatively
long trunk of the MC apical dendrite attenuates excit-
atory synaptic signals that originate in the tuft only
modestly, approximately 30–40%, as they pass to the
MC soma. This implies that a difference in trunk length
or ultrastructure does not contribute significantly to the
physiological phenomena that motivated our studies,
including the much smaller glomerular synaptic signals
recorded in MCs vs. eTCs.
Subtypes of putative excitatory synapsesIn electron micrographs, the en passant boutons
associated with presynaptic axon terminals of OSNs are
characterized by a dark, granular appearance and con-
tain a large number of round, clear vesicles (Pinching
and Powell, 1971; Kasowski et al., 1999). The DAB-
labeled dendrites of both MCs and eTCs displayed
numerous OSN contacts by these criteria (Fig. 2A,B;
MC, 43 OSN synapses across 13 dendritic segments;
eTC, 26 OSN synapses across 10 dendritic segments),
and the overall OSN synaptic density was similar in the
two cell types (Fig. 2C; MC, 0.32 6 0.06 syn/mm; eTC,
0.34 6 0.04 syn/mm; P 5 0.82). The lengths of the den-
dritic segments that were analyzed varied considerably
(see above), but we observed no correlation between
segment length and the OSN synapse density estimate
Synaptic Analyses Of Olfactory Bulb Glomeruli
The Journal of Comparative Neurology | Research in Systems Neuroscience 5

Figure 2. MC and eTC dendrites have
similar densities of OSN synapses. A:
Examples of OSN synapses onto an
MC (A1; red arrow) and eTC (A2), as
characterized by docked synaptic
vesicles at the presynaptic membrane
and the relatively dark appearance of
the axon terminal. B: Unidentified
putative excitatory axons (orange
arrows) synapse on MCs (B1) and
eTCs (B2) next to OSN synapses (red
arrows). For the eTC example, the
DAB-labeled dendrite extends across
the bottom of the image. In the
imaged plane, the lighter-colored
region is a mitochondrion within the
dendrite. C: MC and eTC dendrites
have similar densities of both OSN
synapses (left) and unidentified, puta-
tive excitatory axonal synapses (mid-
dle). Histogram bars reflect mean
values (6SE); density estimates from
each analyzed dendritic segment are
also overlaid. Asterisk on “Excitatory”
emphasizes putative assignment. D:
Estimates of OSN synapse densities
were independent of the length of the
dendritic segments analyzed.
R2 5 0.05. E: No difference was
observed in the distributions of OSN
synapse size between MCs and eTCs
either. Scale bars 5 0.5 mm.
J.N. Bourne and N.E. Schoppa
6 The Journal of Comparative Neurology |Research in Systems Neuroscience

derived from each segment (R2 5 0.05; Fig. 2D). In
addition, synapse size can be correlated with synaptic
strength (Harris and Stevens, 1989; Schikorski and Ste-
vens, 1997; Bartol et al., 2015), but we found no
difference in the areas of OSN synapses between MCs
and eTCs (Fig. 2E; K-S test, P 5 0.63).
Both cell types also displayed presynaptic axon termi-
nals that lacked the characteristic dark appearance of
Figure 3. Spatial distribution of
OSN synapses on MC and eTC
dendrites. A: Reconstructions
of an MC and eTC dendrite
showing the distribution of
OSN synapses (red). In these
examples, no other types of
synapses were identified. B: On
MC dendrites, the density of
OSN synapses was higher at
the most distal 2mm of the
segments vs. more proximal
regions. Asterisks reflect signifi-
cant differences (P< 0.05) in
OSN synapse densities in the
indicated intervals vs. 0–2 mm
(in pairwise tests following an
ANOVA). This pattern was also
observed when the intervals
were grouped together (inset;
*P< 0.05). C: OSN synapse
density did not significantly
vary along eTC dendrites when
analyzed in 2-mm intervals, but
a distal preference was
observed when intervals were
grouped together (inset;
*P< 0.05). D: Cumulative dis-
tributions of OSN synapse dis-
tances from the distal ends of
dendritic segments. The MC
and eTC distributions were
quite similar (K-S, P 5 0.46). E:
Cumulative distributions of dis-
tances between nearest neigh-
boring OSN synapses for MCs
and eTCs. Note the large num-
ber of closely spaced OSN syn-
apses on MCs, suggestive of
clustering. F: Reconstructions
of terminal ends of MC den-
drites, all of which have OSN
synapses (red) within 0.5 mm of
the tip. Scale cubes 5 1mm3 in
A; 0.125 mm3 in F.
Synaptic Analyses Of Olfactory Bulb Glomeruli
The Journal of Comparative Neurology | Research in Systems Neuroscience 7

OSN axons but still had the round, clear vesicles consis-
tent with excitatory synapses (Fig. 2B, orange arrows;
see also orange synapses/arrows in Fig. 1C,D). There
was a trend for the synaptic density of the unidentified
axonal inputs to be higher in eTCs vs. MCs (Fig. 2C), but
the difference was not significant across our samples
(MC, four synapses across 13 dendritic segments,
density 5 0.04 6 0.02 syn/mm; eTC, nine synapses
across 10 dendritic segments, density 5 0.13 6 0.04
syn/mm; P 5 0.12). Combining all axonal inputs revealed
that the overall density of these synapses was not signifi-
cantly different between MCs and eTCs (Fig. 2C;
0.36 6 0.07 syn/mm for MCs, 0.47 6 0.05 syn/mm for
eTCs; P 5 0.30). Both cell types displayed a single exam-
ple that appeared to be an incoming excitatory dendro-
dendritic synapse (not shown). These numbers for
putative excitatory dendrodendritic synapses onto MC/
eTC dendrites correspond to a density of only �0.01
syn/mm.
In addition to the density of synapses, the position of
excitatory synapses on a cell’s dendritic arbor can
impact the size of the excitatory signal at the cell body
(Rall, 1967; Williams and Mitchell, 2008). The distal/
proximal orientation of the dendrites was tracked on
low-magnification images by their position within the
glomerulus relative to the main trunk of the apical
Figure 4. Analysis of putative inhibito-
ry synapses on MCs and eTCs. A:
Electron micrographs of putative
inhibitory dendrodendritic synapses
onto a DAB-labeled MC (A1; white
arrow) and eTC (A2). Note the
vesicles that appear to be docked at
the presynaptic membranes. In these
examples, the presynaptic processes
were followed to confirm that they
formed a symmetric (inhibitory) syn-
apse on an unlabeled dendrite (not
shown). B: In both MCs and eTCs,
putative inhibitory synapses (dendro-
dendritic plus axonal) were much few-
er than putative excitatory synapses
(*P< 0.05, all types). At the same
time, the two cell types displayed sim-
ilar densities of putative inhibitory
synapses. Histogram bars reflect
mean values (6SE); density estimates
from each analyzed dendrite are also
shown overlaid. Asterisks on
“Excitatory” and “Inhibitory” empha-
size putative assignments. C: Putative
inhibitory synapses were significantly
smaller than putative excitatory syn-
apses on both cell types (*P< 0.05).
D,E: The distribution of putative inhibi-
tory synapses on MCs (D) and eTCs
(E) dendrites did not significantly vary
with distance from the distal end.
Scale bars 5 0.5 mm.
J.N. Bourne and N.E. Schoppa
8 The Journal of Comparative Neurology |Research in Systems Neuroscience

dendrite of the labeled neuron. To analyze the distribu-
tion of OSN synapses on MCs and eTCs, dendritic seg-
ments at least 6 mm in length were selected and
broken down into 2-mm intervals beginning at the most
distal end of the reconstructed segments (Fig. 3A). On
MCs, the density of OSN synapses was highest at the
most distal 2 mm of the dendritic segments and
decreased with distance from the distal end (Fig. 3B;
Figure 5.
Synaptic Analyses Of Olfactory Bulb Glomeruli
The Journal of Comparative Neurology | Research in Systems Neuroscience 9

n 5 12 segments; F5,56 5 3.19, P 5 0.013). For most of
the MC segments analyzed, we were unable to deter-
mine definitively whether the most distal 2mm reflected
the terminal ends of dendritic branches. However, in
four additional short MC dendritic segments that were
definitively determined to be at the terminal end (see
Materials and Methods), we always observed one or
two OSN synapses within 0.5 mm of the ends (Fig. 3F).
Thus, OSN synapses were preferentially located at dis-
tal ends of MC apical dendrites. On dendritic segments
of eTCs, the distribution of OSN synapses did not signif-
icantly vary with distance when the dendritic segments
were analyzed in 2-mm intervals (Fig. 3C; n 5 7 den-
drites; F5,28 5 1.87, P 5 0.13). However, to account for
the lower sample size for eTCs, we also analyzed the
dendritic segments in longer section intervals, compar-
ing the densities between 0–4 mm and 4–10 mm. In this
analysis, eTCs as well as MCs displayed higher OSN
synapse densities in the most distal 4 mm of the dendritic
segments (Fig. 3B,C [insets]; eTCs, 0–4 mm 5 0.46 6
0.12 syn/mm, 4–10 mm 5 0.19 6 0.06 syn/mm,
P 5 0.046; MCs, 0–4 mm 5 0.52 6 0.12 syn/mm, 4–
10 mm 5 0.23 6 0.09 syn/mm, P 5 0.028). We also
determined the distribution of distances from OSN syn-
apses to the distal end of the dendritic segments (Fig.
3D) and found no difference between MCs and eTCs (K-S
test, P 5 0.46; pooled distance measurements from MC
or eTC dendrites �8 mm; 34 MC synapses, 18 eTC
synapses).
MCs displayed evidence for clustering of OSN synap-
ses. This was evident in many example segments (Figs.
1C,D, 3A) and in plots of nearest-neighbor distances
between synapses (Fig. 3E). For MCs, most OSN synap-
ses (�75%) had a nearest neighbor within �1.2 mm,
and the distributions did not appear to follow the single
exponential function expected if the synapses were dis-
tributed by a single random Poisson process. In eTCs,
some OSN synapses were within �1 mm of each other
(Fig. 3A,D), although whether these reflected a distinct
clustering process was not clear. Between MCs and
eTCs, the distributions of nearest-neighbor distances for
OSN synapses were not significantly different (K-S test,
P 5 0.084).
Subtypes of putative inhibitory synapsesAmong putative inhibitory synapses terminating on
the DAB-labeled processes, most appeared to be den-
drodendritic rather than axonal in both MCs and eTCs
(Fig. 4A; MCs, 11 dendrodendritic, two axonal across
13 dendritic segments; eTCs, nine dendrodendritic, one
axonal across 10 dendritic segments). The density of all
putative inhibitory synapses (dendrodendritic plus axo-
nal) did not differ between MCs and eTCs (Fig. 4B;
0.10 6 0.03 syn/mm for MCs, 0.15 6 0.02 syn/mm for
eTCs; P 5 0.28), although there were significantly fewer
of them vs. putative excitatory synapses for both cell
types (P� 0.0019). We also calculated the synaptic
area for the putative inhibitory synapses (all subtypes),
finding that they were somewhat smaller than putative
excitatory synapses for MCs (Fig. 4C; excitatory, 0.11 6
0.01 mm2, n 5 48; inhibitory, 0.060 6 0.010 mm2,
n 5 13; P 5 0.011) and eTCs (excitatory, 0.12 6
0.01 mm2, n 5 36; inhibitory, 0.077 6 0.007 mm2,
n 5 10; P 5 0.020). The putative inhibitory synapses
were similar in size to axodendritic synapses found in
regions such as area CA1 of the developing hippocam-
pus (Watson et al., 2015) and lateral amygdala (Ostroff
et al., 2010). Finally, we analyzed the distribution of
putative inhibitory synapses along MC and eTC den-
drites and did not observe a significant pattern in their
localization along dendrites of either cell type (Fig.
4D,E; density comparisons between 0–4 mm and 4–
10 mm, P 5 0.45 for MC, P 5 0.12 for eTCs).
Figure 5. Distribution of OSN synapses, gap junctions, and release sites on unlabeled putative MC dendrites. A: Example of a gap junction
(teal arrow) between two unlabeled dendrites. B: Putative MC dendrite forming a synapse (green arrow) and gap junction (teal arrow) with
the same postsynaptic process. The presynaptic putative MC dendrite runs diagonally across the image. C: Reconstructions of two puta-
tive MC dendrites with OSN synapses (red), gap junctions (teal, teal arrows), presynaptic release sites (green), and vesicles (purple). Note
examples of release sites that are close to (within �1 mm of) gap junctions. In the dendrite at right, two release sites across from a gap
junction that are difficult to visualize are indicated with green arrows. D: Summary of spatial distributions on the distal–proximal axis.
Unlike distal-favoring OSN synapses (red), gap junctions (teal) were evenly distributed, whereas release sites (green) were more highly
localized on proximal portions of the dendritic segments. Colored asterisks reflect significant differences (P< 0.05) in densities for the
indicated intervals vs. 0–2mm (in pairwise tests following an ANOVA). E: Cumulative distributions of distances from the distal ends of puta-
tive MC dendrites, plotted for OSN synapses, gap junctions, and presynaptic vesicular release sites. OSN synapses were located more dis-
tally than both gap junctions and release sites (K-S, *P� 0.005), but the positions of gap junctions and release sites were not
significantly different (K-S, P 5 0.77). F: Summary of nearest-neighbor distances. OSN synapses (red) were clustered together, as were
gap junctions with release sites (yellow). OSN-to-gap junction (blue) and OSN-to-release site (green) distances were significantly longer
(*P� 0.002) compared with OSN synapse-to-OSN synapse distances. Scale bars 5 0.5 mm in A,B; scale cube 5 1mm3.
J.N. Bourne and N.E. Schoppa
10 The Journal of Comparative Neurology | Research in Systems Neuroscience

Distribution of OSN synapses, gap junctions,and release sites on unlabeled dendrites
Previous studies in Cx36 KO mice suggested that
direct OSN synaptic signals may be strongly attenuated
by gap junctions that occur at a much higher density
on the apical dendrites of MCs vs. eTCs (Gire et al.,
2012). For analyzing the distribution of gap junctions
on MCs, we had difficulty identifying them in our DAB-
labeled dendrites, so we instead examined unlabeled
dendritic segments in the same slices that appeared to
be excitatory and that included gap junctions. We cate-
gorized these processes as putative MC dendrites
because MCs display a 10–30-fold larger gap junctional
conductance than eTCs (Hayar et al., 2005; Gire et al.,
2012). A subset of the gap junction-containing den-
drites could have reflected eTCs or other classes of
TCs, but we considered that their classification as puta-
tive MC dendrites was reasonable given available data.
The segments reflected the dendrites of MCs or TCs,
and not inhibitory cells, based on the presence of
round, clear vesicles and their formation of asymmetric
synapses onto the dendrites of other cells. Gap junc-
tions were identified by the appearance of densely
staining plaques between two adjoining dendritic mem-
branes (Brightman and Reese, 1969; Kosaka and
Kosaka, 2004; Fig. 5A,B).
We found that, within the putative MC dendritic seg-
ments that were �6 mm in length (examples shown in
Fig. 5C), OSN synaptic density was highest on the distal-
most 2 mm of the segments and decreased with distance
from the end (13 segments; F4,46 5 3.1, P 5 0.023; Fig.
5D), similar to what was observed in DAB-labeled MCs
(Fig. 3B). Gap junctions (overall density 0.28 6 0.4/mm),
however, appeared to have a much more uniform distri-
bution, with no significant differences in density between
distal and proximal ends (F4,46 5 0.35, P 5 0.84; Fig. 5D).
Similarly, the position of the gap junctions on the dendrit-
ic segments was more proximal than OSN synapses, as
reflected in the distributions of distances from the distal
end (K-S, P 5 0.005; pooled data from all putative MC
dendrites �8 mm; 30 OSN synapses, 18 gap junctions;
Fig. 5E). We also measured the distances between OSN
synapses and gap junctions (Fig. 5F). As was observed in
the DAB-labeled MC dendritic segments, a large fraction
of the OSN synapses in the putative MC segments was
clustered together, within 1–2 mm of each other, but OSN
synapses were significantly farther from gap junctions (K-
S test, OSN-OSN vs. OSN-GJ distribution, P 5 0.002).
Thus gap junctions were not coclustered with OSN
synapses.
We also observed, within the unlabeled dendritic seg-
ments of putative MCs, numerous presynaptic vesicular
release sites that appeared to be excitatory (overall
density 0.19 6 0.02 release sites/mm across 13 den-
dritic segments). These were indicated by the presence
of docked round, clear vesicles positioned across a syn-
aptic cleft from a postsynaptic density (Fig. 5B, green
arrow; Pinching and Powell, 1971). By activating other
excitatory and GABAergic cells at a glomerulus, neuro-
transmitter released from these sites can modulate
MC/TC activity downstream of OSN inputs. The density
of these release sites increased from distal to more
proximal regions of the dendrites (Fig. 5D; F4,46 5 3.6,
P 5 0.012), differing from both the distal-favoring OSN
synapses and the evenly distributed gap junctions. The
positioning of release sites and OSN synapses with
respect to the distal end of the unlabeled dendritic seg-
ments also differed significantly (K-S, P 5 0.0005; 30
OSN synapses, 17 release sites; Fig. 5E). In terms of
the distances between individual elements, presynaptic
release sites were farther from OSN synapses than
OSN synapses were from each other (K-S, OSN-OSN vs.
OSN-RS, P 5 0.001; Fig. 5F), indicating that the release
sites were not coclustered with OSNs. The release
sites, however, were much closer to gap junctions (K-S,
OSN-RS vs. GJ-RS, P 5 0.006). The mean separation
between a release site and the nearest gap junction in
fact was only 1.1 6 0.2 mm (n 5 25). Thus, gap junc-
tions and presynaptic release sites on putative MC den-
drites were clustered together.
The electrically and chemically coupled partners of
the gap junction-containing, putative MC dendrites were
mostly identified (Fig. 6). This was done by finding den-
drites that were either gap junctionally (Fig. 6A) or syn-
aptically (Fig. 6B) connected to the putative MC
dendrite and following these dendrites to where they
formed either an asymmetric or a symmetric synapse
onto another (third) dendrite. By these criteria, most
(78%) of the dendrites that shared a gap junction with
the putative MC dendrites appeared to be excitatory,
although 21% were likely inhibitory (Fig. 6C). In con-
trast, only 15% (n 5 4) of the dendrites that received a
chemical synapse from putative MC dendrites were
apparently excitatory, although 82% (n 5 21) were likely
inhibitory (Fig. 6D). The estimated density of synapses
from putative MC dendrites onto other putative excit-
atory dendrites from this analysis was �0.03 syn/mm,
a quite low value for dendrodendritic synapses between
excitatory elements that was roughly similar to that
found in the analysis of DAB-labeled dendrites
described above (�0.01 syn/mm).
There is evidence that OSN synapses occur within an
“axonal compartment” located around the outer perime-
ter of glomeruli (Kasowski et al., 1999; but see Kosaka
et al., 2001). Therefore, we wanted also to explore the
Synaptic Analyses Of Olfactory Bulb Glomeruli
The Journal of Comparative Neurology | Research in Systems Neuroscience 11

Figure 6. Gap junctional and
chemical synaptic partners of
putative MC dendrites. A: Puta-
tive MC dendrite (light yellow
reconstructed dendrite in mid-
dle) connected through a gap
junction (A1, teal arrow) to a
putative excitatory dendrite
(pink reconstructed dendrite),
as indicated by the asymmetric
dendrodendritic synapse (A2,
green arrow) onto another pro-
cess (not shown in image of
reconstructed dendrites). B:
Putative MC dendrite (light yel-
low reconstructed dendrite)
that formed a putative excitato-
ry chemical synapse (B1, green
arrow) onto a putative inhibito-
ry dendrite (blue reconstructed
dendrite), as indicated by the
symmetric dendrodendritic syn-
apse (B2, white arrow) onto
another process (in this case, it
was the same putative MC den-
drite). C: Putative MC dendrites
formed gap junctions mainly
with putative excitatory den-
drites. D: Putative MC den-
drites formed chemical
synaptic contacts mainly onto
putative inhibitory dendrites.
Scale bars 5 0.5mm; scale
cubes 5 1 mm3.
J.N. Bourne and N.E. Schoppa
12 The Journal of Comparative Neurology | Research in Systems Neuroscience

distribution of OSN synapses and gap junctions relative
to position within a glomerulus. An edge of the glomer-
ulus was overlaid with a 12 3 10 3 2 mm grid that was
divided into 2 3 10 3 2 mm rectangular cuboids that ran
parallel with respect to the glomerular edge (Fig. 7A,B;
grid shown in two dimensions). We counted, within
each 2 3 10 3 2 mm rectangular cuboid, the number of
OSN synapses and gap junctions within putative MC
dendrites (n 5 49 OSN synapses, 26 gap junctions),
and divided those values by the summed volume of
analyzed dendrites in each cuboid (Fig. 7C) to obtain
density estimates for dendritic volumes (Fig. 7D). We
found that OSN synapse densities were highest within
6 mm from the edge of the glomerulus, although gap
junctions displayed a much more uniform distribution.
These findings support the presence of an outer axonal
compartment in glomeruli and also are consistent with
data presented earlier indicating that OSN synapses
onto MC dendrites are localized primarily to more distal
portions of dendrites (Figs. 3B, 5D,E) and that gap junc-
tions maintain a more uniform distribution (Fig. 5D,E).
DISCUSSION
Recent studies have provided evidence that MCs and
TCs have markedly different odor-evoked and synaptic
Figure 7. OSN synapse density
decreases with distance from the glo-
merular edge. A: Electron micrograph
with a subset of traced dendrites in
the glomerular neuropil. The cell bod-
ies of juxtaglomerular cells (example
at white arrows) defined the outer
edge of the glomerulus. Images were
analyzed in 2 3 10 3 2 mm rectangular
cuboids. A two-dimensional
12 3 10 mm grid divided into six sec-
tions is superimposed, with the left-
most vertical line reflecting the edge
of the glomerulus. B: Reconstruction
of OSN synapses (red) and gap junc-
tions (teal) from putative MC den-
drites across the six rectangular
cuboids. C: Summed volume of ana-
lyzed dendritic segments within each
rectangular cuboid plotted as a func-
tion of distance from the glomerular
edge. Note that the analyzed dendritic
volume was largest within the first
2 mm from the edge. D: Densities of
OSN synapses (red) and gap junctions
(teal) normalized to the volume of
dendrite analyzed plotted as a func-
tion of distance from the glomerular
edge. The density of OSN synapses
(red line) was highest close to the glo-
merular edge, whereas the density of
gap junctions (teal line) remained
more consistent. Scale bar 5 2mm.
Synaptic Analyses Of Olfactory Bulb Glomeruli
The Journal of Comparative Neurology | Research in Systems Neuroscience 13

responses. To understand the anatomical bases for the
physiological results, we have performed the first quan-
titative ultrastructural analysis of the synaptic organiza-
tion within the glomerulus under conditions in which
definitive information was available through biocytin
and DAB labeling on whether observed dendritic ele-
ments reflected MCs vs. a class of TCs known as eTCs.
We also analyzed a large sample of unlabeled putative
MC dendrites to obtain information on some cellular
features that could not be readily visualized in the DAB-
labeled processes. Our main results were that 1) OSNs
and eTCs had similar densities of OSN synapses as well
as other types of chemical synapses, 2) OSN synapses
were preferentially localized on distal portions of the
apical dendrites on both MCs and eTCs, 3) gap junc-
tions had a uniform spatial distribution on putative MC
dendrites and on average were more proximally located
than OSN synapses, and 4) gap junctions on putative
MC dendrites were clustered with presynaptic vesicular
release sites. We discuss our ultrastructural findings
with respect to observed differences in physiological
responses of MCs vs. eTCs as well as other aspects of
glomerular signaling.
What explains the difference in direct OSNsignal size in MCs vs. eTCs?
In responses to both electrical and optogenetic stim-
ulation of OSNs, eTCs display excitatory postsynaptic
currents (EPSCs) that reflect direct OSN inputs (“OSN
EPSCs”) that are much larger than those in MCs (Gire
et al., 2012; Vaaga and Westbrook, 2016). Exactly how
much larger OSN EPSCs are in eTCs may depend on
OSN stimulation intensity (Najac et al., 2011; Vaaga
and Westbrook, 2016), with estimates ranging from a
factor of 30 for weak stimuli (Gire et al., 2012) to a fac-
tor of approximately four for strong stimuli (Vaaga and
Westbrook, 2016). Certainly the simplest explanation
for the large differences in OSN EPSCs is that OSNs
make many more synapses onto the apical dendrites of
eTCs vs. MCs, but this hypothesis was not supported
by our counts of OSN synapses, which showed similar
densities on the two cell types (�0.3–0.4 synapses/
mm). Moreover, because MCs and eTCs have similarly
sized apical dendritic tufts (Macrides and Schneider,
1982), these OSN synapse density estimates imply a
similar total number of OSN synapses. In our analysis,
we used high electron density as a marker of OSN axo-
nal boutons, and we did observe putative excitatory
axonal boutons that were less electron dense. Thus, we
might have under- or overestimated OSN synapse den-
sity depending on the criterion for electron density cho-
sen. However, axonal synaptic markers strongly
colocalize with the OSN-specific protein olfactory mark-
er protein (OMP; Kasowski et al., 1999; Kim and Greer,
2000), suggesting that most axonal synapses reflect
OSNs, and in our experiments OSN synapses were a
large fraction (84% across MCs and eTCs) of the total.
In addition, MCs and eTCs displayed similar densities
when we counted all putative excitatory axonal synap-
ses. Hence, any errors in our estimates of OSN synapse
density are likely to be small and cannot account for
the large difference in OSN signal size between MCs
and eTCs.
In many neurons, the location of excitatory synapses
on the dendritic arbor can also influence the size of cur-
rent and voltage signals recorded at the cell soma (Rall,
1967; Williams and Mitchell, 2008). Signals from synap-
ses on distal dendrites are especially attenuated by the
intracellular resistance and current loss through dendritic
conductances. We found that synapse location is in fact
likely to be important for explaining the different-sized
OSN signals in MCs vs. eTCs but only as it relates to a
dendritic gap junctional conductance in MCs (Schoppa
and Westbrook, 2002, Christie et al., 2005; Kosaka and
Kosaka, 2005; Pimental and Margrie, 2008; Maher et al.,
2009) that is present at a much lower level in eTCs
(Hayar et al., 2005; Gire et al., 2012). In terms of the
absolute positioning of OSN synapses within the apical
dendritic tuft, MCs and eTCs displayed no significant dif-
ference, but, in unlabeled putative MC dendrites, gap
junctions were distributed on average between OSNs and
the cell soma. Such a placement could make the gap
junctional conductance well positioned to shunt OSN sig-
nals prior to their reaching the cell body of MCs. It should
be noted that our results here suggesting that there are
no significant differences between MCs and eTCs in the
absolute positioning of OSN synapses or in OSN synapse
number are in some sense not surprising. Prior studies of
Cx36 KO mice showed that eliminating gap junctions
causes monosynaptic OSN currents to be very similar in
MCs and eTCs (Gire et al., 2012). Although KO experi-
ments have their own caveats, those results, like our
ultrastructural results here, suggested that gap junctions
and not OSN synapse location or number are the major
contributor to the different-sized OSN signals in the two
cell types.
That a dendritic conductance intrinsic to MCs is
involved in attenuating OSN signals from distal den-
drites of course makes these cells like many neurons
throughout the brain (Hoffman et al., 1997; Berger
et al., 2001; Williams and Stuart, 2000). An attenuating
effect involving gap junctions is, however, likely to be
more complex than that resulting from other dendritic
conductances such as potassium channels. Because at
least a major component of the gap junctional
J.N. Bourne and N.E. Schoppa
14 The Journal of Comparative Neurology | Research in Systems Neuroscience

conductance is between MC dendrites, the gap junc-
tions would allow sharing of excitatory OSN signals
between MCs at the same time that the signal in any
one MC is dissipated by current loss. Furthermore, the
degree to which a given gap junctional conductance
can shunt excitatory inputs on a particular MC will
depend on the membrane potential of the dendrites of
other MCs with which it is coupled (which will deter-
mine the driving force for current flow between den-
drites). A modeling study of a gap junctionally
connected network of interneurons in striatum (Hjorth
et al., 2009) examined this latter issue, finding that the
degree to which gap junctions shunt excitatory inputs
decreases as the dendrites of different cells in the net-
work become depolarized by increasingly coincident
excitatory inputs.
Other features of the synaptic organizationwithin glomeruli
Our analysis of putative inhibitory synapses on apical
dendrites showed similar densities of dendrodendritic
synapses on MCs and eTCs and, on rare occasions,
axonal synapses that appeared to be inhibitory. The
similar density of putative inhibitory synapses was
somewhat surprising given available physiological evi-
dence. Several studies that have made side-by-side
comparisons between MCs and eTCs have indicated
that eTCs display much larger GABAergic electrical sig-
nals that can be attributed to neurons in the glomerular
layer (periglomerular cells or short-axon cells; Gire and
Schoppa, 2009; Whitesell et al., 2013; Banerjee et al.,
2015). One possible explanation for a small physiologi-
cal GABAergic signal at the MC soma is that those sig-
nals are attenuated by gap junctions in a manner
similar to direct OSN signals. With respect to the distri-
bution of putative inhibitory dendrodendritic synapses,
we found that they were mixed with presumed excitato-
ry axonal synapses (Kosaka et al., 2001).
Putative excitatory synapses distinct from OSNs were
also found on both MCs and eTCs. These included axon
terminals that lacked the electron-dense profile of OSN
terminals, which most likely reflected centrifugal inputs
from olfactory cortex (Pinching and Powell, 1972; Mar-
kopoulis et al., 2012; Rothermel and Wachowiak, 2014)
and/or cholinergic inputs from the basal forebrain
(Kasa et al., 1995; D’Souza and Vijayaraghavan, 2014).
Putative excitatory dendrodendritic synapses (Kosaka
and Kosaka, 2005) were also observed on both MCs
and eTCs, although the estimated density of these syn-
apses (0.01–0.03 syn/mm) was markedly lower than
that of other synaptic elements within glomeruli (e.g.,
0.3–0.4 syn/mm for OSN synapses). Additionally, our
ultrastructural analysis provided evidence for mixed
chemical and electrical signaling (Kosaka and Kosaka,
2005; Hamzei-Sichani et al., 2012; Vivar et al., 2012),
as reflected in complexes on putative MC dendrites
that contained vesicular release sites and gap junctions
in close proximity (<1 mm away). Based on the overall
density of release sites (�0.19/mm; see above) and the
nearest-neighbor distribution for gap junctions and
release sites (Fig. 5F), we estimate the density of such
complexes to be �0.12/mm. These mixed complexes
are provocative, especially in light of prior evidence
that MCs can engage in rapid lateral excitatory interac-
tions at their apical dendrites (Urban and Sakmann,
2002; Schoppa and Westbrook, 2002; Pimental and
Margrie, 2008). These interactions, which are AMPA
receptor-dependent but abolished in Cx36 KO animals
(Christie et al., 2005), do not appear to involve activa-
tion of presynaptic autoreceptors on MCs (Pimental and
Margrie, 2008) but could involve AMPA receptors on
GABAergic interneurons that couple to MCs (see Fig.
6B; Kosaka and Kosaka, 2005) or nonsynaptic AMPA
receptors on other MCs/TCs.
Our ultrastructural analyses revealed one other interest-
ing feature of OSN synapses, perhaps important in syn-
apse development. Although we observed that most OSN
synapses occurred directly on dendritic shafts (Pinching
and Powell, 1971, White, 1972, Hinds and Hinds, 1976),
both MCs and eTCs displayed numerous examples of syn-
apses positioned on spine- or filopodia-like structures.
One possibility is that these synapses are involved in syn-
aptogenesis. In the hippocampus, where most mature
excitatory synapses are on dendritic spines, the progres-
sion of synaptogenesis during the first postnatal week has
been proposed to involve the extension of dendritic filopo-
dia that then form one or multiple synaptic contacts
before retracting back to the dendritic shaft and finally re-
emerging as a mature dendritic spine (Fiala et al., 1998;
Harris; 1999; Maletic-Savatic et al., 1999). Perhaps MCs
and TCs use similar mechanisms when forming excitatory
synaptic contacts with OSNs, but, rather than maturing
into a typical dendritic spine, the mature synapses remain
on the dendritic shaft. Ongoing synaptic refinement could
also explain the fact that we did not observe a strict segre-
gation of dendrodendritic synapses from OSN axonal syn-
apses (see above), which differed from findings of some
previous studies (Kasowski et al., 1999; Kim and Greer,
2000). Our ultrastructural experiments were in rats at
postnatal P8–14, when the organization of glomerular syn-
apses might still be in flux (Hinds and Hinds, 1976).
Broader implicationsReturning to the issue of direct OSN signal size dis-
cussed above, our ultrastructural results here have
Synaptic Analyses Of Olfactory Bulb Glomeruli
The Journal of Comparative Neurology | Research in Systems Neuroscience 15

implications that go beyond just explaining why the sig-
nals are much smaller in MCs vs. eTCs in brain slice
recordings. First, the fact that OSN signals at the cell
body are relatively small in MCs itself has immediate
functional significance. Because spikes are generally ini-
tiated at the MC soma (except when many OSNs are
excited simultaneously; Chen et al., 1997), the small
direct OSN signal at the soma means that direct OSN
inputs will activate MCs with low efficacy. This will be
true regardless of the number of OSN-to-MC synapses.
Furthermore, because MCs can be activated through a
multistep OSN-to-eTC-to-MC pathway (De Saint Jan
et al., 2009; Najac et al., 2011; Gire et al., 2012), the
small direct OSN signal in MCs compared with eTCs
means that the system would generally favor multistep
activation of MCs. Multistep activation of MCs would be
favored all the more because TCs have greater intrinsic
excitability (Liu and Shipley, 2008; Burton and Urban, ).
In the natural situation, a low efficacy for direct OSN
signals in MCs and a preference for multistep activation
could underlie the relatively low sensitivity of MCs to
odor as well as their delayed spike responses
(Nagayama et al., 2004; Igarishi et al., 2012; Fukunaga
et al., 2012; Otazu et al., 2015).
Our results also raise the obvious question of why
MCs have a significant complement of OSN synapses if
their associated signals at the soma are greatly attenu-
ated by dendritic gap junctions. Among the possible
explanations is that direct OSN synapses in fact drive
only local depolarizations that are restricted to the api-
cal dendrites of MCs. These could control functions
such as synaptic plasticity. Also, it is possible that the
shunting effect of the gap junctions is dynamically mod-
ulated such that direct OSN signals emerge in MCs in
certain situations. As discussed above, the shunting
capacity of gap junctions may decrease as excitatory
inputs are increasingly coincident (Hjorth et al., 2009),
as might occur when OSNs at a glomerulus are highly
active or if the gap junctions themselves are downregu-
lated (Bloomfield and Volgyi, 2009). These mechanisms
could operate without any change in the number of
expressed OSN synapses or gap junctions, allowing rap-
id changes in the efficacy of direct OSN signals in driv-
ing MC spiking.
ACKNOWLEDGMENTSWe thank Dorothy Dill for her assistance in the Electron
Microscopy Core Facility and Dr. Kristen M. Harris at the
University of Texas at Austin for use of her Zeiss SUPRA
40 field-emission scanning electron microscope.
CONFLICT OF INTEREST STATEMENT
The authors have no conflicts of interest in the stud-
ies described in this article.
ROLE OF AUTHORS
JNB and NES had full access to all of the data in the
study and take responsibility for the integrity of the
data and the accuracy of the data analysis. Study con-
cept and design: JNB, NES. Acquisition of data: JNB.
Analysis and interpretation of data: JNB, NES. Drafting
of the manuscript: JNB, NES. Critical revision of the
manuscript for important intellectual content: JNB, NES.
Statistical analysis: JNB, NES. Obtained funding: NES.
LITERATURE CITEDAntal M, Eyre M, Finklea B, Nusser Z. 2006. External tufted
cells in the main olfactory bulb form two distinct subpo-pulations. Eur J Neurosci 24:1124–1136.
Banerjee A, Marbach F, Anselmi F, Koh MS, Davis MB, Garciada Silva P, Delevich K, Oyibo HK, Gupta P, Li B, AlbeanuDF. 2015. An interglomerular circuit gates glomerularoutput and implements gain control in the mouse olfac-tory bulb. Neuron 87:193–207.
Bartol TM, Bromer C, Kinney J, Chirillo MA, Bourne JN, HarrisKM, Sejnowski TJ. 2015. Nanoconnectomic upper boundon the variability of synaptic plasticity. Elife pii:e10778.
Berger T. Larkum ME, Luscher HR. 2001. High Ih channel den-sity in the distal apical dendrite of layer V pyramidalcells increases bidirectional attenuation of EPSPs.J Neurophysiol 85:855–868.
Bloomfield SA, Volgyi B. 2009. The diverse functional rolesand regulation of neuronal gap junctions in the retina.Nat Rev Neurosci 10:495–506.
Bourne JN, Harris KM. 2008. Balancing structure and functionat hippocampal dendritic spines. Ann Rev Neurosci 31:47–67.
Brightman MW, Reese TS. 1969. Junctions between intimatelyapposed cell membranes in the vertebrate brain. J CellBiol 40:648–677.
Burton SD, Urban NN. Greater excitability and firing irregulari-ty of tufted cells underlies distinct afferent-evoked activi-ty of olfactory bulb mitral and tufted cells. J Physiol 592:2097–2118.
Chen WR, Midtgaard J, Shepherd GM. 1997. Forward andbackward propagation of dendritic impulses and theirsynaptic control in mitral cells. Science 278:463–467.
Christie J, Bark C, Hormuzdi S, Helbig I, Monyer H, WestbrookG. 2005. Connexin36 mediates spike synchrony in olfac-tory bulb glomeruli. Neuron 46:761–772.
Colonnier M. 1968. Synaptic patterns on different cell typesin the different laminae of the cat visual cortex. An elec-tron microscope study. Brain Res 9:268–287.
De Saint Jan D, Hirnet D, Westbrook G, Charpak S. 2009.External tufted cells drive the output of olfactory bulbglomeruli. J Neurosci 29:2043–2052.
D’Souza RD, Vijayaraghavan S. 2014. Paying attention tosmell: cholinergic signaling in the olfactory bulb. FrontSynaptic Neurosci 6:21.
Fiala JC. 2005. Reconstruct: a free editor for serial sectionmicroscopy. J Microsc 218:52–61.
Fiala JC, Harris KM. 2001. Extending unbiased stereology ofbrain ultrastructure to three-dimensional volumes. J AmMed Inform Assoc 8:1–16.
J.N. Bourne and N.E. Schoppa
16 The Journal of Comparative Neurology | Research in Systems Neuroscience

Fiala JC, Feinberg M, Popov V, Harris KM. 1998. Synaptogene-sis via dendritic filopodia in developing hippocampal areaCA1. J Neurosci 18:8900–8911.
Fukunaga I, Berning M, Kollo M, Schmaltz A, Schaefer AT.2012. Two distinct channels of olfactory bulb output.Neuron 75:320–329.
Gire DH, Schoppa NE. 2009. Control of on/off glomerular sig-naling by a local GABAergic microcircuit in the olfactorybulb. J Neurosci 29:13454–13464.
Gire DH, Franks KM, Zak JD, Tanaka KF, Whitesell JD,Mulligan AA, Hen R, Schoppa NE. 2012. Mitral cells inthe olfactory bulb are mainly excited through a multistepsignaling path. J Neurosci 32:2964–2975.
Gray EG. 1959. Axo-somatic and axo-dendritic synapses ofthe cerebral cortex: an electron microscope study.J Anat 93:345–356.
Hamzei-Sichani F, Davidson KG, Yasumura T, Janssen WG,Wearne SL, Hof PR, Traub RD, Gutierrez R, Ottersen OP,Rash JE. 2012. Mixed electrical-chemical synapses inadult rat hippocampus are primarily glutamatergic andcoupled by connexin-36. Front Neuroanat 6:13.
Harris KM. 1999. Structure, development, and plasticity ofdendritic spines. Curr Opin Neurobiol 9:343–348.
Harris KM, Stevens JK. 1989. Dendritic spines of CA 1 pyrami-dal cells in the rat hippocampus: serial electron micros-copy with reference to their biophysical characteristics.J Neurosci 9:2982–2997.
Harris KM, Perry L, Bourne JN, Feinberg M, Ostroff L, HurlburtJ. 2006. Uniform serial sectioning for transmission elec-tron microscopy. J Neurosci 26:12101–12103.
Hayar A, Karnup S, Shipley MT, Ennis M. 2004. Olfactory bulbglomeruli: external tufted cells intrinsically burst at thetafrequency and are entrained by patterned olfactory input.J Neurosci 24:1190–1199.
Hayar A, Shipley MT, Ennis M. 2005. Olfactory bulb externaltufted cells are synchronized by multiple intraglomerularmechanisms. J Neurosci 25:8197–8208.
Hinds JW, Hinds PL. 1976. Synapse formation in the mouseolfactory bulb. I. Quantitative studies. J Comp Neurol169:15–40.
Hjorth J, Blackwell KT, Kotaleski JH. 2009. Gap junctionsbetween striatal fast-spiking interneurons regulate spik-ing activity and synchronization as a function of corticalactivity. J Neurosci 29:5276–5286.
Hoffman DA, Magee JC, Colbert CM, Johnston D. 1997. K1
channel regulation of signal propagation in dendrites ofhippocampal pyramidal neurons. Nature 387:869–875.
Igarashi KI, Idki N, An M, Yamaguchi Y, Nagayama S,Kobayakawa K, Kobayakawa R, Tanifuji M, Sakano H,Chen WR, Mori K. 2012. Parallel mitral and tufted cellpathways route distinct odor information to different tar-gets in the olfactory cortex. J Neurosci 32:7970–7985.
Imai T. 2014. Construction of functional neuronal circuitry inthe olfactory bulb. Semin Cell Dev Biol 35:180–188.
Kasa P, Hlavati I, Dobo E, Wolff A, Joo F, Wolff JR. 1995. Syn-aptic and non-synaptic cholinergic innervation of the vari-ous types of neurons in the main olfactory bulb of adultrat: immunocytochemistry of choline acetyltransferase.Neuroscience 67:667–677.
Kasowski H, Kim H, Greer C. 1999. Compartmental organiza-tion of the olfactory bulb glomerulus. J Comp Neurol407:261–274.
Kim H, Greer C. 2000. The emergence of compartmentalorganization in olfactory bulb glomeruli during postnataldevelopment. J Comp Neurol 422:297–311.
Kosaka K, Aika Y, Toida K, Kosaka T. 2001. Structure of intra-glomerular dendritic tufts of mitral cells and their con-tacts with olfactory nerve terminals and calbindin-
immunoreactive type 2 periglomerular neurons. J CompNeurol 440:219–235.
Kosaka T, Kosaka K. 2004. Neuronal gap junctions betweenintraglomerular mitral/tufted cell dendrites in the mousemain olfactory bulb. Neurosci Res 49:373–378.
Kosaka T, Kosaka K. 2005. Intraglomerular dendritic link con-nected by gap junctions and chemical synapses in themouse main olfactory bulb: electron microscopic serialsection analyses. Neuroscience 131:611–625.
Kuwajima M, Mendenhall JM, Lindsey LF, Harris KM. 2013.Automated transmission-mode scanning electron micros-copy (t(SEM) for a large volume analysis at nanoscaleresolution. PLoS One 8:e59573.
Liu S, Shipley MT. 2008. Multiple conductances cooperativelyregulate spontaneous bursting in mouse olfactory bulbexternal tufted cells. J Neurosci 28:1625–1639.
Macrides F, Schneider SP. 1982. Laminar organization ofmitral and tufted cells in the main olfactory bulb of theadult hamster. J Comp Neurol 208:419–430.
Maher BJ, McGinley MJ, Westbrook GL. 2009. Experience-dependent maturation of the glomerular microcircuit.Proc Natl Acad Sci U S A 106:16865–16870.
Maletic-Savatic M, Malinow R, Svoboda K. 1999. Rapid den-dritic morphogenesis in CA1 hippocampal dendritesinduced by synaptic activity. Science 283:1923–1927.
Markopoulos F, Rokni D, Gire DH, Murthy VN. 2012. Function-al properties of cortical feedback projections to theolfactory bulb. Neuron 76:1175–1188.
Nagayama S, Takahashi YK, Yoshihara Y, Mori K. 2004. Mitraland tufted cells differ in the decoding manner of odormaps in the rat olfactory bulb. J Neurophysiol 91:2532–2540.
Najac M, Jan D, Reguero L, Grandes P, Charpak S. 2011.Monosynaptic and polysynaptic feed-forward inputs tomitral cells from olfactory sensory neurons. J Neurosci31:8722–8729.
Orona E, Rainer EC, Scott JW. 1984. Dendritic and axonalorganization of mitral and tufted cells in the ratolfactorybulb. J Comp Neurol 226:346–356.
Ostroff LE, Cain CK, Bedont J, Monfils MH, Ledoux JE. 2010.Fear and safety learning differentially affect synapse sizeand dendritic translation in the lateral amygdala. ProcNatl Acad Sci U S A 107:9418–9423.
Otazu GH, Chae H, Davis MB, Albeanu DF. 2015. Corticalfeedback decorrelates olfactory bulb output in awakemice. Neuron 86:1461–1477.
Petreanu L, Mao T, Sternson SM, Svoboda K. 2009. The sub-cellular organization of neocortical excitatory connec-tions. Nature 457:1142–1145.
Pimentel D, Margrie T. 2008. Glutamatergic transmission andplasticity between olfactory bulb mitral cells. J Physiol586:2107–2119.
Pinching AJ, Powell TP. 1971. The neuropil of the glomeruli ofthe olfactory bulb. J Cell Sci 9:347–377.
Pinching AJ, Powell TP. 1972. The termination of centrifugalfibres in the glomerular layer of the olfactory bulb. J CellSci 10:621–635.
Rall W. 1967. Distinguishing theoretical synaptic potentialscomputed for different soma-dendritic distributions ofsynaptic input. J Neurophysiol 30:1138–1168.
Rothermel M, Wachowiak M. 2014. Functional imaging of cor-tical feedback projections to the olfactory bulb. FrontNeural Circuits 8:1–14
Schikorski T, Stevens CF. 1997. Quantitative ultrastructuralanalysis of hippocampal excitatory synapses. J Neurosci17:5858–5867.
Schoenfeld TA, Marchand JE, Macrides F. 1985. Topographicorganization of tufted cell axonal projections in the
Synaptic Analyses Of Olfactory Bulb Glomeruli
The Journal of Comparative Neurology | Research in Systems Neuroscience 17

hamster main olfactory bulb: an intrabulbar associationalsystem. J Comp Neurol 235:503–518.
Schoppa NE, Westbrook GL. 2002. AMPA autoreceptors drivecorrelated spiking in olfactory bulb glomeruli. Nat Neruo-sci 5:1194–1202.
Urban NN, Sakmann B. 2002. Reciprocal intraglomerular exci-tation and intra- and interglomerular lateral inhibitionbetween mouse olfactory bulb mitral cells. J Physiol 542:355–367.
Vaaga CE, Westbrook GL. 2016. Parallel processing of affer-ent olfactory sensory information. J Physiol [E-pub aheadof print].
Vivar C, Traub RD, Guti�errez R. 2012. Mixed electrical-chemical transmission between hippocampal mossyfibers and pyramidal cells. Eur J Neurosci 35:76–82.
Watson DJ, Ostroff L, Cao G, Parker PH, Smith H, Harris KM.2015. LTP enhances synaptogenesis in the developinghippocampus. Hippocampus doi:10.1002/hipo.22536.
White EL. 1972. Synaptic organization in the olfactory glomer-ulus of the mouse. Brain Res 37:69–80.
Whitesell JD, Sorensen KA, Jarvie BC, Hentges ST, SchoppaNE. 2013. Interglomerular lateral inhibition targeted onexternal tufted cells in the olfactory bulb. J Neurosci 33:1552–1563.
Williams SR, Mitchell SJ. 2008. Direct measurement of somat-ic voltage clamp errors in central neurons. Nat Neurosci11:790–798.
Williams SR, Stuart GJ. 2000. Site independence of EPSP timecourse is mediated by dendritic Ih in neocortical pyrami-dal cells. J Neurophysiol 83:3177–3182.
J.N. Bourne and N.E. Schoppa
18 The Journal of Comparative Neurology | Research in Systems Neuroscience