THREE DIMENSIONS OF ERP MAINTENANCE: THE...
32
THREE DIMENSIONS OF ERP MAINTENANCE: THE CASE STUDY AT AN ENERGY COMPANY Alona Ivanecka, Anete Soboleva, Janis Grabis Riga Technical University, Faculty of Computer Science and Information Technology, Kalku 1, Riga, LV-1658, Latvia, [email protected], [email protected], [email protected] Abstract. Enterprise Resource Planning (ERP) systems have reached a high level of maturity, and maintenance and improvement of implemented systems is becoming increasingly important. This paper proposes to analyze the ERP maintenance problem along three interrelated dimensions: software maintenance (SM), business process management (BPM) and process improvement (PI). It is argued that BPM and PI practices facilitate maintenance of ERP systems. The proposed analysis framework is applied to study maintenance of the ERP system at a large energy company. The analysis suggests that relatively high level of maturity has been achieved in corrective and adaptive maintenance. However, the level of maturity is lower in perfective and preventive maintenance, and links between maintenance of the ERP system and BPM should be improved. Keywords: ERP systems, software maintenance, process improvement, case study. 1 Introduction Enterprise Resource Planning (ERP) systems are large complex software packages used to implement business processes at enterprises. They have reached a high level of maturity, and majority of large enterprises has implemented some kind of ERP systems. The operations and maintenance instead of new implementation have become the main focus for ERP practitioners. Traditional software maintenance (SM) practices can be used in maintenance of ERP systems as well as information technology resources governance methodologies such as ITIL (Information Technology Infrastructure Library). On the other hand, operation of ERP systems is tightly interrelated with business process improvement (PI) activities, and enterprises continuously strive to increase business value of their investment in ERP systems. Therefore, operation and maintenance should consider both technical and business aspects of ERP systems. Longworth [9] identified over 300 Information System Development Methodologies. However, there are few methodologies aimed specifically at SM [7], [14], [16], [17] and only a handful of the systems development methodologies pay much attention to SM [4], [13]. Taylor [14] summarizes all methodologies and gives direction of information systems methodologies usage for SM activities. Nah [10] investigate technical aspects of maintenance of ERP systems. Light [8] investigates maintenance of custom modifications of ERP systems. Nah et al. [10] define characteristics of ERP SM and identify main tasks of ERP maintenance by means of cases studies. Although the authors acknowledge differences between traditional software and ERP, the operation and maintenance is analyzed purely from the SM perspective alone. Ng et al. [11] establish ERP maintenance taxonomy. This taxonomy classifies causes of maintenance activities and emphasizes that maintenance activities should contribute to business benefits of ERP systems. Business benefits considered include competitive advantage, globalization, system integration, best practices and cost efficiency. However, these benefits could be achieved more efficiently if contribution of maintenance is considered jointly with other related factors. The objective of the paper is to establish a framework for analyzing maintenance of ERP systems along different dimensions and to apply this framework for evaluation of ERP maintenance at an energy company. The two main dimensions of analysis are the software maintenance dimension and the business process management (BPM) dimension. The former is assumed to address mainly technical aspects while the latter is assumed to address mainly business-related aspects of ERP systems operation and maintenance. Additionally, the third dimension of process improvement is introduced. This dimension is aimed to represent knowledge accumulation and process evolution within enterprises involved in maintenance of ERP systems. Particularly, process improvement at an ERP implementation consulting company is analyzed. The process improvement dimension is deemed important because structured and optimized maintenance processes are expected to contribute to efficiency of software maintenance and vice versus. It is expected that: 1) there is a synergetic effect among the dimensions, i.e., ERP maintenance benefits from advances in BPM and PI; 2) only all three dimensions together allow addressing all problems arising during the maintenance process. The contributions of the paper are threefold: 1) the comprehensive analysis framework for ERP maintenance is proposed; 2) interactions between the defined dimensions are identified; and 3) an ERP maintenance case is investigated according to the proposed framework. - 277 -
Transcript of THREE DIMENSIONS OF ERP MAINTENANCE: THE...

THREE DIMENSIONS OF ERP MAINTENANCE: THE CASE STUDY AT AN ENERGY COMPANY
Alona Ivanecka, Anete Soboleva, Janis Grabis
Riga Technical University, Faculty of Computer Science and Information Technology, Kalku 1, Riga, LV-1658, Latvia, [email protected], [email protected], [email protected]
Abstract. Enterprise Resource Planning (ERP) systems have reached a high level of maturity, and maintenance and improvement of implemented systems is becoming increasingly important. This paper proposes to analyze the ERP maintenance problem along three interrelated dimensions: software maintenance (SM), business process management (BPM) and process improvement (PI). It is argued that BPM and PI practices facilitate maintenance of ERP systems. The proposed analysis framework is applied to study maintenance of the ERP system at a large energy company. The analysis suggests that relatively high level of maturity has been achieved in corrective and adaptive maintenance. However, the level of maturity is lower in perfective and preventive maintenance, and links between maintenance of the ERP system and BPM should be improved.
Keywords: ERP systems, software maintenance, process improvement, case study.
1 Introduction Enterprise Resource Planning (ERP) systems are large complex software packages used to implement
business processes at enterprises. They have reached a high level of maturity, and majority of large enterprises has implemented some kind of ERP systems. The operations and maintenance instead of new implementation have become the main focus for ERP practitioners. Traditional software maintenance (SM) practices can be used in maintenance of ERP systems as well as information technology resources governance methodologies such as ITIL (Information Technology Infrastructure Library). On the other hand, operation of ERP systems is tightly interrelated with business process improvement (PI) activities, and enterprises continuously strive to increase business value of their investment in ERP systems. Therefore, operation and maintenance should consider both technical and business aspects of ERP systems.
Longworth [9] identified over 300 Information System Development Methodologies. However, there are few methodologies aimed specifically at SM [7], [14], [16], [17] and only a handful of the systems development methodologies pay much attention to SM [4], [13]. Taylor [14] summarizes all methodologies and gives direction of information systems methodologies usage for SM activities. Nah [10] investigate technical aspects of maintenance of ERP systems. Light [8] investigates maintenance of custom modifications of ERP systems. Nah et al. [10] define characteristics of ERP SM and identify main tasks of ERP maintenance by means of cases studies. Although the authors acknowledge differences between traditional software and ERP, the operation and maintenance is analyzed purely from the SM perspective alone. Ng et al. [11] establish ERP maintenance taxonomy. This taxonomy classifies causes of maintenance activities and emphasizes that maintenance activities should contribute to business benefits of ERP systems. Business benefits considered include competitive advantage, globalization, system integration, best practices and cost efficiency. However, these benefits could be achieved more efficiently if contribution of maintenance is considered jointly with other related factors.
The objective of the paper is to establish a framework for analyzing maintenance of ERP systems along different dimensions and to apply this framework for evaluation of ERP maintenance at an energy company. The two main dimensions of analysis are the software maintenance dimension and the business process management (BPM) dimension. The former is assumed to address mainly technical aspects while the latter is assumed to address mainly business-related aspects of ERP systems operation and maintenance. Additionally, the third dimension of process improvement is introduced. This dimension is aimed to represent knowledge accumulation and process evolution within enterprises involved in maintenance of ERP systems. Particularly, process improvement at an ERP implementation consulting company is analyzed. The process improvement dimension is deemed important because structured and optimized maintenance processes are expected to contribute to efficiency of software maintenance and vice versus. It is expected that: 1) there is a synergetic effect among the dimensions, i.e., ERP maintenance benefits from advances in BPM and PI; 2) only all three dimensions together allow addressing all problems arising during the maintenance process. The contributions of the paper are threefold: 1) the comprehensive analysis framework for ERP maintenance is proposed; 2) interactions between the defined dimensions are identified; and 3) an ERP maintenance case is investigated according to the proposed framework.
- 277 -

The rest of the paper is organized as follows. In Section 2 we discuss about three dimensions of ERP system maintenance: identify key categories of SM dimension, represent PI main phases of BPM dimension, look at the representations of CMMI (Capability Maturity Model Integration) dimension, and identify interactions between those dimensions. To demonstrate practical side of interaction between dimensions in Section 3 is presented case study based on ERP system maintenance at an energy company. Observations based on this research could be found in Section 4.
2 Dimensions of ERP Maintenance Three dimensions of ERP maintenance considered are software maintenance dimension, business
process management dimension and software process improvement dimension.
2.1 Software Maintenance Dimension During ERP SM provides services to improve, adopt and integrate ERP system. SWEBOK (Software
Engineering Body of Knowledge) [1] defines that SM is the modification of a software product after delivery to correct faults, improve performance, or other product attributes, or to adapt the product to a new or changing environment. ITIL provides guidelines for incident management, problem management, configuration management, change management and release management. All these disciplines together produce software service support. Adaptation and software services are especially important in the case of ERP systems because their operation requires continuous attention.
SM is usually analyzed by defining several SM categories [2]. The most frequently considered SM categories are corrective, adaptive, perfective and preventive maintenance [10]. The user support is frequently added as the fifth maintenance category [10]. Each category has its specific purpose and tasks to be performed including tasks specific to ERP systems. Activities of corrective maintenance frequently refer to defects, which are raised by system users. These defects should be eliminated to conform to the agreed software specification. Adaptive maintenance activities are aimed at adapting the system to changes in the operating environment. Perfective maintenance activities are influenced by enterprise business processes and system vendor support terms for the current product version. Workflow automation, implementation of new applications and ERP modules, and decision making support activities, where decision making support often is realized by business intelligence tools, are a part to this category. Work done on a software system to address problems of deterioration structure is known as preventive maintenance. The preventive maintenance applies monitoring of system problem areas and performs preventive activities. Final, user support refers to the service provided to satisfy end-user’s requests and help them work with the system. The strategic planning and coordination category is introduced in this paper to supplant the external parties category by Nah et al. [10]. It reflects supporting activities in ERP maintenance that are necessary across the traditional categories and business side involvement in the system evaluation process. Supporting activities of traditional categories could be communication and collaboration with ERP vendor, third-party vendors, and consultants. It is important for both the maintenance performer and the business side to comprehend potential bonuses of such activities. This category performs activities like work efficiency and business strategy plan review and brain storming about potential directions of system evolution.
Analysis according to the SM dimensions allows identifying what ERP maintenance activities are being performed and what are practical challenges of ERP maintenance.
2.2 Business Process Management Dimension BPM is a systematic approach to improving a company's business processes. It attempts to improve
processes continuously. Information technology including ERP systems is used as a key enabler of BPM and there are certain interactions between these two [10]. From the ERP implementation perspective, ERP system is deployed to execute and automate current enterprise business processes. From the BPM perspective, PI is an ongoing activity, which requires continuous updating of supporting information technology systems. Given that ERP systems are rarely outright replaced, business PI drives changes in ERP systems during their operation and maintenance. Trkman [15] notes that the design of an organization must ‘fit’ with the environment and effective organizations do not only have a proper ‘fit’ with the environment but also between its subsystems. That applies also to ERP systems. However, the ERP system’s configuration could implicitly restrict implementation of additional business processes. Thus, there are mutual interactions between maintenance of ERP systems and BPM.
The most typical representation of BPM is its PI life-cycle consisting of four main phases [5]: design and formalization, execution, monitoring and supervision, and analysis and optimization. Design and formalization encompasses identification of existing processes and the design of "to-be" processes. During the execution phase, the formalized business processes are used as a basis for implementation of business processes. Business processes can be executed using custom developed or off-the-shelf software. Monitoring and
- 278 -
supervision encompasses tracking of individual processes, so that information on their state can be easily seen, and statistics on the performance of one or more processes can be provided. The analysis and optimization phase includes retrieving process performance information from the monitoring phase; identifying potential areas of improvement and current problems, and using both heuristic and exact methods to optimize business processes.
The aim of analysis along this dimension is to identify relationships between ERP maintenance and BPM at each stage of the BPM process and how BPM practices could contribute to improved operation and maintenance of ERP systems. It is expected that strengthening relationships between BPM and ERP maintenance helps to address business related issues of ERP maintenance.
2.3 Process Improvement Dimension Capability maturity model (CMM) is one of the most widely recognized software development PI and
quality management approaches [12]. Using this model, the maturity of software development processes, including maintenance processes, can be assessed. It is assumed that a higher level of process maturity allows improving maintenance efficiency. The capability maturity model integration (CMMI) is seen by many as a natural evolution of CMM, which was originally designed for software focus. CMMI expands the CMM to address systems engineering and integrated product development as well. A special version of CMM for maintenance purposes also has been proposed [3]. However, this version has not become as widely accepted as the general version.
CMMI offers two approaches called “staged representation” and “continuous representation“. Five levels are defined for staged representation of CMM [6]: 1) initial; 2) repeatable 3) defined; 4) managed; and 5) optimizing. All levels play an important role in implementing CMMI. They define and support the framework each process area needs to operate consistently, predictably, and manageably. In other words, the CMMI levels provide the commitment, ability, directed implementation, and verification needed for each process area. Thus, it could be applied for software support dimension.
Four process areas are defined for continuous representation of CMMI: project management, engineering, support, and process management [12]. The Project management area of CMMI helps to plan, manage, and report on project progress. The Engineering process area is focused on establishing workable requirements, developing appropriate solutions, assembling components into an integrated whole, verifying product features, and validating product performance. Support process areas are designed to provide the kind of infrastructure that management and engineering need to execute project activities in a well-oriented and controlled environment. The Process management area deals with how the organization manages, maintains, and institutionalizes its process program and the assets it contains. The focus is on strategic management, improvement, and development.
It is assumed that higher level of maturity and capability contributes to ERP maintenance. The aim of analysis along this dimension is to identify process areas, which provide the most significant contribution.
2.4 Interactions As it is known, an ERP system is a part of business and business growth is directly depended on
potential capabilities of the ERP system. Thus, a trusted approach is needed to discover way to optimal usage of ERP system potential according to external influences. Three dimensions discussed before is equally important to maintenance and improvement of ERP systems.
Interactions between BPM and SM are mutual. Any change of BPM or request for a new business process initiates activities belonging to different SM categories. For example, if a new business process model is requested then according to reason that causes this request it will refer to adaptive, perfective or preventive maintenance categories. If the change of existing business process is requested then it will refer to corrective maintenance. Thus, BPM is an area of support from the SM perspective. From the other side, ERP systems have limitations established by vendors or system architecture. These limitations are often taken in account in BP design. During SM, there is also a need for managing maintenance activities and software quality control. Thus, the best practice of each CMMI process area also could be useful for SM.
BPM and CMMI approaches combination with traditional SM and best practice establish successful environment and give benefits for maintenance of ERP systems. The following interactions between ERP maintenance and BPM are proposed:
B1. Formalized business process representation facilitates localizing impact of hot packs during the corrective maintenance.
B2. Formalized business process representation facilitates testing during the adaptive maintenance.
B3. Business process execution depends upon transfers, modifications and tuning of interfaces during the adaptive maintenance.
B4. Business process monitoring initiates activities of corrective and adaptive maintenance.
- 279 -

B5. Business process analysis and design initiates activities of perfective maintenance.
B6. Version upgrades during the perfective maintenance initiates business process design activities.
B7. Business process monitoring overlaps with routine administration and workflow monitoring in ERP systems during the preventive maintenance.
B8. Formalized business process representations facilitate user support.
B9. Formalized business process representation is essential for strategic planning and coordination.
The following interactions between ERP maintenance and CMM are proposed:
C1. Higher level of capability in configuration management and PI improves corrective and adaptive maintenance, particularly application of hot packs and transfers.
C2. Higher level of capability in all project management process areas improves transfers and version upgrading.
C3. Higher level of capability in process and product quality assurance, verification and validation improves testing during the adaptive maintenance and facilitates preventive maintenance.
C4. Higher level of capability in requirements management and requirements development improves introduction of modifications and enhancements during the adaptive and perfective maintenance.
C5. Higher level of capability in technical solutions facilitates introduction of modifications and enhancements and tuning of interfaces during the adaptive maintenance and workflow automation during the perfective maintenance.
C6. Higher level of capability in measurement and analysis facilities monitoring activities during the preventive maintenance.
Other interactions between SM, BPM and PI also can be identified, but the propositions listed above focus on the most profound interactions.
3 Case Study In order to understand challenges faced by companies during the maintenance and operations phase of
ERP systems, maintenance of the ERP system at large energy company is analyzed from the joint perspective of SM, BPM and PI. Initially, SM activities at the company are analyzed for each category of SM. That is followed by analysis of interactions between SM and BPM and PI. The case is analyzed from the point of view of the third party service provider.
3.1 Case Description The company investigated in this case study is a large energy company (EC). It is using Oracle e-
Business Suit (EBS) ERP system. This ERP system was implemented at the company starting from 2001 and two initial phases of implementation lasted two years. The maintenance of the ERP system is performed by a third-party (IC), which also was responsible for initial implementation, and EC internal support staff. Implementation initially was characterized by many customizations. During, the maintenance phase several significant issues of adaptive maintenance were performed: integration of new modules and implementation of system modifications. Currently, there are about five thousands active users, and the ERP system covers large part of business (totally, 7 modules are being used) and user support is important part of EC system maintenance. This investigation focuses on the last two years of the maintenance phase. Relatively stable operations of the ERP system have been achieved at the beginning of this period and the last major functionality expansion (launching of a major new module) was completed in 2006.
The main overall concerns during the maintenance and operation phase are: 1) qualification of maintenance staff; 2) finding best solutions for change requests; and 3) overall understanding of the system and seeing the big picture.
The maintenance staff of the ERP system should know not only how to technically prevent problems, but also to understand functionality of the ERP system and business needs. It is hard to find qualified technical people who can understand systems functionality from the business side and additional training usually is needed for new consultants. Identification of necessary changes and finding the best solution for these is also challenging. EC usually has the best understanding of business needs at the module level while IC usually has the best understanding of technical capabilities and limitations, and better understands the overall relationships within the system. Balancing the business needs and efficient technical solutions often has been difficult.
The information necessary for this case study is gathered using the personal experience as the maintenance team leader by one of the authors, interviews with members of implementation and support staff at IC and using records in an issue management system, which is used as a main communication vehicle during the maintenance process.
- 280 -

3.2 Analysis of Software Maintenance Activities SM activities are analyzed according to the framework discussed in Section 2.1. For the given case
study, SM activities performed are identified and their characteristics are discussed.
Corrective maintenance: Hot packs from the product vendor are installed only if there are bugs that may not be corrected in another way. Hot pack implementation requires extensive testing, because functionality of dependent modules might be affected. Troubleshooting is performed in response to problem issues registered in an issue tracking system. Figure 1 shows the number of issues opened and issues solved for every month. The analysis shows that there have been some irregular rises of new issues. The largest spike in September 2008 appeared because of database version upgrade what might suggest insufficient testing. By analyzing issues for the end of the month, we can see that number of issues have a tendency to decrease. The purpose is improvement of maintenance process by doing such things as implementing agile development process, defining goals, working on feedback from customers and team members, working on quality and capturing of high level business processes.
Figure 1. Number of newly created, solved and end-of-period open issues
Adaptive maintenance: Testing is performed before implementing any changes in the system. Initially, the system is tested manually in the IC’s test system, followed by acceptance testing performed by EC Regress testing of the critical functionality is tested before every delivery. Testing process is performed starting with testing of critical functions and those most directly affected by changes. Time needed for testing affect intervals between subsequent transfers. Regular transfers are made once in every two weeks. However, there are many non-regular deliveries, which are made because of some critical problems in system functionality, urgent changes are needed (e.g. non-predictable changes in business process or changes in legislation) or influence of external systems (e.g. bank systems). There are two types of modifications: configuration or system modification. Authorization activities such as user and permissions management are performed by the help desk operated by EC. It is important to close unnecessary responsibilities and users, because amount of users and responsibilities determine cost of licenses. The ERP system has several interfaces with external systems such as client portal, banks, geographical information system. These interfaces are relatively stable but most frequently modifications are in interfaces responsible for interactions with other systems owned by EC (for instance, utilities management system and geographical information system).
Perfective maintenance: Implementation of additional modules continues during the maintenance process. In order to optimize workforce at EC, project costing processes have been automated by implementing appropriate module. A new version upgrade is being planned. However, there are still concerns about the best way to perform it because of costs and time required for the upgrade. The main problem is migration of system modifications introduced in early implementation stages, especially, because they are made internally rather than externally.
Preventive maintenance: System administrators at EC are monitoring system load, performance and errors. If there are any anomalies preventive activities are performed or a problem issue is submitted to IC. This monitoring concerns only technical aspects of systems operations and does not concern measuring efficiency of business process execution. Code reviews are performed by competent technical specialist after each new development. However, documentation is updated irregularly or not updated at all since the implementation and it is poorly structured. New maintenance team member require longer ramp-up time.
User support: During implementing major new releases, training for key users is held by IC Subsequently, the key users run trainings for end users at EC. Help desk maintained by IC is where all organization IT (Information Technology) related issues are processed. If it concerns ERP, an issue goes to EC’s IT department, and they are solving the issue. If the issue is complicated, it is forwarded to IC as a problem issue or change request.
Strategic planning: A monthly meeting is being organized for module owners of ERP system. Change requests and problems are discussed with goal for every member to know what is going on in the system and find out if there are any changes which may affect his area.
- 281 -

Table 1 summarizes the main tasks performed at EC during the maintenance process and main achievements (marked with (+)) and difficulties (marked with (-)) associated with these tasks.
Table 1. Summary of software maintenance activities at the company.
Maintenance categories
Tasks performed Appraisal
Corrective maintenance
Application of hot packs Time consuming analysis of low level interdependencies (-) A lot of testing (-)
Troubleshooting Relatively small number of problem issues (+) Uneven distribution of problem issues (-)
Adaptive maintenance
Transfers Throughoutly tested, reliable regular deliveries (+) Many irregular deliveries (-)
Testing Regress testing (+) Detailed test cases (+) Lack of time for regress testing (-)
Modifications and enhancements Understanding and capturing of high level processes (+) Analysis of dependencies (+)
Authorizations Payment of licensing fees for unnecessary functionality (-) Tuning of system interfaces Use of standards (+)
Perfective maintenance
Version upgrade Many system level customizations (-) Workflow automation Proof of efficiency of automation (+)
Add hoc approach (-) New application implementation Implementation of client portal (+) New ERP modules implementation
One new module successfully implemented (+) Lack of defined requirements (-)
Decision making support On-the-fly requests (-) Preventive maintenance
Routine administration Workflow monitoring (+) Code review Code reviewing established (+)
Code review checklist made (+) Documentation update New documentation as user stories in process (+)
Lack of documentation for maintenance team (-) Data archiving In process (+/-)
User support Help desk Operated using ITIL guidelines (+) Strategic planning
Steering committee meetings (+) Lack of formalized approach (-)
3.3 Analysis of Interactions BPM is performed by EC and IC observes only outcomes of their BPM activities. Business processes at
EC have evolved over time and are considered unique to a company (therefore, many modifications in the ERP system were implemented) and level of their formalization is low. Knowledge of business processes is also largely restricted to individual departments. IC has elaborated formalized representations of high level processes for their own purposes. EC shares with IC an annual departmental roadmap of planned changes in business processes and systems. The ERP plays the major role in execution of business processes, although there are many other related systems. Measuring, analysis and optimization of business processes is performed in ad hoc manner. However, IC knows which functions has the highest business value and also change requests are accompanied with appraisal of their business value and importance.
Software development PI is a part of company wide drive for quality improvements at IC. IC is an ISO (International Organization for Standardization) certified company and has its own internal quality assurance and process development departments. The self-appraisal of process maturity and capability is given in Table 2. The table shows that capability level is at least 3 for every process area and even the fifth level has been reached in some of the process areas. It means that quantitative management and optimization is being used in these areas. An agile project management methodology is used as a backbone of project management processes. New releases are developed and deployed during two weeks long development iterations. Issues and change requests are allocated to the iterations according to their priority. Prior to each iteration, development effort is estimated and tasks are planned. For every period quantitative measurements are used to control development process. These measurements include planned/worked hours on issues, percent of planned goals reached and number of issues that have been returned from client testing. Optimization opportunities are discussed at the end of every period with whole project team in retrospective meeting. Project Monitoring and control is related to Risk management and Measurement and analysis. Possible risks are measured by giving every risk a value in scale from 1 to 3 (no risk or low level of risk, average level of risk or high level of risk). The maintenance project is measured in many ways and at different organizational levels. There are measures for organization management, which include costs, revenue, terms and client satisfaction. Project manager defines goals and measures project by number of issues, created and solved issues in period, planned/worked man-hours and percent of
- 282 -

revenue/costs. Client-related measurements are defined in service level agreement. Measurements and risks are optimized if needed. Configuration management and Product integration is measured by number of releases, number of extraordinary releases. Automation is used to optimize these processes.
Table 2. Appraisal of process maturity and capability at IC. (ML - maturity level, CL - capability level and “Y” - achieving the specified level of capability)
Name CL1 CL2 CL3 CL4 CL5 ML2 Project Planning Y Y Y Y Y
Project Monitoring and Control Y Y Y Y Y Supplier Agreement Management Y Y Y Requirements Management Y Y Y Process and Product Quality Assurance Y Y Y Configuration Management Y Y Y Y Y Measurement and Analysis Y Y Y Y Y
ML3 Integrated Project Management Y Y Y Risk Management Y Y Y Y Y Requirements Development Y Y Y Verification Y Y Y Validation Y Y Y Technical Solution Y Y Y Product Integration Y Y Y Y Y Decision Analysis and Resolution Y Y Y Organizational Process Focus Y Y Y Organizational Process Definition Y Y Y Organizational Training Y Y Y
ML4 Quantitative Project Management Y Y Y Organizational Process Performance Y Y Y
ML5 Causal Analysis and Resolution Y Y Y Organizational Innovation and Deployment Y Y Y
Interactions between ERP maintenance, BPM and CMM are analyzed according to propositions made in Section 2.4. Formalization of business processes has minor impact on application of hot packs (B1) because analysis is conducted at more technical level using software design documentation though it is very helpful in testing (B2) and user support (B8). In order to enforce this link and due to the lack of formalized business process representations at EC, IC has developed high level business process representations for using in testing, training and planning. Implemented modifications have direct impact on business processes at EC (B2), for instance, customer service functionality is now available though the enterprise portal rather than using the ERP system directly. The link between business process monitoring, corrective and adaptive maintenance (B4) is weakly developed. Monitoring focuses on technical performance measures and maintenance activities are initiated only when problem occurs. Different departments at EC have different understanding of business process and they often do not communicate between each other sufficiently. That results in incomplete change requests, which need to be clarified and rework several times. Monitoring is performed by EC and this information is shared with IC only upon request produced during processing of problem issues. Similarly, there have been few activities of perfective maintenance related to business process automation (B5) because EC does not systematically seek for improvement opportunities. Additionally, changes in business processes are not being synchronized with maintenance activities. That results in a situation when a new service at EC is announced without regards to possibilities to implement this service in the ERP system within the provided timeframe. Changes in other systems owned by EC also are not being synchronized with ERP maintenance activities. Even those EC does not want to restrict its operations due to the ERP system, in the long-term that prevents from finding the most efficient solutions. The planned upgrade to the latest version of the ERP systems is expected to cause important changes in business processes at EC (B6) because fewer customizations will be introduced.
Configuration management and product integration are highly automated at IC thus facilitating applications of hot packs and releases (C1). An open source version control systems is used, and a custom built ERP configuration tool is used for automate applying of changes in the production environment. However, some modifications in the system are made also by EC themselves. These changes are resembled in the configuration manually. High maturity of project planning has enabled to deliver changes on schedule (C2). Late deliveries result in penalty fees, which almost regularly paid till the beginning of 2009 but no late deliveries penalties have been levied since that. Attitude and sense of responsibility among the maintenance team members also have been improved resulting in more predictable and stable workflows. Lack of quantitative measurements in verification and validation causes problems in quality of the product (C3). About 15% of issues in each release come back from the client testing. Ways to improve testing procedures currently are being explored, and automated testing
- 283 -
seems one of the most plausible solutions. Requirements management is performed using the issue tracking system. The main problem in requirements management is that requirements are often insufficiently specified and require multiple iterations of refinement (C4). Requirements have clear prioritizations associated with their business value though their identification is not systematical. Both requirements management and requirements development processes require further improvement. Technical solution capabilities currently are also at the third level and there are some difficulties with finding the best solution for implementing changes and version upgrading (C5). Currently, the main technical objectives are transition from internal modifications in the core system to external add-ons and usage of best practices. In the area of business process automation, new technologies such as mobile computing are pursued, for instance, currently a modification for using mobile devices in metering is in the planning stage.
4 Conclusion The framework of analyzing ERP maintenance according to SM, BPM and PI dimensions has been
elaborated and applied in this paper. Incorporation of BPM and PI related aspects in analysis of ERP maintenance allows for deeper understanding causes of ERP maintenance success or failure. Using the case of ERP maintenance has been concluded that mature configuration management and project planning practices enable timely and error free introduction of hot packs, modifications and new modules or applications. Agile project management techniques have been particularly helpful in improving maintenance efficiency and the number of open issues at the end-of period is steadily decreasing. Formalization of at least high level business processes allows improving adaptive maintenance and incorporation of new members into the maintenance team. However, interactions between ERP maintenance and BPM remain the most problematic issue. That is because there is lack of business process formalization and inter-departmental communication within EC and system’s adaptation and perfection opportunities are identified in an ad hoc manner. Currently, IC has limited options for intervening in BPM activities, and it has mostly focused on technical aspects or ERP maintenance. However, as suggested by Gillot [5], IT (e.g., IC) should have a role in identification of business process integration opportunities and definition of best practices. On the other hand, that contradicts to EC’s implicit policy of increasing its ownership of ERP maintenance processes.
References [1] Abran, A., Moore, J.W., Bourque, P., Dupuis, R. Guide to the Software Engineering Body of Knowledge
(SWEBOK), Ironman Version. IEEE Computer Society Press, Los Alamitos CA, 2004.
[2] April, A., Abran, A . Software Maintenance Management: Evaluation and Continuous Improvement. Wiley-IEEE Computer Society Press, 2008, p. 324.
[3] April, A., Abran, A., Huffman J., Dumke, R. Software Maintenance Maturity Model (SMmm): the software maintenance process model. Journal of software maintenance and evolution: research and practice, vol. 17, 2005, pp. 197 – 223.
[4] Boehm, B. A spiral model of software development and enhancement, IEEE Computer, vol. 21, issue 5, 1988, pp. 61-72.
[5] Gillot J.N. Complete Guide to Business Process Management: Business Process Transformation or a Way of Align, Booksurge Llc, 2008, p. 381.
[6] Grubb, P., Takang, A. A. Software maintenance: concept and practice. World Scientific, 2003, p. 349..
[7] IEEE. Draft standard for software maintenance. IEEE, New York, U.S.A, 1992.
[8] Light B. The maintenance implications of customization of ERP software. Journal of software maintenance and evolution: research and practice, vol. 13, issue 6, 2001, pp. 415 - 429.
[9] Longworth, G. Designing Systems for Change, NCC, Manchester, U.K, 1985.
[10] Nah, F. F. H., Faja, S., Cata, T. Characteristics of ERP software maintenance: a multiple case study. Journal of software maintenance and evolution: research and practice, vol. 13, issue 6, 2001, pp. 399 – 414.
[11] Ng, C. S. P, Gable, G.G., Chan, T. An ERP-client benefit-oriented maintenance taxonomy. The Journal of Systems and Software 64, 2002, pp. 87–109.
[12] Persse J. R. Process Improvement Essentials. O’Reilly Media, Inc. 2006, p. 352.
[13] SSADM. SSADM Developers Handbook, version 4, NCC Blackwell, Oxford, U.K, 1990.
[14] Taylor, M. J., Wood-Harper, A.T. Methodologies and Software Maintenance. Software Maintenance: research and practice, vol. 8, 1996, pp. 295-308.
[15] Trkman, P. The critical success factors of business process management. International Journal of Information Management, vol. 30, issue 2, 2010, pp. 125-134..
[16] Vinje, P. Aktiv Systemforvaltning, Teknisk Forlag, Copenhagen, Denmark, 1991.
[17] Watchel, R. The Software Modification Manual, North Bay Software Analysis, Occidental, California, U.S.A, 1991.
[18] Wetzstein, B., Ma, Z., Filipowska, A., Kaczmarek, M., Bhiri, S., Losada, S., Lopez-Cobo, J.M., Cicurel, L. Semantic Business Process Management: A Lifecycle Based Requirements Analysis. Proceedings of the Workshop SBPM 2007, Innsbruck, April 7, 2007, pp. 1-11.
- 284 -

USABILITY HEURISTICS FOR ONLINE VIRTUAL WORLDS
Viktorija Butkute, Kristina Lapin
Vilnius University, Faculty of Mathematics and Informatics, Naugarduko 24, LT-03225 Vilnius, Lithuania, [email protected], [email protected]
Abstract. This paper explores a set of usability heuristics developed for the EU FP7 ICT VirtualLife project. The purpose of the project is to create a three-dimensional online virtual world – in the form of a safe, democratic and legally ruled collaboration platform. 3D virtual worlds are a relatively new expression of online communication and collaboration tools. The most essential aspect – usability – still is in tentative phase. Consequently, conventional usability heuristics are not suitable for 3D virtual worlds. The paper identifies major differences between 3D virtual worlds and other online collaboration and communication tools. Specific user needs are discussed considering the users’ real experience, mistakes and problems.
Keywords: virtual world, usability evaluation, heuristic evaluations, online communication and collaboration, user research, user needs.
1 Introduction The paper presents the results of an analysis that was performed in order to obtain usability heuristics
while developing the VirtualLife1 virtual world platform. VirtualLife is an ongoing 36 month project awarded by the European Commission to 7 small enterprises and 2 universities. The project is aimed at developing of a 3D immersive collaborative virtual environment with a number of innovative features such us secure and trusted communication, virtual legal system, dispute resolution mechanism, user reputation management system and a peer-to-peer network communication architecture. The platform is intended for business and education [1].
We distinguish two types of virtual environments:
• the fully immersive virtual reality environment where user is equipped with shutter glasses to give stereoscopic views and pinch gloves for manipulation,
• the non-immersive desktop web-based virtual environments where three-dimensional photorealistic view is displayed on a desktop and user as an avatar manipulates the virtual objects through the graphical user interface.
In this paper we deal with the latter three-dimensional non-immersive desktop virtual environment and call it virtual world. Virtual world enables many users to interact, navigate and experience a synthesized world in real time. User is able to develop, alter and submit content as well.
In recent years the development of virtual worlds has greatly increased. At present, wide spectrum of products with various features and characteristics exists. The need to conduct a formative evaluation of the first prototype of VirtualLife platform encouraged us to study usability heuristics devoted to social collaboration and communications platforms. We define heuristic as design principle that is used to evaluate system usability. A heuristic evaluation is an informal usability inspection method for finding usability problems in a user interface. The interface is examined by 4 – 5 trained evaluators that judge its compliance with usability principles [9], [10].
The attempts to perform heuristic evaluations are made for both kinds of virtual environments. The heuristics for usability inspection for fully immersive virtual reality environments reflect the sense of presence, sense of immersion and haptic feedback [14]. The heuristics inspections in virtual worlds were performed using the traditional usability heuristics for graphical user interfaces [17]. However, virtual worlds raised sociability as a new aspect of software applications. This aspect is not covered in the initial set of heuristics. Therefore we need to redesign the initial set of heuristics in order to have a specialized set devoted to virtual worlds.
In this paper we develop a set of usability heuristics for virtual worlds. We deal with distinctive features of virtual worlds which gave us the means to define uncovered aspects of existing heuristics defined for 2D social communications and collaborations environments also called Web 2.0 environments. It is important to stress that sociability aspects in virtual worlds serve the same purposes as in Web 2.0 environments. Only the presentation of the communication context differs: in Web 2.0 communication appears in text-based environment whereas in virtual worlds communication appears in photorealistic three-dimensional environment. Therefore we state that successful experience of the implementation of sociability aspects in Web 2.0 environments is a useful background defining the usability heuristics for virtual worlds. It is important to
1 The research is supported by EU FP7 ICT VirtualLife project, 2008-2010, see http://www.ict-virtuallife.eu
- 285 -

understand which sociability aspects of Web 2.0 environments should be implemented in virtual worlds as well as how they should be implemented in order to improve the user’ communication experiences.
In the following sections we analyze social communication mechanisms that have to be supported in virtual worlds. Definition of specific virtual world user needs support the selection of relevant heuristics dedicated for the evaluation of Web 2.0 environments. Our analysis of virtual world users’ forums permits us to study the usability defects in existing virtual worlds. Users’ comments allowed us to find the gaps and to append the defined set.
2 Features of 3D virtual worlds Three-dimensional virtual worlds distinguish for their features from a wide set of 2D online
collaboration and communication tools also called Web 2.0 tools. Several of those features are essential with regard to usability [19].
Two- and three-dimensional collaboration and communications environments have the important common feature: information there cannot be controlled as users create and manipulate the bulk of content. The most popular environments even encourage users to perform these activities. Hence, the concept of audience vanishes in 2D and 3D collaboration and communication environments. Users become more participants in knowledge creation than consumers of prepared data.
The distinct feature of three-dimensional spatial information delivery manner is the need of specific navigation. In a typical hierarchy of information arrangement, it is possible to group data into logical sections or trees. In this case the data structure restricts or predicts every item of information which is always seen. However, the three-dimensional spaces cannot be structured or recognized in such a manner as users navigate in a totally different way. The navigation is performed as in the real world. Users of 3D virtual worlds link together information and its place of storage with virtual objects.
The graphical user interface in 3D virtual worlds substantially differs from traditional interfaces [15]. The main differences are unique input-output devices and implementation of interaction between users. Traditional usability engineering methods for evaluation of virtual worlds interface are suitable, but partially. Stanney and Cohn suggest considering the following aspects in order to evaluate the graphical user interfaces in a 3D virtual world [15]:
• Integration of input-output devices • Navigation • Intuitiveness and simplicity of objects manipulation • Comfort of system design Additional and the unique usability aspect is the sense of presence which derives from exclusiveness of
3D virtual worlds – imaginary transportation between various virtual places [15]. To support such transportation the world should provide immersive content, realistic movement and interaction control tools.
3D virtual worlds are an innovative and evolving area of information technologies. They need an additional research in order to ascertain how users intend to use navigation tools and communicate with other users or virtual objects in 3D virtual reality.
3 Social mechanisms for communication and collaboration Communication and collaboration tools should be created considering the social practice. It is important
to cover social mechanisms which have a critical influence to product success. Major social mechanisms are conversation, coordination and awareness [11].
Designing communication and collaboration tools, it is essential to define how the various forms of conversation will be supported. For example, the system can use e-mail, videoconferencing, videophones, chat rooms or messaging. Besides, the decision regarding conversation support tools is always influenced by the type of communication, as it can be synchronous or asynchronous. In 3D virtual worlds it becomes possible to render a high quality synchronous realistic communication and use additional visual aids supporting the discussion.
The success of group work often depends on coordination. And there is no difference if the group works in a real or virtual environment. There are several coordination mechanisms which can help to implement this activity properly [3]:
• Verbal and non-verbal communication • Schedules, rules and conventions • Shared external representations Coordination mechanisms can also be formal or informal. However, all of them should be socially
acceptable and chosen to keep system’s balance. Too strict coordination can be frustrating whereas the lack of control leads to a chaos.
- 286 -
The concept of awareness covers the rendering of surrounding activities. This is the most difficult task for the developers of communication and collaboration tools. It is important to eliminate communication barriers which emerge because of physical distance. Awareness technologies support a communication between distance collaborators. The following examples illustrate the application of awareness technologies:
• “Portholes” – the system which renders the video view from different workplaces in real time [4] • “Babble” – the chat room where visitors are represented as colorful balls which inform about the
amount of active users and observers [2] • “Tickertape” – the instant messaging system which displays users’ messages scrolling across the
screen. This kind of tool allows the remote visitors to chat, send requests and organize their activities [5]
4 Specific user needs in 3D virtual worlds Specific user needs is the base for usability research in 3D virtual worlds. In principle, these needs
derive from the distinction of three-dimensional virtual worlds. This section discusses major user needs which should be met in virtual worlds [6], [7].
4.1 Presentation Graphical user interface being the link between user and system is always an important component in
every software product. This aspect is critically important for the success of 3D virtual world as well. In order to render rich, wide and photorealistic views, the system should be based on innovative and modern technologies. However, it is essential to consider a part of users who use older and slower hardware. Hence, the system should be able to identify such features of users’ hardware.
Avatar is a virtual representation of every user, which has a set of individual qualities. Consequently, user’s wish to transfer his personality into virtual reality should be met. Virtual world should offer a set of predefined avatars of both genders, various age and appearance. User should be able to change these attributes at any time as well.
4.2 Activity One of the most often performed activities in virtual worlds is user interaction between each other or
with virtual objects. A user expects that general real world physical interaction rules will be obtained in a virtual world. Therefore the interaction between avatars must be as realistic as possible. Additionally, such activities must conform to the ordinary rules of logic. For example, some virtual spaces might be public for all visitors and others could limit the visiting availability. Private and public modes are also essential for user communication which is commonly based on text or voice chat.
Avatar movement is required in almost every user task in a virtual world. This movement be as simple and intuitive as possible. Avatars should be able to perform all general movements: walking, running, sitting, looking around, etc. Ability of flying and teleportation are additional but also important forms of movement in 3D virtual worlds.
As already mentioned, 3D virtual world users become more content creators than consumers. An idea of virtual worlds is to give users the ability of content creation and manipulation. It is required to provide tools for external object import as well. Parallel to virtual objects creation, advanced users are interested in extending the functionality of the virtual world or objects. Hence, additional tools (usually a scripting language) should be provided.
4.3 Rules A basic set of rules should be created and applied to every item of a virtual world in order to control the
usage of virtual objects. These rules are intended to specify licensing and intellectual protection. The virtual world should define object ownership policy – the rules to modify, copy or create objects.
5 Conventional usability heuristics are not sufficient for 3D virtual worlds In order to evaluate the sufficiency of conventional usability heuristics for 3D virtual worlds, the
accomplished research was divided into several phases.
The result of the first phase was a collection of various features of sociability and usability for 2D online collaboration and communication tools. These features were collected with references to publications ([12], [13], [16], [18], [8], [3]) that discuss the usability and user needs in 2D online communication and collaboration tools.
During the second phase all gathered data was grouped and summarized in order to produce a structured set of sociability and usability heuristics for 2D online communication and collaboration tools. The list was
- 287 -

divided into sociability and usability parts, later separated into subgroups. The phase was ended with 13 sociability and 34 usability heuristics.
Sociability (S): S1. The purpose of virtual community
S1.1. Virtual community has a clear and meaningful name
S1.2. Purpose of virtual community is stated, defined clearly and briefly
S2. Members and their activity
S2.1. Virtual community has members
S2.2. Each member has an account in virtual community
S2.3. Each member is able to form groups and communities, which unify members of the same interest
S2.4. Virtual community implements clearly separated user roles
S2.5. Attendance of member in virtual community is visualized in a particular manner
S2.6. Virtual community supports, motivates and promotes active members
S2.7. Virtual community supports, motivates and promotes the continuous participation
S2.8. Virtual community supports, motivates and promotes effective communication and collaboration
S3. Rules
S3.1. Virtual community has rules which define the control of users’ registration and their attendance in virtual environment
S3.2. Virtual community has rules which control the behavior of community members
S3.3. The system has administrator
Usability (U) U1. Navigation
U1.1. It is easy to learn how navigation is performed
U1.2. Navigation is intuitive and memorable
U1.3. Minimal use of additional windows
U1.4. Minimal use of deep hierarchical structure
U1.5. The system ensures the consistency between navigation information
U2. Accessibility
U2.1. The system evaluates if user has a sufficient set of devices and tools in order to use distance communication and collaboration tools
U2.2. The system predicts the possible problems related to technical barriers and has a set of predefined solutions
U2.3. Technical requirements are clearly defined
U2.4. The system ensures a short time for downloading and installing the tool
U3. Information delivery and presentation
U3.1. The system ensures the convenience of information transfer, acquirement and search.
U3.2. The system provides only complete and updates information
U3.3. Redundant usage of colors is avoided
U3.4. Usage of animated and graphical elements is limited
U3.5. Information is delivered consistently and coherently
U3.6. The system provides help for users
U4. Dialog
U4.1. The system ensures that protocol of dialog usage can be easily learned
U4.2. The user controls the system behavior, not vice versa
U4.3. The system response is predictable
U4.4. The system response is informative
U5. Security
U5.1. The system provides tools for error managing
- 288 -

U5.2. The system prevents user from making mistakes. However, if mistakes were made the system detects discrepancies and reports about issues
U5.3. The user is able to cancel the last performed actions
U5.4. The system ensures the security of confidential information and intellectual property
U6. Consistency
U6.1. The user is able to predict the result of performed actions
U6.2. The system helps user to evaluate the influence of past actions to present state
U6.3. The user can easily apply his knowledge and experience from other systems
U6.4. It easy for the user to apply acquired knowledge and experience in other systems
U6.5. The system allows performing more than one task at the same time
U7. Interface
U7.1. The system ensures simple learning of interface usage
U7.2. Interface predicts user requirements
U7.3. Interface is always visible
U7.4. Interface is comprehensible
U7.5. The system provides shortcuts
U7.6. The system provides tools for account management
The list of usability and sociability heuristics from literature review is mapped with virtual world user needs (see Table 1.). The mapping shows that all of these heuristics are critically important for online collaboration and communication tools and implements user needs. However the mapping shows that some user needs are only partially covered by usability heuristics.
Table 1. Mapping user needs and usability heuristic
User need Usability heuristic
Create virtual content and manipulate virtual objects none
Protection of person and user content U5.4
Ability to use the tool U2.3, U2.4.
Safe and trusted system U5.1, U5.2, U5.3, U5.4.
Multiple interfaces with the tools of messaging, maps, inventory, avatar movement control, search, object editor, etc.
none
Scalable screen view according to user hardware capabilities U2.1, U2.2, U7.2
A basic set of rules is applied to virtual world content. The rules define licensing, protection of intellectual property and object creation and modification.
U5.4, S3.1, S.3.2
Interaction between avatars is analogous to people interaction in the real world none
Various kinds of communication between avatars none
Search for all kinds of content U3.1
Extending the functionality of the virtual world using given tools none
Movement in the virtual world is simple and intuitive U1.1, U1.2, U1.5
Creation and modification of avatar U7.6
The result of this analysis proved that user needs are partially covered by the usability heuristics. The usability heuristics designed for Web 2.0 applications should be modified and augmented in order to apply them to three-dimensional virtual worlds. Moreover, taking into account the results, the areas require a deeper analysis of the specificity of virtual worlds. The specific features regard avatars, virtual content and object interaction.
6 Usability Heuristics Derived from the Existing Virtual World Forums We have made a survey of three virtual worlds’ forums: “Second Life”2, “Active Worlds”3 and
“There”4. The purpose of the survey was to ascertain if the virtual worlds meet usability aspects. First, we have 2 http://forums.secondlife.com 3 http://forums.activeworlds.com 4 http://forums.prod.there.com
- 289 -

selected the following keywords: ‘usability’, ‘usability problems’, ‘navigation’ and ‘interface’. Second, we have detected the discussion threads which are related to the selected keywords. Third, search ended with tens of useful forum posts. The forums are surveyed further in this section.
The most frequently mentioned subject in Second Life and There is related to inventory management. Users claim that their inventory has a lot of objects and there is no a proper way of finding anything in it. Thus reorganizing the inventory wastes much effort. Forum visitors also suggest that any object attached to the avatar should have an icon indicating that. We think that the following heuristics can support the evaluator who wants to detect inventory assets management problems. The evaluator has to make a judgement if the following statements (heuristics) are true:
U3.7. Avatar inventory provides the means for searching, filtering and sorting
U3.8. An adequate system response is provided while attaching objects to an inventory asset
One more complaint was about decreasing available screen space in Second Life because of lots of new interface elements. The reason is that developers constantly improve the virtual world. Therefore less and less space for actually seeing the world remains. As one can notice, the decreased available screen space is similar to a Web page design problem. Here a well known recommendation states that informational part should occupy at least half of the whole screen. A special user testing is required in order to estimate more exactly. As a result we formulate the following statement (heuristic):
U7.7 The 3D screen space should be in the right balance with the interface space.
Active Worlds forum visitors discuss the ability to run multiple browsers concurrently. They claim that a frequent user needs to be inside several universes at one moment. As Active Worlds does not support this feature at present, the users spend significant time simply hopping between universes. This problem complies with the U6.5 usability heuristic.
Several observations were made on the buttons layout: the ‘Leave’ button is situated near ‘Activate’ and ‘Wear’ next to ‘Delete’. After trying to revise these discrepancies, we found that the problem was fixed.
Active Worlds forum visitors started the thread named “Critical flaws with Second Life”. This thread is intended to compare Active Worlds to Second Life and evaluate the critical disadvantages of Second Life. A confusing building activity was mentioned as a dominant usability problem. The users claim that building a virtual object in Second Life is not as easy as in Active Worlds. Here it is enough to drag the nearest objects and immediately starting to build. In Second Life, the user needs to learn the building primitives such as curves and shapes. This observation conforms to the U6.4 usability heuristic.
Second Life users are not satisfied with the time which is needed to get a basic experience to start even simple tasks. It is said that 4 to 20 hours is needed, which is enormous time range. According to forum visitors, helpful web pages for user guidance in Second Life are often hard to find. This issue extends the learning time. This problem is referred in the U7.1usability heuristic.
Most of virtual worlds provide the feature of group creation. This is useful for users who have common interests and organize teamwork between the remote members. However, Second Life users claim that the group management tool functions not properly. For example, after removing a member from the group it is not possible to prevent him from rejoining unless the group is invite-only. This problem is covered by the S3.2 sociability heuristic.
Several posts related to virtual world integration with various external systems have been selected. Forum visitors suggest a useful additional feature – to join virtual world from an external social network. Integration with social networks would allow importing friends from social networks, inviting them via their social network and providing invited friends with avatars or other virtual content. Thus, after entering the virtual world a novice could communicate with existing friends. This feature would help to conform to virtual world’s life easier and faster. This problem is summarized in the following heuristic:
U8. The system supports account transfer from external social networks and virtual worlds.
7 Conclusions This paper presents a view of virtual worlds from a developer perspective. Developing a new virtual
world is important to learn from existing and competing products. We analyzed experience gained from existing social collaboration and communication environments, primarily Web 2.0 tools.
Virtual worlds are devoted to provide playful experiences. Therefore, a purpose is to protect user from frustration when the user encounters usability defects. The most amusing feeling begins to pall the user after several annoying defects.
User forums are a useful source of information for usability researchers. The amount of information contained there is really huge. However, user forums form a unique archive of comments and complaints that cannot be obtained in another way. Apart from the collaboration and communication features, Web 2.0 environments are a source of valuable data for usability researchers.
- 290 -

The mapping of user needs onto Web 2.0 usability heuristics showed that the heuristics partially cover virtual world user needs. The analysis of user comments from popular virtual worlds’ forums enables us to formulate additional heuristics. The full set will support the heuristic evaluation of the first beta version of VirtualLife platform.
The developed set contains 10 groups of aspects with their operationalizations. The forthcoming evaluations will provide a further material for the improvement of heuristics.
References [1] Bogdanov, D., Crispino, M. V., Čyras, V., Glass, K., Lapin, K., Panebarco, M., Todesco, G. M., Zuliani F.
VirtualLife Virtual World Platform: Peer-to-Peer, Security and Rule of Law. eBook Proceedings of 2009 NEM Summit “Towards Future Media Internet”, Saint-Malo, France, 28-30 September, Eurescom GmbH, 2009, 124-129.
[2] Bradner, E., Kellogg, W.A., Erickson, T. The Adoption and Use of Babble: A Field Study of Chat in the Workplace. The Proceedings of the European Computer Supported Cooperative Work (ECSCW '99) conference. http://www.research.ibm.com/SocialComputing/Papers/AdoptionOfBabble.htm
[3] Čyras, V., Lapin, K. User needs and legally ruled collaboration in the VirtualLife virtual world platform. The International Symposium on Methods of Artificial Intelligence AI-METH 2009, 18-19 November 2009, Gliwice, Poland.
[4] Dourish, P., Bly, S. Portholes: supporting awareness in a distributed work group. Proceedings of the SIGCHI Conference on Human Factors in Computing Systems (Monterey, California, United States, May 03 - 07, 1992). P. Bauersfeld, J. Bennett, and G. Lynch, Eds. CHI '92. 1992, ACM, New York, NY, 541-547. DOI= http://doi.acm.org/10.1145/142750.142982
[5] Fitzpatrick, G., Parsowith, S., Segall, B., Kaplan, S. Tickertape: awareness in a single line. In CHI 98 Conference Summary on Human Factors in Computing Systems. CHI '98. 1998, ACM, New York, NY, 281-282. DOI= http://doi.acm.org/10.1145/286498.286760
[6] Geumacs, Virtual Life D2.1: End User Definition and Needs, Public VirtualLife deliverable, 2008. http://www.ict-virtuallife.eu/public/VirtualLife_D2.1_EndUserDefinitionAndNeeds.pdf
[7] Eastgate, R. The structured development of virtual environments: Enhancing functionality and interactivity. Doctoral dissertation, University of Nottingham. 2001. http://www.virart.nottingham.ac.uk/RMEPhD2001.pdf
[8] Knudtzon, K. Social and Cultural Theories, 2002
http://www.cs.umd.edu/class/fall2002/cmsc838s/tichi/social.html
[9] Nielsen, J., Molich, R. Heuristic evaluation of user interfaces. Proceedings of the SIGCHI Conference on Human Factors in Computing Systems: Empowering People. J. C. Chew and J. Whiteside, Eds. CHI '90. 1990, ACM, New York, NY, 249-256. DOI= http://doi.acm.org/10.1145/97243.97281
[10] Nielsen, J. Usability Inspection Methods. CHI'94, Boston, Massachusetts, USA, April 24-28, 1994, 413-414.
[11] Preece, J., Rogers, Y., Sharp, H.. Designing for collaboration and communication. Interaction Design beyond human-computer interaction, John Wiley & Sons, Inc. 2002, 105-128.
[12] Preece, J. , Maloney-Krichmar, D. Online Communities: Sociability and Usability. The Human – Computer Interaction Handbook: Fundamentals, Evolving Technologies and Emerging Applications, Lawrence Erlbaum Associates, 2003, 597-616.
[13] Schröder, H.. Virtual Community Design Guidelines. 2002
http://skrolle.xyzzy.se/mastersthesis/Virtual_Community_Design_Guidelines.html
[14] Sutcliffe, A., Gault, B. Heuristic evaluation of virtual reality applications. Interacting with Computers, Human Computer Interaction in Latin America, 2004, volume 16, issue 4, 831-849, ISSN 0953-5438, DOI: 10.1016/j.intcom.2004.05.001. http://www.sciencedirect.com/science/article/B6V0D-4CNJDN6-1/2/ae64afa0d2db3e1063f7d9cb22d8e321
[15] Stanney, K. M., Cohn, J. V. Virtual Environments. The Human – Computer Interaction Handbook: Fundamentals, Evolving Technologies and Emerging Applications, Lawrence Erlbaum Associates, 2003, Second edition, 621-638.
[16] University of Minnesota's Collaborative Wiki, Design Guidelines, 2008
https://wiki.umn.edu/view/IDSC4490/DesignGuidelines
[17] Villanueva, R., Moore, A., Wong, B.L.W. Usability evaluation of non-immersive, desktop, photo-realistic virtual environments. Proceeding of 16th Annual Colloquium of the Spatial Information Research, Centre University of Otago, Dunedin, New Zealand, 2004. http://www.business.otago.ac.nz/SIRC05/conferences/2004/28_Villanueva.pdf
[18] Whittaker, S., Isaacs, E., O'Day, V. Widening the Net: Workshop Report on the Theory and Practice of Physical and Network Communities, 1997 http://www.sigchi.org/bulletin/1997.3/whittaker.html
[19] Williams, S. D. Usability in 3-D Virtual Worlds. STC UUX Community Newsletter, Usability Interface. January 2008, Vol 13, No. 2. http://www.stcsig.org/usability/newsletter/0801-Fun.htm
- 291 -

REAL-TIME TRAFFIC INFORMATION MANAGEMENT MODEL
Adrian Zafiu 1,2, Angela Ionita1, Valueriu Ionescu2 1Romanian Academy, Research Institute for Artificial Intelligence, Calea 13 Septembrie Nr. 13
sector 5, Bucuresti 050711, Romania, [email protected], [email protected] 2 University of Pitesti, Street Targu din Vale, No. 1, 110040 Pitesti, Arges, Romania,
[email protected], [email protected]
Abstract. This paper presents a model for real time traffic information update. The tasks of the traffic management system for an urban area are the management of slow evolving information layer (with two sub-layers: the area map and the traffic rules) and the management of fast evolving information layer (the real–time traffic data). The proposed model presents an algorithm for real-time integration of the data received from the monitoring system into the fast evolving layer. The data integration is performed in such a manner that the result can be directly used by the drivers in the correction of the navigation data, according to their needs and the vehicle characteristics. The integration of the traffic evolution has the purpose to avoid traffic congestion and traffic disturbances.
Keywords: traffic data management, algorithm, prediction, realtime.
1 Introduction The integration of GPS navigation data with other communication systems is an idea that has roots in
the early 90s, when digital mobile communication was still at the beginning [1].
Usually a GPS navigation system uses as feedback to its algorithm the position of the car. This can, sometimes, generate errors (because of natural and artificial interference sources) especially in crossroads. That is why other systems were developed, such as AGPS (Assisted Global Positioning System).and DGPS (Differential Global Positioning System) for civilian or military use. [2]. However, the basis for GPS navigation is the system seen in the following figure.
Figure 1. Classic GPS navigation system uses static data
A new trend in the domain shows that the sales of simple GPS navigation devices is slowing down in favor of OS based devices such as Symbian and Windows Mobile, therefore more mobile navigation systems will have multiple wireless connections available: 802.11b/g, Bluetooth, 3G, etc (mobile phones, PDA, SmartPhones,etc.) compared to simple GPS devices [3, 4].
The previous system can be improved by extending the information feedback loop. This idea is not new [5] however the algorithm and implementation method proposed in this paper represent a new approach, based on the rapid spread of OS based mobile devices. In this case the representation of the system is more complex because the new system uses in addition to static GPS data, new dynamic data obtained through wireless data transfers to/from a web service. The new data is computed by the algorithm proposed in this paper.
Figure 2. The proposed system uses the proposed algorithm to compute traffic information updates
Wireless communication
GPS reception
Path computing algorithm
GPS
position, speed, location
Web service + Algorithm
GPS location + requests
Traffic data Traffic history information (dynamic)
Updates; Requests
SI
Path computing algorithm
GPS
position, speed direction
SI
Static information (map, speed limits, etc)
- 292 -

This paper presents a model for real time traffic information [6, 7] update that allows the integration of GPS navigation with wireless systems in order to improve path determination. The proposed algorithm is part of the presented system [8, 9] that allows:
1. Choosing the prediction pattern [10] based on traffic shape similarity on a certain street with previously stored traffic shapes.
2. Vocal driver guidance witch eliminates the disadvantages of consulting a graphical map. 3. To eliminate the necessity of map updates because the communication allows the transfer a route
without map correlation. 4. The elimination of transmission costs [11] though the use of wireless connectivity methods for data
transfers (such as 802.11b wireless access) 5. Dynamic re-routing in wireless internet coverage areas that takes into consideration the most recent
traffic information. Due to the actual traffic information [12], it is possible for the system to choose a different and better route from the one determined initially.
6. All the rules settled by the authority for traffic regulation are taken into account because this information is included in the map once at their design. Even though there is a gap between the implementation of some traffic rules and their record in the map, the correlation between map and traffic information makes these new regulations visible. For example, if a one-way sign was installed, with time, the speed of road segments in the opposite direction of the one-way sign becomes zero and implicitly the routing on that segment will be avoided in the incorrect direction.
7. The routing demand includes also certain characteristics of the vehicle: weight, dimensions, preferred speeds etc. All the data correlates with the routing algorithm and help to avoid the situations in which the auto vehicle is driven to road segments where traffic it is not allowed due to local traffic rules.
8. The solution can be used also for the implementation of an automatic system in order to follow stolen cars. A GPRS communication system attached to the device can activate when the car is moving and if this function hasn’t been deactivated.
2 The proposed algorithm
The information received from the device present on the car in formed from a sequence of packets ,1P
2P , … nP . A packet ),( CTPi contains the moment T of the data collection and the coordinates ),( yxC of
the device at that moment.
• T - Date and time
• ),( yxC - Coordinates
The packet sequences are designed on the street network. For each street segment (a street segment is a part of the road delimited by two intersections that does not cross other roads) is determined the average crossing time. The segment ends A and B are the intersections with other roads.
For the segment below, the car locations determined by GPS are: 721 ,...,, PPP .
Figure3. Data sequence read from the device
The road has a length AB . In order to compute the average of the car’s behavior on the )(AB
segment, we consider only the extreme points: 1P and 7P . The average speed in which the segment )( 17PP
was crossed is:
17
71
TT
PPVAB
−= (1)
- 293 -

The time necessary to cross the segment )(AB is:
ABV
ABT =
(2)
The collected information from multiple cars is integrated as average on a time interval that we will call henceforth time window. If there is data collected from n cars in a window of time, we can compute the
average speed of segment crossing )(AB :
∑=
=n
i
iABAB V
nV
1
1
(3)
The time window T∆ is experimentally determined. The numbers that are envisaged are 1, 2, 3, 4, 5, 6, 12, 15, 20 or 30 minutes.
The proposed prediction takes into account the traffic evolution in the analyzed time period and the correlation with the evolution history. First, it is important the speed tendency on the considered road segment. If there is not enough information, the speed is considered constant. If there are at least two information items from two time windows in the current day we can decide to find the tendency of speed evolution by computing the average acceleration based on the average speeds of the last two time windows.
In the table below there is presented information collected from three cars in the time window 1T∆
between 13:10 and 13:20 for the considered road segment.
Table 1. Cars
Point
Car 1 Car 2 Car 3
Collected 101s Collected 210s Collected 290s
Time Position Time Position Time Position
1 4s 20m 7s 20m 1s 20m
2 9s 88m 12s 111m 9s 45m
3 11s 124m 13s 142m 18s 131m
4 18s 174m 13s 191m 22s 153m
5 22s 184m 21s 226m 40s 282m
6 25s 190m 38s 333m
7 28s 195m
Speed 7.29m/s 10.09m/s 6.71m/s
Avg.spd 8.035m/s
In the table below there is presented information collected from three cars in the time window 2T∆
between 13:20 and 13:30 for the considered road segment.
Table 2. Text formatting instructions
Point
Car 1 Car 2 Car 3
Collected 101s Collected 210s Collected 290s
Time Position Time Position Time Position
1 0s 20m 4s 20m 3s 20m
2 8s 60m 5s 25m 4s 91m
3 12s 137m 15s 192m 7s 154m
4 18s 176m 19s 208m 12s 207m
5 27s 276m 24s 252m 14s 232m
6 32s 371m 23s 310m
7 31s 356m
Speed 10.96m/s 11.60m/s 12.00m/s
Avg.spd 10.31m/s
- 294 -

The speed variation is:
T
VV TAB
TABT
T∆
−=
∆∆
∆∆
12
2
1α
(4)
For the considered case the acceleration is: 23 /1079.3 sma −×−=
Based on the determined data and in the absence of other information, we can predict that the average
speed in the time window 3T∆ will be:
TVV T
ABT
AB ∆+= ∆∆ α23
(5)
The predicted speed in the considered example is smV TAB /58.123 =∆ . If the computed speed exceeds
the legal limit or is less then zero then the computed value is limited above and below. The speed can be
predicted, by respecting the same rule, for the next time window: smTVV TAB
TAB /86.14224 =∆+= ∆∆ α . If the
limit on the considered road is: smhkm /88.13/50 = , then we will consider that: smV TAB /88.134 =∆ .
The information collected in one day is stored in order to be correlated with the information from the following day.
One of the problems raised by the information correlation from one day to another is given by the traffic difference for different days of the week. For example from Monday to Thursday the behavior should be similar each day. In the last working day of the week the preparations for the arrival of the week-end affect the traffic leading to its increase. In non working days the traffic is reduced, however, in the last day of the week-end the traffic rises again with the people’s arrival from out-of-town locations. Starting from the previous considerations, it is necessary to consider not only the traffic evolution in the previous day, but also its evolution in the corresponding days from previous weeks.
It would seem obvious to consider only the information from corresponding days of the previous week. It is necessary however to also analyze the recent changes in the road network. These changes can include: traffic deviations, road condition deterioration (due to snow, rain, etc.), changes that affect the whole traffic status.
The traffic history information must include only the traffic fluency, not its magnitude, for example: “in time window 10:10-10:20 traffic speed is less then in time window 10:00-10:10, with deceleration speed a ”.
In order to compute the acceleration for day D, 4 days are taken into account:
• the precedent day where the acceleration in the considered time window is 1a ;
• one, two or three D days from traffic history for the precedent weeks (accelerations 2a , 3a , 4a )
The acceleration for the next time window is determined as a weighted average of 5 acceleration values
( 0a - the acceleration from the current day, 1a , 2a , 3a and 4a ). The used acceleration value is:
4433221100 apapapapapa ++++= (5).
In order to establish values for the weights that will lead to a proper value for a we will take into account the following:
• The most powerful influence comes form the current day (0a )
• If the speed iv from the day that had acceleration ia is very close to the speed 0v computed today,
then ia weight must increase.
• If the speed iv from the day when acceleration was ia differs greatly from 0v computed today, then
ia weight must decrease.
We consider a fuzzy implementation for the algorithm that determines the weights ip . Therefore:
- 295 -
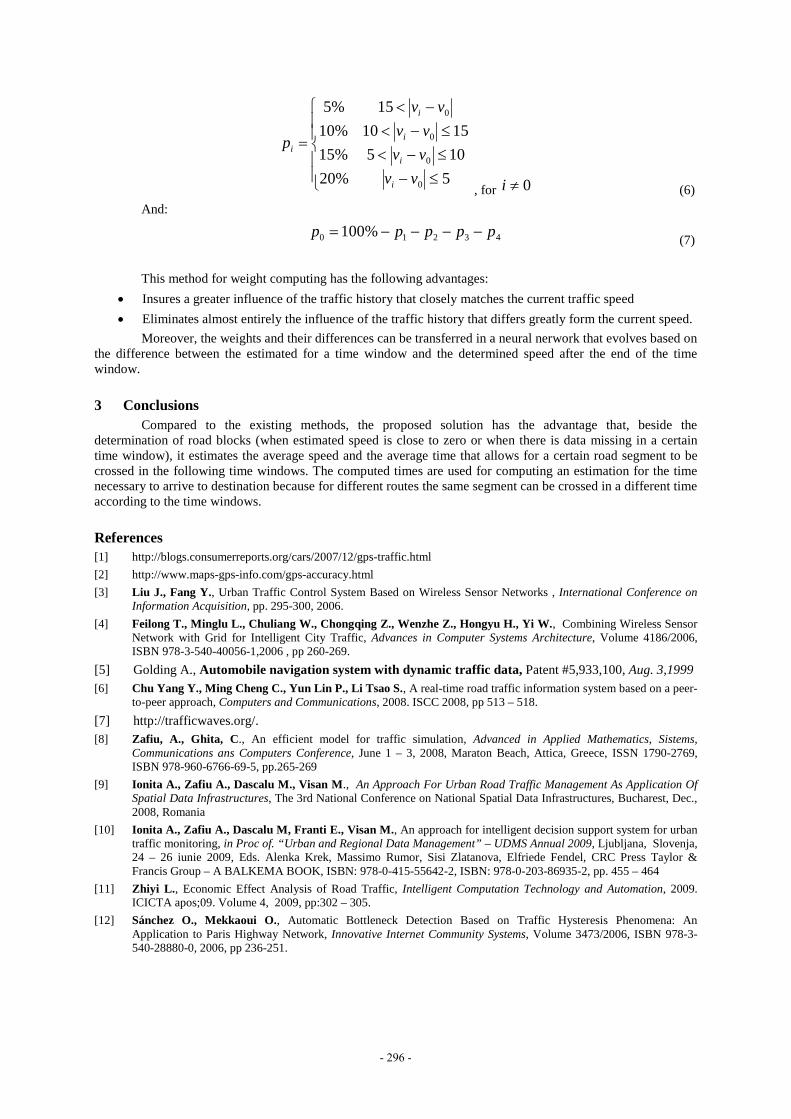
≤−
≤−<
≤−<
−<
=
5%20
105%15
1510%10
15%5
0
0
0
0
vv
vv
vv
vv
p
i
i
i
i
i
, for 0≠i (6)
And:
43210 %100 ppppp −−−−= (7)
This method for weight computing has the following advantages:
• Insures a greater influence of the traffic history that closely matches the current traffic speed
• Eliminates almost entirely the influence of the traffic history that differs greatly form the current speed.
Moreover, the weights and their differences can be transferred in a neural nerwork that evolves based on the difference between the estimated for a time window and the determined speed after the end of the time window.
3 Conclusions Compared to the existing methods, the proposed solution has the advantage that, beside the
determination of road blocks (when estimated speed is close to zero or when there is data missing in a certain time window), it estimates the average speed and the average time that allows for a certain road segment to be crossed in the following time windows. The computed times are used for computing an estimation for the time necessary to arrive to destination because for different routes the same segment can be crossed in a different time according to the time windows.
References [1] http://blogs.consumerreports.org/cars/2007/12/gps-traffic.html
[2] http://www.maps-gps-info.com/gps-accuracy.html
[3] Liu J., Fang Y., Urban Traffic Control System Based on Wireless Sensor Networks , International Conference on Information Acquisition, pp. 295-300, 2006.
[4] Feilong T., Minglu L., Chuliang W., Chongqing Z., Wenzhe Z., Hongyu H., Yi W., Combining Wireless Sensor Network with Grid for Intelligent City Traffic, Advances in Computer Systems Architecture, Volume 4186/2006, ISBN 978-3-540-40056-1,2006 , pp 260-269.
[5] Golding A., Automobile navigation system with dynamic traffic data, Patent #5,933,100, Aug. 3,1999 [6] Chu Yang Y., Ming Cheng C., Yun Lin P., Li Tsao S., A real-time road traffic information system based on a peer-
to-peer approach, Computers and Communications, 2008. ISCC 2008, pp 513 – 518.
[7] http://trafficwaves.org/. [8] Zafiu, A., Ghita, C., An efficient model for traffic simulation, Advanced in Applied Mathematics, Sistems,
Communications ans Computers Conference, June 1 – 3, 2008, Maraton Beach, Attica, Greece, ISSN 1790-2769, ISBN 978-960-6766-69-5, pp.265-269
[9] Ionita A., Zafiu A., Dascalu M., Visan M., An Approach For Urban Road Traffic Management As Application Of Spatial Data Infrastructures, The 3rd National Conference on National Spatial Data Infrastructures, Bucharest, Dec., 2008, Romania
[10] Ionita A., Zafiu A., Dascalu M, Franti E., Visan M., An approach for intelligent decision support system for urban traffic monitoring, in Proc of. “Urban and Regional Data Management” – UDMS Annual 2009, Ljubljana, Slovenja, 24 – 26 iunie 2009, Eds. Alenka Krek, Massimo Rumor, Sisi Zlatanova, Elfriede Fendel, CRC Press Taylor & Francis Group – A BALKEMA BOOK, ISBN: 978-0-415-55642-2, ISBN: 978-0-203-86935-2, pp. 455 – 464
[11] Zhiyi L. , Economic Effect Analysis of Road Traffic, Intelligent Computation Technology and Automation, 2009. ICICTA apos;09. Volume 4, 2009, pp:302 – 305.
[12] Sánchez O., Mekkaoui O., Automatic Bottleneck Detection Based on Traffic Hysteresis Phenomena: An Application to Paris Highway Network, Innovative Internet Community Systems, Volume 3473/2006, ISBN 978-3-540-28880-0, 2006, pp 236-251.
- 296 -

THE RULES AND EXCEPTIONS FOR SELECTING BOUNDING VOLUME
Antanas Lenkevicius, Jurate Platuziene
Kaunas University of Technology, Department of Multimedia Engineering, Studentu st.50, LT-51368, Kaunas, Lithuania, [email protected], [email protected]
Abstract. We use bounding volume to accelerate collision detection. Frequently we need to choose one of these – complex realization, but high precision, or easy realization, but less of accuracy. System developer should evaluate what is more important – time or resource input. We will provide the rules and exceptions how to choose one of two bounding volumes in this article. Sphere has a simple realization, but a serious irregularity. AABB bounding volume more difficult is realized, but more versatile. We made the research, which one of two is better to choose in different situation. It is presumed, that collision detection is more accurate, when unspecified area between original object and bounding volume is minimum.
Keywords: bounding volume, collision detection.
1 Introduction Bounding volume is used to simplify and accelerate collision detection process [2],[5],[6],[8],[13].
Description and updates of original object substantially prolong the process, so at the early stages there is no need to use them. The purpose of the bounding volume is to cover original object so, that undefined area under it was minimum. In this case it is high probability to determine if original object when the bounding volumes did it. To cover the original object means to replace complex object with the primitive, simpler geometric shape, what is simpler to realize. In this paper we will submit the rule and exceptions for choosing bounding volume, one of two – sphere [7],[11] or AABB [1],[9],[12].
2 The survey of the bounding volumes The selection of the bounding volume influences a lot of criteria – geometric shape, environment,
required precision of the results, speed and others. The simplest bounding volume to realize is the sphere (Figure 1, a). Realization of the sphere requires minimum of data, time and computer resource. However, this bounding volume rarely gives accurate results. AABB bounding volume is along the coordinate axis aligned parallelepiped rectangular(Figure 1, b). However it is not always the original object border is parallel to the axes. Better to rotate it parallel to the object’s axis, to reduce undefined area among original object and bounding volume. Orientation along the object's direction is used in OBB (Figure 1, c) bounding volume [7]. Sometimes original object is not similar to rectangular parallelepiped, even if it is aligned along the axis of it. That is why it makes a lot of undefined area. In that case we can use k-DOP [4] to reduce undefined area. Object is covered by planes. The number of the planes defines index k (6-DOP, 14-DOP, 18-DOP, 26-DOP (Figure 1, d)) [3],[4]. Such a bounding volume provides accurate results at the first stages of the collision detection process, but implementation of it requires a lot of computer resources and professionalism of the developer.
a) b) c) d)
Figure 1. Bounding volumes. a – sphere, b – AABB, c – OBB, d - 26-DOP(k-dop)
3 Comparison of the sphere and AABB Sphere and AABB bounding volumes are selected in order to make the primary investigation with
minimum time and computer resource in static space wether objects collide or not. Objects in a space may be different shapes. If the object is similar to the sphere, or covering gives sufficiently accurate results, it is always better to use this bounding volume, because of its minimum realization costs. More complex objects are covered by AABB bounding volume. In order to choose one of two bounding volumes in a process of collision detection, first we should make an analysis.
- 297 -

Every object may be covered by these bounding volumes, however depending on its shape, selection may affect the analysis time, accuracy, survey quality. As we already mentioned, the fastest result may be achieved by covering object by sphere. However very often, its use is limited because of objects shape. In Figure 2, we see when it is useful to choose sphere or AABB:
Figure 2. Different three-dimensional objects – apple and screw may be covered by AABB and sphere
The shape of apple is more similar to sphere. Covering it by sphere we reduce undefined area more than if we did it with the AABB. Detecting, the sphere collision with another bounding volume, it is high probability that original objects are colliding too. On the other hand, if sphere covers screw, where are a lot of undefined space. In collision detection process, if such sphere collide with other bounding volume, probability, that collide original object – screw, is low enough. According to similar model, if we covering apple with the AABB, we have more undefined space then we did with sphere. Screw is more effective to cover by AABB.
We resume, although sphere is simpler realized, AABB is more universal and adaptive. We use its benefit to OCT[10] or BSP[10] methods, where object groups may be covered at once.
4 The rules and exceptions for selecting bounding volume
4.1 Exceptions An exception of the rule is when covering by the rule does not lead to optimal results. As we mentioned
above, every object may be covered by sphere and AABB as well. But depending on selecting we may get different results regarding speed, accuracy and computer resource. Overall exceptions can be observed in a single consistent pattern - similarity to the original standard shape - cube, sphere, etc. Below we will see that even the exceptions can be adapted to the restrictions. They do not influence a lot, although evaluating of these restrictions make final result more accurate. First exception is the cube or cube-like object. Projection to the x, y, z axis of the cube are equal. However, covering cube by the sphere remains much more undefined areas, comparing to AABB.
An other exception is the tetrahedron. All the projections of tetrahedron are equal. However, covering by AABB, their background superposed, remains much less undefined areas than covered by a sphere.
The cube is used to be an exception when the shape containing the original object is always covere by AABB bounding volume. However, even exceptions may have rules, evaluating of which make results more accurate.
4.2 The cube – shaped with rounded corners These cases fall under the exceptions to which the general rule is invalid. However, this exception
applies to a certain level of rounded corners.
We need to identify what may be the maximum rounding of cube corners while using AABB is more suitable. As all the projections of the cube are equal, an analysis may be performed in two-dimensional area and cube transformed into a square. A square with rounded corners surround by circle and square (Figure 3).
Figure 3. Square with rounded corners. Covering by circle and other square
Cover circle so that rounded corners of the objects touch the circle, and the square so that the sides of the original shape touch bounding volume sides. Covering the square shape is more suitable when the area as shown in Figure 3 b is less than the area a. When the area b is bigger than the area a, it is better to cover with a circle. When these two areas are equal, covering both the square and a circle of undefined area will be the same. In this case, a circle is more acceptable (sphere in three dimensional space), because of its simpler realization.
- 298 -

When the circle adjunce square corners, it is a circle with a radius of maximum value, and the original object is square. Reducing the radius of the circle, we get a new shape - square with rounded corners. Research is made by reducing the radius of circle, calculating undefined area a and b, capturing the rounded corners of the border.
Unspecified area is the difference between bounding volume and covered object. Undefined area in percent is the ratio of undefined and whole area under bounding volume, multiplied by 100 percent.
The part of the Square border, rounded with corners is a doubled part 1 (as the border of these two parts) devided to the total edge length, multiplied by 100 percent.
Basing on calculations when the rounded part is more than 47 percent, it is more suitable to cover by circle.
4.3 Cube, rotated about its center Rectangular parallelepiped, aligned coordinate axis, preferably to cover by AABB bounding volume.
However, turning the original object around any axis (or around the axis), from a certain angle is useful to put on the sphere.
We must find a maximum angle, made by rotating rectangular parallelepiped and the axes, while covering object by AABB is more suitable.
Covering a rectangular parallelepiped by Sphere, whatever angle up to coordinate axes made with original object, undefined area is constant. This simplifies the analysis. However, the undefine area of space is big enough. In order to reduce unefine area of space there are cases when covering by AABB is better. Such cases will be determined in this paper. Initially, let us examine a rectangular parallelepiped – Cube.
The research carried out in a 2D space. Square rotated around the coordinate system and covered by the circle and square. If object covered by circle, undefined area is constant. This is useful, because this area does not depend on objects' rotation. The research made only covering by square.
When we rotate square shape about its center, the edges length of the bounding volume (square), changes too. Undefined area is calculated as the difference between the bounding volume and area of covered shape.
Figure 4. The square rotated around its center
Rotating the square around its center (the intersection between the diagonal of square) vary the angle between square background and x axis b. At the same time bounding volume and undefined area vary as well. The angle between background and the x axis is critical, when the area of undefined space under circle and square are equal. Increasing this angle b, increases undefined area under the bounding volume – square. We defined when the angle b is 17.370 the area under both bounding volumes are equal. Increasing b till 450, undefined area under square is bigger. That is why more useful to put on a circle. How the unspecified area changes by rotating original object about its center from 0 to 90 degrees, we see in Figure 5:
Figure 5. Relation of undefined area and the angel between a axis and the background of the square
- 299 -

4.4 Rectangular, rotated about its center If the original object is a rectangle, an undefined area under the circle is much higher. Let us analyze
rectangle with a length greater than the width. As the maximum undefined area covering the square is the area where the original object (square) is rotated in 45 degrees, we assume that it is the maximum undefined area under the bounding rectangle. By changing the length of one edge of the rectangle according the other border, we analyzed what is the maximum ratio between them, when rotating at any angle is always better to be cover by rectangle. When the ratio of the rectangle edges is 1, that is square. When the ratio increases, length of the projections to x, y axis differ. Such a figure is no useful to cover by circle because of great undefined space under it. We made the research and the results show that the maximum ratio between the edges is 27 percent and less, when it is useful to cover by circle. When this ratio increases, it is always better to cover by rectangle, no matter what is the angle between the background of original object and the axis. With reference to these results, later we will determine the basic rule for selecting the bounding volume in a process of collision detection.
4.5 The circle with the mortise All the round geometric 3D objects are covered by sphere. As well as round objects with a mortise. We
will present an analysis of what may be the maximum angle of mortise, that the round object useful to cover with sphere (in 3D) or circle (in 2D).
Figure 6. The circle with the mortise and section
We have a circle with radius R and mortise with a central angle a. When the angle a increases, the area of mortise increases too. When the angle a is less than 1130 it is better to cover such object by circle. Otherwise, when a is bigger 1130 we will have less undefined area covering shape by rectangle. This rule applies to the objects, with mortise symmetrical to one of the axis.
4.6 The circle with the section This is the case, when one exception is contrary to the other. On one point the circle touches the
bounding circle. On the other hand the part of the section touches the bounding rectangle edge too. We have calculated, what should be part of the circle section (Figure 6), that original object better to be covered by rectangle (in three-dimensional space sphere with the section to be covered by AABB). When the angle a, between two radius R, connecting a circle (or sphere) edges of the section, is less than 1120, it is better to cover such object by circle (sphere in 3D). The rule applies only when the section plane is parallel to any of coordinate axis.
4.7 The rule of selecting one of two bounding volume If the original object's projections to the x, y, z axis are equal with a certain tolerance, the object are
surrounded by the sphere. It is necessary to calculate the condition:
Ax/Ay=Ax/Az=Ay/Az …(1) Where Ax, Ay, Az - lengths of the projections to the axis, calculated as the difference between maximum
and minimum values. For example, Ax=Ax_max-Ax_min
Calculations of the tolerance of the object projection ration has been analyzed in the section 4.4. We
assume, that an object, whith the ratio of projection length is less then 27 percent, is better to cover it by sphere. If this ratio is more then 27 percent, it is better to cover by AABB. This rule is applied to prominent polygon. Let’s verify it in two-dimensional space, covering the ellipse. When the semi-axes of ellipse are equal - it is a
- 300 -

circle. Increasing the length of one ellipse semi-axis, according to other in 2 percent,we calculated undefine area between the ellipse and the bounding volume - circle and rectangular. The results are shown in Figure 7:
Figure 7. Relation between unspecified area and the ratio of the object projections
Elipse selected for analysis because it is the figure for calculating the maximum projection value ratio, which may still be put on a circle. When analyzing the three-dimensional space, the projection ratio lays under the same rule to any two of the three projections of the object.
5 Conclusions Usage of bounding volume of simplify the initial recognition of the collision detection process. When
the environment consisting of a uniform object, we can select optimum bounding volume initially. It is not optimum decision to surround object by the same bounding volumes if the environment is mixed. It is better if we may select one of few bounding volumes. We presented the rule and exceptions for selecting bounding volume one of two. We determined the ratio of original object projections length tolerance. It is critical value, according to which, the selection of bounding volume may be different.
We focused on determining the exceptions. There are the original object shape and positions, when the applying the rule do not give optimum results. The rule applies to prominent polygon. When the undefined area is reducing, we assume that the possibility of the faster and more accurate results is higher. Probability based only on the geometry of the objects, with no evaluating of other patterns (statistical, physical, chemical or other events).
References [1] Ahumada Gast´on Jorquera. Detecci´on de Colisiones en Tiempo Real. Universidad de Chile, Facultad de
Ciencias F´ısicas y Matem´aticas, Taller de Computaci´on Gr´afica. 2008. [2] Bade A., Suaib N., Zin A.M . New bounding volume approach for detecting collision in computer
animation. Malaysian Journal of Computer Science. 2006, volume 19(2). [3] Bartz D., James T. Klosowski, Staneker D. Tighter Bounding Volumes for Better Occlusion Culling Performance.
Visual Computing for Medicine, University of T¨ubingen, Germany, IBM, T.J. Watson Research Center, Hawthorne, NY, USA. 2005.
[4] Fünfzig Christoph, Fellner Dieter W, Easy Realignment of k-DOP Bounding Volumes. 2003. [5] Jiménez P., Thomas F., Torras C. 3D collision detection: a survey. Institut de Robòtica i Informàtica Industrial
(CSIC-UPC). 2001.
[6] Jiménez P., Thomas F., Torras C. 3D collision detection: a survey. Institut de Robòtica i Informàtica Industrial, Computer and Graphics. 2001, volume .25(2), 269-285.
[7] Jung-Woo Chang, Wenping Wang and Myung-Soo Kim. Efficient collision detection using a dual OBB-sphere bounding volume hierarchy, 2009.
[8] Ming C.Lin , Fast proximity queries for interactive walkthrougs. University of North Carolina at Chapel Hillm. 2000.
[9] Okada Kei, Inaba Masayuki, Inoue Hirochika. Real-time and Precise Self Collision Detection System for Humanoid Robots, International Conference on Robotics And Automation Barcelona. 2005.
[10] Pinzón Alexander Fernández, Sistema De Simulación De Colisiones Deformables Con Interacción Mediante Dispositivos Hapticos En Ambientes De Realidad Aumentada: Estado Del Arte. Universidad nacional de colombia, maestría en ingeniería de sistemas y computación. 2007.
[11] Shankar Krishnan, Amol Pattekar, Ming C. Lin , Manocha Dinesh. Spherical Shell: A Higher Order Bounding Volume for Fast Proximity Queries. 2007.
[12] Xinyu Zhang, Kim, Y.J . Interactive Collision Detection for Deformable Models Using Streaming AABBs. Visualization and Computer Graphics. 2007.
[13] Yiyu Cai, Zhaowei Fan, Huagen Wan, Shuming Gao, Baifang Lu, Kian Teck Lim. Hardware-accelerated collision detection for 3D virtual reality gaming. Simulation & Gaming. 2006, volume 37.
- 301 -

ACCELERATED ANALYSIS OF QUAD-TREES IN THE EZW ALGORITHM
Deividas Kancelkis, Jonas Valantinas
Kaunas University of Technology, Department of Applied Mathematics, Studentu St 50-325c, LT-51368 Kaunas, Lithuania, e-mail, [email protected], [email protected]
Abstract. In this paper, a novel scheme for the analysis of quad-trees in the discrete wavelet spectrum of a digital image is proposed. The scheme can be successfully applied to any zero-tree based image encoder, such as the embedded zero-tree wavelet (EZW) algorithm of Shapiro and set partitioning in hierarchical trees (SPIHT) by Said and Pearlman. Exceptionally high performance of the proposed quad-tree analysis scheme, in the sense of image encoding times, is demonstrated using the EZW algorithm and the discrete Le Gall wavelet transform.
Keywords: discrete wavelets, wavelet transforms, quad-trees, zero-tree based image coding.
1 Introduction Nowadays most modern digital image compression techniques employ a discrete wavelet transform,
usually followed by quantization and entropy coding, [1-3]. Especially useful are image coders that allow progressive encoding with an embedded bit stream, such as the embedded zero-tree wavelet (EZW) image coder, suggested by Shapiro, [4]. With embedded bit streams, the wavelet coefficients are encoded in bit planes, with the most significant bit planes being transmitted first. In that way, the decoder can stop decoding at any point in the bit stream, and it will reconstruct an image with required level of accuracy.
There have been many variants of zero-tree-based progressive image coders since Shapiro introduced his algorithm in 1993. The SPIHT (Set Partitioning in Hierarchical Trees) algorithm, proposed by Said and Pearlman, shows excellent results in this class of coders, [5]. Some other interesting ideas and developments in the area are presented in [6-11].
Bit plane encoding is more efficient if one reorders the wavelet coefficient data in such a way that coefficients with small absolute values tend to get clustered together, increasing the lengths of the zero run in the bit planes. Data structures such as significance quad-trees (zero-trees) are very efficient in achieving such clustering of zeros. They are used in EZW, SPIHT, and other wavelet-based image coders.
Though there is a number of wavelet-based image coding schemes available, the need for improved performance and wide commercial usage demand newer and better techniques to be developed.
In this paper, we propose an original idea (scheme) for accelerated analysis of quad-trees in the discrete wavelet spectrum of the image under compression. The proposed scheme, being applied to EZW encoder, impressively improves image encoding times ((45 55)%− , for lossless compression, and (40 90)%− , for lossy
compression; Section 3.2) and, naturally, the overall performance of the encoder.
2 The embedded zero-tree wavelet (EZW) algorithm The embedded zero-tree wavelet algorithm (EZW) is one of the most efficient coding schemes, which
are developed for wavelets. The EZW transmits the large (significant) wavelet coefficients before transmitting the smaller coefficients. This is done by realizing multiple passes (iterations, scanning) over the discrete wavelet spectrum of the image, lowering the threshold by a factor of two each time, [4].
On each iteration the EZW codec refines the value of each coefficient determined to be significant during previous passes and then searches through the coefficients previously considered to be insignificant. A wavelet coefficient is said to be insignificant with respect to a given threshold T if it is less (by absolute value) than T . The zero-tree is based on the hypothesis that if a particular wavelet coefficient (the parent) at a high scale is insignificant with respect to a given threshold T , then all wavelet coefficients (the descendants) of the same orientation in the same spatial location at lower scales are probably to be insignificant with respect to T (Figure 1, a). If this is true, we say that this coefficient is the root of the zero-tree, [4].
Below, we briefly present both the encoding and decoding phases of the current EZW algorithm, [4, 6]. Let RL (Refinement list) be the list of wavelet coefficients which have been previously found to be significant and let IL (Index list) be the list of indices of all wavelet coefficients which have not yet been found to be significant, ordered so that parents are listed before their children (say, in accordance with Morton’s trajectory; Figure 1, b).
- 302 -

High scale
Low scale
Low scale
High scale
(a) (b)
Figure 1. Wavelet coefficients are coded in a zero-tree structure and scanned in a left-to-right order: (a) zero-tree data structure (each parent has four children); (b) Morton’s scanning (the trajectory
is such that ancestors are always traversed before descendants)
The image encoding phase is as follows.
1. Compute max 2 1 2log max{| ( , ) |}r r Y k k= = , where 1 2( , )Y k k is the 1 2( , )k k -th wavelet coefficient
of the digital image 1 2[ ( , )]X m m under processing; 1 2 1 2, , , {0,1, , 1}k k m m N∈ −K , 2nN = ,
N.n∈ Set RL = ∅ .
2. For each 1 2( , )Y k k RL∈ , output the r -th most significant bit of 1 2( , )Y k k .
3. Set the list IL to contain indices of all the wavelet coefficients, except of those in RL, ordered so that parents are listed before their children. For each index 1 2( , )k k IL∈ , do: if
1 2( , ) ( 2 )rr rY k k T T≥ = then output poz and add 1 2( , )Y k k to RL, else if 1 2( , ) rY k k T≤ − then
output neg and add 1 2( , )Y k k to RL, else if no descendant (not contained in RL) of 1 2( , )Y k k is
significant with respect to rT then output zrt and remove all the indices, corresponding to the
descendants of 1 2( , )Y k k , from IL, else output iz .
4. If 0r > then decrease the value of r by one and go to the step 2.
5. The end.
Since symbols poz , neg , zrt , iz do not occur with the same probability Huffman coding is usually
applied to the EZW output to reduce data amount (bit stream).
The image decoding phase requires some data to start with, namely: the initial threshold max
max2 ,r
r rT T= = the original image size, the sub-band decomposition scale and the encoded bit stream. The
EZW decodes encoded files (bit stream) into a symbol sequence, creates all the proper size subbands needed and proceeds image decompression process as follows.
1. Input maxr r= . Set RL = ∅ and set all the wavelet coefficients to zeros.
2. For each 1 2( , )Y k k RL∈ , input the r -th most significant bit of 1 2| ( , ) |Y k k .
3. Set the list IL to contain indices of all the coefficients, except of those in RL, ordered so that parents are listed before their children. For each index 1 2( , )k k IL∈ , do: input a current symbol σ ;
if pozσ = then set 1 2( , ) ( 2 )rr rY k k T T= = and add 1 2( , )Y k k to RL, else if negσ = then set
1 2( , ) rY k k T= − and add 1 2( , )Y k k to RL, else if zerσ = then remove all indices, corresponding to
the descendants of 1 2( , )Y k k from IL, else if izσ = then take no action.
4. If 0r > then decrease the value of r by one and go to the step 2.
5. The end.
The other wavelet-based image coding algorithm, called SPIHT, is an improved version of EZW which achieves better compression and performance than EZW. For more detailed description of the algorithm, we refer the reader to [5].
High scale
Low scale
High scale
Low scale
- 303 -

3 A novel approach to quad-tree analysis in the EZW algorithm The most time-consuming part of the EZW algorithm is the iterative image encoding phase (Section 2),
because hereupon all quad-trees in the discrete wavelet spectrum 1 2[ ( , )]Y k k of the image 1 2[ ( , )]X m m are
checked repeatedly for significant wavelet coefficients with respect to a certain (decreasing from iteration to iteration) threshold. When an insignificant wavelet coefficient (root of a quad-tree) 1 2( , )Y k k is found, and a scan
of its children reveals that they are insignificant too, then it is possible to encode that wavelet coefficient
1 2( , )Y k k and its children, a zero-tree, by one symbol ,zrt thus achieving compression. Wavelet coefficients
(roots of quad-trees) found to be insignificant in the encoding phase but with significant children are coded as isolated zeros .iz
To avoid repeated scanning and verification of wavelet coefficients, comprising volumes of quad-trees in 1 2[ ( , )]Y k k , for significance with respect to changing threshold values, we have developed a novel accelerated
quad-tree analysis scheme, which guarantees exceptionally high performance of the encoding phase in EZW.
3.1 An improved quad-tree analysis scheme
Let 1 2[ ( , )]X m m ( 1 2, {0,1, , 1}m m N∈ −K , 2 , NnN n= ∈ ) be a given digital image and 1 2[ ( , )]Y k k
( 1 2, {0,1, , 1}k k N∈ −K ) be its discrete wavelet (Haar, Le Gall, Daubechies, etc.) spectrum. Also, let
max 2 1 2 1 2log max{ | ( , ) | , {0,1, , 1}}r Y k k k k N = ∈ − K .
Consider a wavelet coefficient 1 2( , )Y k k ( 2 sn is sk j−= + , {0, 1, ..., 2 1}, 1,2sn i
sj s−∈ − = ) which is the
root (parent) of the quad-tree (provided 1 1i > and 2 1i > ), comprising the set of wavelet coefficients
(descendants) 1 2 1 2{ ( , ) | ( , ) }Y k k k k∗ ∗ ∗ ∗ ∈ℑ , where 1 2
1 2
min{ 1, 1}
1{ ( )x ( )}
i i
k ktt t
− −
=ℑ = ℑ ℑU ,
( ) {2 , 2 1, ..., 2 ( 1) 1}s
t t tk s s st k k kℑ = ⋅ ⋅ + + − and 1,2s = .
Let us associate 1 2( , )Y k k with two binary codes (one for the offspring of 1 2( , )Y k k , another for the
descendants of 1 2( , )Y k k , except offspring), namely:
max1 2 1 2 1 1 2 0 1 2( , ) ( , ) ( , ) ( , )rCodeOff k k u k k u k k u k k= ⟨ ⟩K ,
max1 2 1 2 1 1 2 0 1 2( , ) ( , ) ( , ) ( , )rCodeDes k k v k k v k k v k k= ⟨ ⟩K .
The above codes are generated by a single scanning of the discrete wavelet spectrum 1 2[ ( , )]Y k k as
follows:
(1) 1 2( , ) 1ru k k = , if at least one of coefficients (taken by absolute value) 1 22 , 2| |k ky ,
1 22 1, 2| |k ky + ,
1 22 , 2 1| |k ky + or 1 22 1, 2 1| |k ky + + falls into the half-open interval 1[2 ,2 )r r+ , max{0,1, , }r r∈ K , and
1 2( , ) 0ru k k = , otherwise;
(2)
1 2 1 2 1 2
1 2 1 2
1 2 1 2 1 2 1 2 1 2
(2 ,2 ) (2 1,2 ) (2 ,2 1)
(2 1,2 1), for 8 max{ , } 4 1,
( , ) (2 ,2 ) (2 ,2 ) (2 ,2 1) (2 ,2 1)
r r r
r
r r r r r
u k k u k k u k k
u k k N k k N
v k k u k k v k k u k k v k k
∨ + ∨ + ∨
∨ + + ≤ ≤ −
= ∨ ∨ + ∨ + ∨
1 2 1 2 1 2
1 2 1 2
(2 1,2 ) (2 1,2 ) (2 1,2 1)
(2 1,2 1) , for 1 max{ , } 8 1,r r r
r
u k k v k k u k k
v k k k k N
∨ + ∨ + ∨ + + ∨
∨ + + ≤ ≤ −
for all max0,1, ,r r= K .
We here emphasize that in the first instance one must compute binary codes 1 2( , )CodeDes k k with
index pairs 1 2( , )k k satisfying condition 1 28 max{ , } 4 1N k k N≤ ≤ − , then codes 1 2( , )CodeDes k k with index
pairs 1 2( , )k k satisfying condition 1 216 max{ , } 8 1N k k N≤ ≤ − , and, finally, codes 1 2( , )CodeDes k k with index
pairs 1 2( , )k k satisfying condition 1 2max{ , } 1k k = .
Thus, to state that the wavelet coefficient 1 2( , )Y k k ( 1 2, {0,1, , 2 1}k k N∈ −K ) is the root of the zero-
tree, comprising the set of wavelet coefficients (descendants) 1 2 1 2{ ( , ) | ( , ) }Y k k k k∗ ∗ ∗ ∗ ∈ℑ , with respect to the
threshold 2rrT T= = ( max{0,1, , }r r∈ K ), it suffices to ascertain that 1 2( , ) 0ru k k = and 1 2( , ) 0rv k k = (the key
moment of the proposed idea).
- 304 -

We observe that generation of binary codes 1 2( , )CodeOff k k , for all possible values of 1k and 2k ,
requires ( 2 4N − ) verifications of falling into one or another half-open interval, while that for 1 2( , )CodeDes k k
requires ( 2 4 7N − ) logical additions on binary codes of length max 1r + .
Evidently, the described quad-tree analysis scheme can be used with other coding algorithms similar to the EZW, as the SPIHT algorithm (in processing lists of insignificant pixels and those of insignificant sets, [5]), and for other data as images.
3.2 Experimental results To implement both the current and the modified (supplemented with the proposed quad-tree analysis
scheme; Section 3.1) versions of the EZW algorithm, the discrete Le Gall (wavelet) transform (DLGT) was employed. The latter transform possesses a tolerable “energy compaction” property, has a fast performing technique and facilitates lossless compression of digital images. Incidentally, the default reversible transform in JPEG 2000 is implemented exactly by means of DLGT, [3].
With a view to estimate efficiency of the developed accelerated quad-tree analysis scheme, a number of digital images of size 256x256, characterized by different smoothness level, were processed, namely (Figure 2): Acura.bmp, Lena.bmp, Forest.bmp. Computer simulation was performed on a PC with CPU PENTIUM4 2.8 GHz, RAM 2 GB, OS Windows XP; Programming language Java.
(a) (b) (c)
Figure 2. Test images: (a) image “Acura” 256x256; (b) image “Lena” 256x256; (c) image “Forest” 256x256
As it can be seen from Table 1, application of the proposed accelerated quad-tree analysis scheme to lossless encoding (the threshold value 0 1T T= = ), as well as to lossy encoding ( 1rT T= > ), of test images leads
to striking image encoding time gains EZW EZWτ τ ∗− ( EZWτ signifies the time needed to encode the test image
using the basic version of the EZW algorithm, whereas EZWτ ∗ - the time needed to encode the same image using
the developed modified version of the EZW algorithm).
Table 1. Image encoding times EZWτ and EZWτ ∗ (in seconds).
Threshold
Test image 0 1T T= = 1 2T T= = 2 4T T= = 3 8T T= = 4 16T T= = 5 32T T= =
Acura.bmp EZWτ 25.435 7.705 4.23 3.118 2.574 2.299
EZWτ ∗ 11.95 3.18 1.175 0.526 0.199 0.064
Lena.bmp EZWτ 57.159 37.567 20.274 7.425 2.747 1.295
EZWτ ∗ 29.919 19.928 10.461 4.02 1.287 0.313
Forest.bmp EZWτ 159.911 118.142 85.508 57.358 42.308 33.5
EZWτ ∗ 87.86 67.107 47.25 32.94 24.036 12.99
For instance, in the case of lossless image encoding (0 1T T= = ), the modified version of the EZW
algorithm runs (on the average) twice faster than the current EZW algorithm. Furthermore, with increasing values of the threshold ,T the obtainable fulfilling image encoding speed gains ( ) 100EZW EZW EZWτω τ τ τ∗= − ⋅
(%) have tendency to increase (Figure 3).
- 305 -

Similar promising results were obtained for images of other sizes. For instance, the encoding time speed gains for the image peppers.bmp of size 512x512 equal (3476.655 761.8) 3476.655 100 78.088τω = − ⋅ = (%),
and that for the image brain.bmp of size 128x128 equal (5.472 3.441) 5.472 100 37.116τω = − ⋅ = (%). Thus, in
all cases, the modified version of the EZW algorithm performs better than the basic EZW algorithm.
Figure 3. Image encoding speed gains (lossless and lossy image compression)
Worth emphasizing, the overall performance of both the current and the modified EZW coders depends on the smoothness class (level) of the image under processing, [12]. The higher smoothness of the image, the lower image encoding times and noticeably better performance of the modified EZW coder in comparison with the current EZW coder (Figure 4). We here notice that the smoothness level α of test images was determined by computing the rate of “decay” of Le Gall wavelet coefficients.
Figure 4. Image smoothness impact on the efficiency of EZW coders ( 0.411αααα ==== , for Acura.bmp,
0.211αααα ==== , for Lena.bmp , and 0.111αααα ==== , for Forest.bmp)
4 Conclusion In the paper, a novel scheme for the accelerated analysis of quad-trees in the discrete wavelet spectrum
of a digital image is proposed. The scheme can be applied to any zero-tree based image encoder, such as the embedded zero-tree wavelet (EZW) algorithm of Shapiro, set partitioning in hierarchical trees (SPIHT) by Said and Pearlman, and others.
Numerous experimental results show that implementation of the proposed quad-tree analysis scheme in the EZW algorithm increases the overall performance of the EZW encoder somewhere (40 90)%− . Worth
emphasizing, the image encoding speed gains directly depend on the smoothness class of the image under processing. The lower smoothness of the image, the better image encoding speed gains are obtained.
In the future, efficiency analysis of the application of the developed quad-tree analysis scheme to other wavelet-based image encoders (SPIHT, EBCOT, etc.) is planned.
0
40
80
120
160
0 0,1 0,2 0,3 0,4 0,5
TEZW
TEZW*
τ
α
EZWτ
EZWτ ∗
0
20
40
60
80
100
120
0 1 2 3 4 5
Acura.bmp
Lena.bmp
Forest.bmp
τω
2log T
- 306 -

References [1] Woods J., O’Neil S. D. Subband coding of images. IEEE Trans. Acoust., Speech, Signal Processing. 1986, volume
ASSP-34, page 1278-1288.
[2] Antonini M., Barlaud M., Mathieu P., Daubechies I. Image coding using wavelet transform. IEEE Trans. Image Processing. 1992, volume 1, page 205–220.
[3] Christopoulos C., Skodras A., Ebrahimi T. The JPEG2000 Still Image Coding System, An Overview. IEEE Trans. on Consumer Electronics. 2000, volume 46, number 4, page 1103-1127.
[4] Shapiro J. M. Embedded image coding using zerotrees of wavelet coefficients. IEEE Trans. Signal Processing. 1993, volume 41, page 3445-3462.
[5] Said A., Pearlman W. A. A new, fast and efficient image codec based on set partitioning in hierarchical trees. IEEE Trans. Circuits Syst. Video Technology. 1996, volume 6, page 243-250.
[6] Hilton M. L. Wavelet and Wavelet Packet Compression of Electrocardiograms. IEEE Trans. Biomed. Eng. 1997, volume 44, page 394-402.
[7] Chai B.-B., Vass J., Zhuang X. Significance–linked connected component analysis for wavelet image coding. IEEE Trans. Image Processing. 1999, volume 8, page 774–784.
[8] Servetto S. D., Rachmandran K., Vaishampayan V. A., Nahrstedt K. Multiple description wavelet based image coding. IEEE Trans. Image Processing. 2000, volume 9, page 813–826.
[9] Ates H. F., Orchard M. T. An Adaptive Edge Model in the Wavelet Domain for Wavelet Image Coding. Signal Processing: Image Comm., Elsevier. 2005, volume 20, number 2, page 169-185.
[10] Kaur L., Chauhan R. C., Saxena S. C. Wavelet based compression of medical ultrasound images using vector quantization. Journal of Medical Engineering&Technology. 2006, volume 30, issue 3, page 128-133.
[11] Vijendra Babu D., Alamelu N. R. Wavelet Based Medical Image Compression Using ROI EZW. International Journal of Recent Trends in Engineering. 2009, volume 1, number 3, page 97-100.
[12] Zumbakis T., Valantinas J. The use of image smoothness estimates in speeding up fractal image compression. Lecture Notes in Computer Science, Image Analysis: 14th Scandinavian Conference, SCIA, Joensuu, Finland: proceedings. 2005, volume 3540, page 1167-1176.
- 307 -