Three-dimensional modeling and simulation of vapor ...
155
THREE-DIMENSIONAL MODELING AND SIMULATION OF VAPOR EXPLOSIONS IN LIGHT WATER REACTORS Maxim Schröder IKE Institut für Kernenergetik und Energiesysteme Universität Stuttgart August 2012 IKE 2-150
Transcript of Three-dimensional modeling and simulation of vapor ...
THREE-DIMENSIONAL
MODELING AND SIMULATION
OF VAPOR EXPLOSIONS IN
LIGHT WATER REACTORS
Maxim Schröder
IKE
Institut für Kernenergetik und Energiesysteme
Universität Stuttgart
August 2012 IKE 2-150

Three-dimensional modeling
and simulation of vapor
explosions in Light Water
Reactors von der Fakultät Energie-, Verfahrens- und
Biotechnik der Universität Stuttgart zur
Erlangung der Würde eines
Doktor-Ingenieurs (Dr.-Ing.) genehmigte
Abhandlung
vorgelegt von
Maxim Schröder geboren in Temirtau/Kasachstan Hauptberichter: Prof. Günter Lohnert, Ph.D Mitberichter: Prof. Dr.-Ing. Eberhard Göde Tag der mündlichen Prüfung: 6. Juli 2012 ISSN – 0173 – 6892
IKE
Institut für Kernenergetik und Energiesysteme
August 2012 IKE 2-150
Universität Stuttgart


Acknowledgement
I would like to thank most sincerely Manfred Bürger for his considerate and patient
support and guidance during my PhD work at IKE. He encouraged me to think
independently, to see globally and to identify matters of substance. The experience
he shared with me was paramount in helping me find my long-term career goals.
I would also like to express my gratitude to my advisor Professor Lohnert, who
provided me with a technical insight and a practical view of nuclear science. Our
discussions were always fruitful and stimulating in advancing my knowledge in the
nuclear field.
Michael Buck was also essential to the success of this work by his assistance,
friendship and backing in providing me with a wide breadth of experience in
numerical analysis and model development. I am also very grateful for the friendly
help of Georg Pohlner, with whom I worked closely in resolving many problems.
Finally and most importantly, I would like to thank my beloved wife Olga. Her
support, motivation, patience and love have carried me through the challenging time
of my graduate studies.

Abstract
Steam explosions can occur during a severe accident in light water nuclear reactors
with the core melting as the consequence of interaction of molten core materials with
water inside the reactor pressure vessel (in-vessel steam explosions), or after a
failure of the reactor vessel due to the release of molten materials into the reactor
cavity likely filled with water (ex-vessel steam explosions). Such steam explosions
may significantly increase risks of severe accidents threatening the integrity of the
reactor pressure vessel, of the primary containment and possibly even of the reactor
building. The loss of integrity of the primary containment and reactor building would
cause a release of large amounts of fission products into the atmosphere and a
contamination over a large area. Eliminating the risk of steam explosions in reactor
accident scenarios would contribute to enhancing the effectiveness of accident
management procedures, e.g. concept for the external cooling of the reactor vessel
or the cooling of the molten core in the flooded reactor cavity.
The main parameters influencing the outcome of a strong steam explosion are a
limitation of the fragmented melt mass mixing with water, the melt jet fragmentation,
the void buildup during premixing, the solidification at the surface of melt drops
during the premixing and pressure escalations during detonation. Asymmetries
caused by geometrical constraints (e.g. wall proximity, distributed melt pouring) are
likely during an accident with core melting and can have a strong impact on the
explosion strength.
Previously, asymmetric configurations have been investigated with two-dimensional
models using 2D approximations. Until now, open questions concerning the
fragmentation of the melt, the mixing phase with water, the extent of the mixing
region and pressure increases under asymmetric conditions remained due to the
uncertainties existing with the approximated approach. This led to unsatisfactory
answers as to the role of geometrical restrictions. In order to give a more adequate
solution to the problem and be able to predict the explosion strength in a
conservative manner, the two-dimensional premixing and explosion codes
IKEJET/IKEMIX and IDEMO were extended to 3D in the present work. Additional
modeling improvements have been made with regard to applicability to real reactor
conditions. The enhancements focus in particular on the breakup of thick melt jets in
deep water pools and on the solidification of melt fragments during the mixing phase
with water.
Asymmetries and their impact on the formation of explosive mixtures were
investigated using the extended program codes. Variations to the melt delivery, pool
depth and melt pouring configuration are considered. The melt fragmentation, void
production, extent of the mixing zone due to geometrical constraints and the loads
on adjoining structures are discussed in detail. The focus is on the assessment of
Abstract
ii
three-dimensional effects in the mixing and detonation phases. In this regard, two-
and three-dimensional calculations were performed for each configuration. An
investigation of the influence of the 3D geometry, i.e. geometrical restrictions on
mixing, extent and distribution of melt and coolant, is discussed. Pressure loads and
impulses on adjoining structures are obtained and the results are critically discussed.
The calculations performed show the capability of the codes to correctly represent
the main aspects of premixing and explosion stages of steam explosion in non-
symmetrical scenarios and to adequately predict the pressure loads on the adjoining
structures.
Kurzfassung
iii
Kurzfassung
Effektive Kühlmassnahmen zur Milderung der Folgen schwerer Störfälle mit
Kernschmelze in Leichtwasserreaktoren erfordern den Einsatz von Wasser auch
noch in späten Phasen des Unfallablaufs. Hierbei kann es zum Kontakt von
Kernschmelze und Wasser kommen. Hier ergibt sich potentiell ein erhöhtes Risiko
von Dampfexplosionen. Diese können den Unfallablauf durch Gefährdung der
benachbarten Strukturen erheblich verschärfen und zum Integritätsverlust des
Reaktordruckbehälters oder des Primärcontainments führen. Es käme zu einer
erheblichen Freisetzung radioaktiver Stoffe in die Umgebung und zu einer
unmittelbaren Gefährdung der Menschen. Ein Ausschluss kritischer Wirkungen von
Dampfexplosionen würde generell eine günstigere Beurteilung von
Kühlungsmöglichkeiten mit Wasser erlauben uns so zusätzlich Optionen für
Massnahmen des Accident-Managment eröffnen, wie z.B. das Konzept der
Aussenkühlung des Reaktordruckbehälters oder das Konzept der Kühlung von
ausgetretener Schmelze in einem Wasser-Pool in der Reaktorgrube.
Das Hauptziel der Arbeit ist es, den Effekt von Asymmetrien auf zentrale Aspekte
(wie z.B. die Fragmentierung von Schmelzestrahlen, Voidbildung, Erstarrung der
Schmelzetropfen in der Vorvermischung sowie Druckeskalationen in der
Explosionsphase) in Reaktoranwendungen zu untersuchen. Hierfür wurden im
Rahmen der Dissertation die bestehenden zweidimensionalen Programmcodes zur
Vorvermischung und Detonation auf 3D erweitert. Zusätzlich wurden die Modelle
hinsichtlich der Anwendbarkeit auf Reaktorszenarien weiterentwickelt. Zwei wichtige
Punkte sind hierbei die Fragmentierung von Schmelzestrahlen und die Erstarrung
von Schmelzetropfen. Die Fragmentierung bestimmt die Grösse des
Schmelzetropfens und beeinflusst somit die Voidbildung und die Entwicklung der
relativen Krustedicken an den Schmelzetropfen in der Vorvermischung. Der
Erstarrungsprozess ist ein wichtiger Aspekt für die Feinfragmentierbarkeit einzelner
Tropfen und für die Explosivität der ganzen Mischung. Geometrisch bedingte
Asymmetrien können die Explosivität der Mischung und die resultierende
Explosionsstärke durch eine räumliche Verformung und Verzerrung des
Mischungsbereiches erheblich beeinflussen. Die Distanz von dem „Epizentrum“ der
Druckeskalationen zu den Strukturen spielt eine grosse Rolle und ist bei der
Bestimmung der während des Detonationsvorganges resultierenden Belastungen
durch eine Dampfexplosion entscheidend.
Die im Rahmen der Dissertation erweiterten Programmcodes JEMI und IDEMO-3D
stellen ein anwendbares Werkzeug zur Analyse der Mischungsvorgänge von
Schmelze und Wasser sowie der Detonationsprozessen in 3D dar. Damit wurden
asymmetrische Reaktorszenarien untersucht, für welche der Schmelzeeintrag, die
Wasserhöhe und die Ausfliesskonfiguration variiert wurden. Der Einfluss von
Asymmetrien auf die Bildung explosiver Konfigurationen wurde in Bezug auf die

Kurzfassung
iv
Strahlfragmentierung, die Voidbildung und die seitliche Ausdehnung des
Mischungsgebietes kritisch diskutiert. Gekoppelte Berechnungen zu
Reaktorszenarien und Prädiktion von Strukturbelastungen bei Dampfexplosionen
sind mit den hier entwickelten Programmcodes möglich.

Table of Contents
v
Table of Contents
Abstract ........................................................................................................................ i Kurzfassung ................................................................................................................ iii Table of Contents ........................................................................................................ v Nomenclature ............................................................................................................. vi Abbreviations ............................................................................................................... x
1 Introduction ............................................................................................................. 1 1.1 Background ................................................................................................... 1 1.2 State of the art ............................................................................................... 3 1.3 Objectives of the present work ...................................................................... 4
2 Steam explosion phenomena in reactor applications ............................................. 7 2.1 Coarse fuel-coolant mixing ............................................................................ 7 2.2 Triggering ...................................................................................................... 9
2.3 Explosion propagation ................................................................................. 10 2.4 Explosion expansion .................................................................................... 11
3 Need of three-dimensional modeling for reactor applications ............................... 13 4 Three-dimensional premixing model JEMI ........................................................... 19
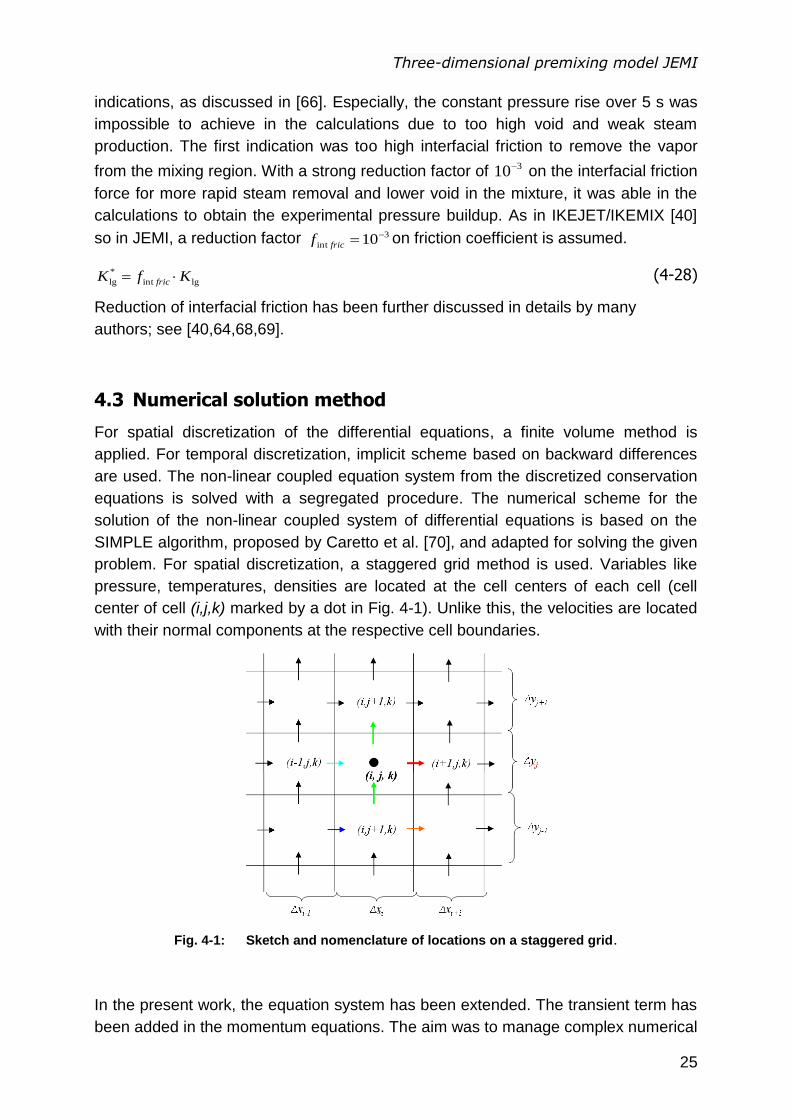
4.1 Mathematical model .................................................................................... 20 4.2 Constitutive laws .......................................................................................... 22 4.3 Numerical solution method .......................................................................... 25
4.4 Breakup of melt jets ..................................................................................... 28 4.5 Melt drops .................................................................................................... 34
4.6 Heat transfer between melt and fluid ........................................................... 36 4.7 Solidification of melt drops ........................................................................... 39
5 Explosion model IDEMO-3D ................................................................................. 47 5.1 Mathematical model .................................................................................... 48
5.2 Constitutive laws .......................................................................................... 50 5.3 Discretization into crust thickness ................................................................ 54 5.4 Fine fragmentation criterion ......................................................................... 55
5.5 Numerical procedure ................................................................................... 58 6 Verification of JEMI and IDEMO-3D ..................................................................... 59
6.1 Verification of the premixing model JEMI .................................................... 60 6.1.1 Verification of jet breakup model based on FARO tests ...................... 62 6.1.2 Solidification of melt drops during the premixing ................................. 66
6.1.3 JEMI verification on FARO L-24, L-28 and L-31 .................................. 69 6.2 Verification of the IDEMO-3D code with explosion experiments .................. 75
7 Reactor applications ............................................................................................. 85 7.1 Investigation to 3D effect in reactor applications ......................................... 88
7.1.1 Premixing phase ................................................................................. 90 7.1.2 Explosion phase ................................................................................ 102
7.2 Further reactor scenarios .......................................................................... 112 7.3 Discussion ................................................................................................. 120
8 Summary and conclusion ................................................................................... 123
9 List of References .............................................................................................. 131
Nomenclature
vi
Nomenclature
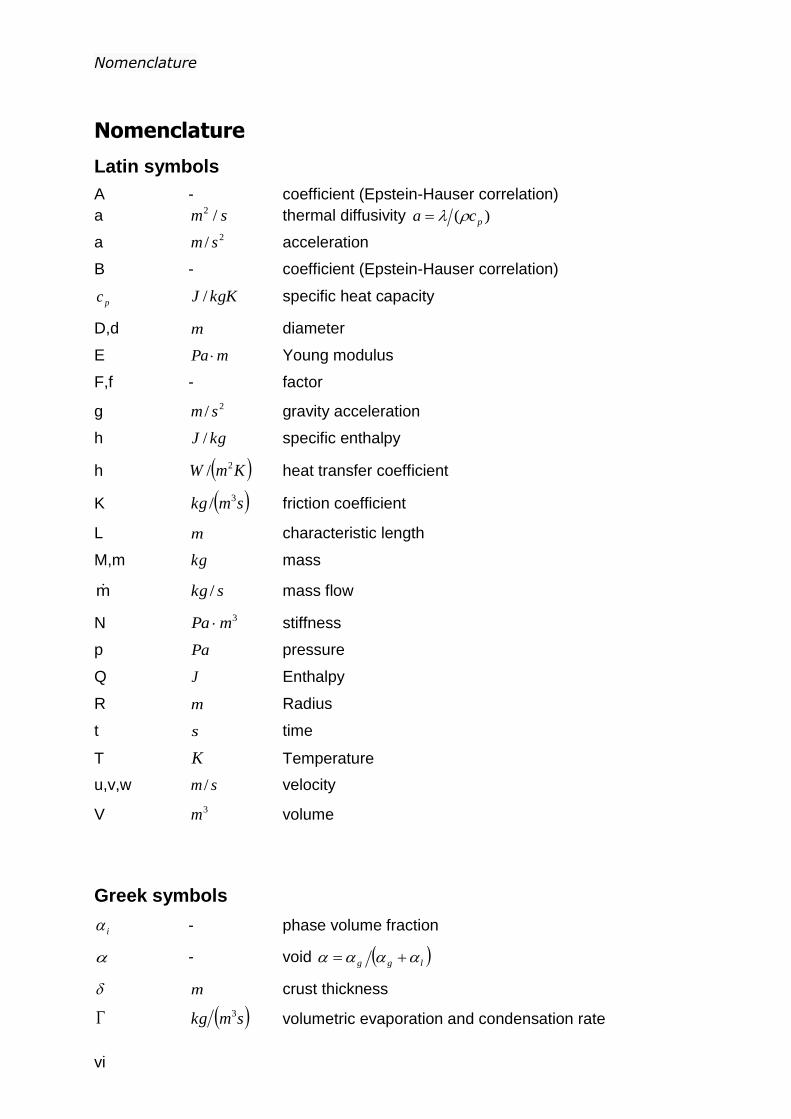
Latin symbols
A - coefficient (Epstein-Hauser correlation)
a sm /2 thermal diffusivity )( pca
a 2/ sm acceleration
B - coefficient (Epstein-Hauser correlation)
pc kgKJ / specific heat capacity
D,d m diameter
E mPa Young modulus
F,f - factor
g 2/ sm gravity acceleration
h kgJ / specific enthalpy
h KmW 2/ heat transfer coefficient
K smkg 3/ friction coefficient
L m characteristic length
M,m kg mass
m skg / mass flow
N 3mPa stiffness
p Pa pressure
Q J Enthalpy
R m Radius
t s time
T K Temperature
u,v,w sm / velocity
V 3m volume
Greek symbols
i - phase volume fraction
- void lgg
m crust thickness
smkg 3 volumetric evaporation and condensation rate
Nomenclature
vii
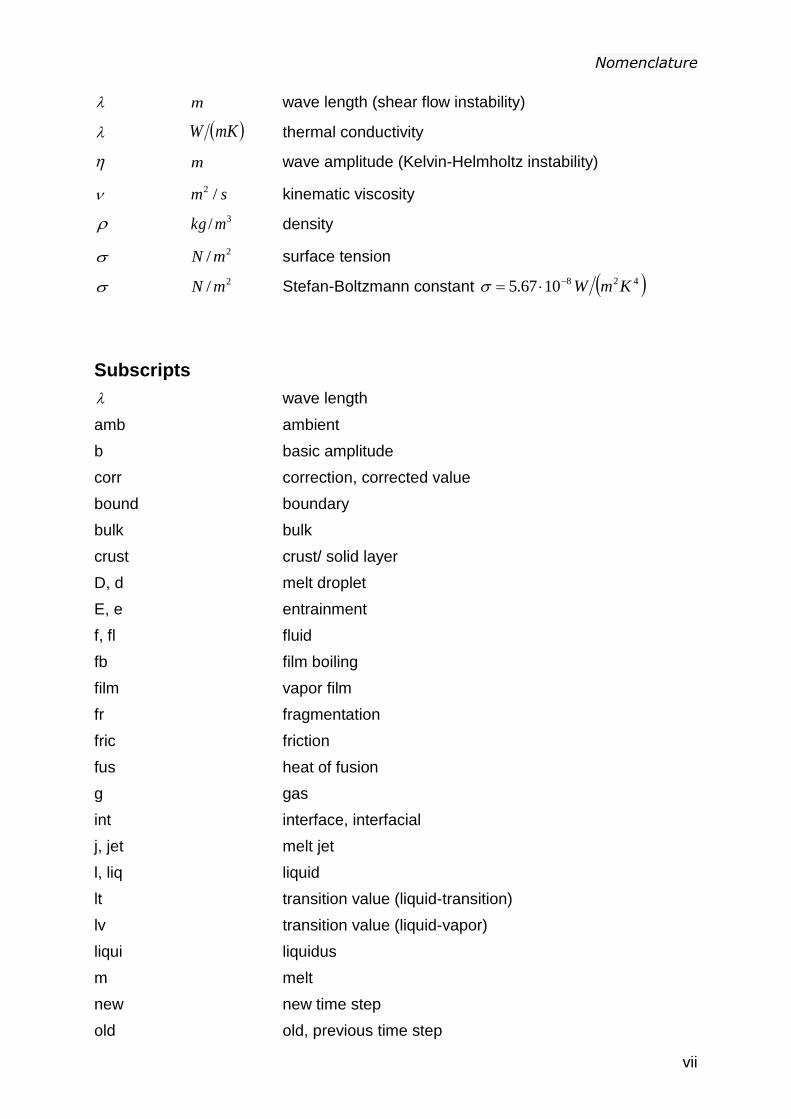
m wave length (shear flow instability)
mKW thermal conductivity
m wave amplitude (Kelvin-Helmholtz instability)
sm /2 kinematic viscosity
3/ mkg density
2/ mN surface tension
2/ mN Stefan-Boltzmann constant 4281067.5 KmW
Subscripts
wave length
amb ambient
b basic amplitude
corr correction, corrected value
bound boundary
bulk bulk
crust crust/ solid layer
D, d melt droplet
E, e entrainment
f, fl fluid
fb film boiling
film vapor film
fr fragmentation
fric friction
fus heat of fusion
g gas
int interface, interfacial
j, jet melt jet
l, liq liquid
lt transition value (liquid-transition)
lv transition value (liquid-vapor)
liqui liquidus
m melt
new new time step
old old, previous time step
Nomenclature
viii
p, pac melt particle
pool melt pool
rad heat radiation
rel relative
s stripping off, solid
sat saturation
sep separation
soli solidus
strip stripping
surf surface
t transition regime
tot total
v, vap vapour
vt transition value (vapour-transition)
Superscripts
evap evaporation
loss loss, heat loss in CFOR
D melt droplet
Dimensionless numbers
Bo - Bond number, )(2 aLBo
Nu - Nusselt number hLNu
Pr - Prandl number pcPr
Re - Reynolds number wLRe
We - Weber number dvWe 2
Nomenclature
ix
Computer codes and modules
CFOR Model to crust formation and solidification of a spherical particle, implemented in JEMI
ESPROSE.m 2D program code to explosion phase, UCSB, USA,
FRADEMO Fragmentation model of melt drops in fluids based on hydrodynamic fine-fragmentation (IKE)
CULDESAC Propagation model, AEA Technology, UK
HTMOD Solidification model for single drops implemented in MC3D, JSI, Slovenia
IDEMO 2D program code for explosion phase, IKE, Germany
IDEMO-3D 3D program code for explosion phase, IKE, Germany
IFCI Integrated code for premixing and explosion phases, SNL, USA
IKEJET 1D module to breakup of melt jets in water, IKE, Germany
IKEJET/IKEMIX 2D program code for premixing phase, IKE, Germany
IKEMIX 2D module for mixing of fragmented melt in water, IKE, Germany
JASMINE 2D steam explosion simulation code, JAEA, Japan
MC3D 3D program code for premixing and explosion phase, IRSN, France
PM-ALPHA 3D program code for premixing phase, UCSB, USA
TEXAS 1D program code for explosion phase, UCSB, USA
THIRMAL Premixing program code, ANL, USA
VESUVIUS Steam explosion simulation code, NUPEC, Japan

Abbreviations
x
Abbreviations
General
1D One-dimensional
2D Two-dimensional
3D Three-dimensional
AM Accident Management
BWR Boiling Water Reactor
ECCS Emergency Core Cooling Systems
FCI Fuel-Coolant Interactions
INES International Nuclear and Radiological Event Scale
KH Kelvin-Helmholtz (instability)
MBC Melt-Bottom-Contact
PWR Pressurized Water Reactor
RPV Reactor Pressure Vessel
RT Rayleigh-Taylor (instability)
SARNET Severe Accident Research Network, OECD
SE Steam Explosions
SERENA Steam Explosion Resolution for Nuclear Applications, OECD
Abbreviations
xi
Institutions
BMWi Bundesministerium für Wirtschaft und Technologie, Germany
CEA Commissariat à l‟Energy Atomique, France
EdF Electricitè de France, France
FZK Forschungszentrum Karlsruhe, Germany
GRS Gesellschaft für Anlagen- und Reaktorsicherheit, Germany
IAEA International Atomic Energy Agency
IAPWS International Association for the Properties of Water and Steam
IKE Institut für Kernenrgetik und Energiesysteme, University of Stuttgart, Germany
IRSN Institut de Radioprotection et de Sûrete Nuclèaire, France
JSI Jozef Stefan Institute, Lubljana, Slovenia
KAERI Korea Atomic Energy Research Institute, Daejeon, South Korea
KTG Kerntechnische Gesellschaft, e.G., German Nuclear Society
OECD Organisation for Economic Co-operation and Development
UCSB University of California, Santa Barbara, USA


Introduction
1
1 Introduction
1.1 Background
Today, a significant part of electrical energy worldwide is produced by controlled
nuclear fission in nuclear reactors. They contribute to both the national and world
safeguarded power supply without the emission of greenhouse gases, which are
believed to be a cause for global warming. Discussions on the prolongation of the
use of nuclear energy are controversial, mainly due to the perceived potential risk
posed by nuclear power plants to the public and environment. In order to assess
risks accurately and to prevent accidents with an adverse outcome, a rigorous
assessment of nuclear reactor safety is of crucial importance for the construction and
operation of nuclear power plants.
The operation of nuclear power plants requires mastering extreme operational
conditions – very intense heat generation with considerable heat flux under high
pressure and possible power excursions as well as extreme heat transport
mechanisms with very high flow rates of the coolant through the system. Even after
emergency or regular shutdown of the nuclear reactor, heat continues to be
produced by the radioactive decay of the fission products. During operation, the
decay heat contributes about 7% of the total heat power and decreases
logarithmically after the shutdown to ~1% (~38 MW) after one hour. According to a
prediction in [1], the sum of the total decay heat produced in one hour after shutdown
in a BWR (e.g. Gundremmingen Block B) with a total operating power of 3840 MWth
is about 319 GJ. After one day – approximately 3580 GJ. This large amount of decay
heat causes in a short time the reaching the fuel cladding temperature of 1477 K in
central core regions, when the exothermal reaction of the cladding material (i.e.
zirconium-alloy-composition) and water/vapor sets on leading to core damage or
even the core melting. In order to avoid any damage to the reactor core being caused
by decay heat, the cooling of the reactor core must be always assured.
The Emergency Core Cooling System (ECCS) ensures cooling of the reactor core in
events with breaks or leaks in the reactor piping as well as the loss of the main
cooling and thus prevents a core damage. Once the emergency cooling systems fail,
the reactor core will melt due to decay heat. As the last nuclear accident on March
11th 2011 in Japan at Fukushima-Daiichi nuclear power plant showed, the failure of
the ECCS can be resulted from nature cataclysms as strong earthquakes and
external floods due to tsunami causing the loss of the offsite power, the emergency
power supply and the main heat sink. Reactor core degradation on a grand scale can
be a possible consequence, once no cooling in a later phase takes place. After the
reactor core melts due to decay heat, large quantities of molten core material would
relocate from the reactor core to the lower plenum of the reactor pressure vessel
Introduction
2
(RPV) where it would interact with water, lower plenum and RPV structures. Possible
consequence may be the structural failure of the lower bulkhead of the RPV due to
thermal loads or due to high energetic fuel-coolant interactions (FCI) in the lower
plenum. Amongst such high energetic interactions, the so-called Steam Explosion
(SE) is initiated by energy transfer from the hot molten fuel, which is either metallic or
oxidic, to the cold liquid coolant. In a LWR, a rapid boiling of the coolant ensues and
the pressure rises locally. Steam explosions can also occur after failure of the RPV.
In such a case, the molten core debris would pour from the failed RPV into the
reactor cavity pre-filled with water. The dynamic loads on the cavity wall due to a
steam explosion could potentially cause the failure of the cavity structures and the
primary piping system producing severe mechanical loads that could threaten
containment integrity.
In dealing with reactor safety and its potential consequences, all incidents occurring
in civil nuclear installations are today classified in incidents and accidents depending
on their probability, severity and public exposure. The International Nuclear and
Radiological Event Scale (INES) is an internationally acknowledged public
classification of safety-relevant information used for rapid and effective
communication by reactor operators and national regulators [2]. According to the
INES classification, steam explosions come under severe accidents, with a very low
probability of occurrence (less than once per million reactor-years) and are
considered beyond-design-basis events. The deterministic analysis of such events is
usually required by regulatory guidelines or plant-specific licensing requirements to
demonstrate the capability of the plant to mitigate the consequences of such events;
[3,4]. Accidents are generally defined as events postulated to potentially inflict
damage on one or more of the containment barriers (i.e. the fuel rod cladding, the
reactor pressure vessel, the primary and secondary containment). These events are
not expected to occur during the plant lifetime. Rather, they are used to establish the
design basis for nuclear facilities with regards to basic protection principles, such as
the control of reactivity, the ability to cool the core, to contain all radioactive
substances and to mitigate the consequences of any exposure to radioactivity.
The first occurrence of a steam explosion can be dated to December 12th 1952, [5]. It
occurred in the Canadian NRX test reactor due to the failure of the shutdown rod
system and ensuing power excursion. The reactor suffered a partial meltdown; some
of the fuel cladding burst and radioactive materials was released into the NRX
building. Other accidents, such as the BORAX boiling water reactor, the SL1 reactor
and the dedicated power excursion reactor test IDAHO (SPERT) also experienced
disruptions by high pressure loads up to 70 MPa. All of these steam explosions were
a consequence of reactivity excursions. A full account of past FCI accidents is
summed up in [6,7].
The only commercial nuclear reactor ever to be damaged by a steam explosion was
Block 4 of the Chernobyl plant, on April 26th 1986, [8]. In this reactor as well, it was
an uncontrolled power excursion which led to the dispersion of fuel into the
Introduction
3
surrounding water. This was followed by one or two steam explosions leading to the
destruction of the reactor vessel and reactor building as well as to the release of
large amounts of fission products into the atmosphere and contamination over a
large area. The Chernobyl accident is the only one to be classified as a Major
Accident, at INES 7 (it is the most severe in the INES classification) highlighting the
potency of a steam explosion and its off-site impact [2]. The Fukushima-Daiichi
accident being also classified at INES 7 is believed to be caused by hydrogen
explosion leading to its large offsite impact.
Steam explosions have also been reported in other industrial non-nuclear facilities
such as foundries (steel and aluminum), paper factories and liquid natural gas (LNG)
transport. On a geological scale, various conditions can lead to explosive FCI
interactions such as in volcanoes, between magma and water, so-called phreatic
eruptions, reported on in [9].
1.2 State of the art
Steam explosions are analyzed in the context of reactor safety research, as a
possible cause of large-scale and rapid deterioration of the RPV or the containment
due to destructive pressure loads. Such loads are the result of strong interactions of
the molten core material from the destroyed reactor core with water inside the RPV
or the reactor cavity inside the primary containment. Excluding the damage potential
from powerful steam explosions would ensure increased safety and could improve
the basis for accident management with regards to the water supply used in cooling.
In order to investigate the nature and the mechanisms of steam explosions, several
research projects have been initiated on a national and international level, both from
a theoretical standpoint and on an experimental basis.
A large number of small and large scale experiments were performed in order to
identify the initial conditions responsible for triggering and propagating explosive
interactions between water and molten core materials and to assess the magnitude
of pressure loads in a hypothetic steam explosion in a Light Water Reactor.
The first experimental investigations were single drop experiments with Wood‟s metal
performed at IKE [10,11], or iron oxide and cobalt [12-15] performed at Sandia
National Laboratories. The aim was to investigate the connection between the initial
conditions (i.e. melt properties, coolant temperature, ambient pressure, relative
velocity and solidification of melt drops) and the ability of drops to fragment finely,
thus leading to a steam explosion. Fröhlich proposed in [16], that a steam explosion
can occur even with small temperature differences between the melting temperature
of the molten metal and the boiling temperature of the coolant. The single drop
experiments generally provide a solid base for the analysis of single drop explosive
potential and its limiting effects. However, the results of these experiments cannot be
Introduction
4
simply extrapolated to real reactor conditions with large melt and water masses,
since the mixing of fragment melt and water becomes relevant.
Considering the limitations of the single drop experiments, a series of large scale
experiments have been performed. In these experiments, both the conversion ratio of
the fuel thermal energy into mechanical work and the hydrodynamic limitation of the
mixing of fragmented melt and water have been investigated at a large scale
(5-200 kg melt mass). The iron/aluminum oxide, Fe-Al2O3 was chosen to replicate
corium at Sandia National Laboratories [17,18].
A variety of corium compositions was taken at JRC-Ispra FARO [19,20]. Al2O3 and
corium were used in the KROTOS [21] and PREMIX experiments [22-26] at FZK
where they are mixed with water both with and without triggering. The aim was to
create a solid base for investigating the following aspects: melt jet break-up,
distribution and quenching of melt fragments in mixture, void building and the role of
initial conditions, such as initial water sub-cooling, ambient pressure and melt
temperature. Particular attention was paid to the interdependencies between these
parameters in order to determine their influence.
In order to extrapolate the experimental findings, several multiphase models and
thermal-hydraulic codes considering all three phases (water, steam and melt) have
been developed at different institutions within the context of different international
cooperation programs, e.g. IFCI [27,28], TEXAS [29,30], PM-ALPHA [31],
ESPROSE.m [32,33], MC3D [34,35], JASMINE [36], VESUVIUS [37], THIRMAL
[38,39], IKEJET/KEMIX [40], IDEMO [41,42]. The aim of these programs was to
analyze the complex FCI phenomena especially the break-up of melt jets, triggering
from mixing of melt and coolant, fine fragmentation and explosion strength.
The SERENA project (Steam Explosion Resolution for Nuclear Application) in reactor
safety research, has been initiated on an international level the goal of which was to
enhance the applicability of existing models and codes to existing reactors, [43].
Several FCI codes have been used within the scope of SERENA and SERENA-2
projects, integrating results and analyses. The work was oriented towards
benchmarking and test-fitting analysis for the purpose of safety analysis and in order
to identify key effects that may limit the explosion strength.
1.3 Objectives of the present work
The main thrust of the present work is to extend existing two-dimensional models
IKEJET/IKEMIX and IDEMO which include the premixing and explosion phases of
vapor explosion in 2D to 3D, in order to be able to simulate possible non-symmetric
conditions in reactor accident scenarios which are likely to have a stronger damaging
character. For instance, a lateral melt outflow into water in direct proximity to the RPV
and reactor cavity walls or a melt outflow at specific point locations could be
considered as typical non-symmetric configurations in reactor applications.
Introduction
5
Until now, asymmetric reactor configurations could generally be investigated in two
ways: using two-dimensional approximations either with an equal distribution
(smearing) in tangential direction of the mixture or by varying the problem size (see
Chapter 3). The first approach is questionable from the outset due to the artificial
nature of diluting or smearing the mixture in tangential direction, which artificially
decreases the melt fraction and the void. In the latter case, a sequence of
calculations had to be performed in plane or axis-symmetric coordinates, varying the
radial extension of the calculation domain, by which the influence of the non-
symmetric geometrical restriction caused by the RPV wall or cavity structures on the
progress of the mixture was investigated. Hereby, the extension of the melt
dispersion and formation of void as well as its progression, accompanied by dilution
or aggregation, is of a particular relevance. It influences the degree to which the
mixture may explode during the premixing phase. In the explosion phase, the
preceding degree of pre-mixing determines the explosion strength and the pressure
loads on the adjacent structures. The distance from the epicenter of the pressure rise
to the wall is of crucial importance to the reactor safety due to an attenuation effect
from the body of water which has a free surface.
Considering all these aspects, 2D approximations suffer certain limitations in giving
an adequate assessment of the mixture build-up and potential pressure loads due to
the absence of the third dimension. Thus, the full extension of the mixture, melt
fragments and void formation, in tangential direction during the premixing phase
cannot be properly estimated, as well as the pressure relief in lateral regions and the
reflection of the propagating shock wave in the explosion stage.
The extended three-dimensional models seek to correct these faults and result in
greater accuracy in predicting the mixture behavior. The comparison of the full 3D
calculations with the 2D approximations for a non-symmetric case is performed in
order to weigh up the shortcomings of the 2D approximations with regards to
resulting pressure loads at the adjacent structures.
Also, the present work considers improvements of the extended models in predicting
the jet break-up under film boiling conditions in deep water pools (e.g. deep reactor
cavity filled with water), the Lagrangian description of melt drops as distinct particles
resulting from the jet fragmentation, the solidification of melt drops during premixing,
the heat transfer in high sub-cooling conditions and the influence of crust formation
on fine fragmentation during the explosion stage, for greater realism and to give a
reliable prediction of pressure loads on surrounding structures.
Special attention is given to verification of the extended premixing model performed
in the FARO experiments pertaining to both the build-up of the mixture and the
solidification of melt drops settling at the bottom of the vessel, [44-46].
After verification, calculations are to be performed for realistic reactor scenarios.
Here the focus lies primarily on investigating the most challenging case, i.e. the
highest pressure loads on the surrounding structures potentially leading to their

Introduction
6
failure. In this respect, different parameters such as the melt flow rate, the water
level, the outflow configuration (single or multiple melt jets) and the triggering time of
an explosion are to be considered under realistic conditions during severe accidents
in LWRs.
Steam explosion phenomena in reactor applications
7
2 Steam explosion phenomena in reactor applications
In general, steam explosions bear
resemblance to conventional explosions.
An explosion implies the rapid conversion
of energy from one form to another form.
Before each explosion is initiated, the
energy must be stored in a meta-stable
state, i.e. in a form without significant
dissipation of available energy. The
explosion, i.e. the rapid conversion of the
available energy, can be activated by
considerably smaller amount of activation
energy, called a “trigger”. The available
energy is then rapidly converted into
another form that can perform work in the
surroundings, e.g. thermal energy is
converted into kinetic energy. A steam
explosion in the LWR‟s during a core
melting constitutes a process by which a
hot liquid (fuel) transfers its internal energy to a colder more volatile liquid (coolant).
The coolant then vaporizes at high pressures and expands, thus performing work on
the surrounding structures endangering its integrity.
A process for vapor explosion is proposed in Fig. 2-1. It is based on the “thermal
detonation concept” of Board and Hall [47]. According to this concept, several
sequential sub-processes can be distinguished, as discussed in [48-50]. At first, the
high temperature molten material is coarsely mixed in water as small drops
surrounded by vapor film. In the second step, the vapor film collapses due to
disturbances of internal or external character, so-called “triggering”. Thirdly, the hot
liquid melt directly contacts the water without solidification. This process is followed
by further fine fragmentation and atomization of the melt drop, thereby increasing the
interaction surface area and the heat exchange from melt to coolant. Finally, rapid
heat transfer and vapor generation cause local pressure rises and pressure pulses.
2.1 Coarse fuel-coolant mixing
The fuel-coolant mixing process can be understood as the formation of a coarsely
mixed region with a quasi-stable initial configuration, as described in Board and Hall
[47]. In this phase, contact of a hot liquid (corium) with a cold volatile liquid (water)
results in a stable vapor film around the molten masses breaking up, allowing large
quantities of melt and water to intermix.
Fig. 2-1: Schematic sketch of a thermal
detonation (Buck et al., 1997
[42])
Steam explosion phenomena in reactor applications
8
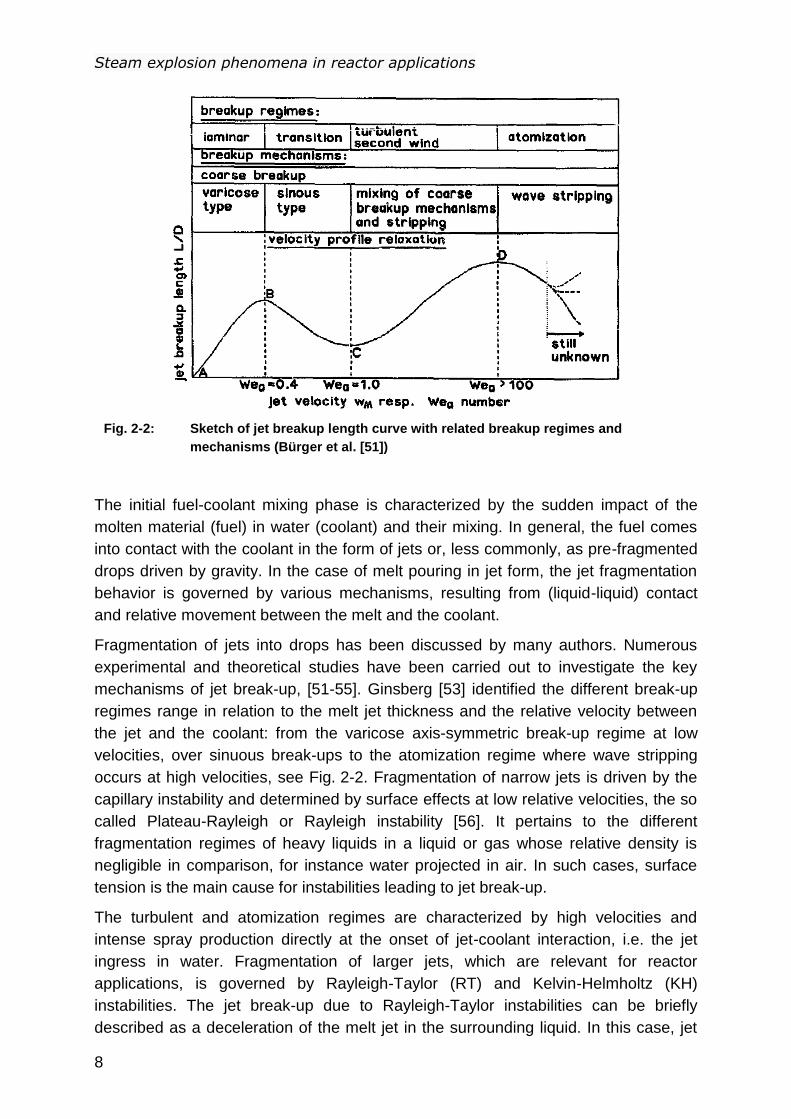
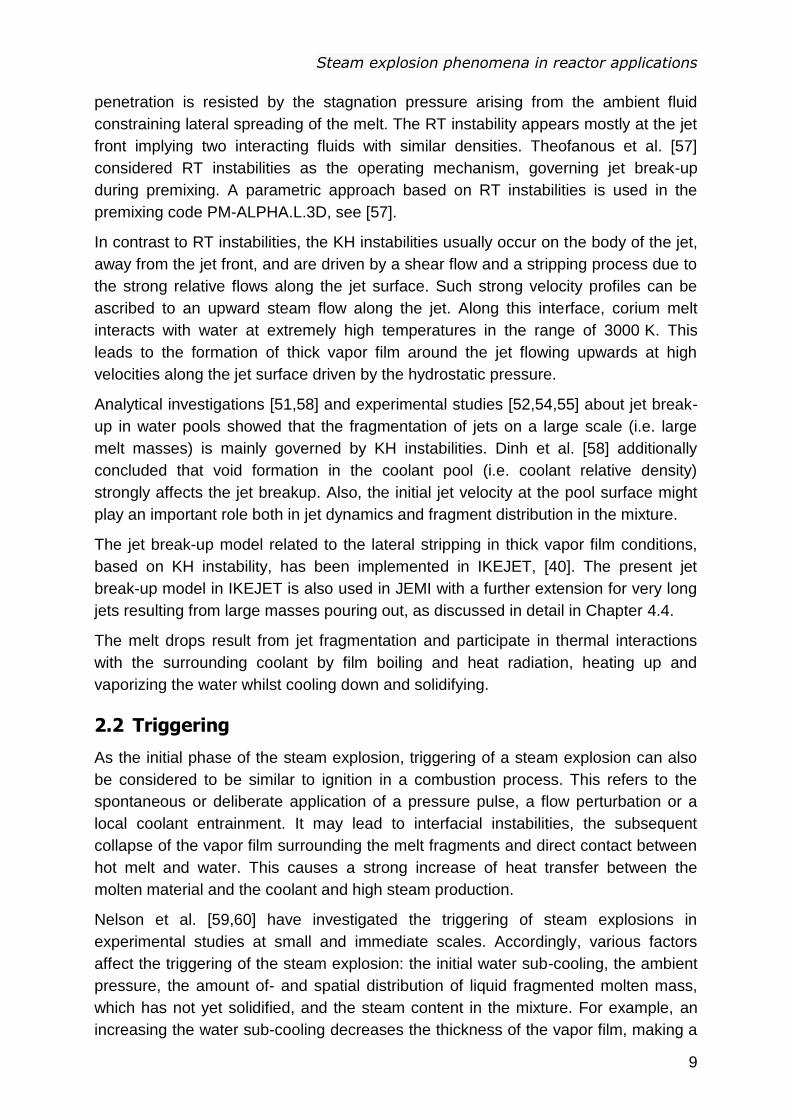
Fig. 2-2: Sketch of jet breakup length curve with related breakup regimes and
mechanisms (Bürger et al. [51])
The initial fuel-coolant mixing phase is characterized by the sudden impact of the
molten material (fuel) in water (coolant) and their mixing. In general, the fuel comes
into contact with the coolant in the form of jets or, less commonly, as pre-fragmented
drops driven by gravity. In the case of melt pouring in jet form, the jet fragmentation
behavior is governed by various mechanisms, resulting from (liquid-liquid) contact
and relative movement between the melt and the coolant.
Fragmentation of jets into drops has been discussed by many authors. Numerous
experimental and theoretical studies have been carried out to investigate the key
mechanisms of jet break-up, [51-55]. Ginsberg [53] identified the different break-up
regimes range in relation to the melt jet thickness and the relative velocity between
the jet and the coolant: from the varicose axis-symmetric break-up regime at low
velocities, over sinuous break-ups to the atomization regime where wave stripping
occurs at high velocities, see Fig. 2-2. Fragmentation of narrow jets is driven by the
capillary instability and determined by surface effects at low relative velocities, the so
called Plateau-Rayleigh or Rayleigh instability [56]. It pertains to the different
fragmentation regimes of heavy liquids in a liquid or gas whose relative density is
negligible in comparison, for instance water projected in air. In such cases, surface
tension is the main cause for instabilities leading to jet break-up.
The turbulent and atomization regimes are characterized by high velocities and
intense spray production directly at the onset of jet-coolant interaction, i.e. the jet
ingress in water. Fragmentation of larger jets, which are relevant for reactor
applications, is governed by Rayleigh-Taylor (RT) and Kelvin-Helmholtz (KH)
instabilities. The jet break-up due to Rayleigh-Taylor instabilities can be briefly
described as a deceleration of the melt jet in the surrounding liquid. In this case, jet
Steam explosion phenomena in reactor applications
9
penetration is resisted by the stagnation pressure arising from the ambient fluid
constraining lateral spreading of the melt. The RT instability appears mostly at the jet
front implying two interacting fluids with similar densities. Theofanous et al. [57]
considered RT instabilities as the operating mechanism, governing jet break-up
during premixing. A parametric approach based on RT instabilities is used in the
premixing code PM-ALPHA.L.3D, see [57].
In contrast to RT instabilities, the KH instabilities usually occur on the body of the jet,
away from the jet front, and are driven by a shear flow and a stripping process due to
the strong relative flows along the jet surface. Such strong velocity profiles can be
ascribed to an upward steam flow along the jet. Along this interface, corium melt
interacts with water at extremely high temperatures in the range of 3000 K. This
leads to the formation of thick vapor film around the jet flowing upwards at high
velocities along the jet surface driven by the hydrostatic pressure.
Analytical investigations [51,58] and experimental studies [52,54,55] about jet break-
up in water pools showed that the fragmentation of jets on a large scale (i.e. large
melt masses) is mainly governed by KH instabilities. Dinh et al. [58] additionally
concluded that void formation in the coolant pool (i.e. coolant relative density)
strongly affects the jet breakup. Also, the initial jet velocity at the pool surface might
play an important role both in jet dynamics and fragment distribution in the mixture.
The jet break-up model related to the lateral stripping in thick vapor film conditions,
based on KH instability, has been implemented in IKEJET, [40]. The present jet
break-up model in IKEJET is also used in JEMI with a further extension for very long
jets resulting from large masses pouring out, as discussed in detail in Chapter 4.4.
The melt drops result from jet fragmentation and participate in thermal interactions
with the surrounding coolant by film boiling and heat radiation, heating up and
vaporizing the water whilst cooling down and solidifying.
2.2 Triggering
As the initial phase of the steam explosion, triggering of a steam explosion can also
be considered to be similar to ignition in a combustion process. This refers to the
spontaneous or deliberate application of a pressure pulse, a flow perturbation or a
local coolant entrainment. It may lead to interfacial instabilities, the subsequent
collapse of the vapor film surrounding the melt fragments and direct contact between
hot melt and water. This causes a strong increase of heat transfer between the
molten material and the coolant and high steam production.
Nelson et al. [59,60] have investigated the triggering of steam explosions in
experimental studies at small and immediate scales. Accordingly, various factors
affect the triggering of the steam explosion: the initial water sub-cooling, the ambient
pressure, the amount of- and spatial distribution of liquid fragmented molten mass,
which has not yet solidified, and the steam content in the mixture. For example, an
increasing the water sub-cooling decreases the thickness of the vapor film, making a
Steam explosion phenomena in reactor applications
10
vapor film collapse, as well as triggering of the mixture, likelier. With increasing
ambient pressure, the vapor film density increases and the film becomes more stable
against pressure pulses.
In an experimental study with both a small amount of melt and single drops,
performed by Abe et al. [61], trigger mechanisms of the vapor explosion have been
investigated using tin, lead, zinc and aluminum for the melt and water as coolant.
Abe et al. [61] identified that the vapor explosion cannot be triggered if solidification
of the melt drop is achieved.
2.3 Explosion propagation
Small and intermediate scale experiments using corium in the composition of the
melt have not led to large detonations [21,44]. On the contrary, equivalent melts
replicating molten fuel, using for instance alumina [21], oxides of iron and cobalt
[59,60] have mostly resulted in violent explosions with high pressure peaks up to
70 MPa. This requires a deeper analysis of possible limiting effects during the
explosion phase.
Central enhancing and limiting factors affecting steam explosion process results from
the premixing phase. Restricted melt mass in the mixture (melt fragments from the jet
break-up) limits the ability of the pressure to escalate rapidly. This can occur both
locally in sparse mixture regions and globally as a result of incomplete jet break-up.
On the other hand, a dense mixture generates a high void, which counteracts
pressure escalations due to its compressibility decreasing the explosion strength.
The melt drop size resulting from the jet break-up during premixing plays an
important role in steam explosions. Here, smaller drops lead to a quicker fine
fragmentation during the shock wave propagation allowing the pressure to rise
steeper. However, smaller drops generate more steam during premixing, which
counteracts the pressure increase due to its compressibility. Moreover, the smaller
drops solidify quicker. The solid crust forming on the drop‟s surface constrains or
even inhibits the fine fragmentation required for ultra-fast heat exchange and the
generation of pressure pulses. On the contrary, larger drops fragment slower. Thus,
the contribution to pressure increases from larger drops is significantly smaller. But,
the larger drops remain significantly longer liquid, potentially leading to a steam
explosion. Solidification during premixing is a possible explanation for the difference
in explosion strength between the experiments with corium and alumina melts
[62,63]. The solidification of melt drops is discussed in detail in Chapter 4.7.
Other effects playing a role in the explosion propagation are generally of a
geometrical nature. The geometrical effects concern the reduction and enhancement
effects of pressure waves by 2D expansion or lateral geometrical restrictions and
reflections on free surfaces (explosion venting). Investigations and results related to
geometrical limitations are presented in Chapter 7.
Steam explosion phenomena in reactor applications
11
2.4 Explosion expansion
A steam explosion performs work whilst expanding. The expansion of the resulting
high-pressure mixture behind the propagation front, see Fig. 2-1, determines the
damage potential of a steam explosion on the surrounding structures. The kinetic
energy of this high-pressure mixture may be transmitted to the materials around the
interaction zone, thus generating missiles with more or less mass, which are likely to
threaten the integrity of the surroundings, both in-vessel and ex-vessel.

Steam explosion phenomena in reactor applications
12
Need of three-dimensional modeling for reactor applications
13
3 Need of three-dimensional modeling for reactor
applications
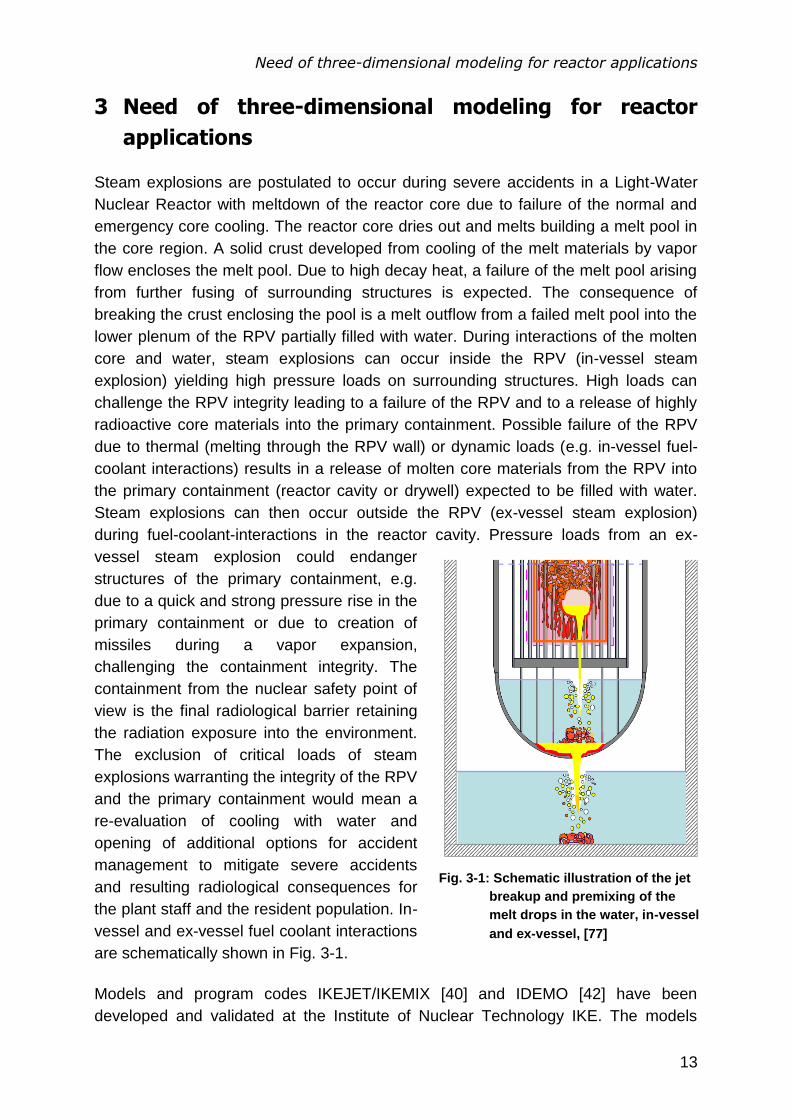
Steam explosions are postulated to occur during severe accidents in a Light-Water
Nuclear Reactor with meltdown of the reactor core due to failure of the normal and
emergency core cooling. The reactor core dries out and melts building a melt pool in
the core region. A solid crust developed from cooling of the melt materials by vapor
flow encloses the melt pool. Due to high decay heat, a failure of the melt pool arising
from further fusing of surrounding structures is expected. The consequence of
breaking the crust enclosing the pool is a melt outflow from a failed melt pool into the
lower plenum of the RPV partially filled with water. During interactions of the molten
core and water, steam explosions can occur inside the RPV (in-vessel steam
explosion) yielding high pressure loads on surrounding structures. High loads can
challenge the RPV integrity leading to a failure of the RPV and to a release of highly
radioactive core materials into the primary containment. Possible failure of the RPV
due to thermal (melting through the RPV wall) or dynamic loads (e.g. in-vessel fuel-
coolant interactions) results in a release of molten core materials from the RPV into
the primary containment (reactor cavity or drywell) expected to be filled with water.
Steam explosions can then occur outside the RPV (ex-vessel steam explosion)
during fuel-coolant-interactions in the reactor cavity. Pressure loads from an ex-
vessel steam explosion could endanger
structures of the primary containment, e.g.
due to a quick and strong pressure rise in the
primary containment or due to creation of
missiles during a vapor expansion,
challenging the containment integrity. The
containment from the nuclear safety point of
view is the final radiological barrier retaining
the radiation exposure into the environment.
The exclusion of critical loads of steam
explosions warranting the integrity of the RPV
and the primary containment would mean a
re-evaluation of cooling with water and
opening of additional options for accident
management to mitigate severe accidents
and resulting radiological consequences for
the plant staff and the resident population. In-
vessel and ex-vessel fuel coolant interactions
are schematically shown in Fig. 3-1.
Models and program codes IKEJET/IKEMIX [40] and IDEMO [42] have been
developed and validated at the Institute of Nuclear Technology IKE. The models
Fig. 3-1: Schematic illustration of the jet
breakup and premixing of the
melt drops in the water, in-vessel
and ex-vessel, [77]
Need of three-dimensional modeling for reactor applications
14
address the breakup of melt jets, mixing of fragmented melt and coolant, detonation,
fine fragmentation and propagation of shock waves in the mixture of melt, steam and
water. The program codes allow a better understanding of the steam explosion
phenomena, the analysis and prediction of resulting loads at the surroundings. The
assessment of that impact is of crucial importance for the reactor safety supporting
its continuous improvement in the nuclear power plants worldwide. The programs
simulate the premixing (by IKEJET/IKEMIX) and explosion (by IDEMO) stages of a
steam explosion in a two-dimensional approach in plane and cylindrical geometry.
The models address primarily the central physical effects which act limiting or
enforcing for steam explosions:
Fragmentation of melt during the contact with water. It describes the entry of
fragmented melt into water. Both the fragmentation rate and resulted fragment
size play an important role during the premixing and explosion.
High void in the mixture during the premixing due to high melt temperature. It
affects the heat exchange between melt and coolant.
High void in the mixture during the explosion. Due to high compressibility, high
steam content acts dampening for local pressure escalation strongly limiting
the buildup of shock waves and fine fragmentation of melt.
Reflexion of pressure waves at free surfaces and adjacent structures.
Reflecting waves can have both effects: escalating and counteracting. This
depends merely on mixture configuration and geometry determining the
direction and intensity of reflexion.
Velocity compensation between melt drops and coolant in a shock wave
traveling through the mixture [64]. This occurs primarily in regions with high
melt concentration limiting the fine fragmentation.
Further effects affecting the steam explosion (not considered by the 2D models) are
to be mentioned here. The first is the solidification at the surface of melt drops during
the premixing with coolant. The second is possible asymmetries in the mixture due to
geometrical constraints and confinements. The solidification of melt drops always
acts limiting for steam explosions, since a solid crust at the drop surface inhibits or
even prevents the drop fine fragmentation during the explosion stage reducing the
melt mass participating in the explosion process. Solidification occurs even with high
melt temperatures due to the high solidus temperature and the low thermal
conductivity of corium. Asymmetries during premixing are expected generally by non-
symmetric configurations, e.g. during a sideways melt pouring into water or melt
pouring with multiple jets.
Configurations with lateral pouring from the melt pool are supposed to be most likely,
since the hottest region in the pool is assumed to be at the upper boundary due to
natural heat convection. Scenarios with pool failing on the bottom were still thinkable
due to a complex set of thermal loads. However, the development of large melt pools

Need of three-dimensional modeling for reactor applications
15
with critical melt masses is questionable and strong loads can be excluded for
explosion scenarios with bottom outflows. In general, a failure of a melt pool leading
to melt relocation is expected due to lateral growth of the melt pool and fusing the
sideways structures (e.g. core barrel or RPV wall) with its potential failure.
Configurations with lateral melt outflows are physically limited by the outflow mass
flow rate and velocity. Since the outflow location is expected at upper boundaries, the
first local opening leads to quick lowering of the pool level reducing the hydrostatic
head and decreasing the melt outflow velocity. Decrease of the outflow velocity
restrains the growth of the opening where the melt flows out. Thus, openings cannot
increase unlimited. Potentially, melt jets with limited diameter lower than 40 cm and
small outflow velocity ~ 1 m/s are expected during melt pouring from a melt pool in
the core region. In contrast, higher outflow velocities and thus larger mass flow rates
are expected in ex-vessel scenarios due to a moderate overpressure inside the RPV.
In ex-vessel scenarios, a lateral failure of the RPV due to thermal loads is rather
thinkable than a bottom-break of the RPV. After relocation of molten core materials
into the lower plenum of the RPV, a lateral break through the RPV wall is rather
likely, since the hottest spot is located in the top region of the melt pool due to heat
convection. In addition, a lateral “fish-mouth” breach of RPV due to thermal loads and
a moderate overpressure can be also considered. This causes a sideways distributed
melt outflow, so-called “multiple jets”, in form of a corona providing an initially better
distribution of large melt masses with limited void. Non-symmetric initial pouring can
lead to asymmetries in mixtures with local concentrations of melt causing strong local
evaporation and void buildup. The latter supports the occurrence of pressure relief
paths and extension paths of the mixture. The occurrence of such paths strongly
depends upon geometrical constraints. The short-term de-voiding of the mixing
region especially of regions with high melt concentrations in direct proximity to
structures (e.g. RPV or cavity wall) is quite thinkable due to the difference in the
density between vapor and melt during strong mixture fluctuations. High melt
concentration in combination with reduced void can support high pressure loads
during the explosion phase. Even diluted mixtures with well-distributed melt (low melt
content) and limited void can yield strong pressure escalations over long distances
during the explosion phase. Also, sparse regions interacting with dense regions can
act sustaining or even enforcing to pressure escalations increasing their damage
potential. Due to complex interrelation between the factors, it is impossible to analyze
these in a separate manner using 2D description.
Summarizing all these factors, the extension and distribution of melt and void due to
geometrical constraints is considered to be the central question posed by typical
three-dimensional accident configurations, such as lateral or multiple melt pouring
into water. The mixture extension (dilution) causes a decrease of the melt
concentration and a reduction of the steam content in the mixing zone due to formally
a “stretching” of the mixing region. High melt concentrations at adjacent structures
expecting in non-symmetric configurations support pressure escalations by high
Need of three-dimensional modeling for reactor applications
16
concentrations of thermal energy. On the other side, such concentrations also cause
a very intense evaporation in those regions counteracting local pressure buildup.
Void reduction as a result of mixture extension always means an increase of
pressure loads as a consequence. Reduction of void in the mixing zone has a large
impact on solidification of melt drops by intensifying the heat exchange between melt
and coolant due to stable film boiling.
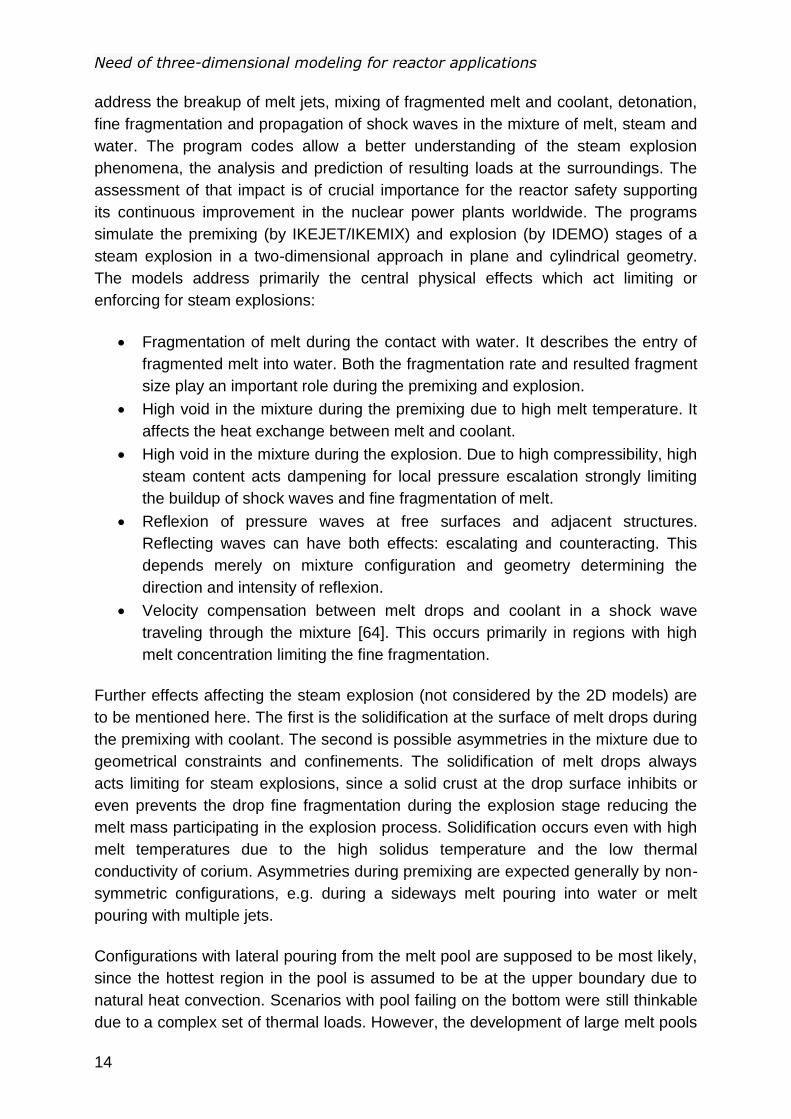
Fig. 3-2: Non-symmetric melt jet in lower plenum of the RPV (left), variation of radial
extension of the calculation domain using 2D approximations in cylindrical
coordinate system
Such complex and multifaceted interactions can be dealt using 2D models only in a
limited consideration. Previously, investigations to non-symmetric configurations
have been carried out using two-dimensional approximations. For example, for a
non-symmetric melt jet close to the RPV wall, a set of calculations with various radial
extensions in cylindrical geometry or plane cuts with various deepness have been
used for investigating the premixing and the escalation stages of steam explosion.
Fig. 3-2 shows an example for an analysis of an asymmetric melt jet pouring into the
lower plenum of the RPV close to the RPV wall. The calculation domain radius has
been varied in the cylindrical coordinate system. This case was investigated in [65].
This procedure shows weaknesses concerning the mixture extension. By the
smallest radial extension, strong concentration of melt can be implied leading to high
voiding of the mixing zone. By larger radial domain extensions, the effect of the RPV
wall cannot be adequately considered. The largest melt mass in region with limited
void was obtained by intermediate distances. The main question addressed the radial
and azimuthal extension of the mixture from the regions close to the wall due to high
Need of three-dimensional modeling for reactor applications
17
vaporization and pressure buildup. In the explosion phase, the proximity of structures
affects the reflexion of pressure waves. By smaller radial extensions, pressure waves
reflect from the wall and focus on the mixture which is locating in so-called “focal
point”. This acts enforcing for pressure escalations and loads, which are strongly
overestimated in this case. The larger extensions show sufficiently weaker effect of
the wave reflexion due to increasing distance to the wall. The truth might be
somewhere between the smallest and larger radial extensions. On the water-rich
side, stronger dampening effects of water and weaker reflexions are expected for
sparser well-extended mixtures. On wall sides, wave reflexions are expected to have
a stronger influence. The investigations using the 2D approximations showed open
issues concerning the real extension of the mixture in pronouncedly 3D
configurations due to existing uncertainties. It was considered as questionable and
far from reality.
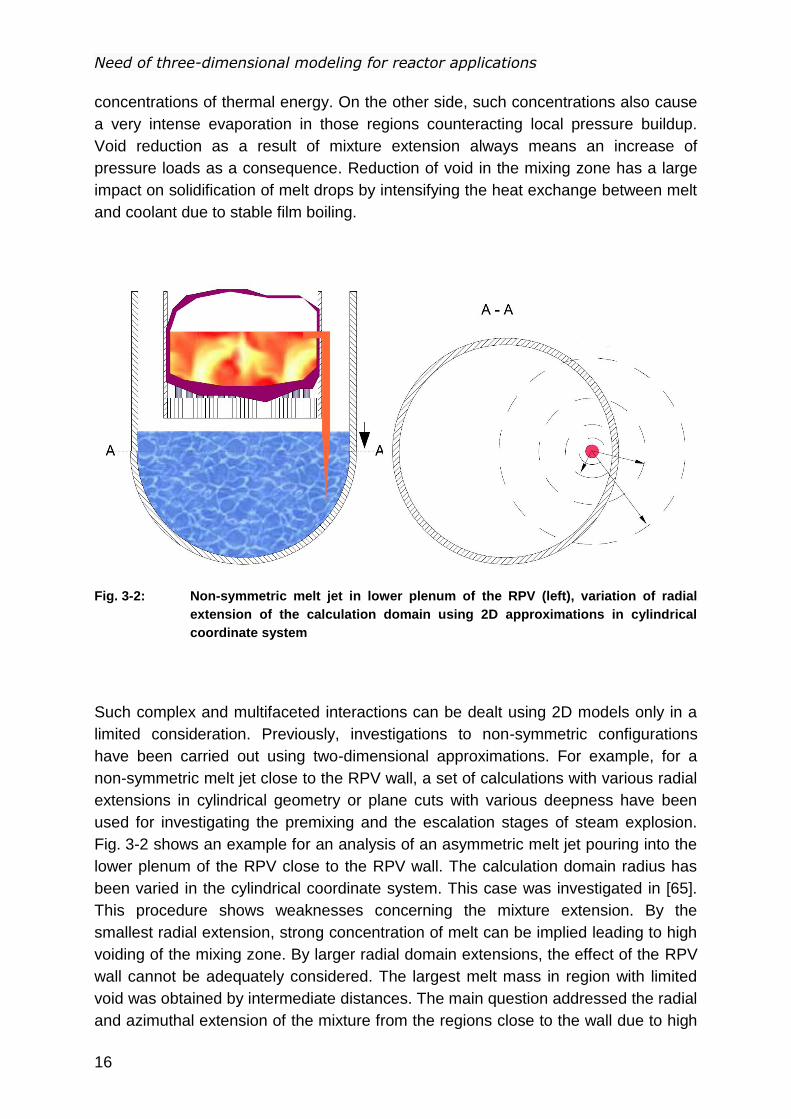
Fig. 3-3: Multi-jet configuration with 25 jets using 2D approximations in cylindrical
coordinate system, extracted from [66].
In the frame of the OECD project SERENA [66], an in-vessel scenario with the
configuration of 25 melt jets have been considered pouring into the lower plenum of
the RPV, see Fig. 3-3. The aim of this investigation was to postulate a case with as
large as possible melt mass mixing with water. The case postulates a scenario with
the following initial conditions: core melting, melt pool building, melt fusing through
the core support plate and pouring in form of multiple jets into the lower part of RPV.
The melt jets are azimuthally distributed. All 25 melt jets are represented by 2D
models as 3 jets in a radial cell with different melt fraction. This causes a dilution of
melt content and an azimuthal smearing. The calculations have been performed
using 2D premixing and explosion models in cylindrical geometry. The calculations
Need of three-dimensional modeling for reactor applications
18
showed a very high void in the premixing stage and as a result weak pressure
escalations during the detonation. The high void is caused by large mass of melt
leading to strong steam production as well as rather by constraining for steam
escape from the mixing zone and radial extension of the void cloud due to
neighboring melt jets.
During the premixing, only the mixture extension in radial and axial direction can be
considered by 2D models. The fluid exchange, i.e. the steam outflow and water
inflow in the spaces between the melt jets are expected to play an important role
during the premixing, since this reduces the void in the mixing zone. Without
considering coolant fluctuations in azimuthal direction, the void in mixture is strongly
overestimated and thus the mixture explosiveness is underestimated. The
solidification of melt drops depends on the flow regimes and accordingly on steam
content. Higher void in mixture then means weaker limiting effect of solidification and
crust formation.
During the explosion phase, the propagation of the shock wave is also considered
only in radial and axial directions. This leads to artificially concentrations of pressure
escalations in the center of the calculation domain during the back-running of the
shock wave. However, interactions between individual melt jets and mixture regions
can act either dampening or enforcing. As a result of this complex interplay of
particular effects, an adequate prediction of the explosion strength and resulting
pressure loads for scenarios with multiple melt pouring cannot be done in a
conservative manner.
Central effects on steam explosion strength are determined: void in mixing zone, melt
solidification, lateral extension of void and melt fragment and development of
explosion waves. The use of 2D approximations to typical 3D reactor scenarios is
questionable due to complex interactions between the melt, coolant and geometry.
Thus, it requires an extension of the existing models IKEJET/IKEMIX and IDEMO, in
order to provide a tool for analyses of steam explosions in real reactor applications.
Three-dimensional premixing model JEMI
19
4 Three-dimensional premixing model JEMI
The program code JEMI (JEt fragmentation and preMIxing) is a three-dimensional
version of IKEJET/IKEMIX developed at IKE for modeling the premixing phase of
vapor explosions, presented by Pohlner et al. [40]. IKEJET/IKEMIX describes the
fragmentation of molten jets under film boiling pouring into water, the mixing of melt
fragments with coolant, heat exchange between melt fragments and surrounding
coolant, cooling of the fragments, evaporation and re-condensation of the coolant,
settling process of melt drops and the formation of debris beds. In the multi-fluid
model of IKEJET/IKEMIX, three phases are considered: melt drops, liquid water and
steam each having separate velocities and temperatures. The phases are modeled
according to quasi-continuum Eulerian approach. The jet breakup formulation is
based on the Kelvin-Helmholtz (KH) model of wave growth due to steam flow along
the jet driven by hydrostatic head, see in detail [40,51]. The coherent jet length, the
local rate of the fragmentation and mass release as well as the drop sizes are
determined separately and represented as a line source of fragments in the separate
module IKEJET.
In the scope of the present work the IKEJET/IKEMIX program code has been
extended to the 3D version JEMI. The three-dimensional program code JEMI
additionally offers a set of extensions performed in order to fit the applicability of the
model for reactor scenarios. The jet breakup approach proposed by Bürger et al. [51]
has been extended in consideration of the fragmentation of thick melt jets in deep
water pools. This configuration is common during the pouring of large melt masses
due to failure of the reactor pressure vessel and large breaks in it. Scenarios with
large melt masses are expected to have a strong damaging character due to a high
potential for the energy release and heat exchange between fuel and coolant. The
melt fragments from the jet breakup are represented in JEMI by a Lagrangian
formulation, i.e. as single particles or clusters of particles. This allows one to track of
each particle avoiding the “smearing” of the melt data within the Eulerian field, i.e.
averaging the melt enthalpy and velocities of all particles in the respective discrete
cell. Further, the solidification and crust formation at the surface of melt drops, which
come from a fragmenting jet and fall in water, is modeled using CFOR (Crust
FORmation) model. The CFOR model is initially based on a surface temperature
drop approach for a single spherical particle, proposed by Moriyama et al. [36]. This
approach has been extended by the author in the present work considering two
different temperature profiles in liquidus and solidus regions. The solidification
enthalpy (heat of fusion) is described as solidification front and represented as a line
source of heat between liquidus and solidus regions.
The objective of this chapter is to refer the basic modeling attributes (performed in
IKEJET/IKEMIX [40], adopted and extended in JEMI) and to show the modeling
extensions newly developed for JEMI.
Three-dimensional premixing model JEMI
20
4.1 Mathematical model
The JEMI two-fluid formulation uses a separate set of conservation equations of the
coolant for each phase. The influence of one phase on another is considered by
interaction terms (i.e. the interfacial drag force, phase change, interfacial heat
transfer) appearing in the equations. The system of governing equations comprises
one constraint equation, two continuity equations, 6 momentum equations, three
energy equations for the fluid phases. Compared to IKEJET/IKEMIX, no continuity
equation of the melt phase is considered in JEMI due to the Lagrangian approach
used for the melt drops. The continuity of the melt phase is satisfied by considering
the fragmentation (creation) and settling (destroying) processes in JEMI. From
creation to destroying, no mass exchange is considered. Also, the momentum
exchange between coolant and melt takes place in a separate formulation.
Conservation of mass
The conservation equations for the coolant phases are given for gas and liquid
phases, respectively:
evapggggg v
t
(4-1)
evaplllll v
t
(4-2)
where is the volume fraction and the density of the liquid and gaseous fluid
phases. Phase change term evap means a mass transfer rate due to
evaporation/condensation. evap can distinguished in two parts: fb as the
evaporation due to hot melt droplets under film boiling (fb) and bulk as the
evaporation/condensation at the water/steam interfaces (bulk) of steam bubbles and
water droplets, thus
bulkfb
evap (4-3)
The volume fractions of fluid have to obey the volume constraint equation
lg (4-4)
where stands for the porosity. The porosity is determined in due consideration of
the melt and jet fractions in the respective volume.
Conservation of momentum
For the gas phase, the momentum conservation equation is given by
lgpgpggggggggggg vvKvvKvvgpv
t
lg)( , (4-5)
and for the liquid phase by
Three-dimensional premixing model JEMI
21
glplplllllllllll vvKvvKvvgpv
t
lg)( (4-6)
where the term with Kpg and Kpl denotes friction between melt and respective coolant
phase (for details see Section 4.2), with Klg interfacial friction between steam and
water. Convection of momentum and momentum transfer by phase change are
presently not taken into account.
Conservation of energy
The energy conservation equation for the vapor given by
gcvvvfilmvradfbvvvvvvv QQhheve
t,int,,
(4-7)
and for liquid by:
int,,, llradlfblllllll QQQevet
(4-8)
where lfbQ , and lradQ , are the partial heat flux terms for film boiling (fb) and heat
radiation (rad) due to heat transfer between melt droplets and fluid phases.
Vaporization (condensation) due to existence of superheated/subcooled coolant int,vQ
and int,lQ produces vapour / water with saturation temperature satT and specific
enthalpy lv hh / . The terms int,vQ and int,lQ are the volumetric heat flux from the
respective coolant phase to the interface. Here, int,vQ characterizes the heat
transferred from the vapor film into the subcooled water, also containing the heat
radiation contribution into the liquid water occurring under film boiling. The term int,lQ
concerns the heat transfer from the liquid water to the vapor film.
gcvQ , means the heat flux due to gas cooling (gc). Vapor from film boiling and
radiation is produced with film temperature satfilmv TT , and specific enthalpy filmvh , .
Existence of subcooled water leads to partitioning of the total energy into film boiling
and radiation due to heatup of water. fb describes the mass exchange contribution
from film boiling and rad from heat radiation:
lfblfilmvfbtotfb QhhQ ,,,
lfilmv
lfbtotfb
fbhh
,
,, (4-9)
lradlfilmvradtotrad QhhQ ,,,
lfilmv
lradtotrad
radhh
,
,, (4-10)
Energies connected with heatup of masses from phase transition do not appear in
this representation since bulk enthalpies lv hh , are applied in the
evaporation/condensation description:

Three-dimensional premixing model JEMI
22
lv
lv
radfbevhh
,int,int (4-11)
The total volumetric heat flux at the melt side (from the melt drops presented in
Lagrangian formulation to coolant) is expressed as:
totdtotevdtotd
cellnp
n
nradnfbnkji
cellnp
n
nnkjitotradtotfbtotd
QQQ
qqAVqAVQQQ
int,,,,,
_
1
,,,,
_
1
,,,,, (4-12)
where kjiV ,, is the volume of the corresponding cell and
cellnp
n
nn qA_
1
is an integral of the
surface heat flux from each single melt particle nq with the surface area nA over all
melt drops in this cell cellnp _ .
totdQ int,, means the total heat transfer from melt to fluid without phase change. This
heat transfer is directed to the interface of steam and water, directly via radiation and
conduction over the steam film. totdQ int,, also contains the heat input into the vapor film
for heatup to filmvT , . The term totevdQ ,, describes the contribution of the heat transfer
from the melt phase to the phase change, here evaporation.
The heat exchange between melt and coolant at the melt side is further discussed in
Section 4.6.
4.2 Constitutive laws
Exchange between melt and coolant
The melt drops are represented in JEMI as mass points using a Lagrangian
approach. The drag between a single melt drop and the coolant phases is expressed
in Section 4.5 in Eq. 4-56. Applying the Lagrangian description of melt into Eulerian
field, the drag force of a single particle is multiplied with the number of particles in the
respective discrete volume and divided by the volume of the corresponding cell:
p
p
m
p
p
pl FDV
Fnf
3
6
, (4-13)
and for the gaseous phase:
p
p
m
p
p
pg FDV
Fnf
3
6
, (4-14)
where n is the number of particles in the respective discrete volume and pD is the
mean drop diameter. The indices p , l and g mean melt particles, liquid and gas,
respectively. The phase drag terms can be expressed by
Three-dimensional premixing model JEMI
23
p
p
m
p
p
plpl FDV
FnvvK
3
6)(
(4-15)
and
p
p
m
p
p
pgpg FDV
FnvvK
3
6)(
. (4-16)
Exchange between the coolant phases
The formulation of the momentum exchange between the liquid and vapor is taken
from IKEJET/IKEMIX [40]. Accordingly, the phase momentum exchange is
determined by flow patterns. Vapor bubbles in the water-continuous regime result
from film boiling, while water droplets are assumed in the steam-continuous regime.
Here, 3.0, boundl and 7.0, baoundg are considered as the boundaries for both
regimes. Transition regime is assumed between the boundaries, for which an
interpolation is applied according to respective parts of the limiting configurations.
Interfacial friction between liquid and vapor is formulated for three regions: flow of
vapor bubbles in liquid ( 3.0g ), churn-turbulent flow ( 7.03.0 g ) called as
transition flow and flow of liquid drops in vapor ( 7.0g ).
Bubbly flow 3.0g :
lglD
gl
l
g
gvvC
DK
4
3lg (4-17)
with
2
lg
l
critg vv
WeD
(4-18)
using the criterion for critical Weber number Wekrit = 8 and with
.)1(f,f67,18
f67,171
3
2 5.1
27/62/1
vl
vD
gDC
(4-19)
Dg is dropped from the friction term Klg. The bubbles move in form of clusters with a
steady velocity that does not depend on the bubble size.
Churn-turbulent flow 7.03.0 g :
According to
Three-dimensional premixing model JEMI
24
lglD
gl
l
g
gvvC
DK
4
3lg (4-20)
with
,4
2/1
l
gg
D
(4-21)
and with
.)1(3
8 2
gDC (4-22)
Drag coefficient DC is resulted from the effective value 8/3 and from the approach for
the averaged volumetric flux of the reference flow [67].
5,1
27/62/1
)1(f,f67,18
f67,171.
3
2g
lgD
gDC
(4-23)
From Eqs. (4-21) and (4-22) for churn-turbulent flow:
.)1(3
2 2
2/1
gl
gD
gDC
(4-24)
Further reduction of friction comes with the transition into the flow regime with
.
Flow of liquid drops in vapor :
lggD
lg
g
l
l vvCD
K
4
3lg (4-25)
with
,2
lgg
critl
vv
WeD
(4-26)
using for critWe =12, and with the drag coefficient
3
27/6
2/1
f,f67,18
f67,171
3
2g
llD
gDC
(4-27)
Here, the replacement of von l by g essential – steam instead of water as
continuous phase.
The calculations performed in the frame of the international OECD project SERENA
[45], particularly for FARO L-28, yielded generally a strong void buildup in the
mixture, which was considered as too high in comparison to the experimental
7.0g
7.0g
Three-dimensional premixing model JEMI
25
indications, as discussed in [66]. Especially, the constant pressure rise over 5 s was
impossible to achieve in the calculations due to too high void and weak steam
production. The first indication was too high interfacial friction to remove the vapor
from the mixing region. With a strong reduction factor of 310 on the interfacial friction
force for more rapid steam removal and lower void in the mixture, it was able in the
calculations to obtain the experimental pressure buildup. As in IKEJET/IKEMIX [40]
so in JEMI, a reduction factor 3
int 10fricf on friction coefficient is assumed.
lgint
*
lg KfK fric (4-28)
Reduction of interfacial friction has been further discussed in details by many
authors; see [40,64,68,69].
4.3 Numerical solution method
For spatial discretization of the differential equations, a finite volume method is
applied. For temporal discretization, implicit scheme based on backward differences
are used. The non-linear coupled equation system from the discretized conservation
equations is solved with a segregated procedure. The numerical scheme for the
solution of the non-linear coupled system of differential equations is based on the
SIMPLE algorithm, proposed by Caretto et al. [70], and adapted for solving the given
problem. For spatial discretization, a staggered grid method is used. Variables like
pressure, temperatures, densities are located at the cell centers of each cell (cell
center of cell (i,j,k) marked by a dot in Fig. 4-1). Unlike this, the velocities are located
with their normal components at the respective cell boundaries.
Fig. 4-1: Sketch and nomenclature of locations on a staggered grid.
In the present work, the equation system has been extended. The transient term has
been added in the momentum equations. The aim was to manage complex numerical
Three-dimensional premixing model JEMI
26
feedback effects in 3D due to more complexity in the numerics. The data from the
previous time step (i.e. densities, fractions and velocities) is used:
Gas:
0,
0,)(0 lg
__
ifv
ifvvvKvvKvvgpv
t g
e
lgpgpgggggggg
termtransient
ggg
(4-29)
Liquid:
0,
0,)(0 lg
__
ifv
ifvvvKvvKvvgpv
t g
e
glplpllllllll
termtransient
lll
(4-30)
This stabilizes the numerical approach decreasing the number of required iterations
for solving the linearized conservation equations. Secondly, the considering the data
of the previous time step supports the increase of the time step, which accelerates
the calculation and reduces the computational costs.
When a Newton type of solver is used, the non-linear terms need to be linearized
with respect to the primitive terms, namely the volume fraction , pressure p and
temperature T . For the purpose of linearization, the non-primitive (non-linear)
variables, such as mass flux iii vA , where i refers to the respective fluid phase
is expressed with respect to the primitive terms. The momentum equations are
linearized, in contrary to [70], with respect to phase volume fraction and pressure
being solved within the continuity equations for each phase.
i
i
ii
i
ii p
pp
),( (4-31)
where i refers to the respective fluid phase.
The energy equations are linearized with respect to the phase temperature using the
new phase velocities calculated before.
i
i
ii T
TT
)( (4-32)
Due to the implicit time discretization, the mass and momentum conservation
equations as well as the energy conservation equations have to be solved iteratively.
This is done in JEMI as follows. First, the momentum equations for gas and liquid are
solved for the gas and liquid velocities, using actual values of saturation and
pressure.
0.
0.
.
2
ifu
t
uuKv
Kgp
ift
KK
ue
e
gg
old
g
g
e
e
g
eg
p
g
pg
g
gg
egpg
gnew
g
(4-33)

Three-dimensional premixing model JEMI
27
0.
0.
.
2
ifu
t
uuKv
Kgp
ift
KK
ug
g
ll
old
ll
g
g
l
eg
p
l
pl
lll
egpl
lnew
l
(4-34)
Then, the calculated velocities are inserted in the mass conservation equations of
gas and liquid. Applying the Newton type method the mass conservation equations
are used to calculate corrections for the pressure and saturation so that the mass
flow rates calculated with the corrected pressures and saturations satisfy the discrete
mass conservation equations. This involves the linearization of the terms in the mass
conservation equations with respect to saturation and pressure, including the
dependence of the velocities on these. Successively, the energy equations are
linearized with respect to temperature using the new velocities calculated above. The
mass conservation equations are solved to determine the corrections for
temperature. This iterative procedure has to be repeated until the calculated
corrections for pressure, volume fractions and temperature satisfy the residuum
conditions. Once the corrections are smaller than the defined residuum, the time step
is completed. In case the maximum iteration steps are reached, the procedure is to
be continued with a halved time step.
In order to avoid numerical oscillations of liquid and gas velocities in the solution of
the linearized momentum conservation equations, a dynamic dampening factor dyn
on pressure and phase corrections is considered:
*
*
max
*
*
max ,,0.1mincorrcorr
dynp
p
(4-35)
*
corrp is resulted from the solution of the linearized conservation equations. *
maxp is
maximally allowable pressure correction in each iteration for avoiding large
corrections and making the converging process smoother. It is used additionally to
the standard relaxation factor ω in the solution approach. The final pressure
correction can be expressed as a product of the resulted pressure correction and of
both relaxation factors, global and dynamical.
dyncorr
dyncorrpp
**
**
(4-36)
This practical measurement allows one to further reduce the number of required
iterations in the solution as well as to exclude the „unreal“ pressure and phase
corrections, which cause oscillations and increase computational costs.
The coupling of the Eulerian fields of the fluids and the Lagrangian formulation for the
melt droplets is done explicitly, see Chapter 4.5. New position and velocities are
estimated for each representative particle considering the states of the continuous
fields from previous time step. The new state of the melt drops is then used to
determine the heat transfer from each particle to the fluid in the corresponding cell.
The heat transfer determines the solidification rate, which gives the new surface
Three-dimensional premixing model JEMI
28
temperature of the melt drop as well as the new crust thickness required for
explosion calculation in IDEMO-3D. The heat transfer and friction for the melt drops
are described in an implicit way within the two-phase solution for the coolant phases.
4.4 Breakup of melt jets
The jet breakup behavior, i.e. the penetration in water and the fragmentation along
the jet body, is described by a separate model for a representative jet. The present
formulation of the jet breakup is based on the stripping model of Bürger et al. [51],
which is implemented in the two-dimensional premixing model IKEJET/IKEMIX,
proposed by Pohlner et al. [40]. It is considered that the lateral stripping due to
relative flow along the jet is the major mechanism of the jet breakup, at least for thick
jets, several cm of diameter and larger (see discussion in Chapter 2).
The intention of the present work was to review the existing representation of jet
breakup in due consideration of known uncertainties of the breakup modeling and the
applicability for 3D geometries. In the existing modeling, the fragmentation of the jet
is described in 1D separate module. Here, only axial direction is considered. An
upward steam flow along the melt jet is applied. The water-steam mixture close to the
jet is considered to yield the driving forces determining this upward vapor flow. Thus,
the effect of vapor bubbles reducing the total density of the surrounding fluid is taken
into account in calculation of the hydrostatic head. The relative flow of steam along
the jet produces instabilities at the surface of the jet column resulting in stripping of
fragments. The existence of melt fragments in the vapor film and their influence on
steam flowing upward along the jet was previously not taken into account.
In extending the premixing model to 3D, the present modeling of jet breakup has
been re-analyzed with respect to possible extending from 1D to 3D. For this, the
applicability for thick melt jets is considered. Those are thinkable in real reactor
applications where pours of large melt masses into deep water pools are expected.
Previously, an artificial friction was taken for limiting the relative flow velocities along
the jet column. This limitation was required especially for long jets, since the relative
flow velocities increase proportionally to the height of the hydrostatic column around
the melt jet and overshoot the speed of sound for long jets. This unphysical issue is
corrected in the present modeling.
Alternative approach VOF-SLIC, implemented in MC3D [35], has been taken into
analysis as a possible replacement of the existing IKEJET model. The VOF-SLIC
approach considers the jet as a separate fluid phase using the 3D Eulerian
formulation. The main advantage of this approach is the direct coupling to the
surrounding fluids as additional continuous phase. However, this is a disadvantage,
too. The modeling uncertainties from fluid fluctuations as well as from evaporation
and re-condensation can lead to an irregular and self-enforcing jet breakup. Here,
high temporary and local fluid velocity and pressure peaks caused by uncertainties in
Three-dimensional premixing model JEMI
29
the modeling and numerics lead to unphysical behavior, e.g. locally intensified
fragmentation, strong deformation and even complete disintegration of the jet.
Further, in order to properly describe the jet breakup using a separate phase
formulation (e.g. the jet is modeled as a separate phase to water, vapor, and melt
drops), a fine resolution of the space close to the jet is required. The fluctuation of the
surrounding fluids and the deformation of the jet can then be correctly captured. In
large 3D calculation domains, which are usual for real reactor geometries, a fine
resolution of the region close the jet means an unproportional increase of
computational costs and high requirements to the numerics making such calculations
impossible. In contrary, the using of the 1D formulation allows a proper description of
the jet breakup even by a coarse discretization due to considering the hydrostatic
head for the relative flow and thus decoupling from the local velocities and pressures.
This avoids artificial instabilities due to uncertainties in the numerics and modeling.
Fluid velocities and pressures are used for determination of hydrostatic head and
thus are considered implicitly in 1D formulation. Furthermore, no phase consideration
as a 3D field and thus no additional conservation equations for the jet are to be
solved in the separate 1D model. Only the porosity corrections in mass conservation
should be done for each new time step due to jet movement. Concerning
computational costs and memory demand, this is the biggest advantage compared to
VOF-SLIC. The further plus to be mentioned is a simple implementation and the
extensibility of the model, e.g. taking local fluid velocities and phase volume fractions
directly to calculate relative flow velocities for lateral stripping. Therefore, the
simplified one-dimensional model for the jet breakup is taken for further use in JEMI.
In the present work, the basic approach of Kelvin-Helmholtz wave growth and sheet
stripping, described in [40], has been reviewed. The Kelvin-Helmholtz instabilities
have been assumed to be the governing mechanism determining the fine jet
breakup. The coarse breakup of thinner jets observed in KROTOS experiments in
KS-series is considered as a non-typical case for reactor conditions, although it might
occur at the leading edge during the initial stage of the jet penetration in water. The
coarse breakup can be excluded as relevant mechanism for jet fragmentation. The
coarse breakup at the jet leading edge is caused by Rayleigh-Taylor instabilities or
deformation due to vortex formation. Experimentally, no strong deceleration,
especially not with thick corium jets, could be detected. Deformation of jets due to
large disturbances at the jet surface and turbulent motion may be relevant to some
degree but only in an initial phase until establishment of a quasi-steady coherent jet
length. In this respect, the present review of the jet breakup modeling addresses the
parameterization in the basic Kelvin-Helmholtz approach in view of possible reactor
conditions. It refers firstly to questions on the relative velocity between melt and
ambient fluid, as well as the density of this fluid. Further, the stripping description (i.e.
adaptation parameters related to wavelength for stripping amplitude, stripping
surface part and drop diameter) must have a good mathematical basis. It concerns a
question, whether a generalized understanding and also adaptation approach over a
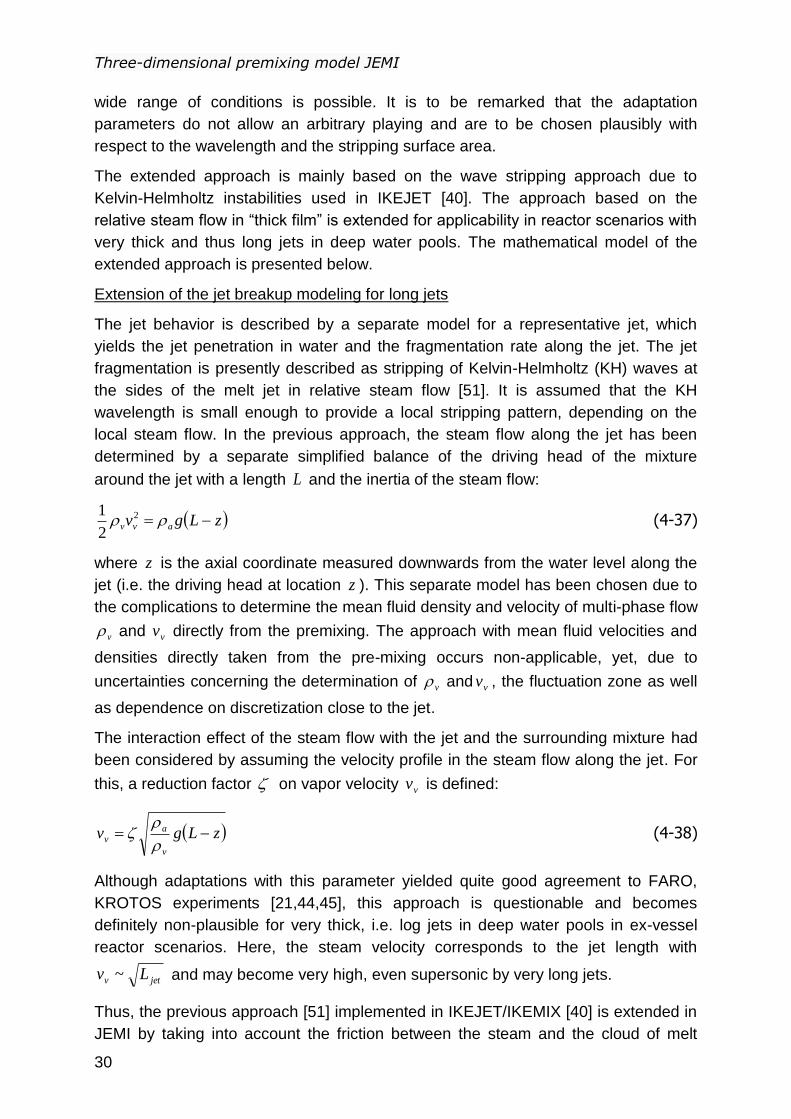
Three-dimensional premixing model JEMI
30
wide range of conditions is possible. It is to be remarked that the adaptation
parameters do not allow an arbitrary playing and are to be chosen plausibly with
respect to the wavelength and the stripping surface area.
The extended approach is mainly based on the wave stripping approach due to
Kelvin-Helmholtz instabilities used in IKEJET [40]. The approach based on the
relative steam flow in “thick film” is extended for applicability in reactor scenarios with
very thick and thus long jets in deep water pools. The mathematical model of the
extended approach is presented below.
Extension of the jet breakup modeling for long jets
The jet behavior is described by a separate model for a representative jet, which
yields the jet penetration in water and the fragmentation rate along the jet. The jet
fragmentation is presently described as stripping of Kelvin-Helmholtz (KH) waves at
the sides of the melt jet in relative steam flow [51]. It is assumed that the KH
wavelength is small enough to provide a local stripping pattern, depending on the
local steam flow. In the previous approach, the steam flow along the jet has been
determined by a separate simplified balance of the driving head of the mixture
around the jet with a length L and the inertia of the steam flow:
zLgv avv 2
2
1 (4-37)
where z is the axial coordinate measured downwards from the water level along the
jet (i.e. the driving head at location z ). This separate model has been chosen due to
the complications to determine the mean fluid density and velocity of multi-phase flow
v and vv directly from the premixing. The approach with mean fluid velocities and
densities directly taken from the pre-mixing occurs non-applicable, yet, due to
uncertainties concerning the determination of v and vv , the fluctuation zone as well
as dependence on discretization close to the jet.
The interaction effect of the steam flow with the jet and the surrounding mixture had
been considered by assuming the velocity profile in the steam flow along the jet. For
this, a reduction factor on vapor velocity vv is defined:
zLgvv
av
(4-38)
Although adaptations with this parameter yielded quite good agreement to FARO,
KROTOS experiments [21,44,45], this approach is questionable and becomes
definitely non-plausible for very thick, i.e. log jets in deep water pools in ex-vessel
reactor scenarios. Here, the steam velocity corresponds to the jet length with
jetv Lv ~ and may become very high, even supersonic by very long jets.
Thus, the previous approach [51] implemented in IKEJET/IKEMIX [40] is extended in
JEMI by taking into account the friction between the steam and the cloud of melt
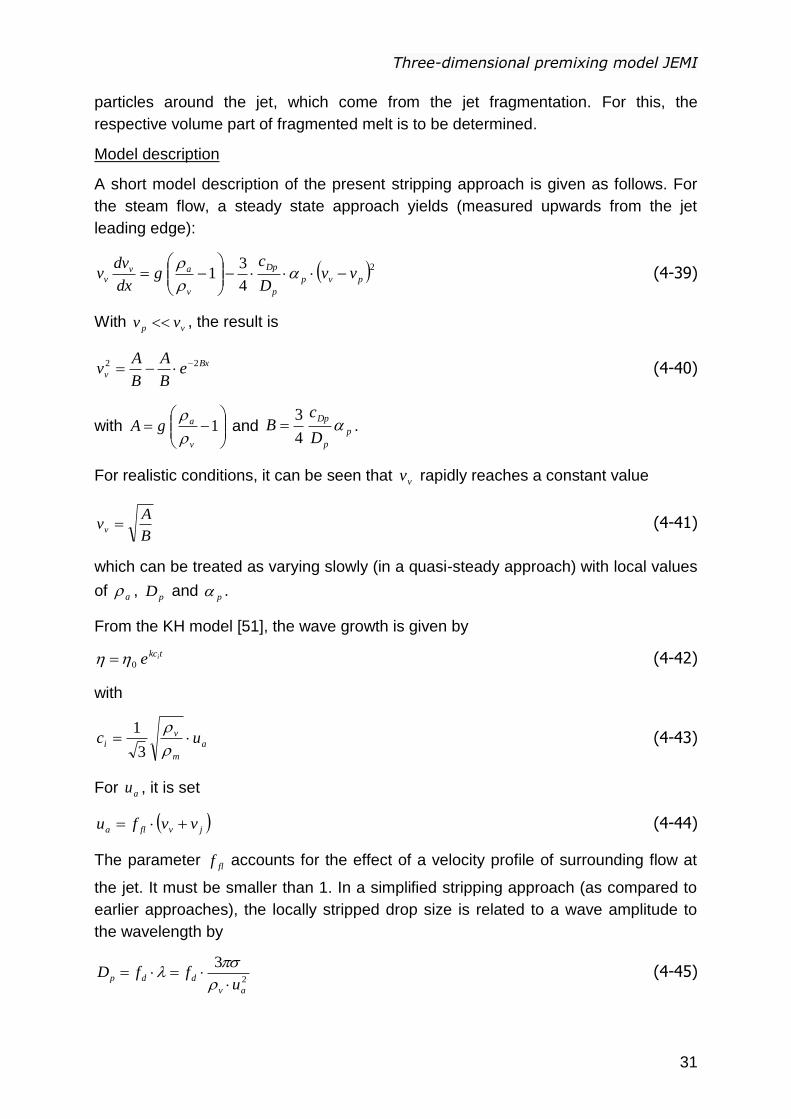
Three-dimensional premixing model JEMI
31
particles around the jet, which come from the jet fragmentation. For this, the
respective volume part of fragmented melt is to be determined.
Model description
A short model description of the present stripping approach is given as follows. For
the steam flow, a steady state approach yields (measured upwards from the jet
leading edge):
24
31 pvp
p
Dp
v
avv vv
D
cg
dx
dvv
(4-39)
With vp vv , the result is
Bx
v eB
A
B
Av 22 (4-40)
with
1
v
agA
and p
p
Dp
D
cB
4
3 .
For realistic conditions, it can be seen that vv rapidly reaches a constant value
B
Avv (4-41)
which can be treated as varying slowly (in a quasi-steady approach) with local values
of a , pD and p .
From the KH model [51], the wave growth is given by
tkcie0 (4-42)
with
a
m
vi uc
3
1 (4-43)
For au , it is set
jvfla vvfu (4-44)
The parameter flf accounts for the effect of a velocity profile of surrounding flow at
the jet. It must be smaller than 1. In a simplified stripping approach (as compared to
earlier approaches), the locally stripped drop size is related to a wave amplitude to
the wavelength by
2
3
av
ddpu
ffD
(4-45)
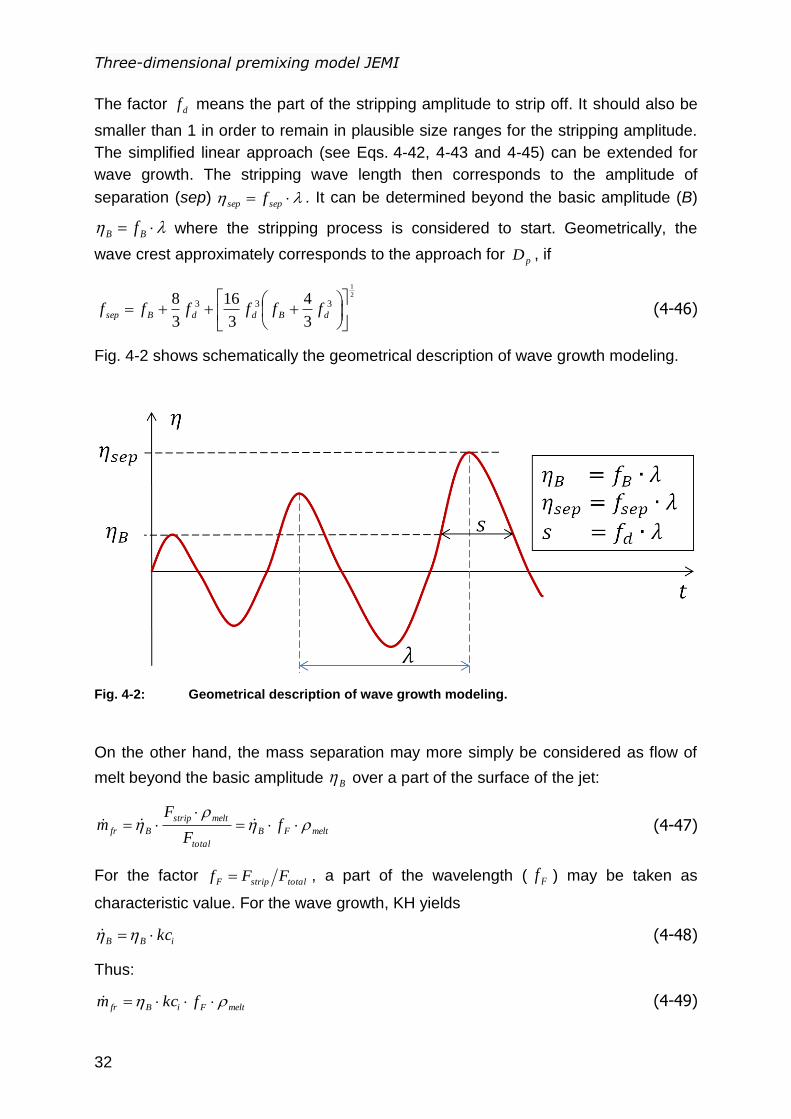
Three-dimensional premixing model JEMI
32
The factor df means the part of the stripping amplitude to strip off. It should also be
smaller than 1 in order to remain in plausible size ranges for the stripping amplitude.
The simplified linear approach (see Eqs. 4-42, 4-43 and 4-45) can be extended for
wave growth. The stripping wave length then corresponds to the amplitude of
separation (sep) sepsep f . It can be determined beyond the basic amplitude (B)
BB f where the stripping process is considered to start. Geometrically, the
wave crest approximately corresponds to the approach for pD , if
2
1
333
3
4
3
16
3
8
dBddBsep ffffff (4-46)
Fig. 4-2 shows schematically the geometrical description of wave growth modeling.
Fig. 4-2: Geometrical description of wave growth modeling.
On the other hand, the mass separation may more simply be considered as flow of
melt beyond the basic amplitude B over a part of the surface of the jet:
meltFB
total
meltstrip
Bfr fF
Fm
(4-47)
For the factor totalstripF FFf , a part of the wavelength ( Ff ) may be taken as
characteristic value. For the wave growth, KH yields
iBB kc (4-48)
Thus:
meltFiBfr fkcm (4-49)
Three-dimensional premixing model JEMI
33
Accordingly, Ff also defines the volume part of separated melt drops directly at the
melt surface: fp f . However, the reduction of this value is obtained considering
that the final separation occurs according to the above discrete approach of drop
separation with velocity sep rather than that with B in the continuous outflow
approach at B . Then, the corrected p results from the real versus the “continuous”
drop velocity as
sep
BF
sep
BF
sep
Bpcorrp
f
fff
,
(4-50)
This p value is used in the above determination of vv and thus yields a feedback
with the fragmentation which is locally iterated.
The four independent parameters flf , df , Ff and Bf are thus used in the present
modeling. The sense of introducing these separate parameters is that they are
related to specific parts of the process, which allow consideration of specific effects.
Further, this restricts the choice of the parameters as indicated. It is also obvious
(and can be demonstrated by the calculations) that the interdependence of the
effects yields additional limitations to reasonable choices. Especially, these
limitations become visible by trying to get a consistent formulation yielding agreement
with the experimental results over a wide range of conditions. Following values are
considered as appropriate: 5.0flf , 2.0df , 25.0Ff and 7.0Bf
The vapor density v has presently been chosen at saturation values. One may
rather think of choosing the density at the melt temperature, assuming rapid
adaptation to the cloud of drops close to the jet. However variations with the
simplified model showed that the overall influence on fragmentation is not that large,
due to the combination with the steam velocity which becomes larger with smaller v
.
An approach for the lateral drop velocity at separation influencing the lateral cloud
dispersion is given by
isepisepsepp cfkcu 2 (4-51)
The jet velocity is taken for the initial drop velocity in axial direction jetp vv .
Concluding, the approach of jet fragmentation in a vapor film based on the
formulation for Kelvin-Helmholtz wave growth had been given with the earlier model
based on the determination of vv without taking into account friction at the melt
drops. This deficit has been now corrected. The improved modeling is now available
in a simplified formulation for further use in the mixing code. The validation of the
extended modeling based on the FARO and KROTOS (as partial results for
detonation calculations) experiments has been discussed in Chapter 6.
Three-dimensional premixing model JEMI
34
4.5 Melt drops
In the course of extending the premixing model to 3D, several weaknesses in the
existing modeling of the melt phase have been indicated. First, the treatment the melt
phase using the Eulerian approach goes beyond the scope of the numerics and the
computability due to the complexity and immense computer memory needs. The
implementation of the melt phase in the Eulerian approach catastrophically slows
down calculations. This means a strong reduction of the simulation time step to
microseconds and smaller and an increase of iteration number required for solving
the linearized conservation equations in the semi-implicit numerical approach used in
JEMI. Second, the use of the Eulerian formulation for the melt phase supports a so-
called “data-smearing” from the modeling standpoint. This means, the temperature
and the velocities of all melt particle groups are being averaged in the respective
discrete volume and presented as one. The “smeared” data is used for the exchange
with the coolant phases and then stored back into each melt group in the cell
equaling them. Thus, the previous data, especially the temperature, gets lost and the
newly calculated data is decoupled from the reality. This averaging approach
becomes questionable particularly by melt groups with different ages, e.g. “young”
still liquid particles with higher enthalpy and “old” partly or completely solidified
particles. The information of solidification status of each melt drop is required in the
explosion/detonation phase of steam explosion, see Chapter 2.3
As possible improvement, an approach with classification of different particle groups
in each volume cell was considered. Such extended classification (i.e. differentiated
by velocities or temperature), intended to be implemented in the program code
MC3D [35], is again limited by the numerics and the computability. Here, additional
conservation equations for each particle class in each Eulerian cell require to be
solved. Moreover, four-dimensional fields for melt phases are needed. Both features
mean immense computer memory needs, small time steps and dramatic increase of
computational costs making the approach inapplicable.
Another approach to represent the melt phase is the Lagrangian method. Here, the
melt drops are described as a representative particle or particle cluster. It is firstly
created during jet fragmentation and at the end of its age destroyed by settling to
debris bed. Each representative particle or cluster has its own diameter, effective
surface (defined by effective number of single particles), age, velocity vector and
enthalpy. Depending on the locations, the particle interacts with the coolant phases in
the respective volume cell exchanging the momentum and energy. Thus, the exact
progress of the cooling, the development of the surface temperature and solidification
can easily and correctly be tracked. The surface temperature of the melt drop
determines the heat transfer from melt to coolant and thus the void generation. The
biggest advantage of the Lagrangian approach is the independence from the grid
nodalization. The numerical discretization for the melt phase is solely given by the
Three-dimensional premixing model JEMI
35
number of representative particles, which is determined only by the jet breakup.
Additionally, the number of representative particles can be reduced by changing the
number of single particles in each cluster on the fly. This makes the approach more
flexible. The memory overload, slow-down and abort of the simulation can be
avoided. The explicit coupling of the melt phase with the coolant phases is a further
advantage of the Lagrangian approach. This brings gains for the computability
reducing the computational costs. Also, the data smearing is avoided, since each
particle can be tracked.
In the premixing code JEMI, the Lagrangian method for the representation of melt
drops have been favored to be implemented due to better applicability compared to
the Eulerian approach. For usual applications, the number of particle clusters/groups
can be chosen large enough, usually between 10'000 and 20'000. This allows one to
follow the development of properties of particles in detail, even with long falling times
in deep water pools as well as in configurations with multiple jets. A multi-jet
fragments more intensively due to larger stripping surface area.
Model description
Clusters as representative particles are generated as follows: the jet line (center-line)
is initially divided axially into a certain number of intervals (given via input) with axial
length z. For each time step with duration t and each interval on the jet (for which
fragmentation takes place) a group of particles is generated being initially in a
volume:
zRtuRV jdjd 22)( (4-52)
into which the mass is stripped off:
tzMmd . (4-53)
The number of drops in such a representative particle group is
md
dd
R
mn
34
3 . (4-54)
The radius of the melt drop is defined by the jet breakup discussed in Section 4.4.
Each cluster has its own velocity, enthalpy, diameter, age. Additionally, each cluster
has its own inner and surface temperatures as well as the crust thickness related to a
single particle in the cluster. The development of surface temperature and crust can
be exactly determined due to particle tracking by solidification model created the
present work. The solidification model is implemented in JEMI in a separate module
CFOR, see Section 4.7.
Drop dynamics
For a group of representative drops, the equation of motion is given by
Three-dimensional premixing model JEMI
36
pd
m
ad
dd Fngm
dt
vdm
)1(
, (4-55)
where the drag force on a single spherical particle pF
is essentially the hydrodynamic
drag, i.e. based on the pressure influences from the surrounding flow. In general
form, pF
is given by
)(2
1 2
dareladdp vvvRcF
. (4-56)
Mixture densities and velocities of the ambient coolant phases ( a , av
) are used in
order to consider different flow regimes. They yield an influence of void in mixture on
the particle movement. Following assumptions are valid. The ambient fluid
corresponds to liquid with la , la vv
in the water-continuous regime (steam
bubbles in water). In the vapor-continuous regime (water droplets in steam), the
vapor is ambient, i.e. ga , ga vv
. In the transition range assumed between flow
patterns, the fluid properties (i.e. the density and velocity as well as friction and heat
transfer) are derived from the respective values at the chosen boundaries. These are
0.3 and 0.7 of void fraction for liquid and vapor-continuous regimes, respectively. The
underlying idea is that the transition states are composed of water-rich and steam-
rich patterns, at the conditions of the boundaries of the transition regime,
respectively. Practically, linear interpolation is done between the boundaries. For the
transition range, between the liquid- and vapor-continuous regimes, the ambient
density is expressed by
lg
llgg
a
(4-57)
and the ambient velocity:
llgg
llgga
vvv
. (4-58)
gv and lv are volumetric velocities relating to the real velocities ggg uv and
lll uv , respectively.
4.6 Heat transfer between melt and fluid
Heat transfer from the melt drops to the coolant is described depending on the flow
patterns, in a similar way as for friction. The energy balance for a single spherical
particle is given by:
Three-dimensional premixing model JEMI
37
2
d
dpsurf
p
p Dqt
em , (4-59)
with internal energy pe and surface heat flux surfq . The heat flux surfq corresponds to
the surface temperature of the melt drop surfT :
surfsurfsurf Tqq (4-60)
Two mechanisms of the heat transfer are considered: forced convection film boiling
and heat radiation. Combining both radiation and forced convection yields the total
surface heat flux from the melt drop to the coolant:
RadfilmSurf qqq (4-61)
The film boiling is considered to be relevant in the water-continuous regime: the melt
drop is surrounded by water. The modeling of the film boiling is based on the
description of Epstein and Hauser for forced convection film boiling [71]. For the
ambient velocity and properties, the water values have been taken.
The correlation of Epstein and Hauser can be written as
4
1
2
1
4
23 2
24
PrRe5.2
B
A
c
h
DTThq
pv
lvvlvsatdfilmfilm
, (4-62)
with
lvv
satdpv
h
TTcA
Pr
, (4-63)
2
1
PrPr
l
lvv
lsatpv
v
l
h
TTcB
, (4-64)
satlsatvlv hhh ,, (4-65)
2
1
2
1
l
v
v
l , (4-66)
l
ld
l
Dvv
Re . (4-67)
A is related to the superheat of melt to water. A can be considered as tending to zero
for getting the limiting case filml qq , thus yielding
2
1
2
12
1
PrRe2
5.2 lllsatl
l TTD
q
(4-68)
or as Nusselt relation for the heat transfer from the interface to water:
Three-dimensional premixing model JEMI
38
2
1
2
1
2
1
2
12
1
PrRe99.1PrRe2
5.2 lllllNu
. (4-69)
This yields a factor 3 as compared to the classical correlations for solid spheres.
In general, an increase of heat transfer from the melt drops and from the interface to
water is expected from interface instabilities and turbulence effects (e.g. separation
of bubbles). In contrast, an increase in vapor film thickness due to the additionally
considered heat radiation and thus more significant evaporation may yield a
reduction of the convective part of heat transfer under film boiling. However, such
effects are not included in the present modeling.
The radiation heat transfer to the coolant is taken into account as an additional
contribution in all flow regimes: the water-, vapor-continuous and transition regimes.
The radiation heat flux per surface unit is given by
44
CoolantMeltRad TTq , (4-70)
with emissivity and Stefan-Boltzmann constant . The emissivity is taken as
0.7 for corium. The radiation heat transfer is considered to be independent of water
content. Certainly, this becomes problematically for high voided regions, since there
is no sufficient water to completely absorb the heat. However, the radiant heat can be
absorbed in neighboring regions with higher water content or by neighboring
structures. The long range radiation heat flux is considered as a part, which is not
absorbed in the considered region and to be transported to the neighboring regions.
As already discussed, the heat transfer from melt droplet to coolant depends on the
flow regimes. The radiative heat transfer is practically independent of steam content
in mixture in due consideration of long range radiation. It contributes mostly to steam
production. In the case of a mixture with void close to 1, heat transfer occurs to
distant regions having more liquid phase. The convective heat transfer strongly
depends on the flow pattern. It can be neglected by high voided mixtures, since no
stable vapor film can exist in vapor. In the transition regime between the water-
continuous and vapor-continuous flow patterns, a linear interpolation is applied.
Thus, the total heat flux from melt droplet to coolant is expressed by:
filmFBRadSurf qCqq , (4-71)
where FBC is a partition factor on the film boiling part depending on void:
7.0
7.03.0
3.0
,0
,5.275.1
,1
FBC . (4-72)
Fig. 4-3 visually shows the development of the factor FBC on the film boiling as a
function of void.
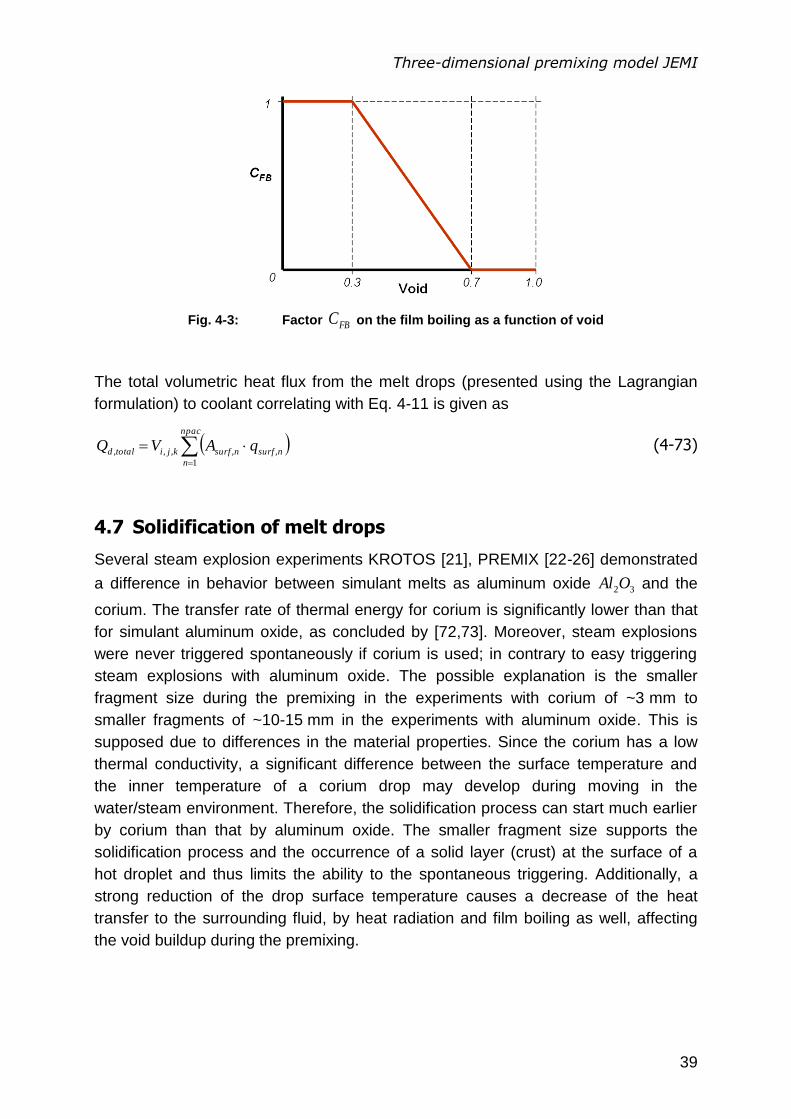
Three-dimensional premixing model JEMI
39
Fig. 4-3: Factor FBC on the film boiling as a function of void
The total volumetric heat flux from the melt drops (presented using the Lagrangian
formulation) to coolant correlating with Eq. 4-11 is given as
npac
n
nsurfnsurfkjitotald qAVQ1
,,,,, (4-73)
4.7 Solidification of melt drops
Several steam explosion experiments KROTOS [21], PREMIX [22-26] demonstrated
a difference in behavior between simulant melts as aluminum oxide 32OAl and the
corium. The transfer rate of thermal energy for corium is significantly lower than that
for simulant aluminum oxide, as concluded by [72,73]. Moreover, steam explosions
were never triggered spontaneously if corium is used; in contrary to easy triggering
steam explosions with aluminum oxide. The possible explanation is the smaller
fragment size during the premixing in the experiments with corium of ~3 mm to
smaller fragments of ~10-15 mm in the experiments with aluminum oxide. This is
supposed due to differences in the material properties. Since the corium has a low
thermal conductivity, a significant difference between the surface temperature and
the inner temperature of a corium drop may develop during moving in the
water/steam environment. Therefore, the solidification process can start much earlier
by corium than that by aluminum oxide. The smaller fragment size supports the
solidification process and the occurrence of a solid layer (crust) at the surface of a
hot droplet and thus limits the ability to the spontaneous triggering. Additionally, a
strong reduction of the drop surface temperature causes a decrease of the heat
transfer to the surrounding fluid, by heat radiation and film boiling as well, affecting
the void buildup during the premixing.
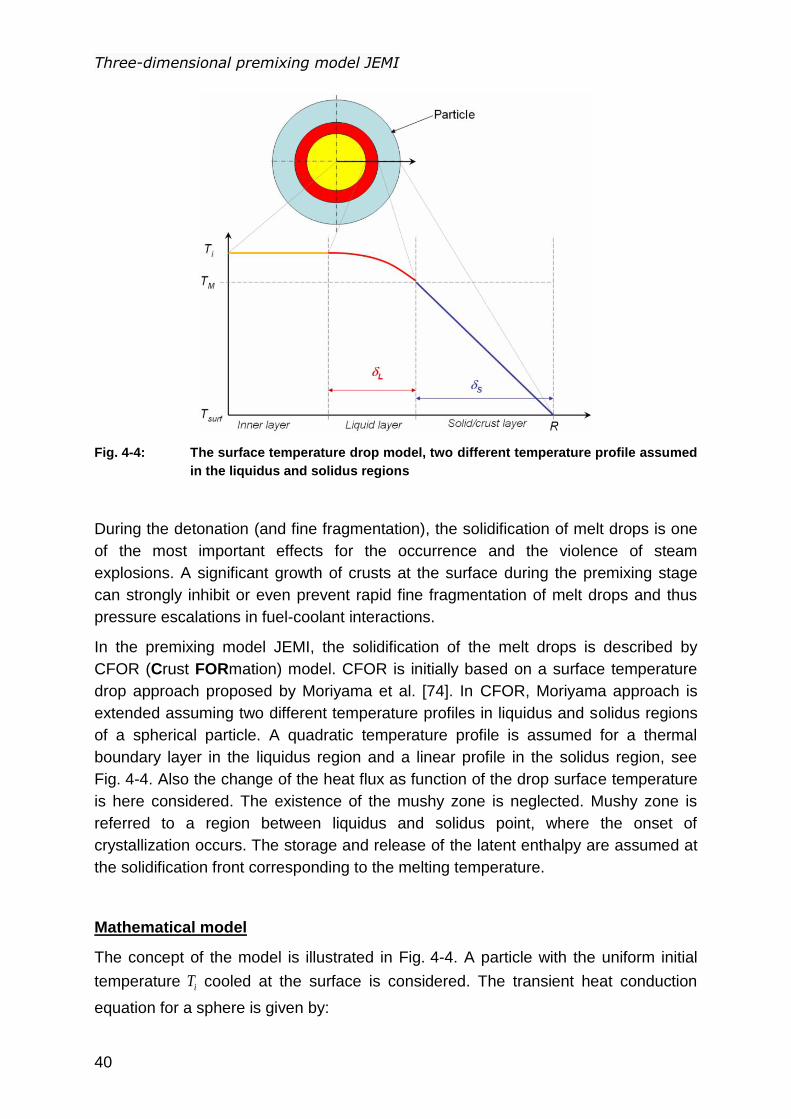
Three-dimensional premixing model JEMI
40
Fig. 4-4: The surface temperature drop model, two different temperature profile assumed
in the liquidus and solidus regions
During the detonation (and fine fragmentation), the solidification of melt drops is one
of the most important effects for the occurrence and the violence of steam
explosions. A significant growth of crusts at the surface during the premixing stage
can strongly inhibit or even prevent rapid fine fragmentation of melt drops and thus
pressure escalations in fuel-coolant interactions.
In the premixing model JEMI, the solidification of the melt drops is described by
CFOR (Crust FORmation) model. CFOR is initially based on a surface temperature
drop approach proposed by Moriyama et al. [74]. In CFOR, Moriyama approach is
extended assuming two different temperature profiles in liquidus and solidus regions
of a spherical particle. A quadratic temperature profile is assumed for a thermal
boundary layer in the liquidus region and a linear profile in the solidus region, see
Fig. 4-4. Also the change of the heat flux as function of the drop surface temperature
is here considered. The existence of the mushy zone is neglected. Mushy zone is
referred to a region between liquidus and solidus point, where the onset of
crystallization occurs. The storage and release of the latent enthalpy are assumed at
the solidification front corresponding to the melting temperature.
Mathematical model
The concept of the model is illustrated in Fig. 4-4. A particle with the uniform initial
temperature iT cooled at the surface is considered. The transient heat conduction
equation for a sphere is given by:
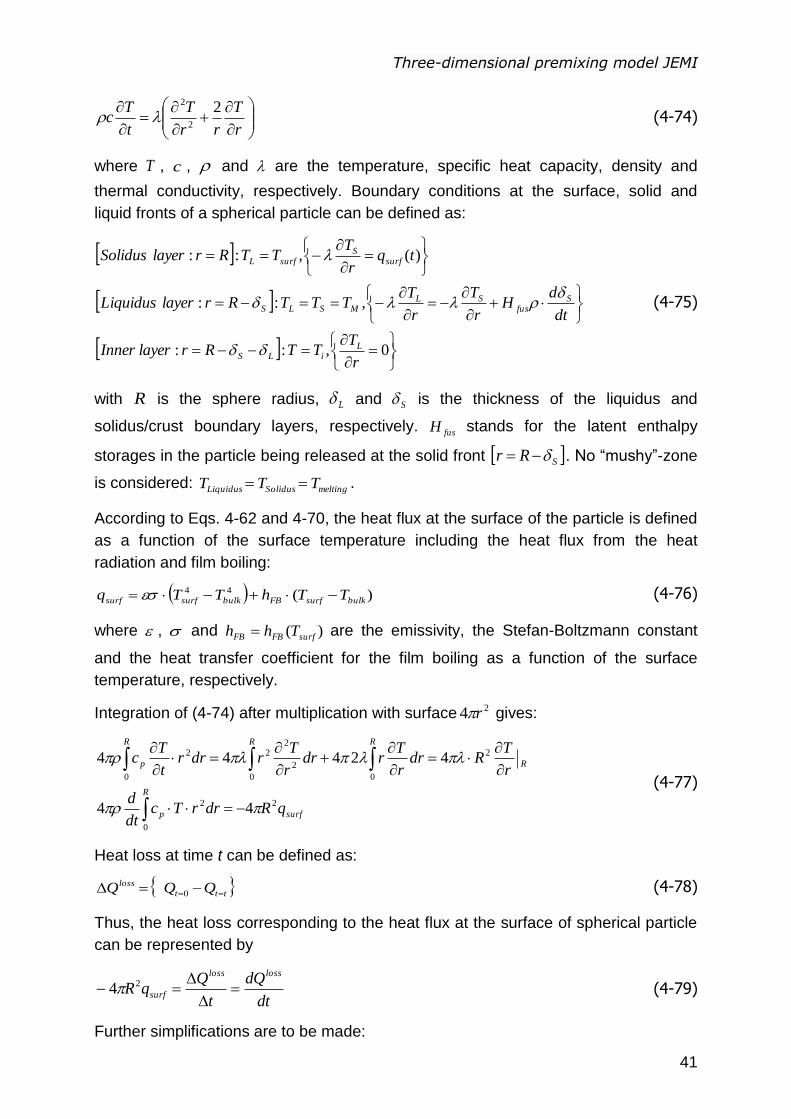
Three-dimensional premixing model JEMI
41
r
T
rr
T
t
Tc
22
2
(4-74)
where T , c , and are the temperature, specific heat capacity, density and
thermal conductivity, respectively. Boundary conditions at the surface, solid and
liquid fronts of a spherical particle can be defined as:
0,::
,::
)(,::
r
TTTRrlayerInner
dt
dH
r
T
r
TTTTRrlayerLiquidus
tqr
TTTRrlayerSolidus
LiLS
Sfus
SLMSLS
surfS
surfL
(4-75)
with R is the sphere radius, L and S is the thickness of the liquidus and
solidus/crust boundary layers, respectively. fusH stands for the latent enthalpy
storages in the particle being released at the solid front SRr . No “mushy”-zone
is considered: meltingSolidusLiquidus TTT .
According to Eqs. 4-62 and 4-70, the heat flux at the surface of the particle is defined
as a function of the surface temperature including the heat flux from the heat
radiation and film boiling:
)(44
bulksurfFBbulksurfsurf TThTTq (4-76)
where , and )( surfFBFB Thh are the emissivity, the Stefan-Boltzmann constant
and the heat transfer coefficient for the film boiling as a function of the surface
temperature, respectively.
Integration of (4-74) after multiplication with surface 24 r gives:
surf
R
p
R
R
RR
p
qRdrrTcdt
d
r
TRdr
r
Trdr
r
Trdrr
t
Tc
2
0
2
0
2
0
2
222
0
44
42444
(4-77)
Heat loss at time t can be defined as:
ttt
loss QQQ 0 (4-78)
Thus, the heat loss corresponding to the heat flux at the surface of spherical particle
can be represented by
dt
dQ
t
QqR
lossloss
surf
24 (4-79)
Further simplifications are to be made:
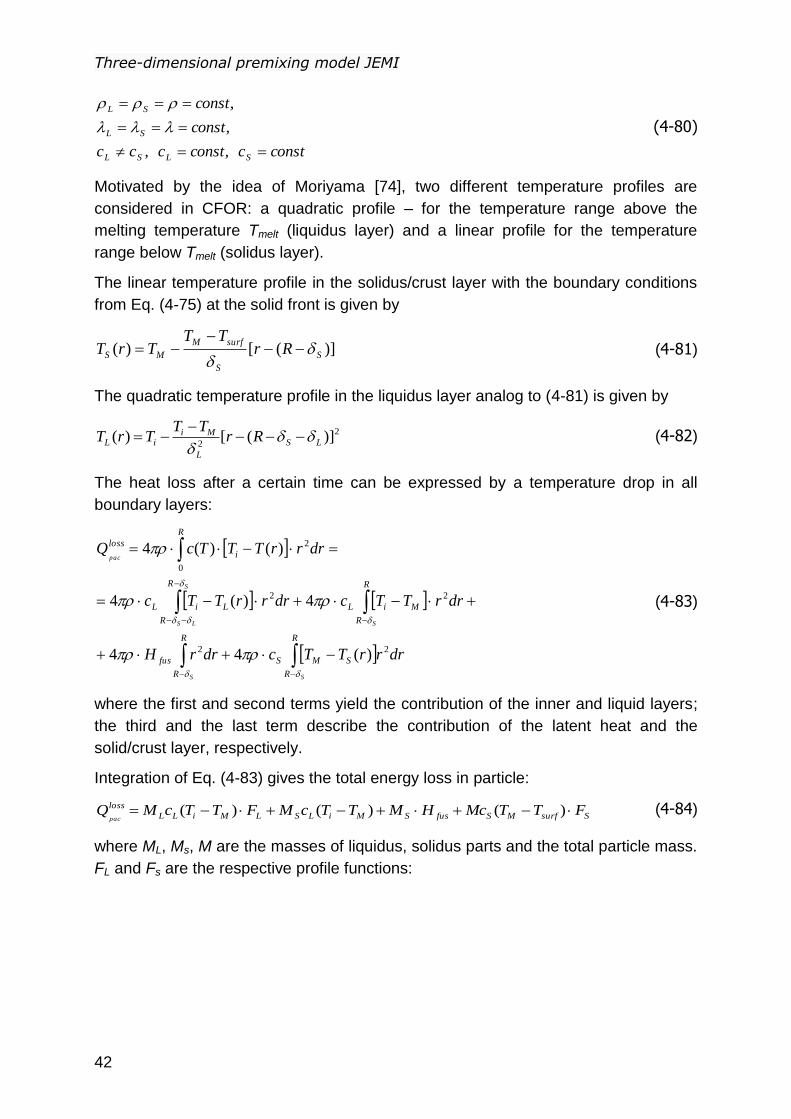
Three-dimensional premixing model JEMI
42
constcconstccc
const
const
SLSL
SL
SL
,,
,
,
(4-80)
Motivated by the idea of Moriyama [74], two different temperature profiles are
considered in CFOR: a quadratic profile – for the temperature range above the
melting temperature Tmelt (liquidus layer) and a linear profile for the temperature
range below Tmelt (solidus layer).
The linear temperature profile in the solidus/crust layer with the boundary conditions
from Eq. (4-75) at the solid front is given by
)]([)( S
S
surfM
MS RrTT
TrT
(4-81)
The quadratic temperature profile in the liquidus layer analog to (4-81) is given by
2
2)]([)( LS
L
MiiL Rr
TTTrT
(4-82)
The heat loss after a certain time can be expressed by a temperature drop in all
boundary layers:
R
R
SMS
R
R
fus
R
R
MiL
R
R
LiL
R
i
loss
SS
S
S
LS
pac
drrrTTcdrrH
drrTTcdrrrTTc
drrrTTTcQ
22
22
0
2
)(44
4)(4
)()(4
(4-83)
where the first and second terms yield the contribution of the inner and liquid layers;
the third and the last term describe the contribution of the latent heat and the
solid/crust layer, respectively.
Integration of Eq. (4-83) gives the total energy loss in particle:
SsurfMSfusSMiLSLMiLL
loss FTTMcHMTTcMFTTcMQpac
)()()( (4-84)
where ML, Ms, M are the masses of liquidus, solidus parts and the total particle mass.
FL and Fs are the respective profile functions:
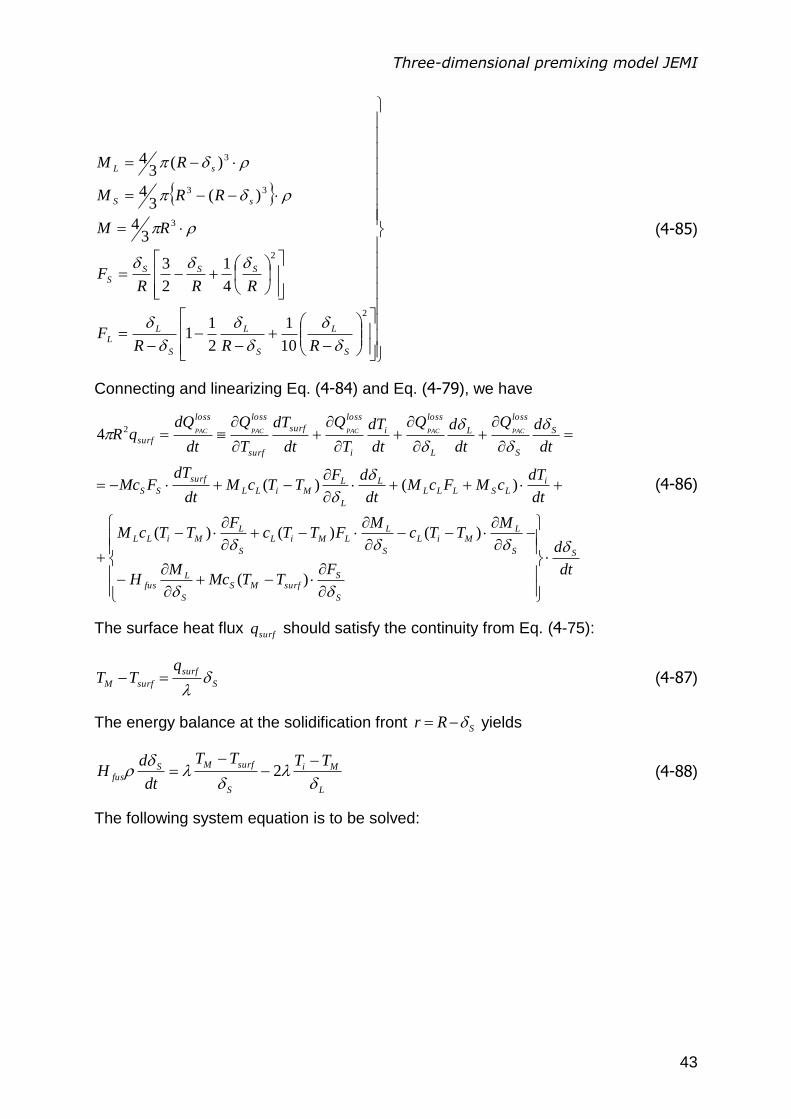
Three-dimensional premixing model JEMI
43
2
2
3
33
3
10
1
2
11
4
1
2
3
34
)(3
4
)(3
4
S
L
S
L
S
LL
SSSS
sS
sL
RRRF
RRRF
RM
RRM
RM
(4-85)
Connecting and linearizing Eq. (4-84) and Eq. (4-79), we have
dt
d
FTTMc
MH
MTTc
MFTTc
FTTcM
dt
dTcMFcM
dt
dFTTcM
dt
dTFMc
dt
dQ
dt
dQ
dt
dT
T
Q
dt
dT
T
Q
dt
dQqR
S
S
SsurfMS
S
Lfus
S
LMiL
S
LLMiL
S
LMiLL
iLSLLL
L
L
LMiLL
surf
SS
S
S
loss
L
L
loss
i
i
loss
surf
surf
lossloss
surfPACPACPACPACPAC
)(
)()()(
)()(
4 2
(4-86)
The surface heat flux surfq should satisfy the continuity from Eq. (4-75):
S
surf
surfM
qTT
(4-87)
The energy balance at the solidification front SRr yields
L
Mi
S
surfMSfus
TTTT
dt
dH
2 (4-88)
The following system equation is to be solved:
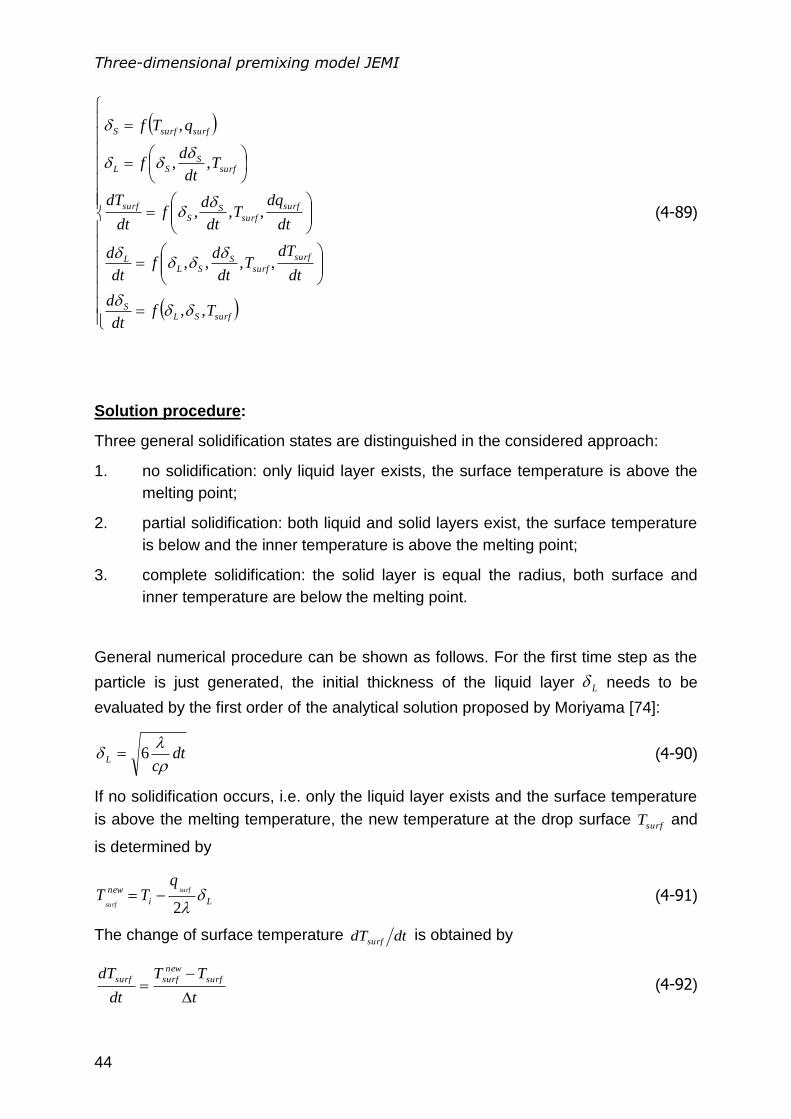
Three-dimensional premixing model JEMI
44
surfSLS
surf
surfS
SLL
surf
surfS
S
surf
surfS
SL
surfsurfS
Tfdt
d
dt
dTT
dt
df
dt
d
dt
dqT
dt
df
dt
dT
Tdt
df
qTf
,,
,,,,
,,,
,,
,
(4-89)
Solution procedure:
Three general solidification states are distinguished in the considered approach:
1. no solidification: only liquid layer exists, the surface temperature is above the
melting point;
2. partial solidification: both liquid and solid layers exist, the surface temperature
is below and the inner temperature is above the melting point;
3. complete solidification: the solid layer is equal the radius, both surface and
inner temperature are below the melting point.
General numerical procedure can be shown as follows. For the first time step as the
particle is just generated, the initial thickness of the liquid layer L needs to be
evaluated by the first order of the analytical solution proposed by Moriyama [74]:
dtc
L
6 (4-90)
If no solidification occurs, i.e. only the liquid layer exists and the surface temperature
is above the melting temperature, the new temperature at the drop surface surfT and
is determined by
Li
new surf
surf
qTT
2 (4-91)
The change of surface temperature dtdTsurf is obtained by
t
TT
dt
dT surf
new
surfsurf
(4-92)
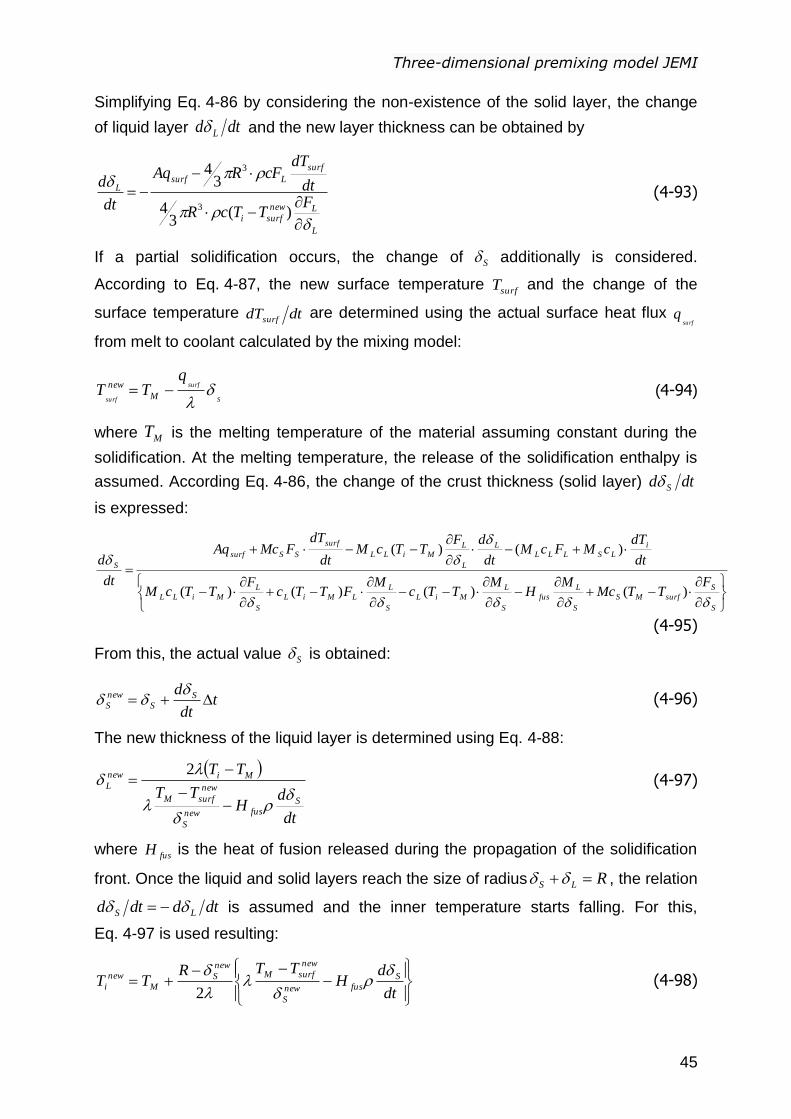
Three-dimensional premixing model JEMI
45
Simplifying Eq. 4-86 by considering the non-existence of the solid layer, the change
of liquid layer dtd L and the new layer thickness can be obtained by
L
Lnew
surfi
surf
LsurfL
FTTcR
dt
dTcFRAq
dt
d
)(3
4
34
3
3
(4-93)
If a partial solidification occurs, the change of S additionally is considered.
According to Eq. 4-87, the new surface temperature surfT and the change of the
surface temperature dtdTsurf are determined using the actual surface heat flux
surfq
from melt to coolant calculated by the mixing model:
S
surf
surf
qTT M
new
(4-94)
where MT is the melting temperature of the material assuming constant during the
solidification. At the melting temperature, the release of the solidification enthalpy is
assumed. According Eq. 4-86, the change of the crust thickness (solid layer) dtd S
is expressed:
S
S
surfMS
S
L
fus
S
L
MiL
S
L
LMiL
S
L
MiLL
i
LSLLL
L
L
L
MiLL
surf
SSsurf
S
FTTMc
MH
MTTc
MFTTc
FTTcM
dt
dTcMFcM
dt
dFTTcM
dt
dTFMcAq
dt
d
)()()()(
)()(
(4-95)
From this, the actual value S is obtained:
tdt
d SS
new
S
(4-96)
The new thickness of the liquid layer is determined using Eq. 4-88:
dt
dH
TT
TT
Sfusnew
S
new
surfM
Minew
L
2 (4-97)
where fusH is the heat of fusion released during the propagation of the solidification
front. Once the liquid and solid layers reach the size of radius RLS , the relation
dtddtd LS is assumed and the inner temperature starts falling. For this,
Eq. 4-97 is used resulting:
dt
dH
TTRTT S
fusnew
S
new
surfMnew
SM
new
i
2 (4-98)
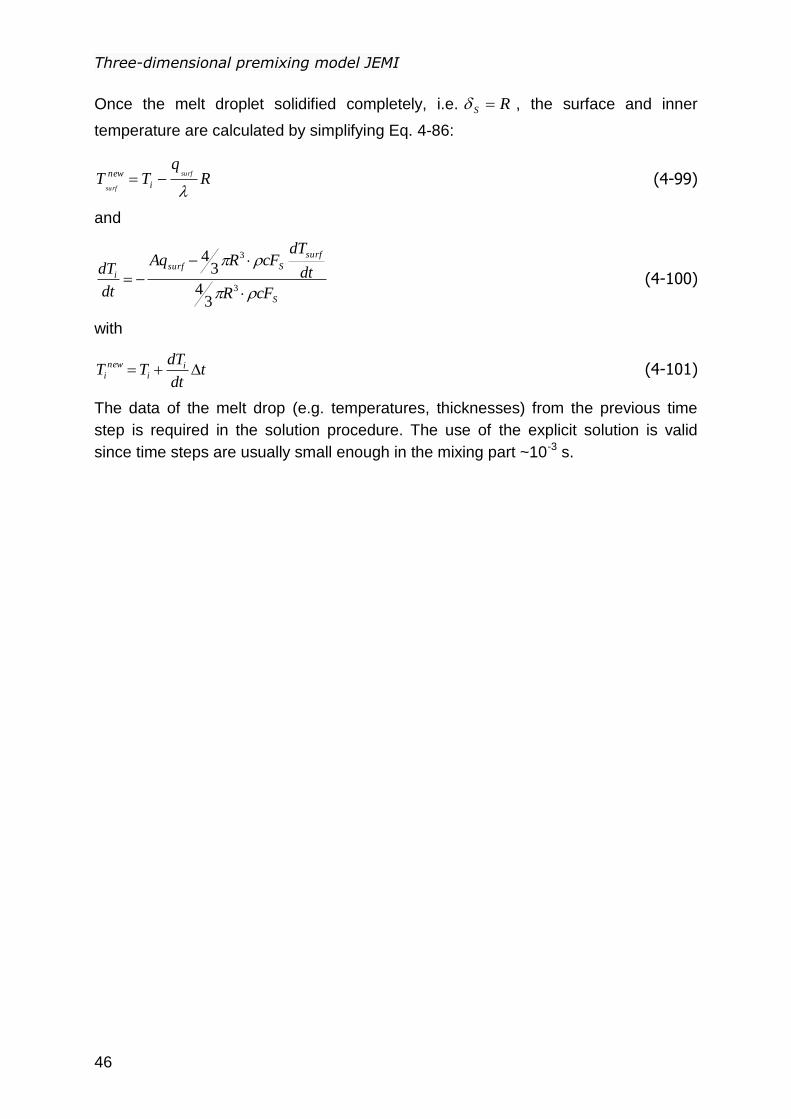
Three-dimensional premixing model JEMI
46
Once the melt droplet solidified completely, i.e. RS , the surface and inner
temperature are calculated by simplifying Eq. 4-86:
Rq
TTsurf
surf i
new
(4-99)
and
S
surf
Ssurfi
cFR
dt
dTcFRAq
dt
dT
3
3
34
34
(4-100)
with
tdt
dTTT i
i
new
i (4-101)
The data of the melt drop (e.g. temperatures, thicknesses) from the previous time
step is required in the solution procedure. The use of the explicit solution is valid
since time steps are usually small enough in the mixing part ~10-3 s.
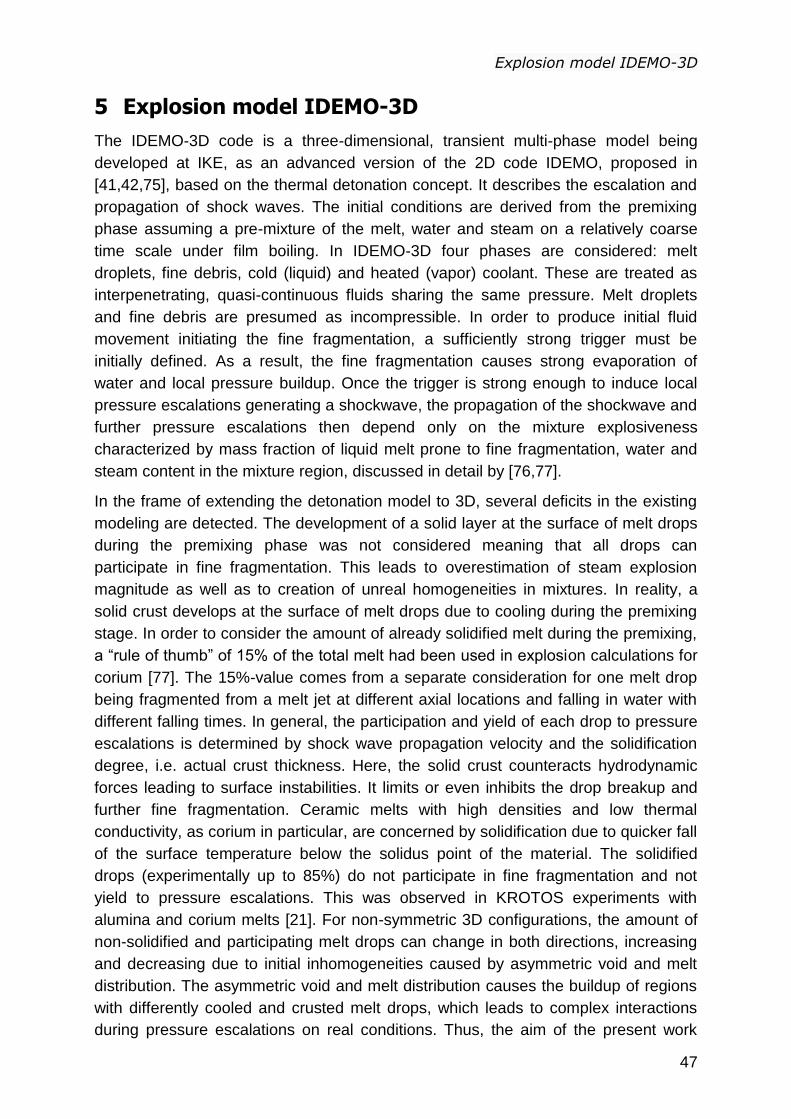
Explosion model IDEMO-3D
47
5 Explosion model IDEMO-3D
The IDEMO-3D code is a three-dimensional, transient multi-phase model being
developed at IKE, as an advanced version of the 2D code IDEMO, proposed in
[41,42,75], based on the thermal detonation concept. It describes the escalation and
propagation of shock waves. The initial conditions are derived from the premixing
phase assuming a pre-mixture of the melt, water and steam on a relatively coarse
time scale under film boiling. In IDEMO-3D four phases are considered: melt
droplets, fine debris, cold (liquid) and heated (vapor) coolant. These are treated as
interpenetrating, quasi-continuous fluids sharing the same pressure. Melt droplets
and fine debris are presumed as incompressible. In order to produce initial fluid
movement initiating the fine fragmentation, a sufficiently strong trigger must be
initially defined. As a result, the fine fragmentation causes strong evaporation of
water and local pressure buildup. Once the trigger is strong enough to induce local
pressure escalations generating a shockwave, the propagation of the shockwave and
further pressure escalations then depend only on the mixture explosiveness
characterized by mass fraction of liquid melt prone to fine fragmentation, water and
steam content in the mixture region, discussed in detail by [76,77].
In the frame of extending the detonation model to 3D, several deficits in the existing
modeling are detected. The development of a solid layer at the surface of melt drops
during the premixing phase was not considered meaning that all drops can
participate in fine fragmentation. This leads to overestimation of steam explosion
magnitude as well as to creation of unreal homogeneities in mixtures. In reality, a
solid crust develops at the surface of melt drops due to cooling during the premixing
stage. In order to consider the amount of already solidified melt during the premixing,
a “rule of thumb” of 15% of the total melt had been used in explosion calculations for
corium [77]. The 15%-value comes from a separate consideration for one melt drop
being fragmented from a melt jet at different axial locations and falling in water with
different falling times. In general, the participation and yield of each drop to pressure
escalations is determined by shock wave propagation velocity and the solidification
degree, i.e. actual crust thickness. Here, the solid crust counteracts hydrodynamic
forces leading to surface instabilities. It limits or even inhibits the drop breakup and
further fine fragmentation. Ceramic melts with high densities and low thermal
conductivity, as corium in particular, are concerned by solidification due to quicker fall
of the surface temperature below the solidus point of the material. The solidified
drops (experimentally up to 85%) do not participate in fine fragmentation and not
yield to pressure escalations. This was observed in KROTOS experiments with
alumina and corium melts [21]. For non-symmetric 3D configurations, the amount of
non-solidified and participating melt drops can change in both directions, increasing
and decreasing due to initial inhomogeneities caused by asymmetric void and melt
distribution. The asymmetric void and melt distribution causes the buildup of regions
with differently cooled and crusted melt drops, which leads to complex interactions
during pressure escalations on real conditions. Thus, the aim of the present work
Explosion model IDEMO-3D
48
was to extend the new 3D detonation model considering the different solidification
degree of melt drops in order to cover the influence of solid crusts at the surface of
melt drops on fine fragmentation.
5.1 Mathematical model
IDEMO-3D uses four phase formulation. The system of governing equations consists
11 equations:
Four continuity equations for each phase;
One constraint equation;
Two momentum equations: one unfragmented melt and another for a
representative fluid comprising the cold (liquid) and hot (vapor) fluid as well as
debris;
Three energy equations for debris, hot and cold fluids (the heat transfer from
melt drop to the fluid is negligible in that short time considered during the
explosion stage);
And one transport equation formulating the usage of the melt phase as “fuel”
for fine fragmentation.
Two additional conservation equations come from the approach for the discretization
of melt drops into crust thickness, discussed in detail in Section 5.3.
Conservation equations
The following conservation equations for mass, momentum and energy can be
applied, given here in Cartesian coordinates for simplicity
Conservation of mass applied to melt droplets (m), debris (d), cold (c) and heated (h)
coolant gives:
frmmmmm vt
(5-1)
frfdddd vt
(5-2)
Efcccc vt
(5-3)
Efhhhh vt
(5-4)
In Eqs. (5-1) and (5-2) fr is the mass transfer rate due to fragmentation and in (5-3)
and (5-4) E is the entrainment rate of cold coolant due to mixing.
Explosion model IDEMO-3D
49
The volume fractions of melt, debris, hot and cold coolant have to obey the volume
constraint equation:
1 chdm (5-5)
Conservation of momentum for melt droplets (m), fine debris (d) and effective fluid (f),
implying hot and cold coolant gives:
D
fmmfrmmmmmmmm Fvpvvvt
,
(5-6)
D
fmmfrhcd
mmhhccddfhhccdd
Fvp
vvvt
,
(5-7)
As already mentioned, during the short time of the fuel-coolant interaction the heat
exchange between the melt droplets and the other fluid phases can be neglected due
to insignificant heat transfer contribution compared to the heat transfer from the
fragments (debris) yielded by the fine fragmentation of melt droplets. For the same
reason, the droplet temperature is assumed to be constant:
constTTT mdm 0, (5-8)
Energy equation for debris, cold and hot coolant gives:
dhmfrd
fdddddd QHt
pvHEt
(5-9)
cEc
fcccccc Ht
pvHEt
(5-10)
mfmddhcEh
fhhhhhh vvFQHt
pvHEt
,
(5-11)
In the energy conservation equations the stagnation or total energies and enthalpies
are used:
fKK veE2
1 , ,
2
1fKK vhH (5-12)
with hcdk ,, for debris, cold and hot coolant. This expression guarantees that total
energy is conserved.
Changes in diameter of melt droplets are assumed to be only due to fine
fragmentation. Thus, transport equation for the length scale of spherical droplets can
be expressed by:
mfrmmmmmmm DvDDt
3
4 , (5-13)
where mD is the diameter of a spherical melt droplet.
Explosion model IDEMO-3D
50
5.2 Constitutive laws
As previously noted, fine fragmentation of melt and heat-up of part of water (“micro-
interactions”) are central processes determining pressure build-up. The “micro-
interactions” concept addresses non-homogeneous heat-up of coolant in addition to
fragmentation denoting the probably non-conservative character of homogeneous
coolant heating. The non-equilibrium heat transfer model is based on the conceptual
assumption, that the heat from fragmented debris is transferred only to a part of the
coolant in a “micro-interactions” zone surrounding the fuel drops, to the “hot” phase.
It is postulated that the “cold” phase is too far outside and is not heated. The micro-
interactions zone grows with time as cold coolant is entrained into the micro-
interactions zone due to mixing.
Thermal and hydrodynamic fragmentation processes are usually distinguished in the
theory. Thermally driven fragmentation processes must dominate in spontaneously
triggered melt-water interactions due to the lack of sufficiently high relative velocities
as well as in the initial phase. The hydrodynamic fragmentation denotes processes
due to relative velocities between melt drops and coolant in strong pressure waves,
especially shock waves with relatively sharp leading edges. They are considered to
dominate under such conditions, in contrast to initiation and first escalation stages of
a steam explosion. For reactor safety analyses, it is essential to consider a trigger in
a conservative manner being sufficiently strong to create an initial fluid movement
and “launch” the fine fragmentation process. Thus, hydrodynamic fragmentation is of
special interest here.
In order to obtain the inherent restrictions to the hydrodynamic fragmentation process
and thus also to thermal detonations, it is necessary to take into account the effects
of the development of relative velocities, which are depending itself on the
fragmentation process. Thus, local and instantaneous descriptions of the
fragmentation are required instead of laws depending only on initial conditions. It is
difficult to derive such laws from experiments alone. Understanding and to some
extent modeling is required to get adequate descriptions even if formulated as
correlations. Based on different assumptions on mechanisms, different laws have
been constructed in more or less heuristic ways. Hydrodynamic fragmentation of melt
drops in liquids by sheet stripping can be correlated as follows.
Pilch [78] correlated the experimental data for the total breakup period for droplets in
gas inside the shockwave [79], see Fig. 5-1.
,* m
dfrfr Wect (5-14)
where frc is a fitting parameter, dWe is the Weber number for the drop. The constant
c and the Weber number are expressed considering the respective breakup mode in
Table 5-1. For the sheet stripping, it can be expressed
Explosion model IDEMO-3D
51
25.0*
dfrfr Wect (5-15)
Further, the dimensionless fragmentation time *
frt was defined by Pilch [78] as
5.0
*
m
f
rel
fr
fr
v
D
tt
(5-16)
where frt is the fragmentation time, D is the drop diameter,
relv is the relative
velocity, f is the density of the surrounding fluid and
m is the melt density.
The mass of the melt drop is
3
6Dm md
(5-17)
Assuming that the primary breakup of the melt drop is complete (full breakup inside
the shockwave without secondary breakup), the fragmentation rate can be expressed
using Eqs. 5-16 and 5-17 as
5.0
*
rel
2
*
5.0
3
66d
dmf
Fr
m
fr
m
f
rel
m
fr
dFr
t
vD
Dt
v
Dt
m
t
m
(5-18)
with relative velocity as the difference of the melt fragment velocity and the velocity of
the fluid (cold and hot fluid):
mf vvv rel (5-19)
with average density of the representative fluid
dch
ddcchhf
(5-20)
The fragmentation rate does not depend on the history but only on instantaneous
values. Thus, the dependence on the development of conditions is strongly
accentuated.
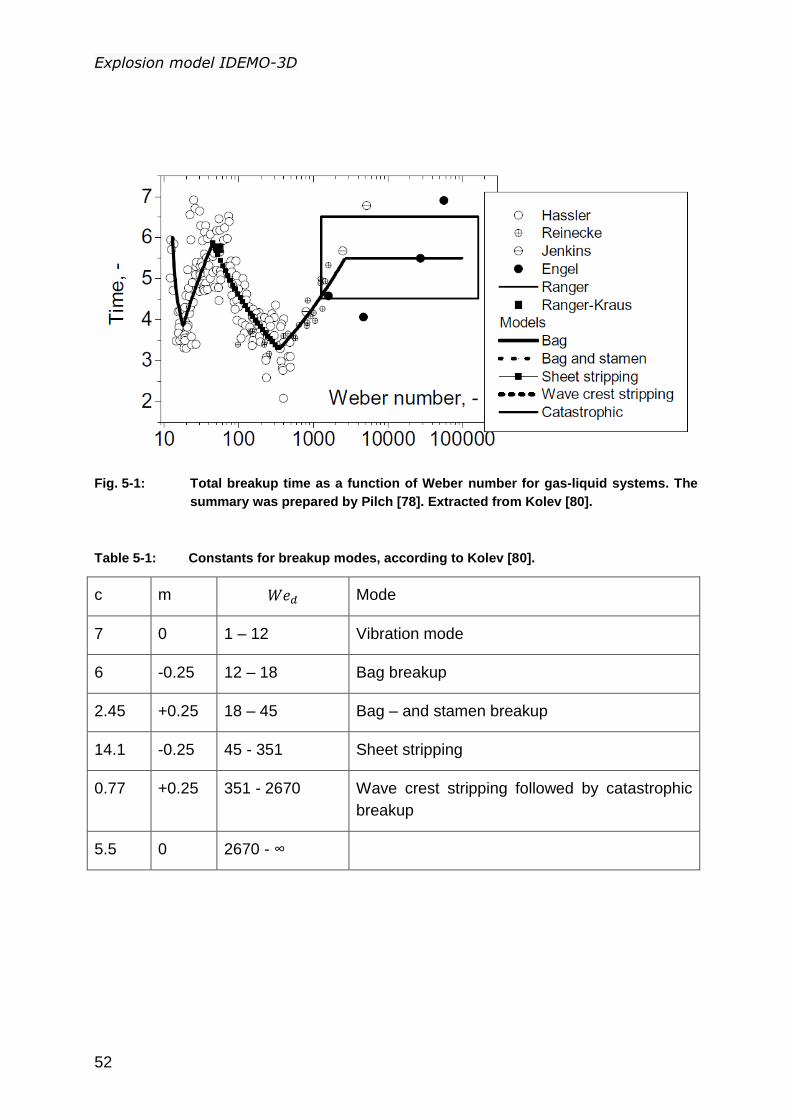
Explosion model IDEMO-3D
52
Fig. 5-1: Total breakup time as a function of Weber number for gas-liquid systems. The
summary was prepared by Pilch [78]. Extracted from Kolev [80].
Table 5-1: Constants for breakup modes, according to Kolev [80].
c m Mode
7 0 1 – 12 Vibration mode
6 -0.25 12 – 18 Bag breakup
2.45 +0.25 18 – 45 Bag – and stamen breakup
14.1 -0.25 45 - 351 Sheet stripping
0.77 +0.25 351 - 2670 Wave crest stripping followed by catastrophic
breakup
5.5 0 2670 - ∞
Explosion model IDEMO-3D
53
The correlation Eq. 5-18 is also used in MC3D [34,35], CULDESAC [81],
ESPROSE.m [32,33] , IFCI [27,28], TEXAS [29,30] and IDEMO [42].
Considering the amount of melt prone to fine fragmentation indicated in Section 5.3,
the total mass transfer rate per volume Fr is expressed using Eq. 5-18 by
mf
mFr
mFr
FrFr
m
mFrFrfrFr
Dt
v
t
m
Dt
mN
*
rel
3 d
d6
d
d (5-21)
with frN for the total number of melt drops able to fine fragmentation, m for volume
fraction of melt, mD for drop diameter, m for melt density, relv for relative velocity of
melt drops, *
frt dimensionless fragmentation time and fr for fraction of melt able to
fine fragmentation.
The entrainment rate E is taken proportional to the fragmentation rate Fr on a
volume basis:
m
cFrEE f
(5-22)
where Ef is a parametrical entrainment factor. To fix this parameter, the cloud
volume rate is calculated assuming a certain fragmentation volume. Based on
experimental observations the entrainment factor is considered in IDEMO-3D
calculations as 7Ef .
Based on the micro-interactions concept, the heat from hot debris during the fine
fragmentation is transferred only to the hot coolant phase. The heat transfer rate in
Eqs. 5-9 and 5-11 is given by
d
dhddhdh
DTThQ
6 (5-23)
where dD is the diameter of the debris fragment, dT and hT are the temperatures of
the debris and hot coolant, respectively. d is the volume fraction of debris. The
fragment diameter dD and heat transfer coefficient dhh are chosen parametrically.
The fragment size and heat transfer coefficient are chosen as mDd 50 and
410dhh to KmW 2610 , respectively.
The interfacial momentum exchange between the melt droplets and the fluid is given
by
mfmf
m
D
mffmD
fm vvvvD
cF
4
3 ,,
(5-24)
with a fixed drag coefficient 5.2, D
mfc .
Explosion model IDEMO-3D
54
5.3 Discretization into crust thickness
The crust thickness at the surface of melt droplets is considered to be the main
limiting criterion to fine fragmentation, see also Chapter 4. During the premixing, melt
drops coming from the jet fragmentation and moving the coolant have various age,
history and crust thickness. The ability of a melt drop to breakup depends on the
relative velocity, fluid density and actual crust thickness. Crusts on melt drops can
strongly limit or even prevent rapid fine fragmentation affecting pressure escalations
in fuel coolant interactions lowering the strength of steam explosions. In order to treat
different fragmentation behavior of differently crusted melt droplets, the MUSIG
(Multiple Size Group) approach is used in the IDEMO-3D for partition of melt droplets
into crust thickness groups, or bins. Thus, the population equation including all
groups is given by
txGvtxntxnt
m ,,,,,, ***
, (5-25)
with n as number density of drops with relative crust thickness * , spatial location in
the coordinate system x and melt drop velocity mv . The number density of size
group j can be expressed by:
*21
*21
** ),,(
j
j
dtxnN j
. (5-26)
In order to guarantee the compatibility of the applied MUSIG approach with Eulerian
description for melt phase used in IDEMO-3D, additional conservation equations
must be defined:
10,
MjwithGvNN
tjmjj
, (5-27)
6
3
0
m
mFrmmFrmmFr
DGv
t
, (5-28)
with jN for the number density of size group j, m for volume fraction of melt, m for
melt density and fr for fraction of melt able to fine fragmentation. Initial values are
taken from Lagrangian description for drops in JEMI (premixing stage). Fig. 5-2
shows exemplary an initial cumulative crust distribution partitioned into groups with
different crust thickness.
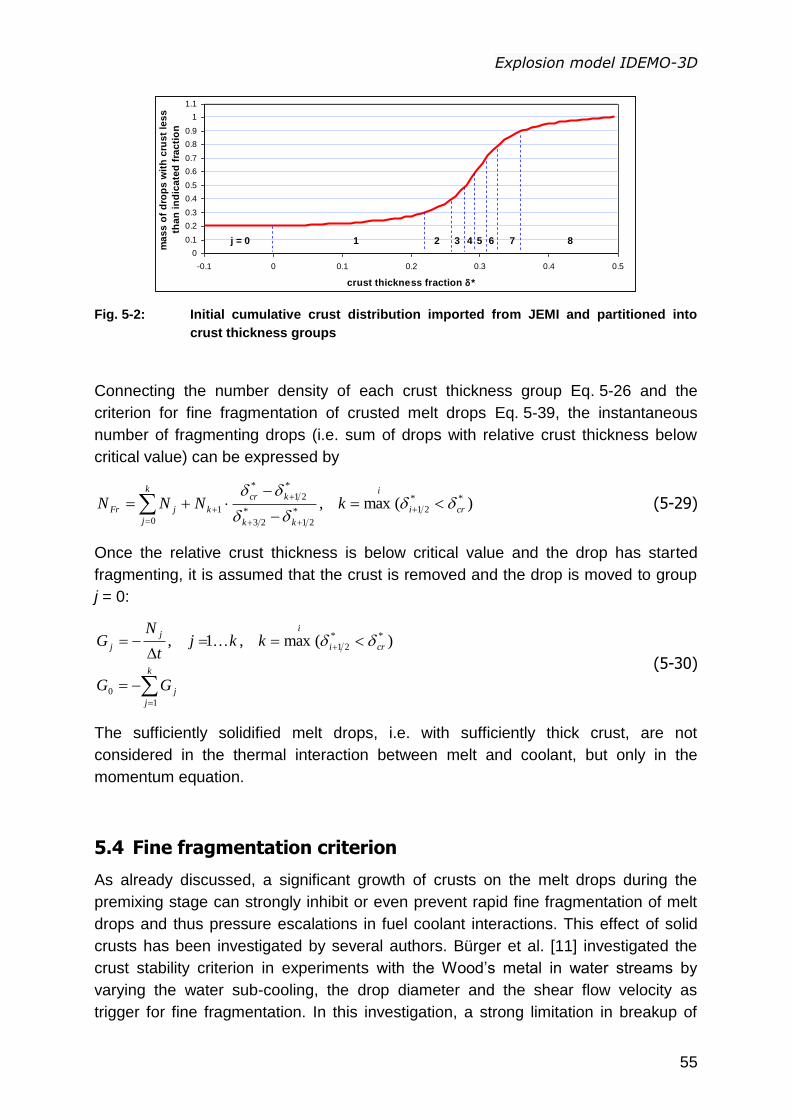
Explosion model IDEMO-3D
55
Fig. 5-2: Initial cumulative crust distribution imported from JEMI and partitioned into
crust thickness groups
Connecting the number density of each crust thickness group Eq. 5-26 and the
criterion for fine fragmentation of crusted melt drops Eq. 5-39, the instantaneous
number of fragmenting drops (i.e. sum of drops with relative crust thickness below
critical value) can be expressed by
)(max, **
21*
21
*
23
*
21
*
1
0
cri
i
kk
kcr
k
k
j
jFr kNNN
(5-29)
Once the relative crust thickness is below critical value and the drop has started
fragmenting, it is assumed that the crust is removed and the drop is moved to group
j = 0:
k
j
j
cri
ij
j
GG
kkjt
NG
1
0
**
21 )(max,1,
(5-30)
The sufficiently solidified melt drops, i.e. with sufficiently thick crust, are not
considered in the thermal interaction between melt and coolant, but only in the
momentum equation.
5.4 Fine fragmentation criterion
As already discussed, a significant growth of crusts on the melt drops during the
premixing stage can strongly inhibit or even prevent rapid fine fragmentation of melt
drops and thus pressure escalations in fuel coolant interactions. This effect of solid
crusts has been investigated by several authors. Bürger et al. [11] investigated the
crust stability criterion in experiments with the Wood‟s metal in water streams by
varying the water sub-cooling, the drop diameter and the shear flow velocity as
trigger for fine fragmentation. In this investigation, a strong limitation in breakup of
0
0.1
0.2
0.3
0.4
0.5
0.6
0.7
0.8
0.9
1
1.1
-0.1 0 0.1 0.2 0.3 0.4 0.5
crust thickness fraction *
ma
ss
of
dro
ps
wit
h c
rus
t le
ss
tha
n i
nd
ica
ted
fra
cti
on
j = 0 1 2 3 4 5 6 7 8

Explosion model IDEMO-3D
56
crusts has been observed above crust thicknesses of 130 μm. In other experiments
to drop fragmentation performed by Nelson et al. [12] with iron oxide in water, an
explosion could be induced in a partially solidified 2.9 mm-diameter drop with crust
thickness up to 200 μm, even after it had frozen inward to about 10 percent of its
radius. For corium, such experimental studies are not available.
Various models are proposed for breakup analyses of a crusted melt drop in relative
flows based on different breakup mechanisms. These are deformation [47,79], Taylor
instabilities [83] and shear flow instabilities, which are theoretically investigated with
FRADEMO by Bürger et al. [84]. Concluding the made observations in [11], the
breakup mechanism due to shear flow instabilities is assumed to be the most
effective, since it yields much smaller relative velocities required for the breakup.
Deriving from the Kelvin-Helmholtz model presented by Bürger et al. [51] for jet
breakup, the wave growth by shear flow instabilities is expressed by
tkCie 0 (5-31)
with k as wave number and iC as imaginary part of the phase velocity expressed by
a
m
f
i uC
3
1 (5-32)
The ambient velocity au is considered as
ffla vfu (5-33)
The parameter flf (similar to discussion of jet breakup in Chapter 4.4) implicates the
velocity profile of surrounding flow (with a velocity fv ) at the drop. The factor flf
reduces the impact of the relative velocity on the drop and thus must be smaller than
one. In a simplified approach, the wavelength for the stripping amplitude can be
expressed by
22
33
fflfaf vfu
(5-32)
Once the solid crust develops at the surface of a melt drop, the crust elasticity
replaces the surface tension as stabilizing force. To cover the effect of a thin solid
layer at the drop surface on its ability to fine fragmentation, the mechanical properties
of the solid layer are considered to be the stability criterion, in addition to the relative
flow. The crust properties determine whether the crust can stand the hydrodynamic
forces induced by the relative flow of surrounding fluid. Since the crust thickness is
significantly lower than the drop size, the elasticity approximation for a thin plate can
be used to assess the stability of the crust under mechanical loads. According to the
elasticity theory, the stiffness of a thin plate representing the crust at the drop surface
is given by
Explosion model IDEMO-3D
57
2
3
112
EN (5-35)
where E is the Young elastic modulus and is the Poisson‟s ratio for the frozen
layer with a thickness of . The surface tension in Eq. 5-34 can be replaced using
the crust stiffness N and the effective surface A:
A
N (5-36)
Considering the assumption of a thin plate under mechanical loads (caused by the
relative fluid flow), the effective surface area is given by 4pdA .
According to [82], the smaller the wavelength the smaller the crust thickness required
to suppress the fine fragmentation. The maximum possible crust thickness
required for drop stability is obtained by setting the wavelength to drop diameter
pd .
In order to consider the density effect of the melt, the effective fluid density is set to
m
f
f
f
1
(5-37)
Substituting Eqs. 5-35, 5-36 and 5-37 into Eq. 5-34 with the assumption pd , we
get for the critical crust thickness:
3
1232
rel
2
fl )1(
E
dvf p
fm
mf
cr
(5-38)
where f and m is the fluid and melt densities, relv is the relative velocity between
fluid and melt drop, flf is the velocity profile factor, pd is the drop diameter, E is the
Young modulus and cr is the absolute value of the critical crust thickness. The latter
embodies the thickest crust that can be broken up. The relative crust thickness can
be then expressed by:
3
1
22
rel
2
fl )1(
E
vf
d fm
mf
p
cr
(5-37)
If the actual crust thickness is lower than the critical value in Eq. 5-38, the crust
breaks up under mechanical loads and the melt drop fragments finer. Crusts above
the critical value are assumed to be stable preventing the fine fragmentation. Based
on experimental results, the profile factor on relative velocity has an empirical value
5.0flf . This value corresponds to the profile factor in jet breakup modeling. The
chosen value of 0.5 also correlates with the approach based on the modified Weber
number presented by Ursic et al. [87].
Explosion model IDEMO-3D
58
The consideration of the crust effect on fine fragmentation and thus on the strength of
steam explosion is an essential step done in the coupling JEMI – IDEMO-3D in
contrast to IKEJET/IKEMIX – IDEMO, where crust formation is not considered and
only the energetic criterion is taken into account.
5.5 Numerical procedure
In IDEMO-3D, similar to IDEMO, the explicit Euler method is used for the temporal
discretization of the conservation equations. A fully explicit method was found to be
advantageous for propagation calculations, since the adequate resolution of shock
front propagation would require time steps in the order of the stability limit for explicit
methods even with semi-implicit methods. For the discretization of the spatial
derivatives a finite-volume scheme is used. It is based on the robust Lax-Friedrichs –
scheme, which has been augmented with spatially second order corrections to
reduce numerical diffusion while maintaining Total Variation Diminishing (TVD)
properties.
Verification of JEMI and IDEMO-3D
59
6 Verification of JEMI and IDEMO-3D
This chapter addresses the verification and validation of the extended program codes
JEMI for premixing and IDEMO-3D for detonation to important experiments. The aim
of the verification is to show the ability of the 3D codes to correctly describe the key
mechanisms determining the explosiveness of a particular configuration. These are:
Melt jet fragmentation and yielded fragment size,
Vaporization, buildup of void and pressurization,
Reduction of melt mass available for fine fragmentation due to solidification
during the premixing,
Pressure escalations during the detonation.
The validation of the premixing model JEMI is based on FARO experiments [44]. The
main purpose of this investigation is to check the ability to describe the key features
affecting the explosiveness of the given pre-mixture. The experimental initial data
(i.e. the initial melt temperature, melt jet diameter, water sub-cooling temperature and
water pool height) is used as input for the calculation with the premixing code JEMI.
The validation of the explosion model IDEMO-3D is based on KROTOS experiments
performed in ISPRA [21]. The aim was to obtain accurate results for the detonation
phase. The input data is based on the premixing calculation made with JEMI. The
use of the JEMI data as input provides a good basis for checking the applicability of
both codes to perform reliable results in a chain. This is required particularly for using
the codes in real reactor applications, for which no experiments are possible on that
large scale.
It should be remarked, that FARO and KROTOS experiments have been performed
in facilities with a cylindrical vessel and central melt outflow from the furnace into
water. Thus, these experiments have a pronouncedly two-dimensional character.
Since there are no three-dimensional FCI experiments existing, the FARO and
KROTOS experiments should be applied to verify and validate the program codes.
The focus should rather lay on covering the key mechanisms of the fuel-coolant
interactions. The three-dimensional capability of the 3D premixing and detonation
codes is discussed in Chapter 7 based on investigations to reactor scenarios.
Verification of JEMI and IDEMO-3D
60
6.1 Verification of the premixing model JEMI
The verification of the premixing model JEMI is based on the experimental results
performed in the FARO experimental facility at the Joint Research Centre (JRC) in
Ispra, Italy [44]. The FARO experiments present a relocation of prototypic melt
compositions by gravity from a furnace into a vessel filled with water. The focus was
on fragmentation of melt jets during the contact with water, the interaction of melt
fragments with water by strong steam production and pressurization of the vessel as
well as the quenching of the fragmented melt. The FARO experiments have been
selected for the calculations on JEMI validation, since they are purely premixing tests
without triggering. Here, relatively detailed results exist from the experiments: the
length of coherent jet, the yielded fragment size and the amount of steam produced
during the interaction of melt and water. This allows a critical check of the main
aspects of the modeling and an assessment of general applicability to reactor
configurations. Compared to other experiments with prototypic melts without
triggering, e.g. KROTOS tests without triggering, FARO shows several advantages.
Firstly, FARO facility has a large pressure vessel (vessel size of 0.7 m in
diameter). This allows covering the radial mixture extent without strong
constraining effects, which have an impact on the void buildup and drop
solidification.
Secondly, FARO tests provide a large mass of melt and a long melt outflow
with fully developed melt jets excluding the influence of initial disturbances at
the furnace outlet (between 100 and 175 kg total mass of melt in the furnace).
Lastly, several FARO tests show strong steam production and pressurization
of the test vessel. This allows a good assessment of the amount of steam
produced during the premixing (e.g. L-28 with saturated conditions and melt
pouring during ~5 s with pressure rise from 0.5 MPa to 1.6 MPa).
The FARO experiments have been performed over a significant band width of
relevant conditions, system pressures from 0.2 MPa to 5 MPa, thickness of melt jets
of 5 cm and 10 cm, water depths of 1 - 2 m, saturated and highly sub-cooled water.
Table 6-1 from Magallon [45] gives an overview to the experimental conditions and
results. Significant breakup has been obtained in all tests. The mass-mean particle
size from the loose debris parts are also given in the table. In view of the large
variation of conditions, the band width of particle size distributions shown in Fig. 6-1
is rather narrow. The L-33 must be excluded from the analysis of the premixing since
a steam explosion was triggered producing a part of smaller particles.
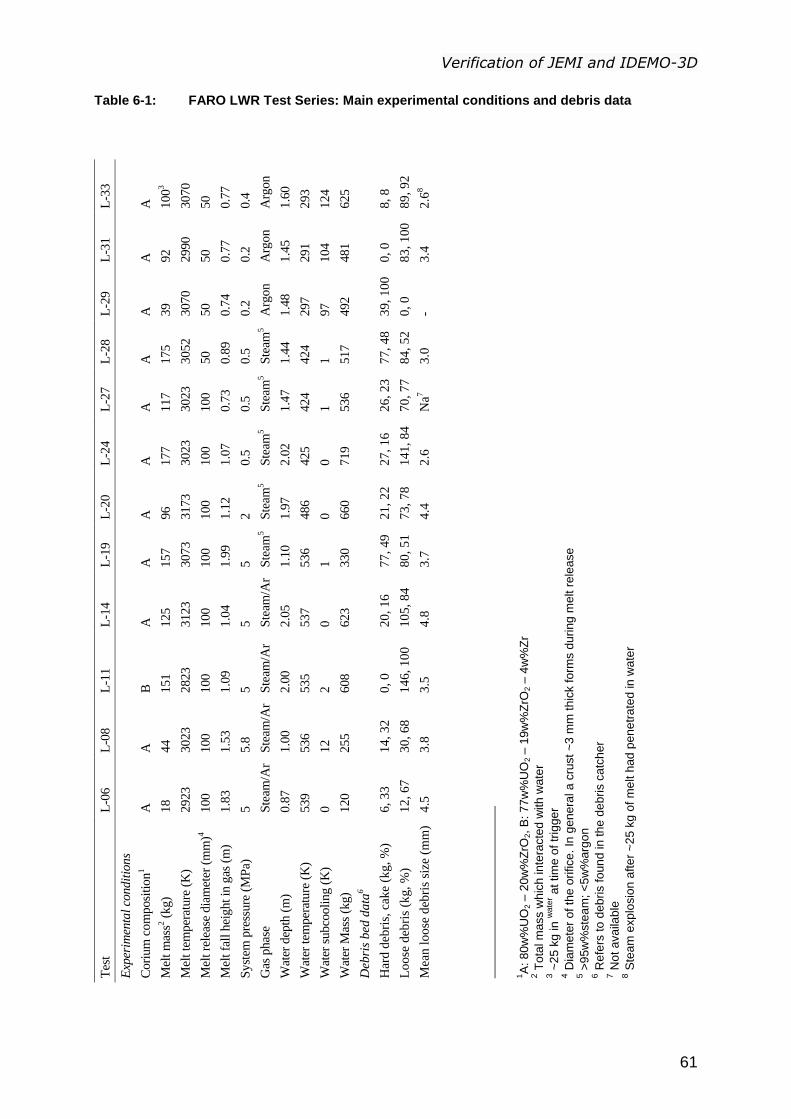
Verification of JEMI and IDEMO-3D
61
Table 6-1: FARO LWR Test Series: Main experimental conditions and debris data
Tes
t L
-06
L-0
8
L-1
1
L-1
4
L-1
9
L-2
0
L-2
4
L-2
7
L-2
8
L-2
9
L-3
1
L-3
3
Exp
erim
enta
l co
ndit
ions
Cori
um
com
posi
tion
1
A
A
B
A
A
A
A
A
A
A
A
A
Mel
t m
ass2
(kg)
18
44
151
125
157
96
177
117
175
39
92
100
3
Mel
t te
mper
ature
(K
) 2923
3023
2823
3123
3073
3173
3023
3023
3052
3070
2990
3070
Mel
t re
leas
e dia
met
er (
mm
)4
100
100
100
100
100
100
100
100
50
50
50
50
Mel
t fa
ll h
eight in
gas
(m
) 1.8
3
1.5
3
1.0
9
1.0
4
1.9
9
1.1
2
1.0
7
0.7
3
0.8
9
0.7
4
0.7
7
0.7
7
Syst
em p
ress
ure
(M
Pa)
5
5.8
5
5
5
2
0.5
0.5
0.5
0.2
0.2
0.4
Gas
phas
e S
team
/Ar
Ste
am/A
r S
team
/Ar
Ste
am/A
r S
team
5
Ste
am5
Ste
am5
Ste
am5
Ste
am5
Arg
on
Arg
on
Arg
on
Wat
er d
epth
(m
)
0.8
7
1.0
0
2.0
0
2.0
5
1.1
0
1.9
7
2.0
2
1.4
7
1.4
4
1.4
8
1.4
5
1.6
0
Wat
er t
emper
ature
(K
) 539
536
535
537
536
486
425
424
424
297
291
293
Wat
er s
ubco
oli
ng (
K)
0
12
2
0
1
0
0
1
1
97
104
124
Wat
er M
ass
(kg)
120
255
608
623
330
660
719
536
517
492
481
625
Deb
ris
bed
data
6
Har
d d
ebri
s, c
ake
(kg,
%)
6,
33
14
, 32
0
, 0
20
, 16
77
, 49
21
, 22
27
, 16
26
, 23
77
, 48
3
9, 1
00
0,
0
8,
8
Lo
ose
deb
ris
(kg,
%)
12
, 67
30
, 68
1
46, 1
00
10
5, 84
80
, 51
73
, 78
14
1, 8
4
70
, 77
84
, 52
0
, 0
83
, 1
00
89
, 92
Mea
n l
oose
deb
ris
size
(m
m)
4.5
3.8
3
.5
4.8
3.7
4.4
2.6
N
a7
3.0
-
3.4
2.6
8
1A
: 80w
%U
O2 –
20w
%Z
rO2, B
: 77w
%U
O2 –
19w
%Z
rO2 –
4w
%Z
r 2 T
ota
l m
ass w
hic
h inte
racte
d w
ith w
ate
r 3 ~
25 k
g in w
ate
r at tim
e o
f tr
igger
4 D
iam
ete
r of th
e o
rifice. In
genera
l a c
rust ~
3 m
m thic
k form
s d
uring m
elt r
ele
ase
5 >
95w
%ste
am
; <
5w
%arg
on
6 R
efe
rs to d
ebri
s found in the d
ebris c
atc
her
7 N
ot availa
ble
8 S
team
explo
sio
n a
fter
~25 k
g o
f m
elt h
ad p
enetr
ate
d in w
ate
r
Verification of JEMI and IDEMO-3D
62
6.1.1 Verification of jet breakup model based on FARO tests
At first, verification and validation evaluations of the breakup model in JEMI have
been done in a separate treatment. The aim of this was to check the ability to predict
the length of the coherent jet and the resulting particle size from the premixing. The
feedback with surrounding mixture states is not included in this separate
consideration. However, no large effect of surroundings on the jet breakup is
expected since the jet fragmentation modeling is considered due to an upward vapor
flow along the jet driven by hydrostatic head of sideways water. It is assumed, that
sufficient water is always available away from the jet. Thus, the impact of possible
high vapor content within the mixture remains small due to very large difference in
density of water and vapor. Table 6-2 gives the summary of evaluations on the
breakup length and the fragment sizes for the experiments shown in Table 6-1,
considered as most relevant. According the formulation for the stripping process in
Chapter 4.3 (Eqs. 4-46 and 4-50), the model parameters has been chosen as
follows: 5.0flf , 2.0df , 25.0Ff and 7.0Bf .
The FARO tests L-06 and L-08 have been omitted as first tests with smaller melt
masses. For FARO L-27, no debris size evaluation is available. The L-29 test was
probably a failure. FARO L-33 was performed with triggering and cannot be taken
into account for premixing analyses. In Table 6-2, the melt inflow velocities wv and jet
diameters wD are given at the water surface as the start of penetration into water.
The inflow velocities and the jet thickness are estimated using the experimental data
at the outlet nozzle and the known height for falling in gas (distance from the nozzle
to the water surface). The investigation shows a trend to slightly smaller particle sizes
in the calculations at higher system pressures. The experimental mean values are
between 2.6 and 4.8 mm, the calculated ones between 2.0 and 2.4 mm. Smaller drop
sizes in the calculations (compared to the experiments) can be explained due to
higher densities of vapor at higher pressures. In the modeling, the resulting fragment
size is inversely proportional to vapor density, see Eq. 4-43 in Chapter 4.4. The vapor
density is taken according to the system pressure. In contrast, at lower pressures of
0.2 - 0.5 MPa, a good agreement could be achieved. The drop size range is
experimentally between 2.6 and 3.4 mm, theoretically between 2.3 and 3.6 mm.
Further, the resulted large deviations in fragment size from FARO tests L-14 and
L-24 (5 MPa and 0.2 MPa), here D=4.8 mm from L-14 and D=2.6 mm from L-24, can
be hardly explained. Possible explanation for such deviations might be specific, but
not detected, effects due to high system pressure in the experiment.
Considering the resulted discrepancies between the experimental and theoretical
results, the present status of modeling of the jet breakup used in JEMI is considered
despite deviations at high pressures as satisfying for prediction of the fragment size
from the jet breakup and can be used in JEMI.
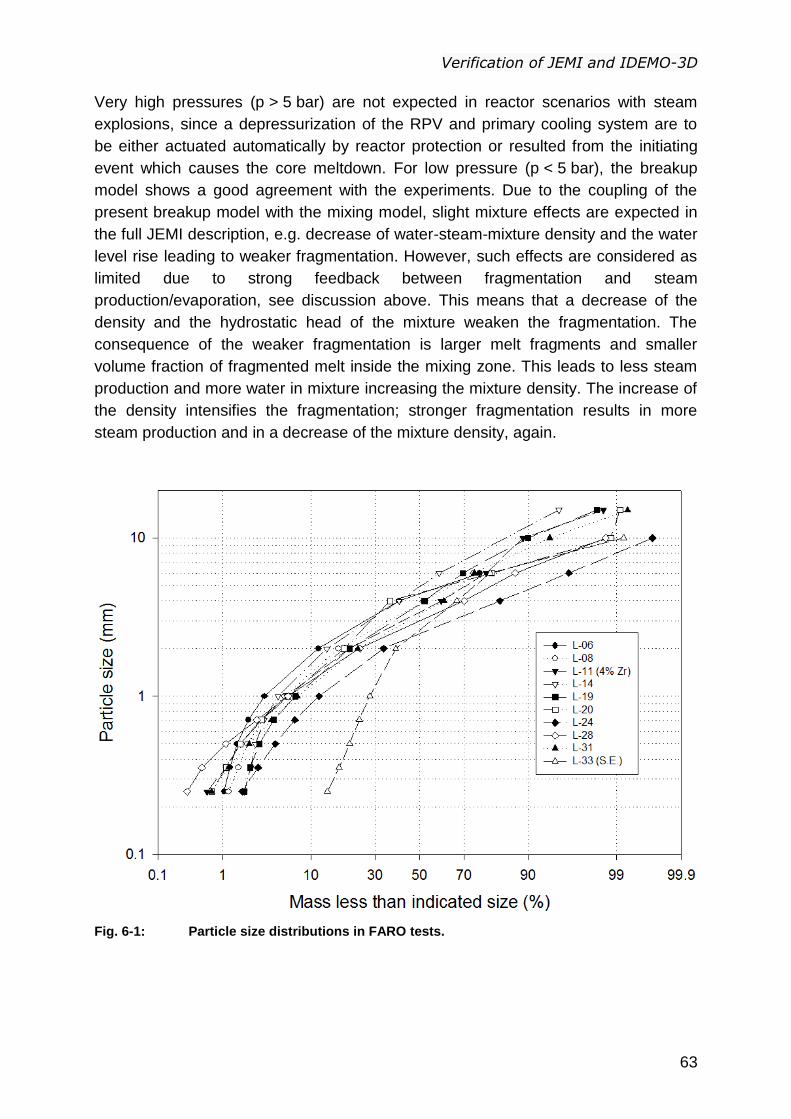
Verification of JEMI and IDEMO-3D
63
Very high pressures (p > 5 bar) are not expected in reactor scenarios with steam
explosions, since a depressurization of the RPV and primary cooling system are to
be either actuated automatically by reactor protection or resulted from the initiating
event which causes the core meltdown. For low pressure (p < 5 bar), the breakup
model shows a good agreement with the experiments. Due to the coupling of the
present breakup model with the mixing model, slight mixture effects are expected in
the full JEMI description, e.g. decrease of water-steam-mixture density and the water
level rise leading to weaker fragmentation. However, such effects are considered as
limited due to strong feedback between fragmentation and steam
production/evaporation, see discussion above. This means that a decrease of the
density and the hydrostatic head of the mixture weaken the fragmentation. The
consequence of the weaker fragmentation is larger melt fragments and smaller
volume fraction of fragmented melt inside the mixing zone. This leads to less steam
production and more water in mixture increasing the mixture density. The increase of
the density intensifies the fragmentation; stronger fragmentation results in more
steam production and in a decrease of the mixture density, again.
Fig. 6-1: Particle size distributions in FARO tests.
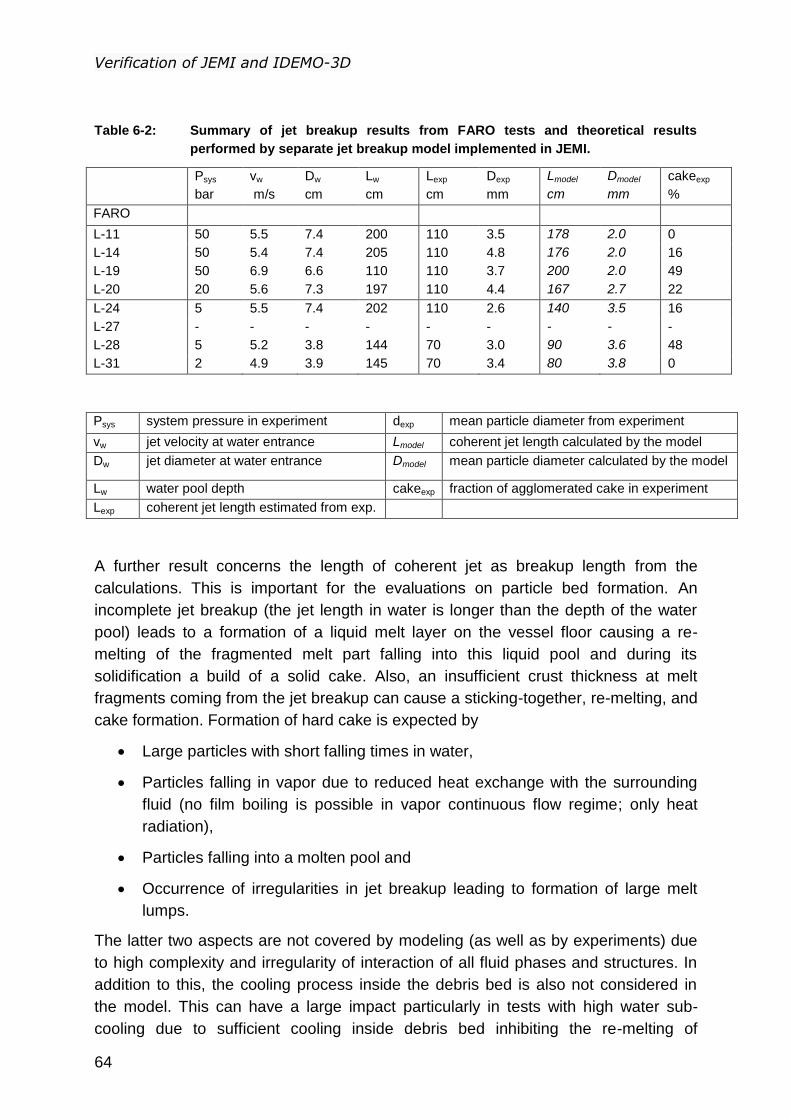
Verification of JEMI and IDEMO-3D
64
Table 6-2: Summary of jet breakup results from FARO tests and theoretical results
performed by separate jet breakup model implemented in JEMI.
Psys
bar
vw
m/s
Dw
cm
Lw
cm
Lexp
cm
Dexp
mm
Lmodel
cm
Dmodel
mm
cakeexp
%
FARO
L-11 50 5.5 7.4 200 110 3.5 178 2.0 0
L-14 50 5.4 7.4 205 110 4.8 176 2.0 16
L-19 50 6.9 6.6 110 110 3.7 200 2.0 49
L-20 20 5.6 7.3 197 110 4.4 167 2.7 22
L-24 5 5.5 7.4 202 110 2.6 140 3.5 16
L-27 - - - - - - - - -
L-28 5 5.2 3.8 144 70 3.0 90 3.6 48
L-31 2 4.9 3.9 145 70 3.4 80 3.8 0
Psys system pressure in experiment dexp mean particle diameter from experiment
vw jet velocity at water entrance Lmodel coherent jet length calculated by the model
Dw jet diameter at water entrance Dmodel mean particle diameter calculated by the model
Lw water pool depth cakeexp fraction of agglomerated cake in experiment
Lexp coherent jet length estimated from exp.
A further result concerns the length of coherent jet as breakup length from the
calculations. This is important for the evaluations on particle bed formation. An
incomplete jet breakup (the jet length in water is longer than the depth of the water
pool) leads to a formation of a liquid melt layer on the vessel floor causing a re-
melting of the fragmented melt part falling into this liquid pool and during its
solidification a build of a solid cake. Also, an insufficient crust thickness at melt
fragments coming from the jet breakup can cause a sticking-together, re-melting, and
cake formation. Formation of hard cake is expected by
Large particles with short falling times in water,
Particles falling in vapor due to reduced heat exchange with the surrounding
fluid (no film boiling is possible in vapor continuous flow regime; only heat
radiation),
Particles falling into a molten pool and
Occurrence of irregularities in jet breakup leading to formation of large melt
lumps.
The latter two aspects are not covered by modeling (as well as by experiments) due
to high complexity and irregularity of interaction of all fluid phases and structures. In
addition to this, the cooling process inside the debris bed is also not considered in
the model. This can have a large impact particularly in tests with high water sub-
cooling due to sufficient cooling inside debris bed inhibiting the re-melting of
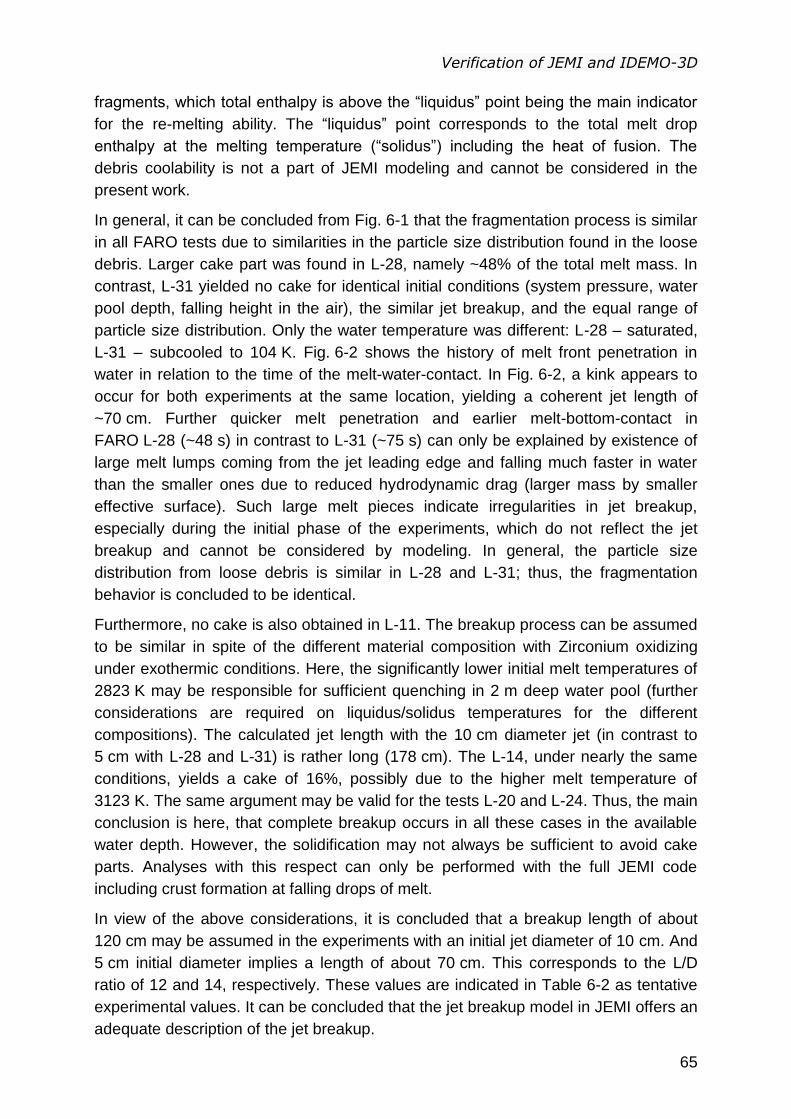
Verification of JEMI and IDEMO-3D
65
fragments, which total enthalpy is above the “liquidus” point being the main indicator
for the re-melting ability. The “liquidus” point corresponds to the total melt drop
enthalpy at the melting temperature (“solidus”) including the heat of fusion. The
debris coolability is not a part of JEMI modeling and cannot be considered in the
present work.
In general, it can be concluded from Fig. 6-1 that the fragmentation process is similar
in all FARO tests due to similarities in the particle size distribution found in the loose
debris. Larger cake part was found in L-28, namely ~48% of the total melt mass. In
contrast, L-31 yielded no cake for identical initial conditions (system pressure, water
pool depth, falling height in the air), the similar jet breakup, and the equal range of
particle size distribution. Only the water temperature was different: L-28 – saturated,
L-31 – subcooled to 104 K. Fig. 6-2 shows the history of melt front penetration in
water in relation to the time of the melt-water-contact. In Fig. 6-2, a kink appears to
occur for both experiments at the same location, yielding a coherent jet length of
~70 cm. Further quicker melt penetration and earlier melt-bottom-contact in
FARO L-28 (~48 s) in contrast to L-31 (~75 s) can only be explained by existence of
large melt lumps coming from the jet leading edge and falling much faster in water
than the smaller ones due to reduced hydrodynamic drag (larger mass by smaller
effective surface). Such large melt pieces indicate irregularities in jet breakup,
especially during the initial phase of the experiments, which do not reflect the jet
breakup and cannot be considered by modeling. In general, the particle size
distribution from loose debris is similar in L-28 and L-31; thus, the fragmentation
behavior is concluded to be identical.
Furthermore, no cake is also obtained in L-11. The breakup process can be assumed
to be similar in spite of the different material composition with Zirconium oxidizing
under exothermic conditions. Here, the significantly lower initial melt temperatures of
2823 K may be responsible for sufficient quenching in 2 m deep water pool (further
considerations are required on liquidus/solidus temperatures for the different
compositions). The calculated jet length with the 10 cm diameter jet (in contrast to
5 cm with L-28 and L-31) is rather long (178 cm). The L-14, under nearly the same
conditions, yields a cake of 16%, possibly due to the higher melt temperature of
3123 K. The same argument may be valid for the tests L-20 and L-24. Thus, the main
conclusion is here, that complete breakup occurs in all these cases in the available
water depth. However, the solidification may not always be sufficient to avoid cake
parts. Analyses with this respect can only be performed with the full JEMI code
including crust formation at falling drops of melt.
In view of the above considerations, it is concluded that a breakup length of about
120 cm may be assumed in the experiments with an initial jet diameter of 10 cm. And
5 cm initial diameter implies a length of about 70 cm. This corresponds to the L/D
ratio of 12 and 14, respectively. These values are indicated in Table 6-2 as tentative
experimental values. It can be concluded that the jet breakup model in JEMI offers an
adequate description of the jet breakup.
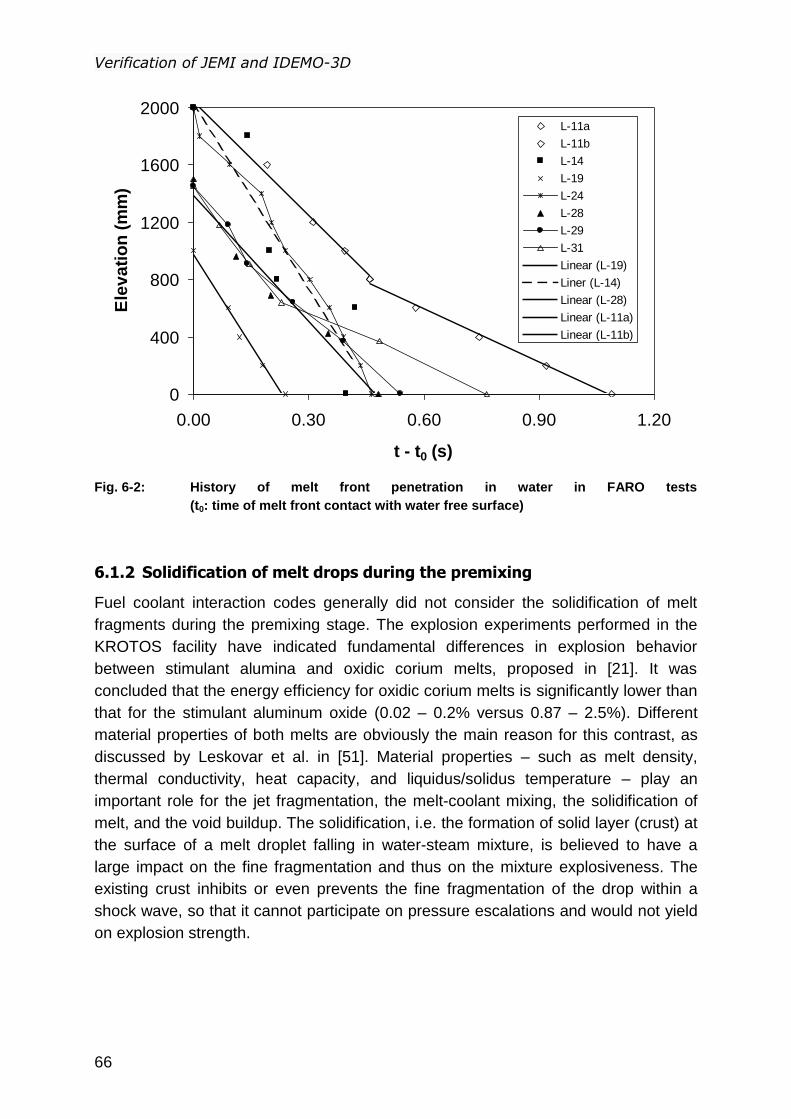
Verification of JEMI and IDEMO-3D
66
Fig. 6-2: History of melt front penetration in water in FARO tests
(t0: time of melt front contact with water free surface)
6.1.2 Solidification of melt drops during the premixing
Fuel coolant interaction codes generally did not consider the solidification of melt
fragments during the premixing stage. The explosion experiments performed in the
KROTOS facility have indicated fundamental differences in explosion behavior
between stimulant alumina and oxidic corium melts, proposed in [21]. It was
concluded that the energy efficiency for oxidic corium melts is significantly lower than
that for the stimulant aluminum oxide (0.02 – 0.2% versus 0.87 – 2.5%). Different
material properties of both melts are obviously the main reason for this contrast, as
discussed by Leskovar et al. in [51]. Material properties – such as melt density,
thermal conductivity, heat capacity, and liquidus/solidus temperature – play an
important role for the jet fragmentation, the melt-coolant mixing, the solidification of
melt, and the void buildup. The solidification, i.e. the formation of solid layer (crust) at
the surface of a melt droplet falling in water-steam mixture, is believed to have a
large impact on the fine fragmentation and thus on the mixture explosiveness. The
existing crust inhibits or even prevents the fine fragmentation of the drop within a
shock wave, so that it cannot participate on pressure escalations and would not yield
on explosion strength.
0
400
800
1200
1600
2000
0.00 0.30 0.60 0.90 1.20
t - t0 (s)
Ele
va
tio
n (
mm
)L-11a
L-11b
L-14
L-19
L-24
L-28
L-29
L-31
Linear (L-19)
Liner (L-14)
Linear (L-28)
Linear (L-11a)
Linear (L-11b)
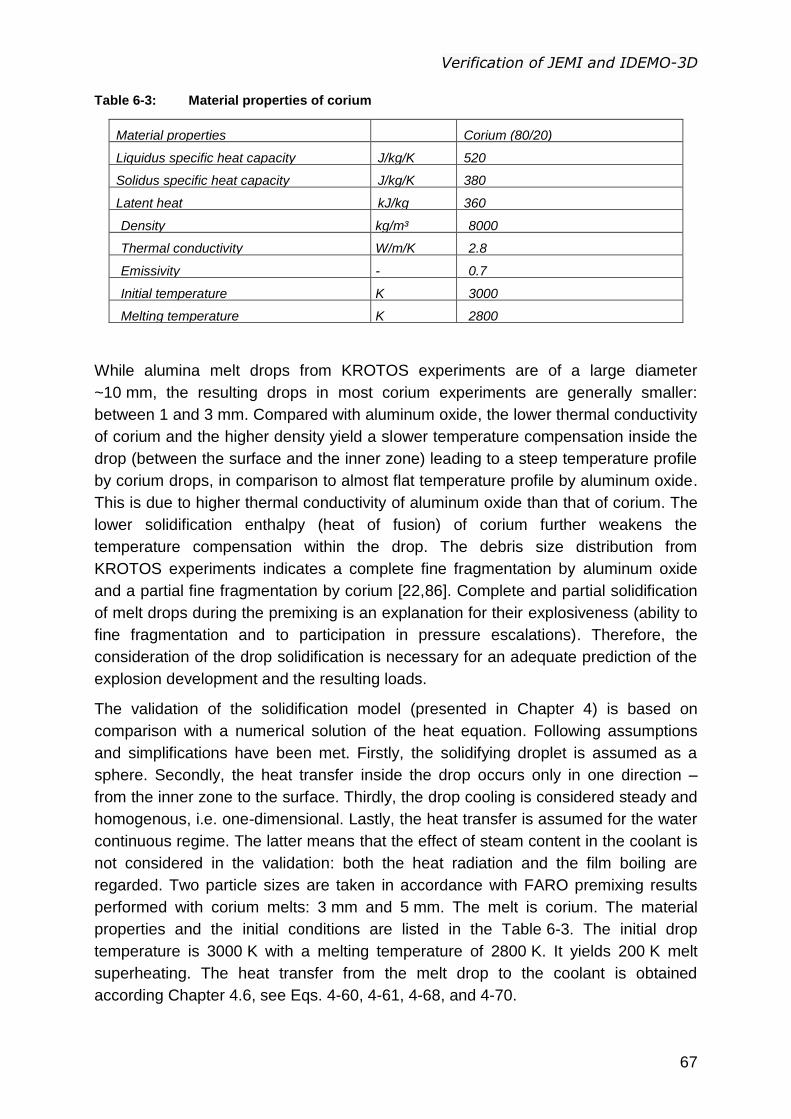
Verification of JEMI and IDEMO-3D
67
Table 6-3: Material properties of corium
Material properties Corium (80/20)
Liquidus specific heat capacity J/kg/K 520
Solidus specific heat capacity J/kg/K 380
Latent heat kJ/kg 360
Density kg/m³ 8000
Thermal conductivity W/m/K 2.8
Emissivity - 0.7
Initial temperature K 3000
Melting temperature K 2800
While alumina melt drops from KROTOS experiments are of a large diameter
~10 mm, the resulting drops in most corium experiments are generally smaller:
between 1 and 3 mm. Compared with aluminum oxide, the lower thermal conductivity
of corium and the higher density yield a slower temperature compensation inside the
drop (between the surface and the inner zone) leading to a steep temperature profile
by corium drops, in comparison to almost flat temperature profile by aluminum oxide.
This is due to higher thermal conductivity of aluminum oxide than that of corium. The
lower solidification enthalpy (heat of fusion) of corium further weakens the
temperature compensation within the drop. The debris size distribution from
KROTOS experiments indicates a complete fine fragmentation by aluminum oxide
and a partial fine fragmentation by corium [22,86]. Complete and partial solidification
of melt drops during the premixing is an explanation for their explosiveness (ability to
fine fragmentation and to participation in pressure escalations). Therefore, the
consideration of the drop solidification is necessary for an adequate prediction of the
explosion development and the resulting loads.
The validation of the solidification model (presented in Chapter 4) is based on
comparison with a numerical solution of the heat equation. Following assumptions
and simplifications have been met. Firstly, the solidifying droplet is assumed as a
sphere. Secondly, the heat transfer inside the drop occurs only in one direction –
from the inner zone to the surface. Thirdly, the drop cooling is considered steady and
homogenous, i.e. one-dimensional. Lastly, the heat transfer is assumed for the water
continuous regime. The latter means that the effect of steam content in the coolant is
not considered in the validation: both the heat radiation and the film boiling are
regarded. Two particle sizes are taken in accordance with FARO premixing results
performed with corium melts: 3 mm and 5 mm. The melt is corium. The material
properties and the initial conditions are listed in the Table 6-3. The initial drop
temperature is 3000 K with a melting temperature of 2800 K. It yields 200 K melt
superheating. The heat transfer from the melt drop to the coolant is obtained
according Chapter 4.6, see Eqs. 4-60, 4-61, 4-68, and 4-70.
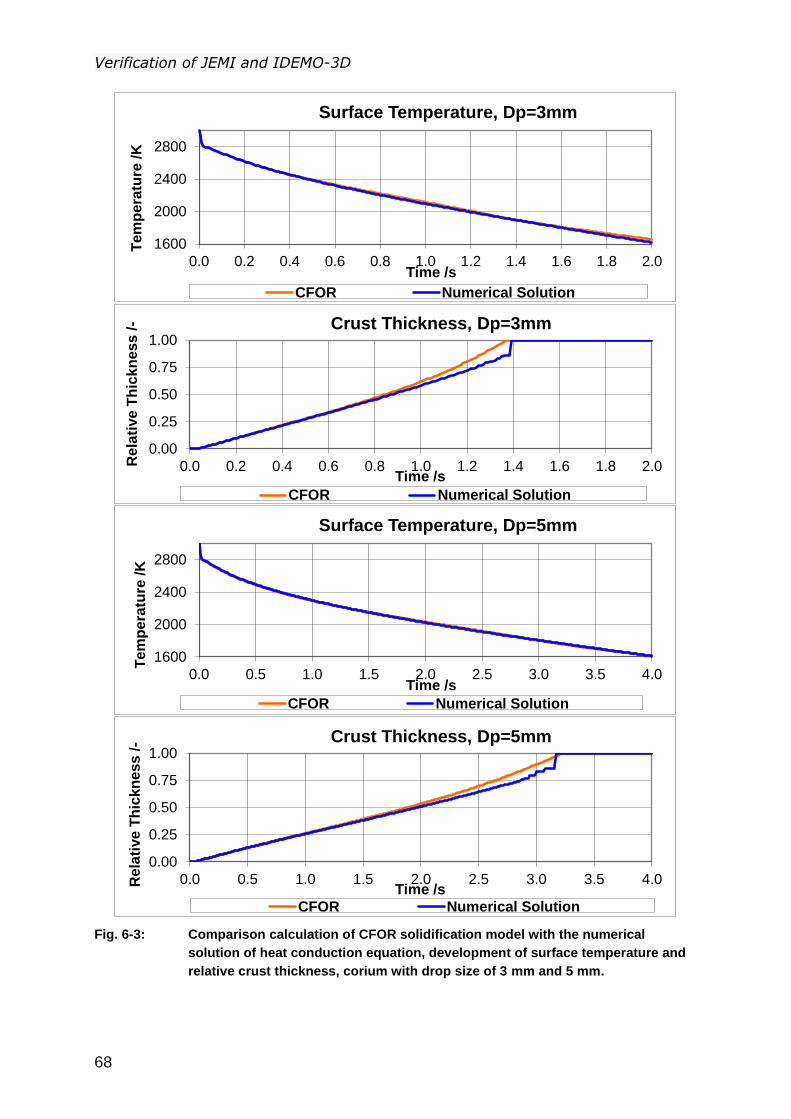
Verification of JEMI and IDEMO-3D
68
Fig. 6-3: Comparison calculation of CFOR solidification model with the numerical
solution of heat conduction equation, development of surface temperature and
relative crust thickness, corium with drop size of 3 mm and 5 mm.
1600
2000
2400
2800
0.0 0.2 0.4 0.6 0.8 1.0 1.2 1.4 1.6 1.8 2.0
Te
mp
era
ture
/K
Time /s
Surface Temperature, Dp=3mm
CFOR Numerical Solution
0.00
0.25
0.50
0.75
1.00
0.0 0.2 0.4 0.6 0.8 1.0 1.2 1.4 1.6 1.8 2.0Re
lati
ve
Th
ick
ne
ss
/-
Time /s
Crust Thickness, Dp=3mm
CFOR Numerical Solution
1600
2000
2400
2800
0.0 0.5 1.0 1.5 2.0 2.5 3.0 3.5 4.0
Te
mp
era
ture
/K
Time /s
Surface Temperature, Dp=5mm
CFOR Numerical Solution
0.00
0.25
0.50
0.75
1.00
0.0 0.5 1.0 1.5 2.0 2.5 3.0 3.5 4.0Re
lati
ve
Th
ick
ne
ss
/-
Time /s
Crust Thickness, Dp=5mm
CFOR Numerical Solution
Verification of JEMI and IDEMO-3D
69
Fig. 6-3 shows the development of the surface temperature and crust thickness over
the time for calculations with 3 mm and 5 mm of drop diameter. The results show a
good agreement between the analytical and numerical solution for both particle sizes
which are considered mostly relevant (based on FARO). Deviations are not observed
until ~78% of the entire drop (corresponding to 40% of radius) is already solidified.
Also, further comparison calculations have been made with another analytical
solidification model HTMOD implemented in the explosion code MC3D, performed by
Ursic [85,87]. Both models were compared with the numerical solution. The major
difference in the modeling concerns the implementation, the numerical procedures,
and the description of interfacial heat transfer from melt to coolant within the
premixing codes MC3D and JEMI. The MC3D treats the droplets using the Eulerian
approach, while JEMI uses the Lagrangian method (as discussed in Chapter 4.5).
The comparison investigation has shown that both models adequately predict the
development of the crust thickness and the surface temperature for a spherical
droplet cooling down in water. It can be concluded that CFOR can be used in JEMI in
order to calculate the development of the surface temperature and crust thickness for
the melt fragments.
6.1.3 JEMI verification on FARO L-24, L-28 and L-31
The experiments FARO L-28 and L-31 give relatively detailed data which allows a
critical check of the calculation results in a comparison. Especially, due to a long melt
pouring of ~ 5 s in FARO L-28 with an initial (outlet) jet diameter of 5 cm, the
establishment of clear conditions is enabled. Generally, long melt pouring of several
seconds and thick melt jets (10 cm to 40 cm of jet diameter) is considered as relevant
for reactor applications.
In FARO L-28, a perfectly constant increase of pressure over 5 s was obtained (after
the initial phase with a stronger increase). This indicates a steady-state behavior of
the mixture. This essentially means a constant rate of jet fragmentation, constant
steam production, and steam release from the mixture. Thus, this experiment is
especially qualified for the code validation. It provides the understanding of the key
features which play a significant role for building critical mixings during the premixing
phase. They are the melt breakup, the melt distribution, the mixing with water and the
void in mixture. The calculations have been carried out using the full breakup model;
the feedback between the jet breakup and the ambient fluid has been taken into
account.
An idealized geometrical configuration has been chosen for the calculations on the
FARO experiments. The calculations were performed in cylindrical coordinates. The
computational domain (R = 0.35 m, H = 3 m) was discretized by 20 radial and 80
axial cells. The heights are chosen according to the experiment, while the outer
annular gas space is not modeled directly. The corresponding gas volume is taken
Verification of JEMI and IDEMO-3D
70
into account by a point model linked to the overflow opening. No vapor re-
condensation released from the mixing zone is considered in this point model. The
initial conditions are given in Table 6-1.
The results of the jet breakup calculated by JEMI (considering the surrounding fluid)
for three tests L-24, L-28 and L-31 are summarized in Table 6-4. Coherent jet length
L, jet diameter at the water surface Dw, the length-diameter ratio L/Dw and the
resulting drop size (sauter mean) dp,SM are obtained. The results have a good
agreement with those in Table 6-2. Complete breakup is obtained in all cases; the
calculated length of the coherent jet is 125 cm for L-24 and 75 cm for L-28 and L-31.
The larger jet length in L-24 is a direct consequence of the larger initial diameter and
outflow rate.
The time development of melt fraction in different void regions for L-28 is given in
Fig. 6-4. The average void fraction over the total pouring duration is 45%. This
corresponds to the experimentally observed steam content. Fig. 6-5 shows the
calculated system pressure development in comparison with the experimental
measurement. It can be seen that the pressure increases with a practically constant
rate for a period of about 5 s. The major result of the evaluations performed by
Bürger [64] is that the quasi-steady behavior, expressed by practically constant
pressure increase for 5 s, is only consistent with a moderate void fraction.
Accordingly, the experimental estimation of average void was ~40%. Fig. 6-4 shows
that the major part of the melt droplets is in a relatively low void range below 50%,
which is consistent with the explanation of the quasi-steady behavior. Pohlner et al.
[40] had investigated the void buildup in L-28 and reproduced it by improving the
formulation of the interfacial friction between steam and water in different flow
regimes (see Chapter 4.2). The improved formulation is also implemented in JEMI.
The discretization for FARO L-31 is the same to FARO L-28. According Table 6-1,
the total melt mass in FARO L-31 with 92 kg is lower than 172 kg in L-28. Due to the
lower melt mass, the melt pouring duration is approximately 3 s, i.e. shorter than that
in FARO L-28. The water sub-cooling of 103 K is associated with the initial water
temperature of 294 K and the saturation temperature of 397 K for system pressure of
0.22 MPa. The calculated particle size is 3.65 mm. It shows a good agreement with
the experiment; see Table 6-4 and Fig. 6-1. Also, the calculated coherent jet length of
0.8 m is very close to the value obtained in the test, Fig. 6-2. The averaged void in
mixture is calculated ~30%, see Fig. 6-6. A lower void in K-31 than that in L-28 was
expected due to high water sub-cooling. The calculated pressure rise of
Δp=0.075 MPa is higher than that in the test, Fig. 6-7. However, the experimental
pressure rise of 0.03 MPa is quite low compared to ~1.2 MPa in L-28. The difference
between the experiment and calculation can be traced back to the fact that no steam
re-condensation in the free volume outside the mixture is regarded by the point
model. Due to high water sub-cooling, a relatively cold atmosphere, and cold walls in
the test facility, the re-condensation of the produced steam could take place in some
manner reducing the system pressure.
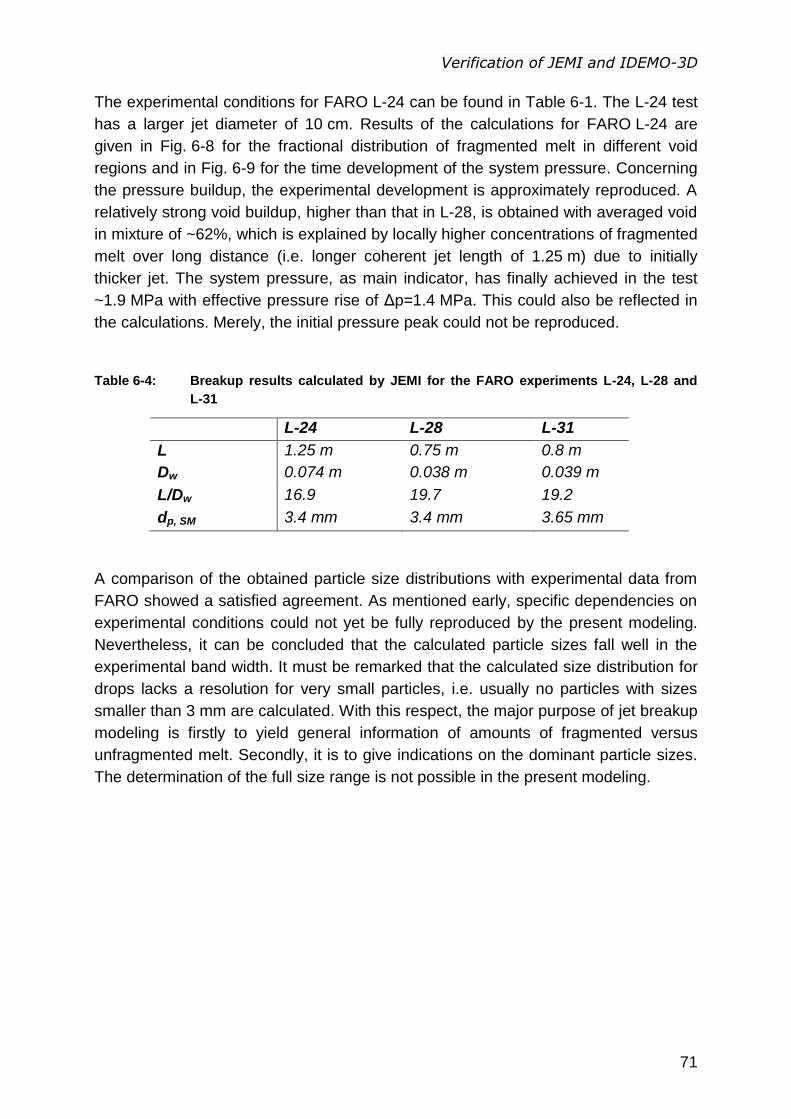
Verification of JEMI and IDEMO-3D
71
The experimental conditions for FARO L-24 can be found in Table 6-1. The L-24 test
has a larger jet diameter of 10 cm. Results of the calculations for FARO L-24 are
given in Fig. 6-8 for the fractional distribution of fragmented melt in different void
regions and in Fig. 6-9 for the time development of the system pressure. Concerning
the pressure buildup, the experimental development is approximately reproduced. A
relatively strong void buildup, higher than that in L-28, is obtained with averaged void
in mixture of ~62%, which is explained by locally higher concentrations of fragmented
melt over long distance (i.e. longer coherent jet length of 1.25 m) due to initially
thicker jet. The system pressure, as main indicator, has finally achieved in the test
~1.9 MPa with effective pressure rise of Δp=1.4 MPa. This could also be reflected in
the calculations. Merely, the initial pressure peak could not be reproduced.
Table 6-4: Breakup results calculated by JEMI for the FARO experiments L-24, L-28 and
L-31
L-24 L-28 L-31
L 1.25 m 0.75 m 0.8 m
Dw 0.074 m 0.038 m 0.039 m
L/Dw 16.9 19.7 19.2
dp, SM 3.4 mm 3.4 mm 3.65 mm
A comparison of the obtained particle size distributions with experimental data from
FARO showed a satisfied agreement. As mentioned early, specific dependencies on
experimental conditions could not yet be fully reproduced by the present modeling.
Nevertheless, it can be concluded that the calculated particle sizes fall well in the
experimental band width. It must be remarked that the calculated size distribution for
drops lacks a resolution for very small particles, i.e. usually no particles with sizes
smaller than 3 mm are calculated. With this respect, the major purpose of jet breakup
modeling is firstly to yield general information of amounts of fragmented versus
unfragmented melt. Secondly, it is to give indications on the dominant particle sizes.
The determination of the full size range is not possible in the present modeling.
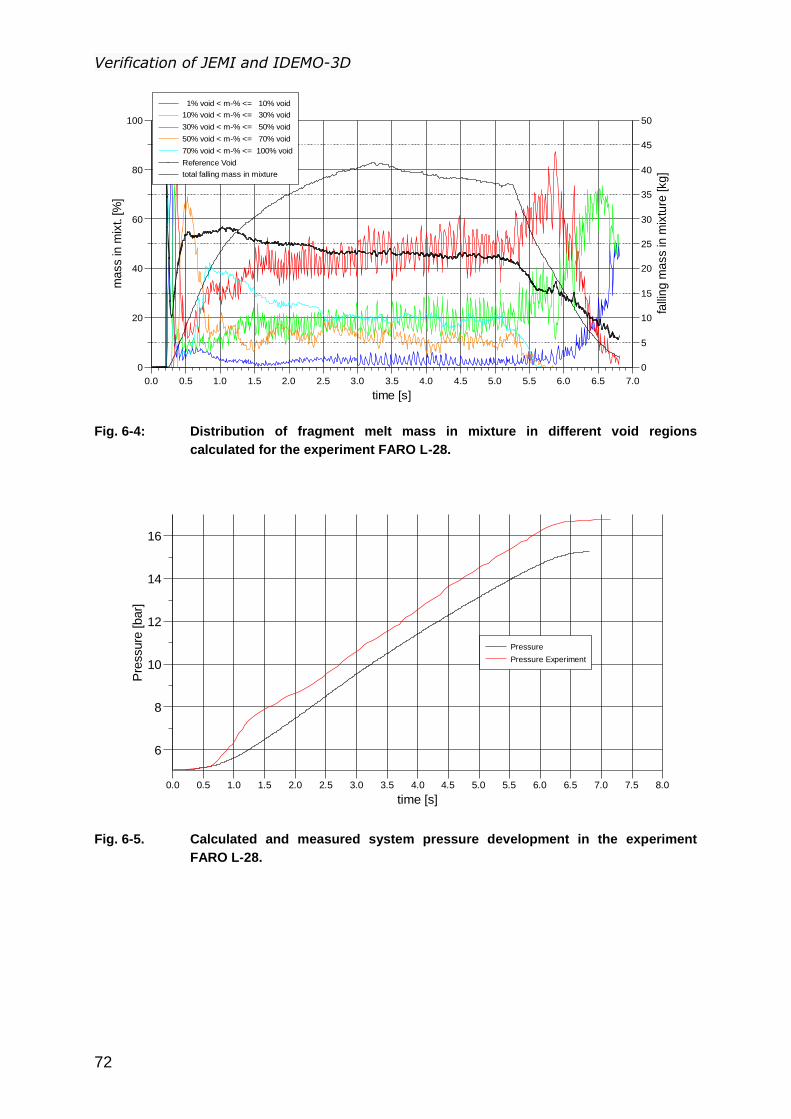
Verification of JEMI and IDEMO-3D
72
Fig. 6-4: Distribution of fragment melt mass in mixture in different void regions
calculated for the experiment FARO L-28.
Fig. 6-5. Calculated and measured system pressure development in the experiment
FARO L-28.
0.0 0.5 1.0 1.5 2.0 2.5 3.0 3.5 4.0 4.5 5.0 5.5 6.0 6.5 7.0
time [s]
0
20
40
60
80
100m
ass in
mix
t. [%
]
0
5
10
15
20
25
30
35
40
45
50
falli
ng
ma
ss in
mix
ture
[kg
]
1% void < m-% <= 10% void
10% void < m-% <= 30% void
30% void < m-% <= 50% void
50% void < m-% <= 70% void
70% void < m-% <= 100% void
Reference Void
total falling mass in mixture
FARO L28
0.0 0.5 1.0 1.5 2.0 2.5 3.0 3.5 4.0 4.5 5.0 5.5 6.0 6.5 7.0 7.5 8.0
time [s]
6
8
10
12
14
16
Pre
ssure
[bar]
Pressure
Pressure Experiment
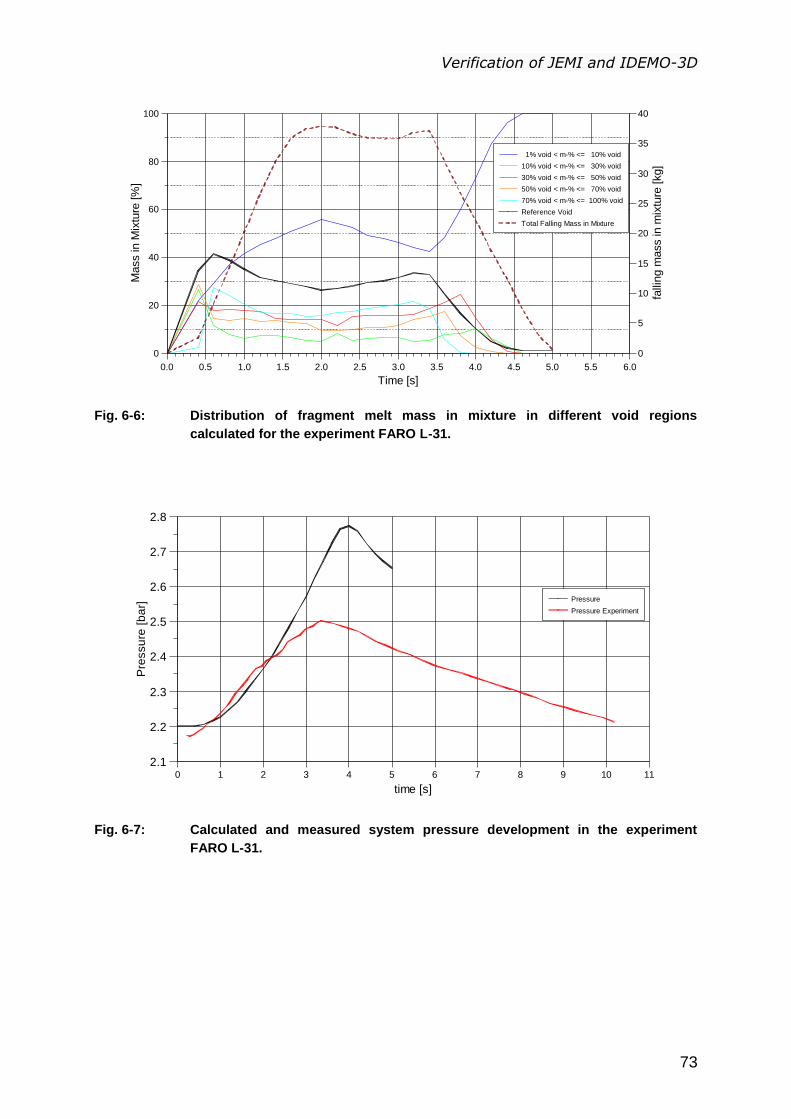
Verification of JEMI and IDEMO-3D
73
Fig. 6-6: Distribution of fragment melt mass in mixture in different void regions
calculated for the experiment FARO L-31.
Fig. 6-7: Calculated and measured system pressure development in the experiment
FARO L-31.
0.0 0.5 1.0 1.5 2.0 2.5 3.0 3.5 4.0 4.5 5.0 5.5 6.0
Time [s]
0
20
40
60
80
100
Mass in M
ixtu
re [%
]
0
5
10
15
20
25
30
35
40
falli
ng m
ass in m
ixtu
re [kg]
1% void < m-% <= 10% void
10% void < m-% <= 30% void
30% void < m-% <= 50% void
50% void < m-% <= 70% void
70% void < m-% <= 100% void
Reference Void
Total Falling Mass in Mixture
0 1 2 3 4 5 6 7 8 9 10 11
time [s]
2.1
2.2
2.3
2.4
2.5
2.6
2.7
2.8
Pre
ssu
re [
ba
r]
Pressure
Pressure Experiment
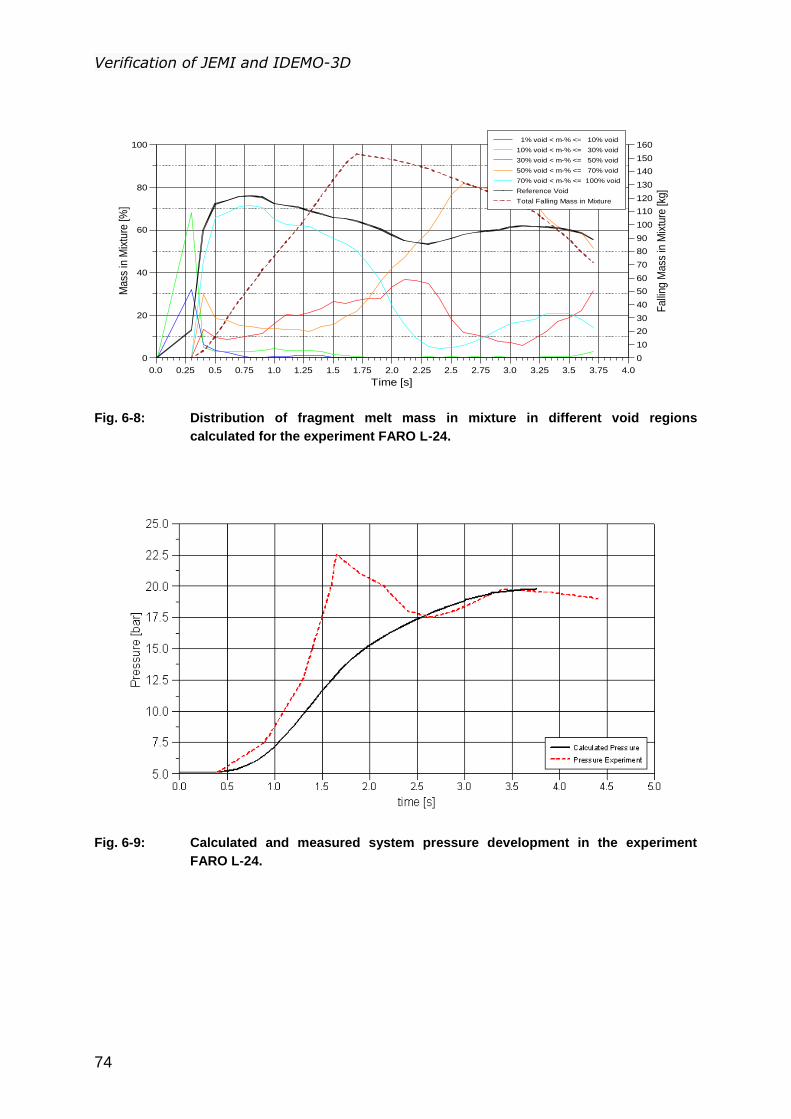
Verification of JEMI and IDEMO-3D
74
Fig. 6-8: Distribution of fragment melt mass in mixture in different void regions
calculated for the experiment FARO L-24.
Fig. 6-9: Calculated and measured system pressure development in the experiment
FARO L-24.
0.0 0.25 0.5 0.75 1.0 1.25 1.5 1.75 2.0 2.25 2.5 2.75 3.0 3.25 3.5 3.75 4.0
Time [s]
0
20
40
60
80
100
Mass
in M
ixtu
re [%
]
0
10
20
30
40
50
60
70
80
90
100
110
120
130
140
150
160
Falli
ng M
ass
in M
ixtu
re [kg
]
1% void < m-% <= 10% void
10% void < m-% <= 30% void
30% void < m-% <= 50% void
50% void < m-% <= 70% void
70% void < m-% <= 100% void
Reference Void
Total Falling Mass in Mixture
FARO L-24
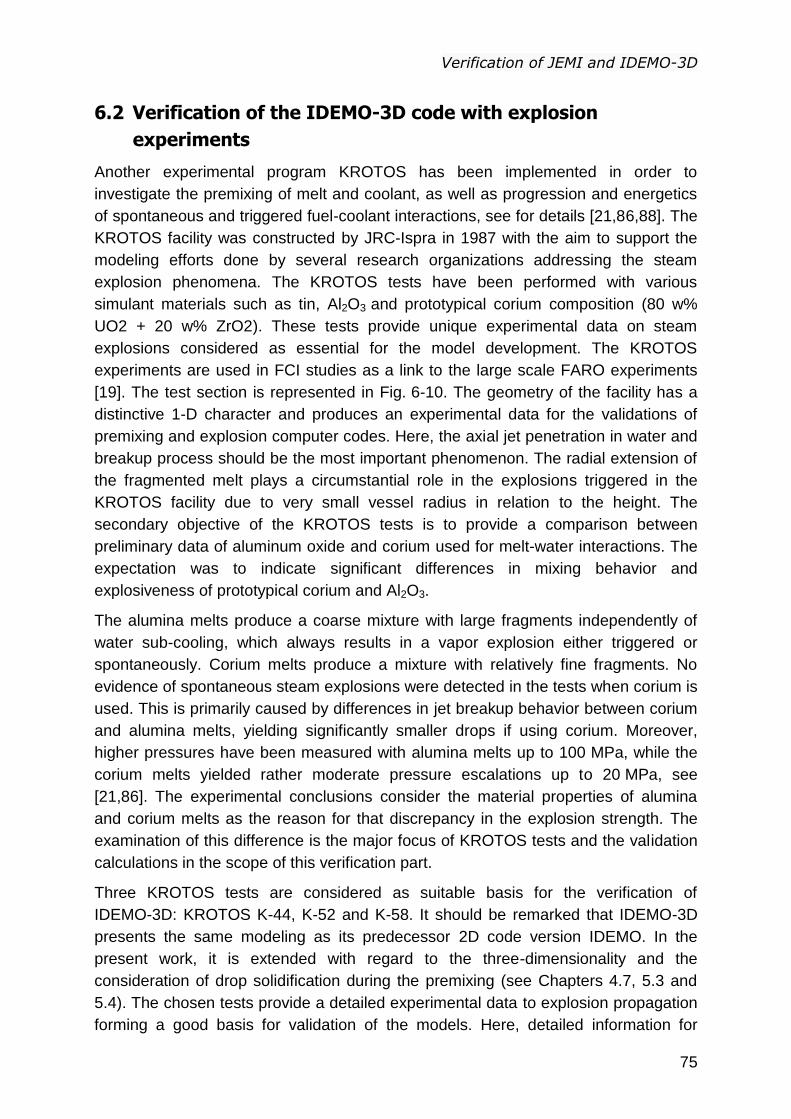
Verification of JEMI and IDEMO-3D
75
6.2 Verification of the IDEMO-3D code with explosion
experiments
Another experimental program KROTOS has been implemented in order to
investigate the premixing of melt and coolant, as well as progression and energetics
of spontaneous and triggered fuel-coolant interactions, see for details [21,86,88]. The
KROTOS facility was constructed by JRC-Ispra in 1987 with the aim to support the
modeling efforts done by several research organizations addressing the steam
explosion phenomena. The KROTOS tests have been performed with various
simulant materials such as tin, Al2O3 and prototypical corium composition (80 w%
UO2 + 20 w% ZrO2). These tests provide unique experimental data on steam
explosions considered as essential for the model development. The KROTOS
experiments are used in FCI studies as a link to the large scale FARO experiments
[19]. The test section is represented in Fig. 6-10. The geometry of the facility has a
distinctive 1-D character and produces an experimental data for the validations of
premixing and explosion computer codes. Here, the axial jet penetration in water and
breakup process should be the most important phenomenon. The radial extension of
the fragmented melt plays a circumstantial role in the explosions triggered in the
KROTOS facility due to very small vessel radius in relation to the height. The
secondary objective of the KROTOS tests is to provide a comparison between
preliminary data of aluminum oxide and corium used for melt-water interactions. The
expectation was to indicate significant differences in mixing behavior and
explosiveness of prototypical corium and Al2O3.
The alumina melts produce a coarse mixture with large fragments independently of
water sub-cooling, which always results in a vapor explosion either triggered or
spontaneously. Corium melts produce a mixture with relatively fine fragments. No
evidence of spontaneous steam explosions were detected in the tests when corium is
used. This is primarily caused by differences in jet breakup behavior between corium
and alumina melts, yielding significantly smaller drops if using corium. Moreover,
higher pressures have been measured with alumina melts up to 100 MPa, while the
corium melts yielded rather moderate pressure escalations up to 20 MPa, see
[21,86]. The experimental conclusions consider the material properties of alumina
and corium melts as the reason for that discrepancy in the explosion strength. The
examination of this difference is the major focus of KROTOS tests and the validation
calculations in the scope of this verification part.
Three KROTOS tests are considered as suitable basis for the verification of
IDEMO-3D: KROTOS K-44, K-52 and K-58. It should be remarked that IDEMO-3D
presents the same modeling as its predecessor 2D code version IDEMO. In the
present work, it is extended with regard to the three-dimensionality and the
consideration of drop solidification during the premixing (see Chapters 4.7, 5.3 and
5.4). The chosen tests provide a detailed experimental data to explosion propagation
forming a good basis for validation of the models. Here, detailed information for
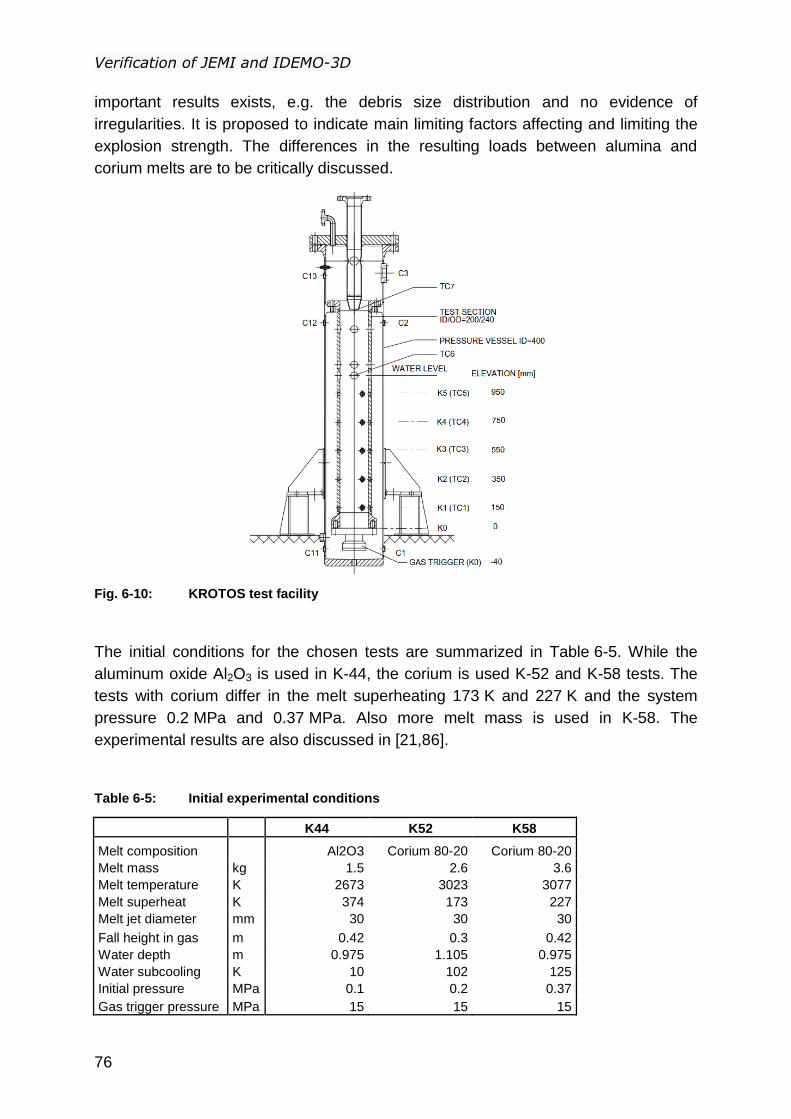
Verification of JEMI and IDEMO-3D
76
important results exists, e.g. the debris size distribution and no evidence of
irregularities. It is proposed to indicate main limiting factors affecting and limiting the
explosion strength. The differences in the resulting loads between alumina and
corium melts are to be critically discussed.
Fig. 6-10: KROTOS test facility
The initial conditions for the chosen tests are summarized in Table 6-5. While the
aluminum oxide Al2O3 is used in K-44, the corium is used K-52 and K-58 tests. The
tests with corium differ in the melt superheating 173 K and 227 K and the system
pressure 0.2 MPa and 0.37 MPa. Also more melt mass is used in K-58. The
experimental results are also discussed in [21,86].
Table 6-5: Initial experimental conditions
K44 K52 K58
Melt composition Al2O3 Corium 80-20 Corium 80-20
Melt mass kg 1.5 2.6 3.6
Melt temperature K 2673 3023 3077
Melt superheat K 374 173 227
Melt jet diameter mm 30 30 30
Fall height in gas m 0.42 0.3 0.42
Water depth m 0.975 1.105 0.975
Water subcooling K 10 102 125
Initial pressure MPa 0.1 0.2 0.37
Gas trigger pressure MPa 15 15 15
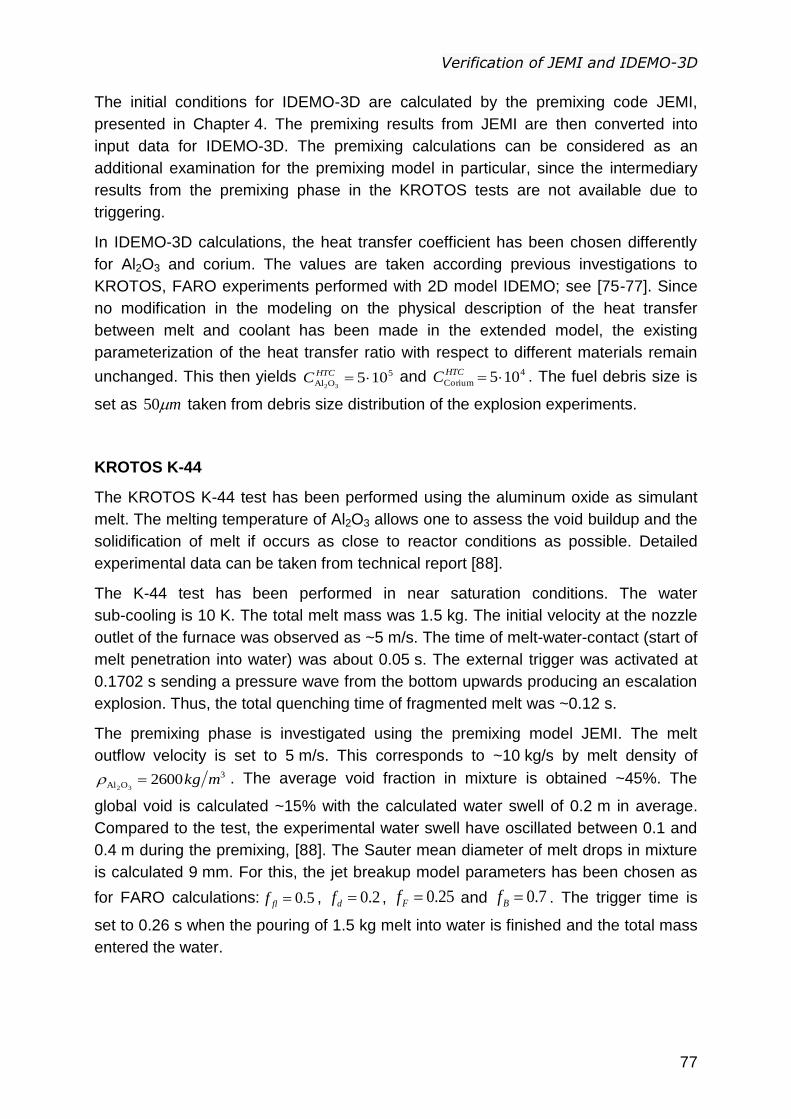
Verification of JEMI and IDEMO-3D
77
The initial conditions for IDEMO-3D are calculated by the premixing code JEMI,
presented in Chapter 4. The premixing results from JEMI are then converted into
input data for IDEMO-3D. The premixing calculations can be considered as an
additional examination for the premixing model in particular, since the intermediary
results from the premixing phase in the KROTOS tests are not available due to
triggering.
In IDEMO-3D calculations, the heat transfer coefficient has been chosen differently
for Al2O3 and corium. The values are taken according previous investigations to
KROTOS, FARO experiments performed with 2D model IDEMO; see [75-77]. Since
no modification in the modeling on the physical description of the heat transfer
between melt and coolant has been made in the extended model, the existing
parameterization of the heat transfer ratio with respect to different materials remain
unchanged. This then yields 5
OAl 10532
HTCC and 4
Corium 105 HTCC . The fuel debris size is
set as m50 taken from debris size distribution of the explosion experiments.
KROTOS K-44
The KROTOS K-44 test has been performed using the aluminum oxide as simulant
melt. The melting temperature of Al2O3 allows one to assess the void buildup and the
solidification of melt if occurs as close to reactor conditions as possible. Detailed
experimental data can be taken from technical report [88].
The K-44 test has been performed in near saturation conditions. The water
sub-cooling is 10 K. The total melt mass was 1.5 kg. The initial velocity at the nozzle
outlet of the furnace was observed as ~5 m/s. The time of melt-water-contact (start of
melt penetration into water) was about 0.05 s. The external trigger was activated at
0.1702 s sending a pressure wave from the bottom upwards producing an escalation
explosion. Thus, the total quenching time of fragmented melt was ~0.12 s.
The premixing phase is investigated using the premixing model JEMI. The melt
outflow velocity is set to 5 m/s. This corresponds to ~10 kg/s by melt density of 3
OAl 260032
mkg . The average void fraction in mixture is obtained ~45%. The
global void is calculated ~15% with the calculated water swell of 0.2 m in average.
Compared to the test, the experimental water swell have oscillated between 0.1 and
0.4 m during the premixing, [88]. The Sauter mean diameter of melt drops in mixture
is calculated 9 mm. For this, the jet breakup model parameters has been chosen as
for FARO calculations: 5.0flf , 2.0df , 25.0Ff and 7.0Bf . The trigger time is
set to 0.26 s when the pouring of 1.5 kg melt into water is finished and the total mass
entered the water.
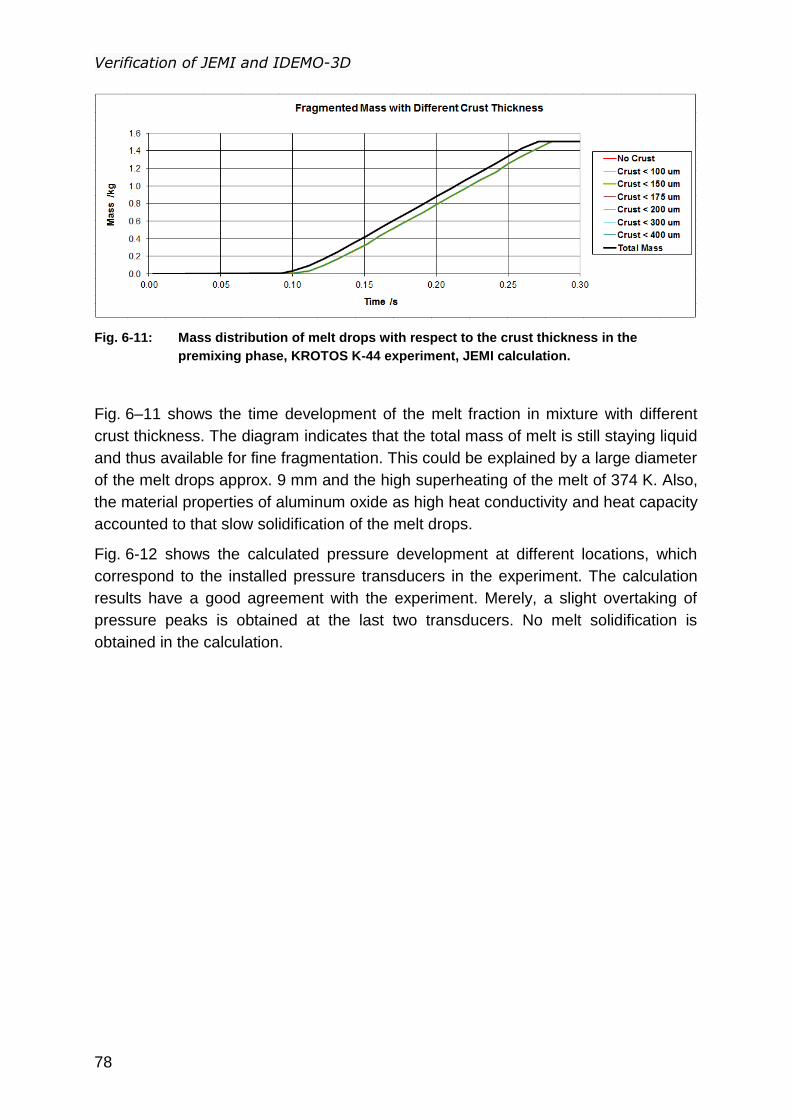
Verification of JEMI and IDEMO-3D
78
Fig. 6-11: Mass distribution of melt drops with respect to the crust thickness in the
premixing phase, KROTOS K-44 experiment, JEMI calculation.
Fig. 6–11 shows the time development of the melt fraction in mixture with different
crust thickness. The diagram indicates that the total mass of melt is still staying liquid
and thus available for fine fragmentation. This could be explained by a large diameter
of the melt drops approx. 9 mm and the high superheating of the melt of 374 K. Also,
the material properties of aluminum oxide as high heat conductivity and heat capacity
accounted to that slow solidification of the melt drops.
Fig. 6-12 shows the calculated pressure development at different locations, which
correspond to the installed pressure transducers in the experiment. The calculation
results have a good agreement with the experiment. Merely, a slight overtaking of
pressure peaks is obtained at the last two transducers. No melt solidification is
obtained in the calculation.
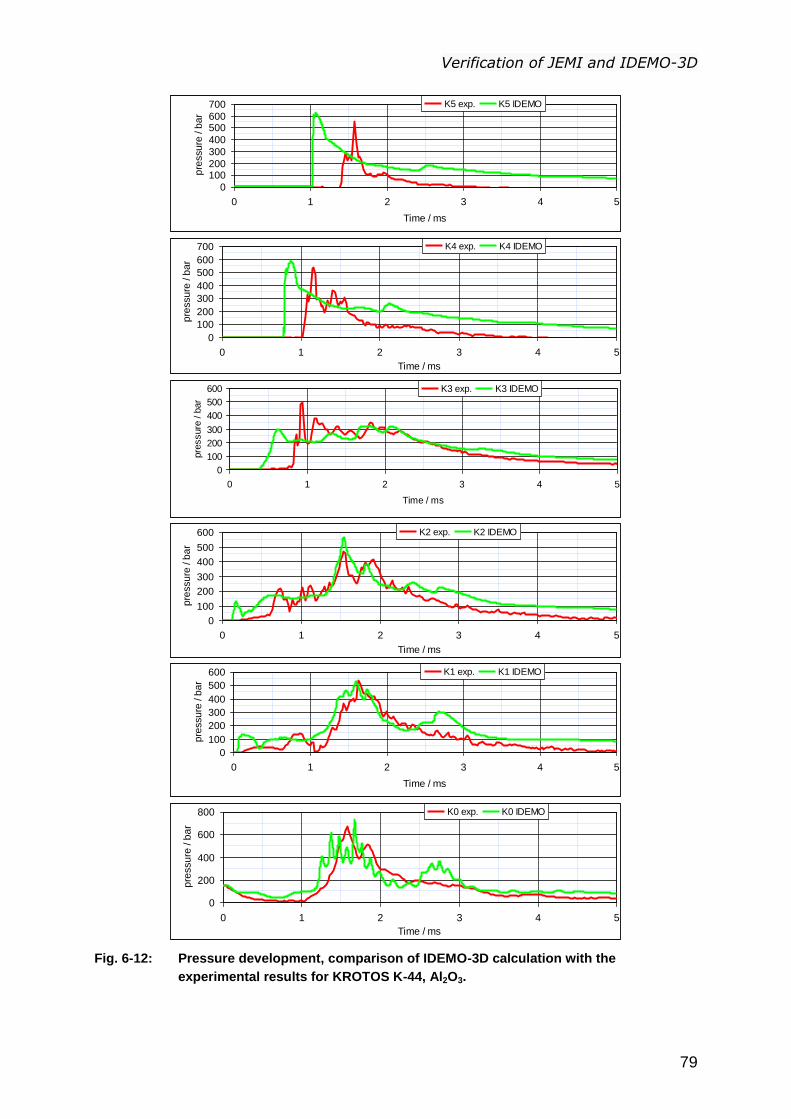
Verification of JEMI and IDEMO-3D
79
Fig. 6-12: Pressure development, comparison of IDEMO-3D calculation with the
experimental results for KROTOS K-44, Al2O3.
0
100200
300
400
500600
700
0 1 2 3 4 5
Time / ms
pre
ssu
re / b
ar
K5 exp. K5 IDEMO
0
100
200
300
400
500
600
700
0 1 2 3 4 5
Time / ms
pre
ssu
re / b
ar
K4 exp. K4 IDEMO
0
100
200
300
400
500
600
0 1 2 3 4 5
Time / ms
pre
ssure
/ b
ar
K3 exp. K3 IDEMO
0
100
200
300
400
500
600
0 1 2 3 4 5
Time / ms
pre
ssu
re / b
ar
K2 exp. K2 IDEMO
0
100
200
300
400
500
600
0 1 2 3 4 5
Time / ms
pre
ssu
re / b
ar
K1 exp. K1 IDEMO
0
200
400
600
800
0 1 2 3 4 5
Time / ms
pre
ssu
re / b
ar
K0 exp. K0 IDEMO
Verification of JEMI and IDEMO-3D
80
KROTOS K-52
The KROTOS K-52 test has been performed using the corium melt. Detailed
experimental results can be found in [21]. The water sub-cooling was 102 K. The
observed void fraction during the premixing was relatively low, about 13%. The
external trigger was activated at 0.7 s. The time of melt-water-contact (start of melt
penetration into water) was about 0.3 s. Thus, the total quenching time of fragmented
melt was ~0.4 s.
The premixing phase is calculated using the premixing model JEMI. The melt flow
rate from the furnace outlet is assumed to be ~10 kg/s, which corresponds to a melt
outflow velocity of ~2 m/s. The first melt-water-contact is calculated at 0.13 s. The
trigger time set to 0.4 s. This is the time with maximum fragmented melt mass in
mixture staying liquid. The Sauter mean diameter of melt drops is calculated as
3.3 mm. For this, the jet breakup model parameters has been chosen as for FARO
calcualtions: 5.0flf , 2.0df , 25.0Ff and 7.0Bf . The average void fraction in
mixture at the trigger time is estimated ~22%.
Fig. 6-13: Mass distribution of melt drops with respect to the crust thickness in the
premixing phase, KROTOS K-52 experiment, JEMI calculation.
Fig. 6-13 shows the mass distribution of fragmented melt in mixture with respect to
crust thickness. This indicates the mass fraction in mixture available for fine
fragmentation in the explosion stage. At triggering, only 0.6 kg (23%) of the melt has
no crust and ~1.5 kg (~58%) have the crust thickness of ~0.15 mm (10% of the drop
radius). The relative crust thickness of ~10% is experimentally observed to be a
physical limitation for fine fragmentation, see [10,12,15]. Above it, a strong decrease
of fine fragmentation ability of melt drops in a shear flow is observed. Thick crust on
drops inhibits the fine fragmentation and reduces the explosiveness of the mixture.
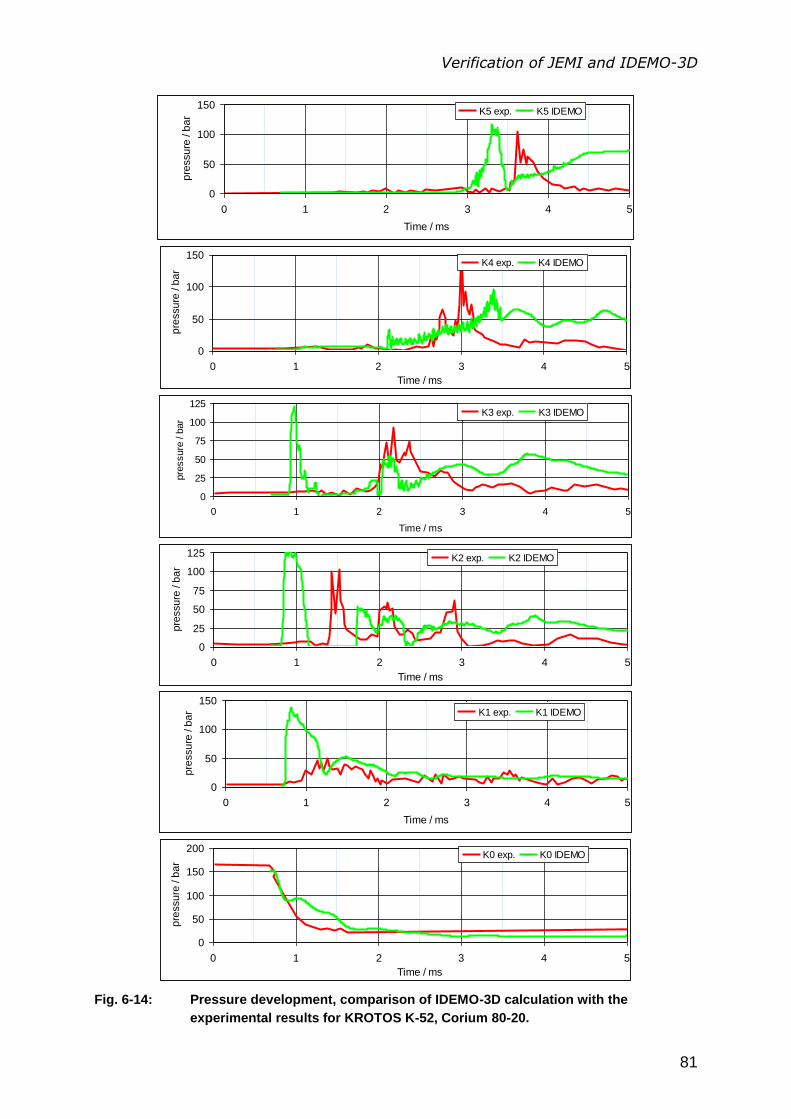
Verification of JEMI and IDEMO-3D
81
Fig. 6-14: Pressure development, comparison of IDEMO-3D calculation with the
experimental results for KROTOS K-52, Corium 80-20.
0
50
100
150
0 1 2 3 4 5
Time / ms
pre
ssu
re / b
ar
K5 exp. K5 IDEMO
0
50
100
150
0 1 2 3 4 5
Time / ms
pre
ssu
re / b
ar
K4 exp. K4 IDEMO
0
25
50
75
100
125
0 1 2 3 4 5
Time / ms
pre
ssure
/ b
ar
K3 exp. K3 IDEMO
0
25
50
75
100
125
0 1 2 3 4 5
Time / ms
pre
ssu
re / b
ar
K2 exp. K2 IDEMO
0
50
100
150
0 1 2 3 4 5
Time / ms
pre
ssu
re / b
ar K1 exp. K1 IDEMO
0
50
100
150
200
0 1 2 3 4 5
Time / ms
pre
ssu
re / b
ar
K0 exp. K0 IDEMO
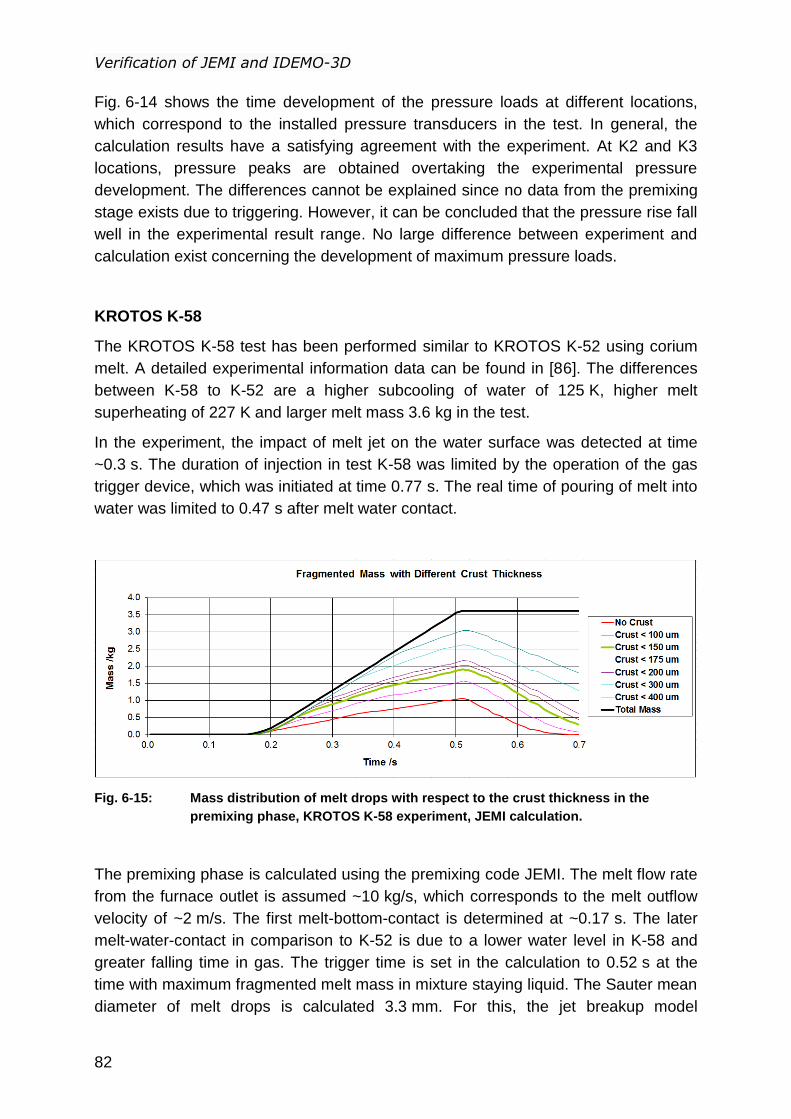
Verification of JEMI and IDEMO-3D
82
Fig. 6-14 shows the time development of the pressure loads at different locations,
which correspond to the installed pressure transducers in the test. In general, the
calculation results have a satisfying agreement with the experiment. At K2 and K3
locations, pressure peaks are obtained overtaking the experimental pressure
development. The differences cannot be explained since no data from the premixing
stage exists due to triggering. However, it can be concluded that the pressure rise fall
well in the experimental result range. No large difference between experiment and
calculation exist concerning the development of maximum pressure loads.
KROTOS K-58
The KROTOS K-58 test has been performed similar to KROTOS K-52 using corium
melt. A detailed experimental information data can be found in [86]. The differences
between K-58 to K-52 are a higher subcooling of water of 125 K, higher melt
superheating of 227 K and larger melt mass 3.6 kg in the test.
In the experiment, the impact of melt jet on the water surface was detected at time
~0.3 s. The duration of injection in test K-58 was limited by the operation of the gas
trigger device, which was initiated at time 0.77 s. The real time of pouring of melt into
water was limited to 0.47 s after melt water contact.
Fig. 6-15: Mass distribution of melt drops with respect to the crust thickness in the
premixing phase, KROTOS K-58 experiment, JEMI calculation.
The premixing phase is calculated using the premixing code JEMI. The melt flow rate
from the furnace outlet is assumed ~10 kg/s, which corresponds to the melt outflow
velocity of ~2 m/s. The first melt-bottom-contact is determined at ~0.17 s. The later
melt-water-contact in comparison to K-52 is due to a lower water level in K-58 and
greater falling time in gas. The trigger time is set in the calculation to 0.52 s at the
time with maximum fragmented melt mass in mixture staying liquid. The Sauter mean
diameter of melt drops is calculated 3.3 mm. For this, the jet breakup model
Verification of JEMI and IDEMO-3D
83
parameters has been chosen: 5.0flf , 2.0df , 25.0Ff and 7.0Bf . The average
void fraction in mixture at the triggering time is estimated ~22%.
Fig. 6-15 shows, similar to K-52, the time development of the mass of fragmented
melt with respect to the crust thickness indicating the solidification of the melt. At the
triggering time, only 0.9 kg (23%) of the melt have no crust and ~1.5 kg (~58%) have
the crust thickness of ~0.15 mm (10% of the drop radius).
Fig. 6-16 shows the calculated pressure development at different locations, which
correspond to the experimental pressure transducers. As in K-52, no propagating
energetic steam explosion is produced in the calculation. Differences between the
experimental and calculation results are obtained in the peak onset. These
differences cannot be explained since no data from the premixing phase exists due
to triggering. The different behavior of the mixture during the detonation might be led
back to some uncertainties or inhomogeneities in melt outflow from the nozzle and
thus the jet breakup that is not considered in the theoretical investigation. In general,
the calculation results have a good agreement with the experiment with respect to
the peak pressure loads. Similar to K-52, the pressure rise fall well in the
experimental result range.
In contrast to the previous investigations, the current results did not lead to any
overestimation. The explanation is that the solidification during the premixing phase,
which is considered in the present modeling, plays a significant role during the
explosion. The final conclusion is that the solidification of melt fragments during the
premixing phase limits the explosiveness of the entire mixture in the explosion phase.
Moreover, the drop solidification accounts for the difference between corium und
aluminum oxide concerning the development of pressure loads.

Verification of JEMI and IDEMO-3D
84
Fig. 6-16: Pressure development, comparison of IDEMO-3D calculation with the
experimental results for KROTOS K-58, Corium 80-20.
0
50
100
150
0 1 2 3 4 5
Time / ms
pre
ssu
re / b
ar
K5 exp. K5 IDEMO
0
50
100
150
0 1 2 3 4 5
Time / ms
pre
ssu
re / b
ar
K4 exp. K4 IDEMO
0
50
100
150
200
0 1 2 3 4 5
Time / ms
pre
ssure
/ b
ar
K3 exp. K3 IDEMO
0
25
50
75
100
125
0 1 2 3 4 5
Time / ms
pre
ssu
re / b
ar
K2 exp. K2 IDEMO
0
50
100
150
0 1 2 3 4 5
Time / ms
pre
ssu
re / b
ar K1 exp. K1 IDEMO
0
50
100
150
200
0 1 2 3 4 5
Time / ms
pre
ssu
re / b
ar
K0 exp. K0 IDEMO
Reactor applications
85
7 Reactor applications
Severe accidents with steam explosions are caused by core melting. Such a scenario
postulates the loss of coolant with permanent dry-out of the reactor core. These
accidents are the outcome of a failure in the main and emergency cooling systems
following, for instance, an earthquake, external or internal flooding, which are usually
beyond the plant design due to extremely low occurrence frequency but still
probable, as the Japanese accident on March 11th 2011 demonstrated. They have a
large impact on the environment and the population. Therefore, they need to be
analyzed in terms of the possible consequences. Without cooling, fuel rods start to
melt due to the decay heat and build up a melt pool inside the core region of the
reactor vessel. Due to the permanent heating up and melting of the surrounding
structures, the melt flows downwards into the core support plate or sideways into the
core barrel. Through open channels in the support plate or over the down-comer, the
melt driven by gravity forms jets and comes into contact with water expected to be in
the lower part of the RPV. Once in contact with water, the melt breaks up into small
fragments in size ranging from a few millimeters and mixes with water. High heat
transfer from the fragmented melt produces a vapor film around the melt fragments.
This vapor film then reduces the heat exchange between the melt fragments and the
surrounding coolant slowing down the solidification process of the melt. This mixture
is then designated quasi-stable. Under film boiling, the fragmented melt evaporates
part of the water resulting in a certain amount of void (steam content) in the pre-
mixture. Once a destabilization of the vapor film around the melt drops (film collapse)
has occurred, a rapid local pressure rise ensues, due to strong heat exchange
between the melt and coolant and generation of a shock wave, which travels through
the mixture causing further film collapse. The interaction of the steam, water and
fragmented melt, as well as the balance of steam production and steam removal
determines the explosiveness of the mixture.
Generally, there are three accident management (AM) strategies for a severe
accident with core melting. The first calls for flooding the reactor cavity and
submerging the reactor vessel. The concept has been implemented in the
Westinghouse Advanced Plant (AP1000). It is based on the idea that the lower head
will arrest the downward relocation of the degraded core from the RPV, by being
cooled externally. The mechanism for heat removal from the molten debris in the
lower plenum is the nucleate pool boiling of the cavity water. However, in light of the
structural complexity in the lower head of the vessel, a failure in the lower head
cannot be excluded for all reactor designs, especially as the BWR‟s have the control
rods channels located there. Esmaili et al. [89] investigated the likelihood of a lower
head failure and ex-vessel fuel coolant interaction for the AP1000. The investigation
showed that the thermal failure of the lower head due to the focusing effect of the
stratified light melt layer may be envisaged in certain circumstances leading to the
possibility of ex-vessel FCI‟s. The second strategy addresses the use of the core
catcher below the reactor vessel. The core catcher uses thick concrete and a passive
Reactor applications
86
cooling to prevent the molten core from escaping the containment. The core catcher
is used in several reactor designs, e.g. EPR from Areva, ESBWR from GE-Hitachi,
US-APWR from Mitsubishi and VVER-1200 from Gidropress/Rosatom. The last
strategy consists in flooding the reactor cavity without submerging the RPV used in
the reactor designs of Generations II and III. The idea is to allow the disintegration of
the RPV by thermal loads from molten debris and thus the relocation of the molten
materials from the lower head into the reactor cavity filled with water. The molten
debris breaks up in water and settles on the cavity floor forming a coolable debris
bed configuration.
During contact of the molten debris with water in the cavity, explosive mixing
configurations can form, potentially leading to an ex-vessel vapor explosion. Various
outflow configurations are possible: from a central outflow with large distances to the
surrounding structures up to lateral outflows in closer proximity to the cavity wall. In
case of melt outflows far away from any structures (e.g. central melt outflow),
pressure loads generated during fuel-coolant interactions are rapidly dampened by
large amounts of water remaining present in the vicinity. The resulting loads on the
surrounding structures are significantly lower than those inside the interaction zone.
By fuel-coolant interactions close to a structure, significantly higher pressure loads
can result on the structure due to a smaller distance from the “epicenter” of the
pressure increase. Adjacent structures can also affect the interaction of melt and
water: both mitigating and enhancing. For instance, the cavity wall during ex-vessel
fuel coolant interactions constrains the lateral extension of the mixture close to the
wall.
The main focus is to address the extent and distribution of the melt and void due to
geometrical constraints affecting the buildup of explosive mixtures. The extent (i.e.
concentration and dilution) of the mixture is a key characteristic of the mixture
explosiveness. The dilution of the mixture generally leads to a better spatial
distribution of the melt and also to the void fraction decreasing the melt concentration
and reducing the steam content in the mixing zone by “stretching” the mixing region.
High steam content acts as a limiting factor on the pressure increase, dampening
shock waves due to its high compressibility. Void reduction always brings as a
consequence an increase in the resulting pressure loads. High melt concentrations
possibly occurring in non-central configurations support pressure increases due to
high concentrations of thermal energy being able to be released. On the other hand,
such melt concentrations also cause a very intense evaporation in those regions
counteracting local pressure buildup. However, reducing the melt fraction by
extending the mixture (no change in mass) also supports a void reduction. Therefore,
the spatial extent of the melt and void is one of the most important aspects in multi-
dimensional investigations.
The present work addresses primarily the investigation of non-symmetrical (i.e. three
dimensional) effects caused by geometrical asymmetry. Their role has to be
investigated considering the main limiting factors for vapor explosions, such as the

Reactor applications
87
melt fragmentation, the void fraction in the mixture, the solidification of the melt,
explosion venting etc. 2D and 3D calculations have to be performed for an ex-vessel
reactor scenario with a non-symmetric configuration in order to assess three-
dimensional effects on the explosion potential and resulting loads, which can
challenge the integrity of the primary containment. The calculation results must be
compared and the impact of the asymmetry should be derived.
Reactor applications
88
7.1 Investigation to 3D effect in reactor applications
Previously, investigations to asymmetry had been attempted using two-dimensional
models IKEJET/IKEMIX and IDEMO by Vujic [77]. Generally, there are two ways to
analyze such non-symmetric configurations with a lateral melt outflow in 2D. In the
first approach, the reactor cavity is considered in 2D cylindrical coordinate system. In
this latter case, a non-symmetrical melt outflow is assumed by considering the real
melt delivery. This leads to an azimuthal “smearing” of the melt pour. The result is a
strong dilution of melt fraction in the mixture. The diluted melt fraction causes a weak
evaporation and a strong underestimation of void buildup. The latter acts (as
discussed earlier) as the main limiting factor during the explosion phase. The second
method is a configuration with a central jet in cylindrical geometry. The radial
extension of the calculation domain is varied in order to assess the „averaged‟
mixture behavior and the role of the adjacent wall. The extent of the fragmented melt
and produced steam are dependent of the domain radius due to the confining effect
of the domain boundaries. The question concerning the extension of the mixture due
to the wall influence cannot be answered adequately in reality. Vujic [77] considered
the second method as more appropriate and applied it to an in-vessel reactor
scenario with vapor explosions. Vujic used the 2D code versions for premixing and
explosion (IKEJET/IKEMIX, IDEMO) to investigate the main limiting effects on a
steam explosion with a geometrical constraint.
Fig. 7-1: Schematic illustration of ex-vessel case with an asymmetric melt jet outflow
from the RPV into the reactor cavity filled with water; front, top and simplified
views.
With the presently developed code versions JEMI and IDEMO-3D, the asymmetry
(three-dimensional) effects can now be checked with the real geometry. A qualitative
comparison with the prediction for the explosion strength performed by Vujic [77] is
then feasible. In order to achieve this, calculations are necessary in full 3D Cartesian
Reactor applications
89
geometry and in 2D cylindrical geometry with a lateral melt pouring from the RPV into
the reactor cavity filled with saturated water, see Fig. 7-1.
Table 7-1: Scenario initial conditions
System pressure MPa 0.2
Initial water temperature K 408
Water level m 1.0 / 2.0
Melt composition - corium 80/20
Initial melt temperature K 3050
Jet release m 2.33
Jet diameter cm 10 / 20 / 40
Mass flow rate kg/s 188 / 754 / 3016
Calculation domain:
LxBxH m³ 4x4x4
Distance jet-wall m 0.4
The initial conditions for 2D and 3D calculations are presented in Table 7-1. The melt
is corium 80/20 with an initial temperature of 3050 K (melt superheat of 150 K). It
comes in contact with saturated water in the reactor cavity with a system pressure of
0.2 MPa. A pressure of 0.2 MPa is considered realistic during an accident with core
melting, since a moderate over-pressurization of the primary containment is
expected. The following variations of mass flow rate are considered: 188, 754 and
3016 kg/s. The water level is assumed to be 1 and 2 m. The distance between the
melt jet axis the cavity wall is 0.4 m. The jet release is set in all variations at the
height of 2.33 m. The 2D calculations are performed in a cylindrical geometry with a
height of 4 m and the radius of 1 m for premixing. The author [65] investigated the
effect of close walls on the mixture extension by varying the calculation domain
radius. The variations showed different behavior in the mixture with different radial
extensions. With the smallest radial extension, a strong concentration of the melt can
be produced leading to high voiding of the mixing zone. With larger radial domain
extensions, the effect of the RPV wall cannot be adequately covered. The largest
melt mass in the region with limited void was obtained with intermediate distances. It
was explained by flows in radial and azimuthal direction of void and melt from the
regions close to the wall due to high vaporization and pressure buildup. The variation
of the calculation domain radius was also considered by Vujic [77] in calculations for
a single melt jet in direct proximity to a wall for similar initial conditions. The radius of
1 m was found as a fair estimate for the “averaged” mixture behavior during the
premixing, i.e. the melt extent and vaporization of the mixing zone.
The domain radius for the explosion calculations is set at 0.4 m – the minimal
distance between the jet axis and the cavity wall. It leads to obtaining the maximum
loads at the wall and excluding the dampening effect of surrounding water. The 3D
calculations are performed using a Cartesian geometry. The domain size is chosen
as 4.0 x 4.0 x 4.0 m3 for the length, width and height, respectively. The cylindrical
Reactor applications
90
geometry of the cavity plays a minor role during the premixing and explosion phase
due to the very large dimension and thus can be neglected.
7.1.1 Premixing phase
The 2D calculations for the premixing phase are performed using the JEMI program
code in cylindrical coordinates with one central melt jet. Fig 7-2 shows the numerical
discretization of the calculation domain for 2D calculations. The domain radius is 1 m
and the height is 4 m. Two water pool depths are studied: 1 m (a) and 2 m (b). The
3D calculations are carried out using JEMI in 3D Cartesian coordinates. The domain
geometry and the numerical discretization in 3D calculations are shown in Fig. 7-3.
Two different types of nodalization are presented for numerical reasons: for water
levels of 1 m and 2 m. The melt outflow is represented as a melt jet close to the wall;
see Fig. 7-3 (top). The cylindrical form of the reactor cavity is not modeled. The
nodalization of both 2D and 3D configurations is identical, in order to avoid
discretization effects.
a) , b)
Fig. 7-2: Numerical discretization used for premixing calculations performed with JEMI
code in 2D, central melt jet, with water level of 1 m (a) and 2 m (b).
Table 7-2 shows the results from the investigations with JEMI in a cylindrical
geometry using 2D approximations. The investigation results of the 3D calculations
are summarized in Table 7-3. In both cases, the depth of the water pool and the
mass flow rate have been varied. Six configurations are studied: for a water level of 1
and 2 m and a mass flow rate of 188, 754 and 3016 kg/s. As discussed in Chapter 3,
the fragmented melt mass mixed with limited void is considered as the main
Reactor applications
91
characteristic for the mixture explosiveness. Fragmented melt mass is a key factor
during steam explosion indicating the stored thermal energy available for release, i.e.
available for conversation into mechanical work. The void leads to a moderation
factor for pressure increases. For this, the role of geometrical constraints has to be
discussed.
In order to assess the proportion of melt and void, the explosiveness potential of the
pre-mixture, four different regions are distinguished with respect to melt and steam
contents: the mass of fragmented melt in the mixture with a void less than 30%, 40%,
50%, 60%. The results are estimated at the first melt-bottom-contact (MBC). MBC is
defined as the first contact of melt jet with the bottom by incomplete jet breakup or
the moment of departure of the first melt fragments on the bottom if the melt jet is
completely fragmented in water. MBC is assumed as the most likely moment when a
steam explosion will be triggered due to entrapment of water by melt resulting in
direct contact between the melt and the water. This induces an initial pressure rise
generating a shock wave, which propagates through the mixture causing a vapor film
collapse and fine fragmentation of melt drops inducing further pressure increases. In
the configurations with a water level of 1 m, the MBC is obtained at 0.45 s. In cases
with a water level of 2 m, the MBC is obtained at 0.79, 0.45 and 0.45 s for a jet
diameter of 10, 20 and 40 cm, this is identical in 2D and 3D calculations. Except for
the case with a jet diameter of 10 cm and water height of 2 m, the coherent jet
contacts the bottom earlier than the fragmented melt due to the lower hydrodynamic
drag of the jet modeled as a cylinder falling by gravity into water. Here, an incomplete
jet breakup is observed. The amount of fragmented melt mass in the mixture in
regions with different void fraction is an important indicator of the explosion strength.
As a rule of thumb, larger quantities of fragmented melt masses in mixtures with
lower void fraction mean an increase in the mixture explosiveness. Previous
investigations with IDEMO to various premixing configurations [63,76] showed that
the steam content in mixtures, higher than 50 - 60% significantly limits the possibility
of pressure escalation and propagation reducing the resulting pressure loads.

Reactor applications
92
Fig. 7-3: Numerical discretization used for premixing calculations performed with JEMI
code, side and top views (left), 3D view for water pool depth of 1 m and 2 m
(right)
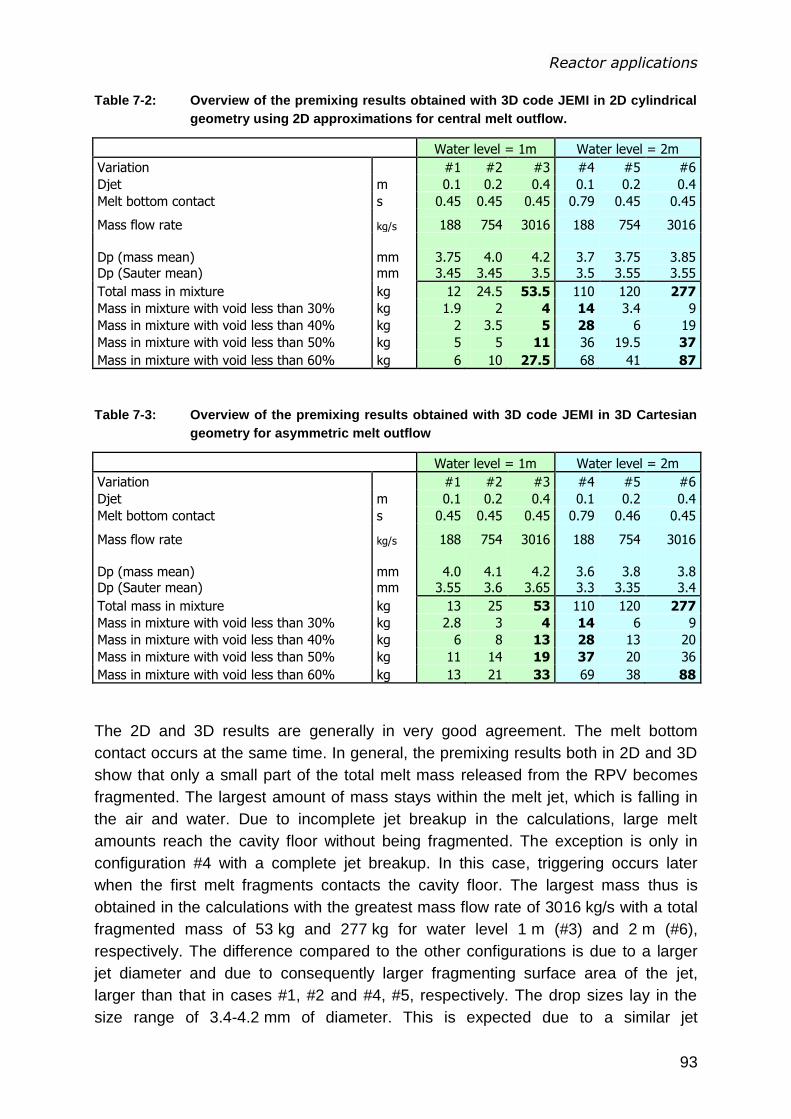
Reactor applications
93
Table 7-2: Overview of the premixing results obtained with 3D code JEMI in 2D cylindrical
geometry using 2D approximations for central melt outflow.
Water level = 1m Water level = 2m
Variation #1 #2 #3 #4 #5 #6
Djet m 0.1 0.2 0.4 0.1 0.2 0.4
Melt bottom contact s 0.45 0.45 0.45 0.79 0.45 0.45
Mass flow rate kg/s 188 754 3016 188 754 3016
Dp (mass mean) Dp (Sauter mean)
mm mm
3.75 3.45
4.0 3.45
4.2 3.5
3.7 3.5
3.75 3.55
3.85 3.55
Total mass in mixture kg 12 24.5 53.5 110 120 277
Mass in mixture with void less than 30% kg 1.9 2 4 14 3.4 9
Mass in mixture with void less than 40% kg 2 3.5 5 28 6 19
Mass in mixture with void less than 50% kg 5 5 11 36 19.5 37
Mass in mixture with void less than 60% kg 6 10 27.5 68 41 87
Table 7-3: Overview of the premixing results obtained with 3D code JEMI in 3D Cartesian
geometry for asymmetric melt outflow
Water level = 1m Water level = 2m
Variation #1 #2 #3 #4 #5 #6
Djet m 0.1 0.2 0.4 0.1 0.2 0.4
Melt bottom contact s 0.45 0.45 0.45 0.79 0.46 0.45
Mass flow rate kg/s 188 754 3016 188 754 3016
Dp (mass mean) Dp (Sauter mean)
mm mm
4.0 3.55
4.1 3.6
4.2 3.65
3.6 3.3
3.8 3.35
3.8 3.4
Total mass in mixture kg 13 25 53 110 120 277
Mass in mixture with void less than 30% kg 2.8 3 4 14 6 9
Mass in mixture with void less than 40% kg 6 8 13 28 13 20
Mass in mixture with void less than 50% kg 11 14 19 37 20 36
Mass in mixture with void less than 60% kg 13 21 33 69 38 88
The 2D and 3D results are generally in very good agreement. The melt bottom
contact occurs at the same time. In general, the premixing results both in 2D and 3D
show that only a small part of the total melt mass released from the RPV becomes
fragmented. The largest amount of mass stays within the melt jet, which is falling in
the air and water. Due to incomplete jet breakup in the calculations, large melt
amounts reach the cavity floor without being fragmented. The exception is only in
configuration #4 with a complete jet breakup. In this case, triggering occurs later
when the first melt fragments contacts the cavity floor. The largest mass thus is
obtained in the calculations with the greatest mass flow rate of 3016 kg/s with a total
fragmented mass of 53 kg and 277 kg for water level 1 m (#3) and 2 m (#6),
respectively. The difference compared to the other configurations is due to a larger
jet diameter and due to consequently larger fragmenting surface area of the jet,
larger than that in cases #1, #2 and #4, #5, respectively. The drop sizes lay in the
size range of 3.4-4.2 mm of diameter. This is expected due to a similar jet
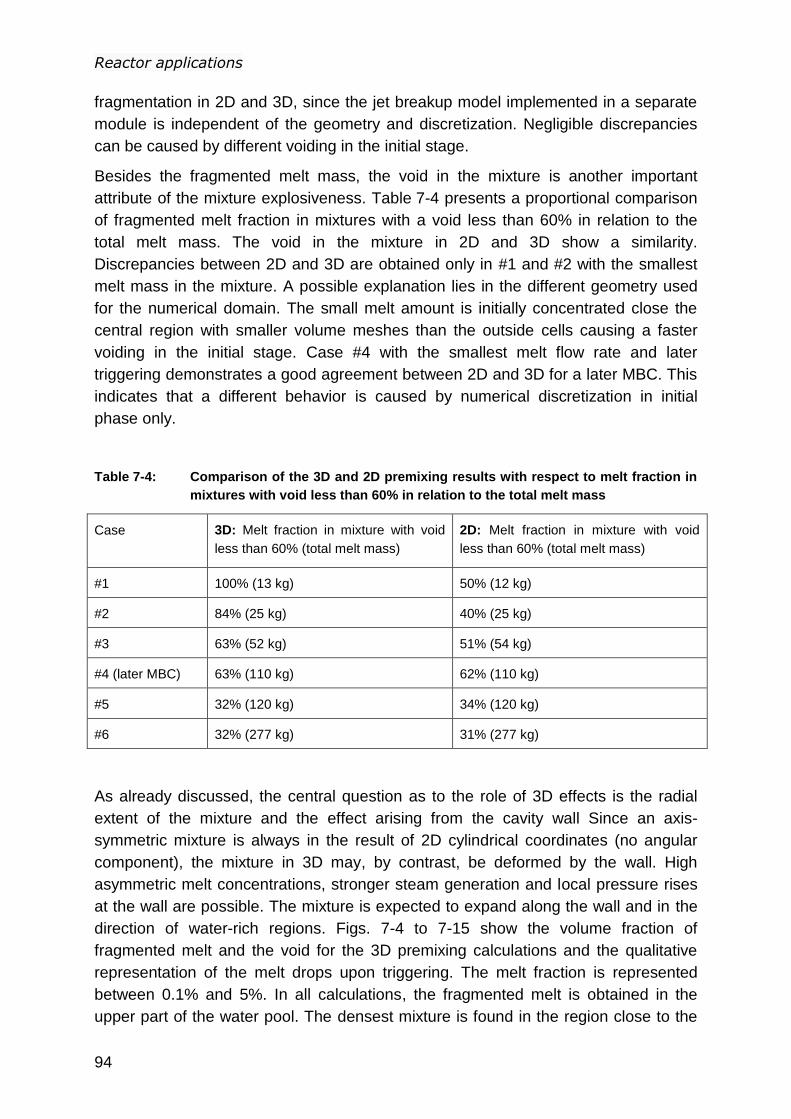
Reactor applications
94
fragmentation in 2D and 3D, since the jet breakup model implemented in a separate
module is independent of the geometry and discretization. Negligible discrepancies
can be caused by different voiding in the initial stage.
Besides the fragmented melt mass, the void in the mixture is another important
attribute of the mixture explosiveness. Table 7-4 presents a proportional comparison
of fragmented melt fraction in mixtures with a void less than 60% in relation to the
total melt mass. The void in the mixture in 2D and 3D show a similarity.
Discrepancies between 2D and 3D are obtained only in #1 and #2 with the smallest
melt mass in the mixture. A possible explanation lies in the different geometry used
for the numerical domain. The small melt amount is initially concentrated close the
central region with smaller volume meshes than the outside cells causing a faster
voiding in the initial stage. Case #4 with the smallest melt flow rate and later
triggering demonstrates a good agreement between 2D and 3D for a later MBC. This
indicates that a different behavior is caused by numerical discretization in initial
phase only.
Table 7-4: Comparison of the 3D and 2D premixing results with respect to melt fraction in
mixtures with void less than 60% in relation to the total melt mass
Case 3D: Melt fraction in mixture with void
less than 60% (total melt mass)
2D: Melt fraction in mixture with void
less than 60% (total melt mass)
#1 100% (13 kg) 50% (12 kg)
#2 84% (25 kg) 40% (25 kg)
#3 63% (52 kg) 51% (54 kg)
#4 (later MBC) 63% (110 kg) 62% (110 kg)
#5 32% (120 kg) 34% (120 kg)
#6 32% (277 kg) 31% (277 kg)
As already discussed, the central question as to the role of 3D effects is the radial
extent of the mixture and the effect arising from the cavity wall Since an axis-
symmetric mixture is always in the result of 2D cylindrical coordinates (no angular
component), the mixture in 3D may, by contrast, be deformed by the wall. High
asymmetric melt concentrations, stronger steam generation and local pressure rises
at the wall are possible. The mixture is expected to expand along the wall and in the
direction of water-rich regions. Figs. 7-4 to 7-15 show the volume fraction of
fragmented melt and the void for the 3D premixing calculations and the qualitative
representation of the melt drops upon triggering. The melt fraction is represented
between 0.1% and 5%. In all calculations, the fragmented melt is obtained in the
upper part of the water pool. The densest mixture is found in the region close to the
Reactor applications
95
melt jet (left) in the region with the highest void (right). One exception is the two latter
calculations #5 and #6, see Figs. 7-12 to 7-15. Here, the densest mixture as well as
the highest void is obtained directly at the wall. This is due to the wall proximity
confining the extent of the melt cloud and leading to melt concentration at the wall.
The stretching effect of the melt concentrations has a compensating character
leading to similar melt and void distribution in 2D and 3D.
In general, it can be concluded, that the mixture, melt cloud and void, remain almost
symmetric with a light deformation along the wall. This can be only explained by the
high density of the corium melt “cutting” into the surrounding water even though it
may be fragmented. Also, large expansion of the void cloud towards the water-rich
region does not occur, the steam content remains quite symmetric in the mixture.
This indicates that the steam release due to local pressure rise occurs mainly in
upward direction driven by the hydrostatic head.
The solidification of melt drops is only relevant in configuration #4 with a water level
of 2 m and a jet diameter of 0.1 m. Here, a later melt bottom contact is obtained due
to complete jet breakup. Fig 7-16 shows the distribution of the fragmented melt with
respect to different crust thickness in 2D (a) and 3D (b) calculations. Since the void is
the main mixing attribute determining the heat transfer from melt to coolant and thus
the solidification of melt drops during the premixing, the melt mass distribution
relative to the crust thicknesses is expected to be identical. The amount of fragments
where no crust is formed at the surface is obtained in both configurations and stands
at ~35 kg. The melt mass with a crust thickness of 175 μm stands at ~75 kg, again in
both configurations. The crust thickness of 175 μm represents ~10% of drop radius
considered to be the theoretical limit for fine fragmentation by Bürger et al. [10] and
Nelson et al. [12].
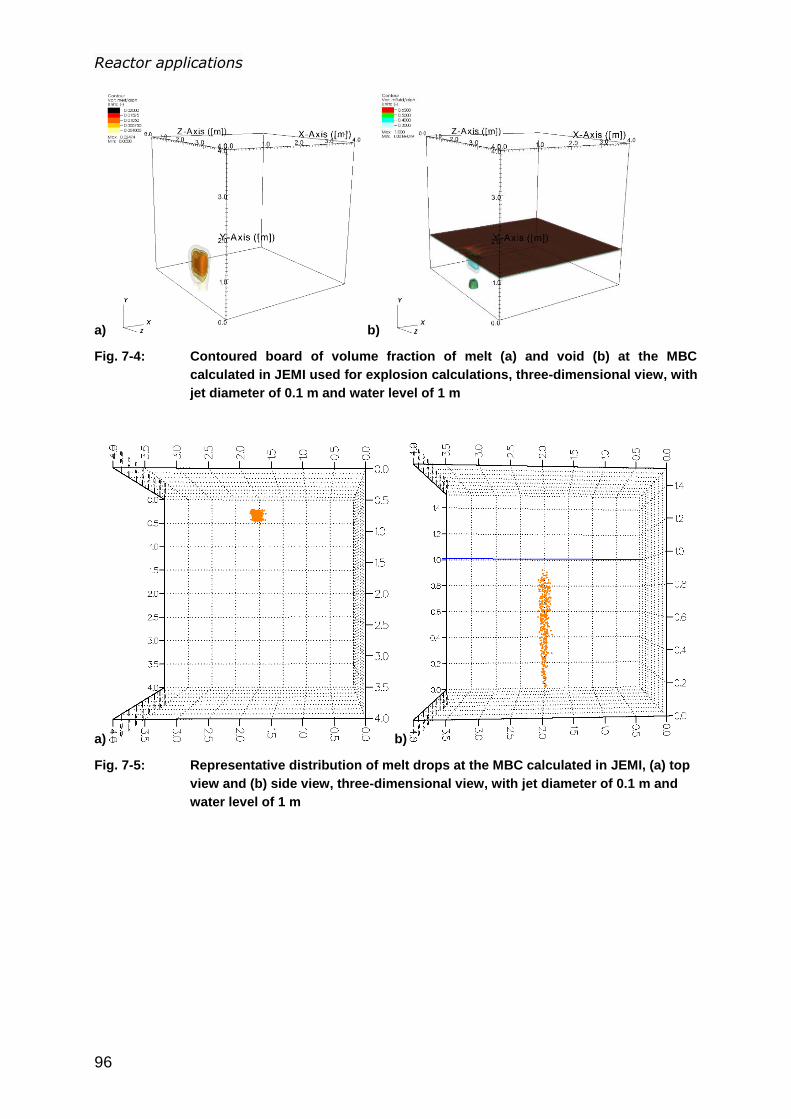
Reactor applications
96
a) b)
Fig. 7-4: Contoured board of volume fraction of melt (a) and void (b) at the MBC
calculated in JEMI used for explosion calculations, three-dimensional view, with
jet diameter of 0.1 m and water level of 1 m
a) b)
Fig. 7-5: Representative distribution of melt drops at the MBC calculated in JEMI, (a) top
view and (b) side view, three-dimensional view, with jet diameter of 0.1 m and
water level of 1 m
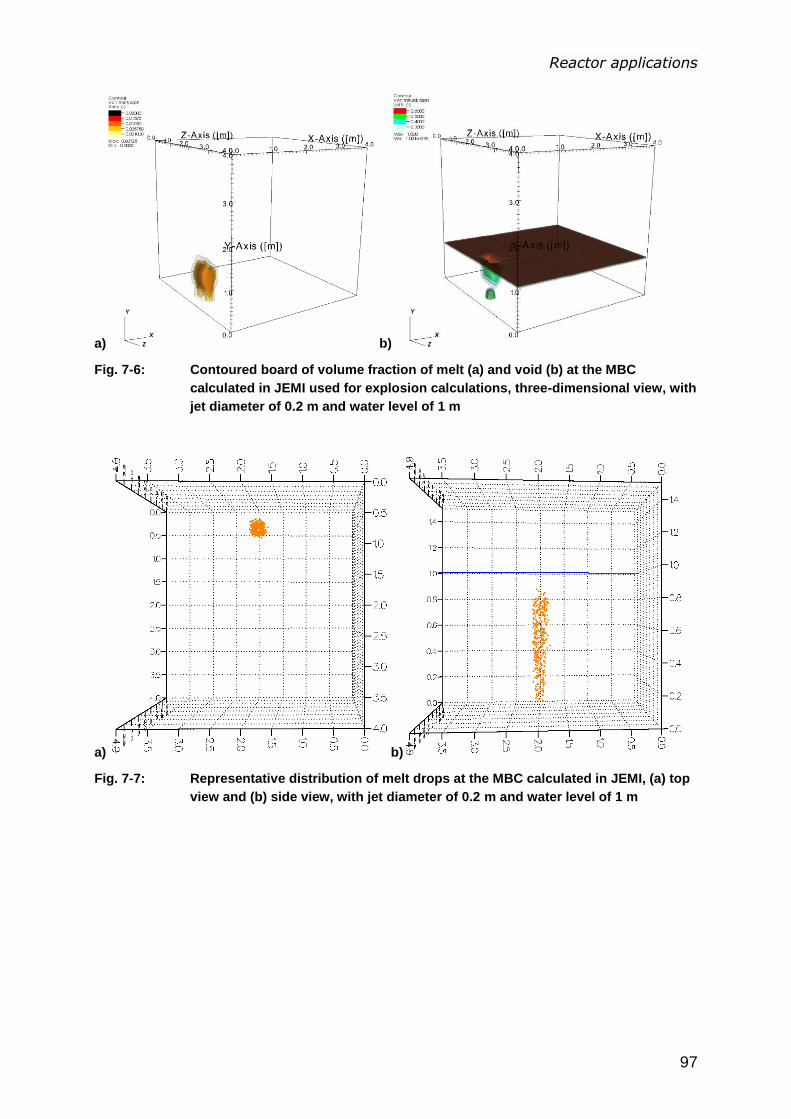
Reactor applications
97
a) b)
Fig. 7-6: Contoured board of volume fraction of melt (a) and void (b) at the MBC
calculated in JEMI used for explosion calculations, three-dimensional view, with
jet diameter of 0.2 m and water level of 1 m
a) b)
Fig. 7-7: Representative distribution of melt drops at the MBC calculated in JEMI, (a) top
view and (b) side view, with jet diameter of 0.2 m and water level of 1 m

Reactor applications
98
a) b)
Fig. 7-8: Contoured board of volume fraction of melt (a) and void (b) at the MBC
calculated in JEMI used for explosion calculations, three-dimensional view, with
jet diameter of 0.4 m and water level of 1 m
a) b)
Fig. 7-9: Representative distribution of melt drops at the MBC calculated in JEMI, (a) top
view and (b) side view, with jet diameter of 0.4 m and water level of 1 m
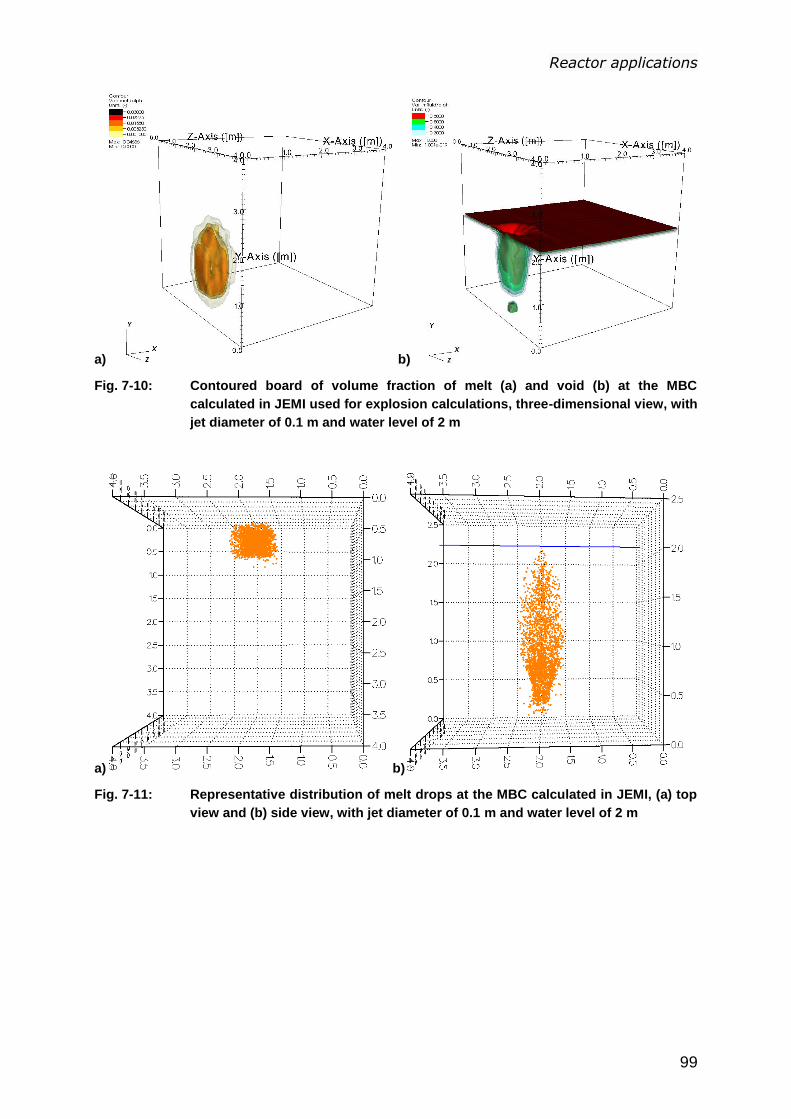
Reactor applications
99
a) b)
Fig. 7-10: Contoured board of volume fraction of melt (a) and void (b) at the MBC
calculated in JEMI used for explosion calculations, three-dimensional view, with
jet diameter of 0.1 m and water level of 2 m
a) b)
Fig. 7-11: Representative distribution of melt drops at the MBC calculated in JEMI, (a) top
view and (b) side view, with jet diameter of 0.1 m and water level of 2 m
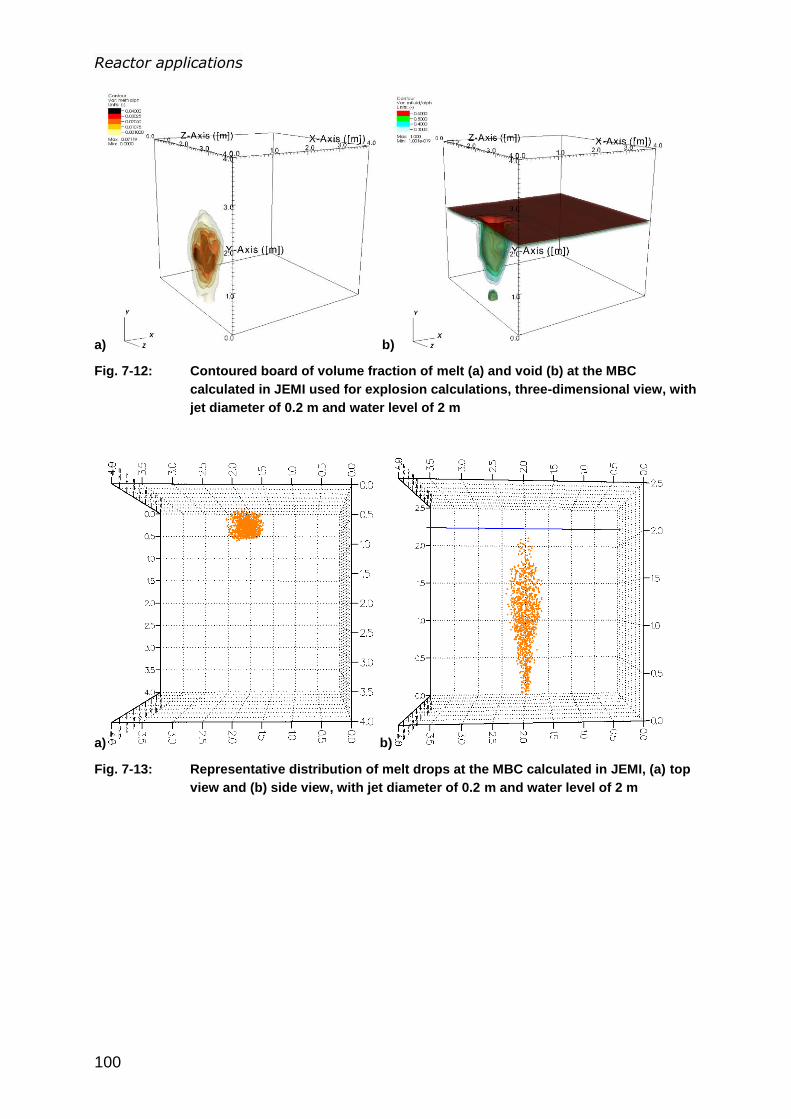
Reactor applications
100
a) b)
Fig. 7-12: Contoured board of volume fraction of melt (a) and void (b) at the MBC
calculated in JEMI used for explosion calculations, three-dimensional view, with
jet diameter of 0.2 m and water level of 2 m
a) b)
Fig. 7-13: Representative distribution of melt drops at the MBC calculated in JEMI, (a) top
view and (b) side view, with jet diameter of 0.2 m and water level of 2 m
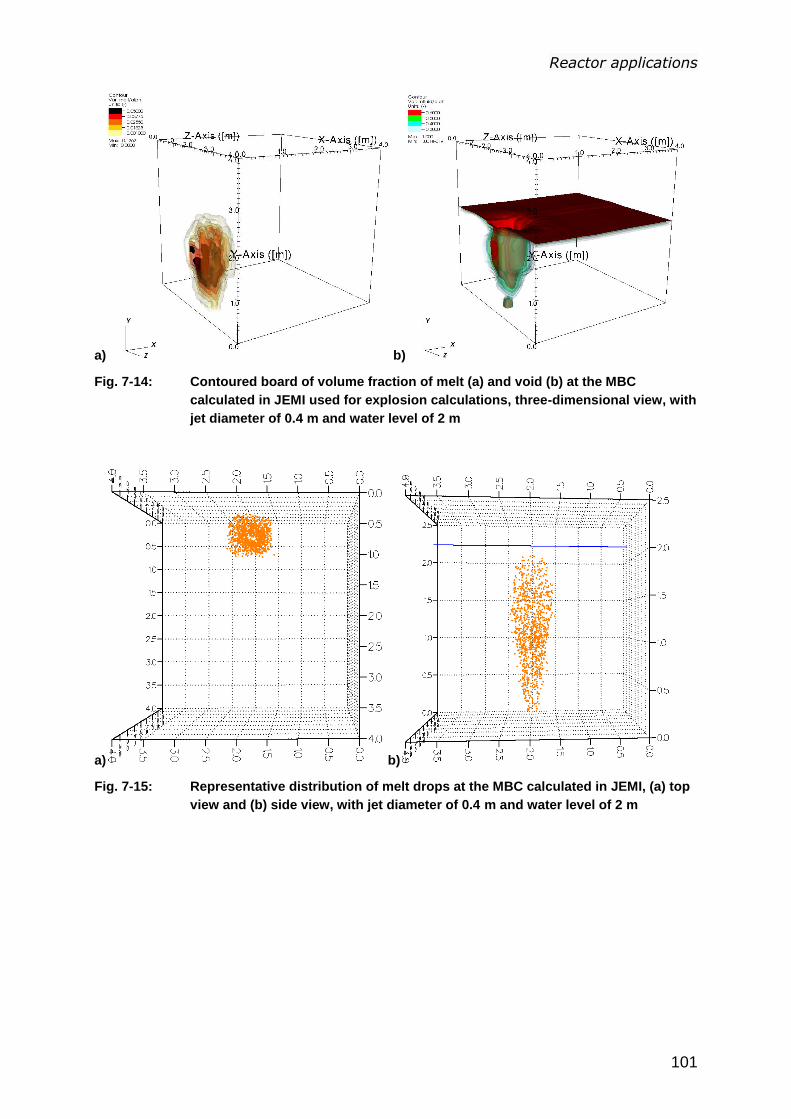
Reactor applications
101
a) b)
Fig. 7-14: Contoured board of volume fraction of melt (a) and void (b) at the MBC
calculated in JEMI used for explosion calculations, three-dimensional view, with
jet diameter of 0.4 m and water level of 2 m
a) b)
Fig. 7-15: Representative distribution of melt drops at the MBC calculated in JEMI, (a) top
view and (b) side view, with jet diameter of 0.4 m and water level of 2 m

Reactor applications
102
a)
b)
Fig. 7-16: Fragmented melt mass in regions with different crust thickness in 2D and 3D
calculations performed with JEMI code, water level = 2 m, Djet = 0.1, 2D (a), 3D
(b), triggering at 0.79 s.
7.1.2 Explosion phase
The premixing results from the 2D and 3D calculations presented above performed at
the time of the melt-bottom-contact (MBC) have been used for the calculation of the
explosion phase made with the IDEMO-3D code. The volume fractions of water,
vapor and melt are directly imported from the premixing calculations performed with
JEMI. The melt drops represented using the Lagrangian method in JEMI are
transformed into the Eulerian description and partitioned into 7 different particle
groups with respect to solidification degree, i.e. crust thickness. With the steam
content in the mixing zone, the crust thickness at the surface of melt droplets is
considered to be an important limitation for fine fragmentation due to strong breakup
resistance determining the intensity of melt-coolant interactions and accordingly the
magnitude of pressure increases and the strength of the steam explosion.
Considering the different fine-fragmentation behavior of melt drops that solidifiy
differently, the partitioning approach into crust thickness groups is applied for melt
Fragmented Mass with Different Crust Thickness
0.00E+00
4.00E+01
8.00E+01
1.20E+02
1.60E+02
0.00 0.10 0.20 0.30 0.40 0.50 0.60 0.70 0.80 0.90 1.00
Time [s]
Ma
ss [
kg
]
No Crust
Crust < 100 um
Crust < 150 um
Crust < 175 um
Crust < 200 um
Crust < 300 um
Crust < 400 um
Total Mass
Fragmented Mass with Different Crust Thickness
0.00E+00
4.00E+01
8.00E+01
1.20E+02
1.60E+02
0.00 0.10 0.20 0.30 0.40 0.50 0.60 0.70 0.80 0.90 1.00
Time [s]
Mass [kg]
No Crust
Crust < 100 um
Crust < 150 um
Crust < 175 um
Crust < 200 um
Crust < 300 um
Crust < 400 um
Total Mass
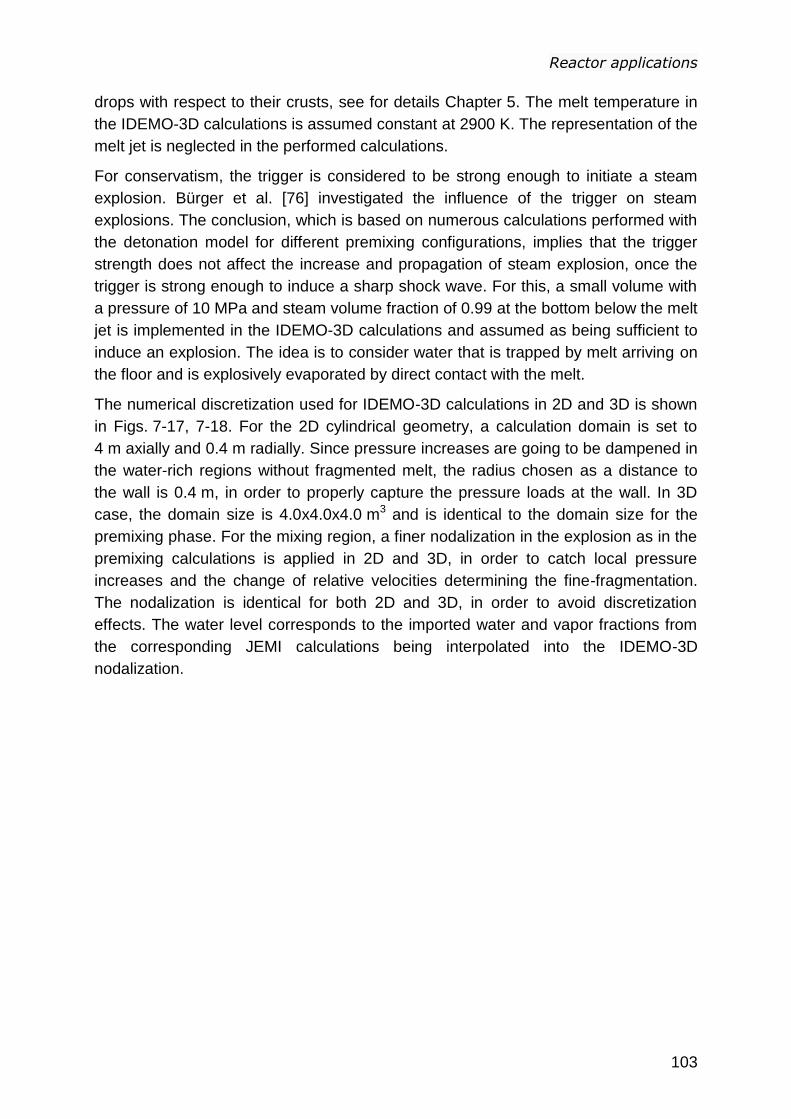
Reactor applications
103
drops with respect to their crusts, see for details Chapter 5. The melt temperature in
the IDEMO-3D calculations is assumed constant at 2900 K. The representation of the
melt jet is neglected in the performed calculations.
For conservatism, the trigger is considered to be strong enough to initiate a steam
explosion. Bürger et al. [76] investigated the influence of the trigger on steam
explosions. The conclusion, which is based on numerous calculations performed with
the detonation model for different premixing configurations, implies that the trigger
strength does not affect the increase and propagation of steam explosion, once the
trigger is strong enough to induce a sharp shock wave. For this, a small volume with
a pressure of 10 MPa and steam volume fraction of 0.99 at the bottom below the melt
jet is implemented in the IDEMO-3D calculations and assumed as being sufficient to
induce an explosion. The idea is to consider water that is trapped by melt arriving on
the floor and is explosively evaporated by direct contact with the melt.
The numerical discretization used for IDEMO-3D calculations in 2D and 3D is shown
in Figs. 7-17, 7-18. For the 2D cylindrical geometry, a calculation domain is set to
4 m axially and 0.4 m radially. Since pressure increases are going to be dampened in
the water-rich regions without fragmented melt, the radius chosen as a distance to
the wall is 0.4 m, in order to properly capture the pressure loads at the wall. In 3D
case, the domain size is 4.0x4.0x4.0 m3 and is identical to the domain size for the
premixing phase. For the mixing region, a finer nodalization in the explosion as in the
premixing calculations is applied in 2D and 3D, in order to catch local pressure
increases and the change of relative velocities determining the fine-fragmentation.
The nodalization is identical for both 2D and 3D, in order to avoid discretization
effects. The water level corresponds to the imported water and vapor fractions from
the corresponding JEMI calculations being interpolated into the IDEMO-3D
nodalization.
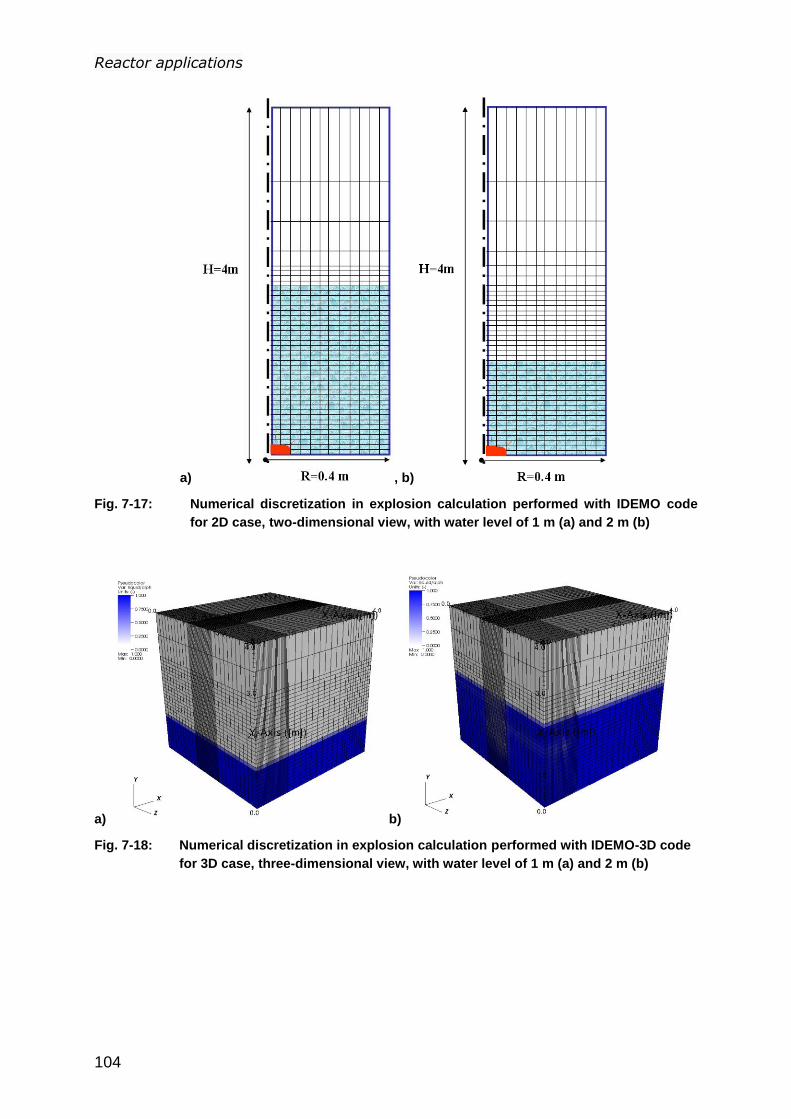
Reactor applications
104
a) , b)
Fig. 7-17: Numerical discretization in explosion calculation performed with IDEMO code
for 2D case, two-dimensional view, with water level of 1 m (a) and 2 m (b)
a) b)
Fig. 7-18: Numerical discretization in explosion calculation performed with IDEMO-3D code
for 3D case, three-dimensional view, with water level of 1 m (a) and 2 m (b)
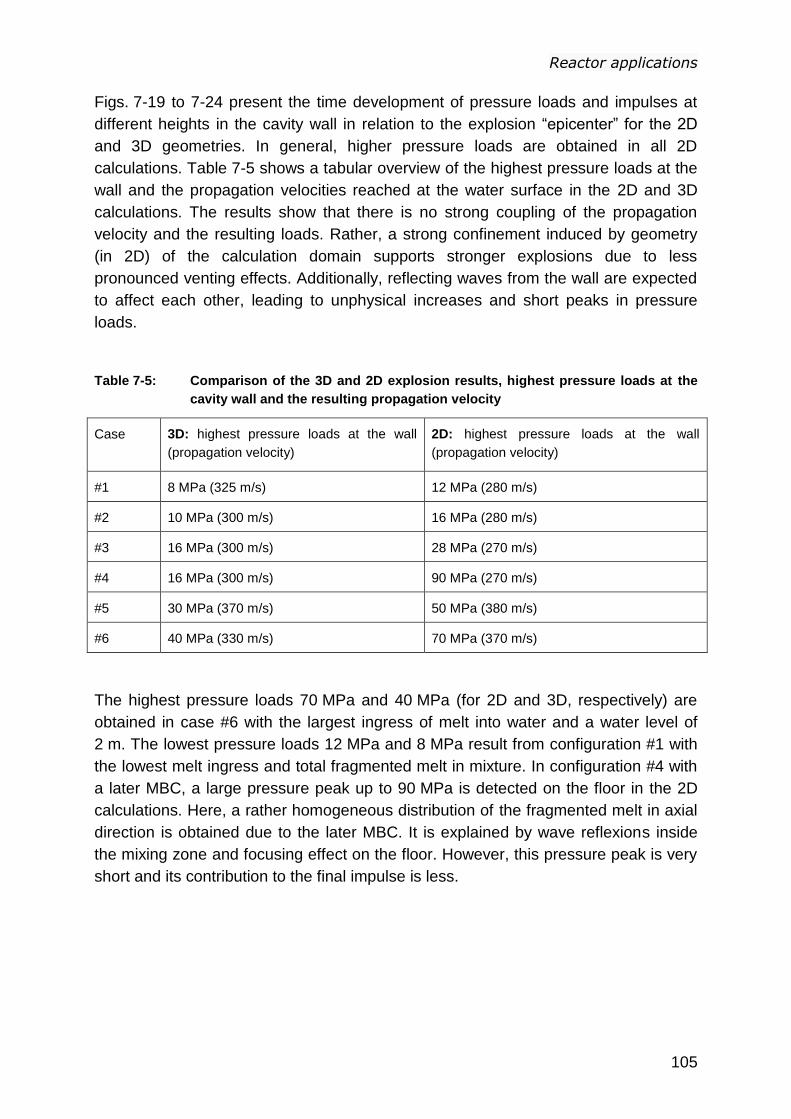
Reactor applications
105
Figs. 7-19 to 7-24 present the time development of pressure loads and impulses at
different heights in the cavity wall in relation to the explosion “epicenter” for the 2D
and 3D geometries. In general, higher pressure loads are obtained in all 2D
calculations. Table 7-5 shows a tabular overview of the highest pressure loads at the
wall and the propagation velocities reached at the water surface in the 2D and 3D
calculations. The results show that there is no strong coupling of the propagation
velocity and the resulting loads. Rather, a strong confinement induced by geometry
(in 2D) of the calculation domain supports stronger explosions due to less
pronounced venting effects. Additionally, reflecting waves from the wall are expected
to affect each other, leading to unphysical increases and short peaks in pressure
loads.
Table 7-5: Comparison of the 3D and 2D explosion results, highest pressure loads at the
cavity wall and the resulting propagation velocity
Case 3D: highest pressure loads at the wall
(propagation velocity)
2D: highest pressure loads at the wall
(propagation velocity)
#1 8 MPa (325 m/s) 12 MPa (280 m/s)
#2 10 MPa (300 m/s) 16 MPa (280 m/s)
#3 16 MPa (300 m/s) 28 MPa (270 m/s)
#4 16 MPa (300 m/s) 90 MPa (270 m/s)
#5 30 MPa (370 m/s) 50 MPa (380 m/s)
#6 40 MPa (330 m/s) 70 MPa (370 m/s)
The highest pressure loads 70 MPa and 40 MPa (for 2D and 3D, respectively) are
obtained in case #6 with the largest ingress of melt into water and a water level of
2 m. The lowest pressure loads 12 MPa and 8 MPa result from configuration #1 with
the lowest melt ingress and total fragmented melt in mixture. In configuration #4 with
a later MBC, a large pressure peak up to 90 MPa is detected on the floor in the 2D
calculations. Here, a rather homogeneous distribution of the fragmented melt in axial
direction is obtained due to the later MBC. It is explained by wave reflexions inside
the mixing zone and focusing effect on the floor. However, this pressure peak is very
short and its contribution to the final impulse is less.

Reactor applications
106
2D, pressure vs. time:
3D, pressure vs. time:
2D, impulse vs. time:
3D, impulse vs. time:
Fig. 7-19: Pressure vs. time and impulse vs. time at different heights in explosion
calculations performed with IDEMO-3D code in 2D cylindrical geometry for central
melt outflow and 3D Cartesian geometry with lateral melt outflow, water level 1 m,
jet diameter 0.1 m
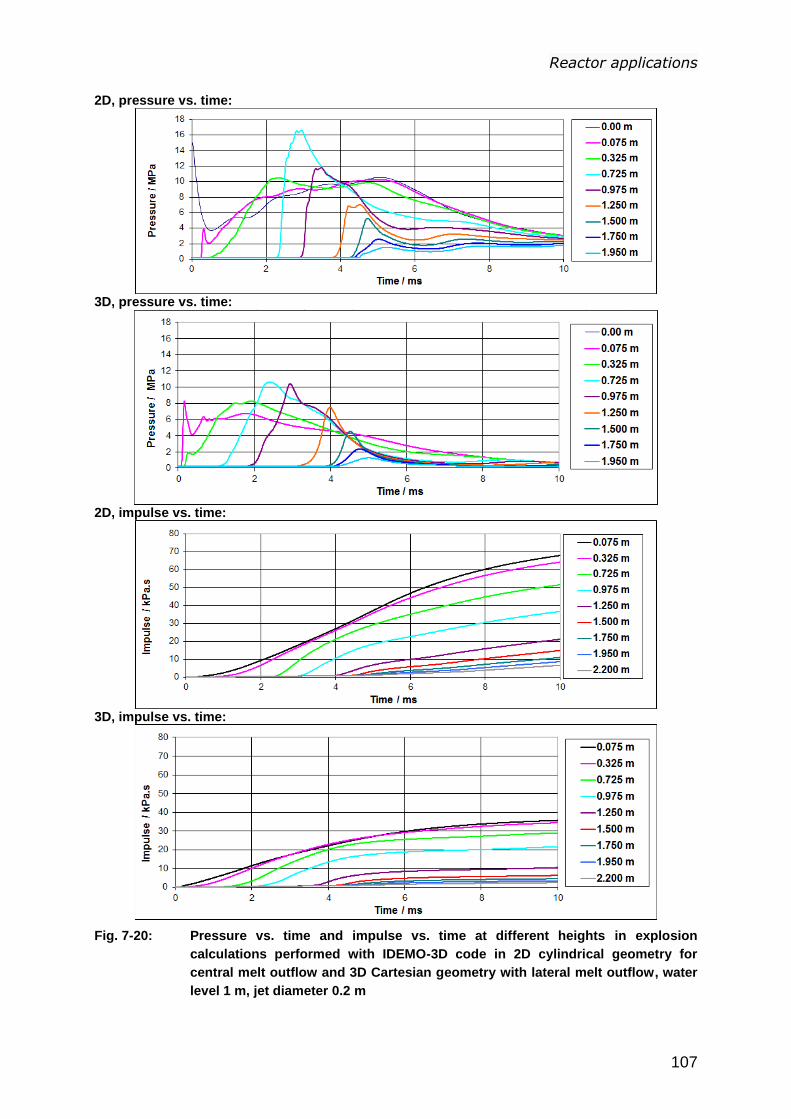
Reactor applications
107
2D, pressure vs. time:
3D, pressure vs. time:
2D, impulse vs. time:
3D, impulse vs. time:
Fig. 7-20: Pressure vs. time and impulse vs. time at different heights in explosion
calculations performed with IDEMO-3D code in 2D cylindrical geometry for
central melt outflow and 3D Cartesian geometry with lateral melt outflow, water
level 1 m, jet diameter 0.2 m
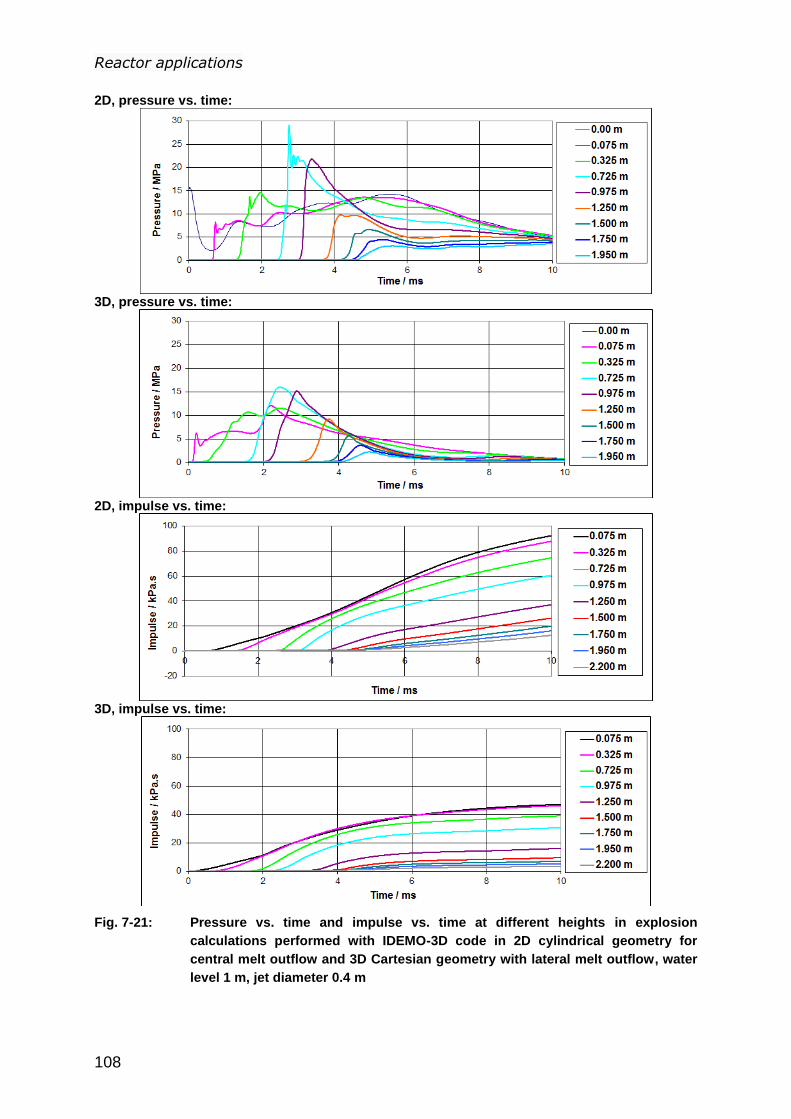
Reactor applications
108
2D, pressure vs. time:
3D, pressure vs. time:
2D, impulse vs. time:
3D, impulse vs. time:
Fig. 7-21: Pressure vs. time and impulse vs. time at different heights in explosion
calculations performed with IDEMO-3D code in 2D cylindrical geometry for
central melt outflow and 3D Cartesian geometry with lateral melt outflow, water
level 1 m, jet diameter 0.4 m
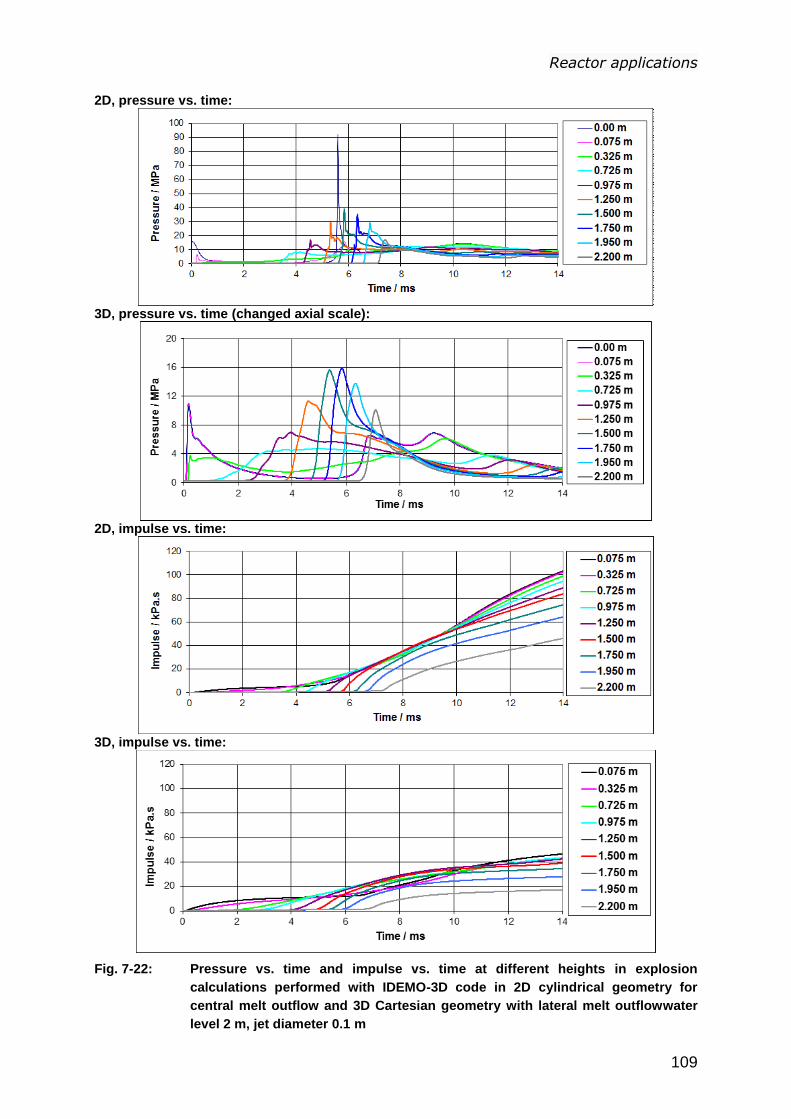
Reactor applications
109
2D, pressure vs. time:
3D, pressure vs. time (changed axial scale):
2D, impulse vs. time:
3D, impulse vs. time:
Fig. 7-22: Pressure vs. time and impulse vs. time at different heights in explosion
calculations performed with IDEMO-3D code in 2D cylindrical geometry for
central melt outflow and 3D Cartesian geometry with lateral melt outflowwater
level 2 m, jet diameter 0.1 m
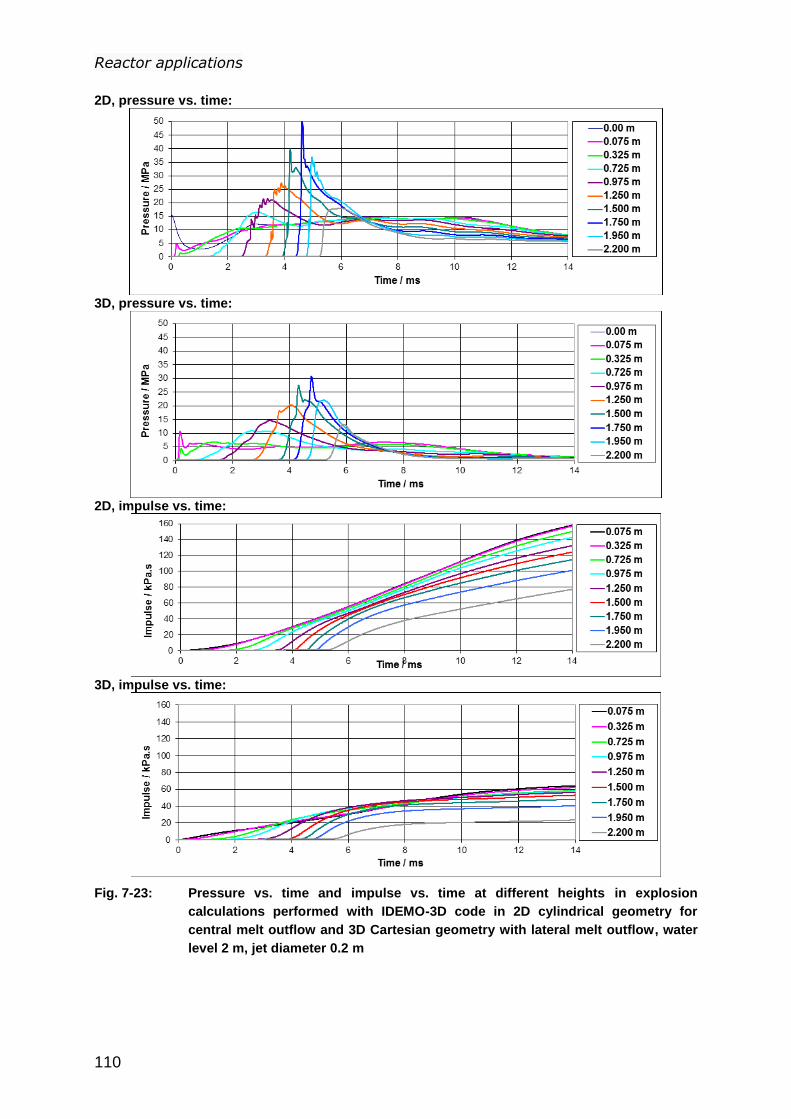
Reactor applications
110
2D, pressure vs. time:
3D, pressure vs. time:
2D, impulse vs. time:
3D, impulse vs. time:
Fig. 7-23: Pressure vs. time and impulse vs. time at different heights in explosion
calculations performed with IDEMO-3D code in 2D cylindrical geometry for
central melt outflow and 3D Cartesian geometry with lateral melt outflow, water
level 2 m, jet diameter 0.2 m
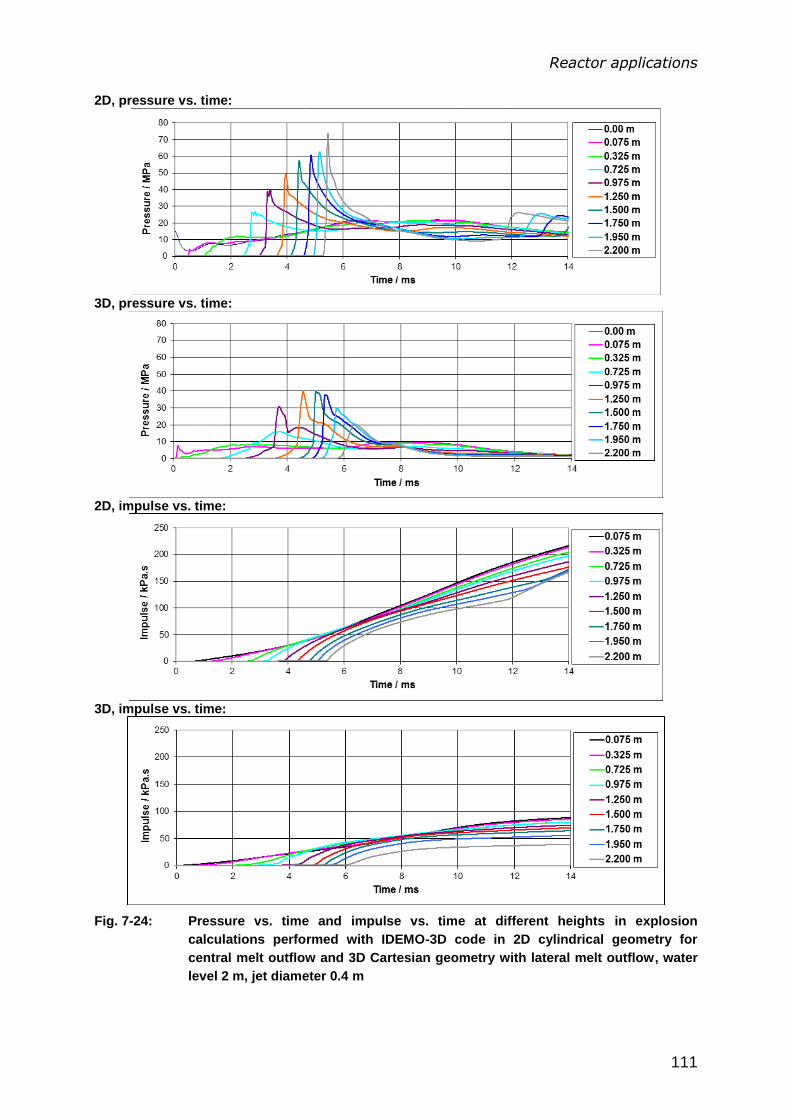
Reactor applications
111
2D, pressure vs. time:
3D, pressure vs. time:
2D, impulse vs. time:
3D, impulse vs. time:
Fig. 7-24: Pressure vs. time and impulse vs. time at different heights in explosion
calculations performed with IDEMO-3D code in 2D cylindrical geometry for
central melt outflow and 3D Cartesian geometry with lateral melt outflow, water
level 2 m, jet diameter 0.4 m
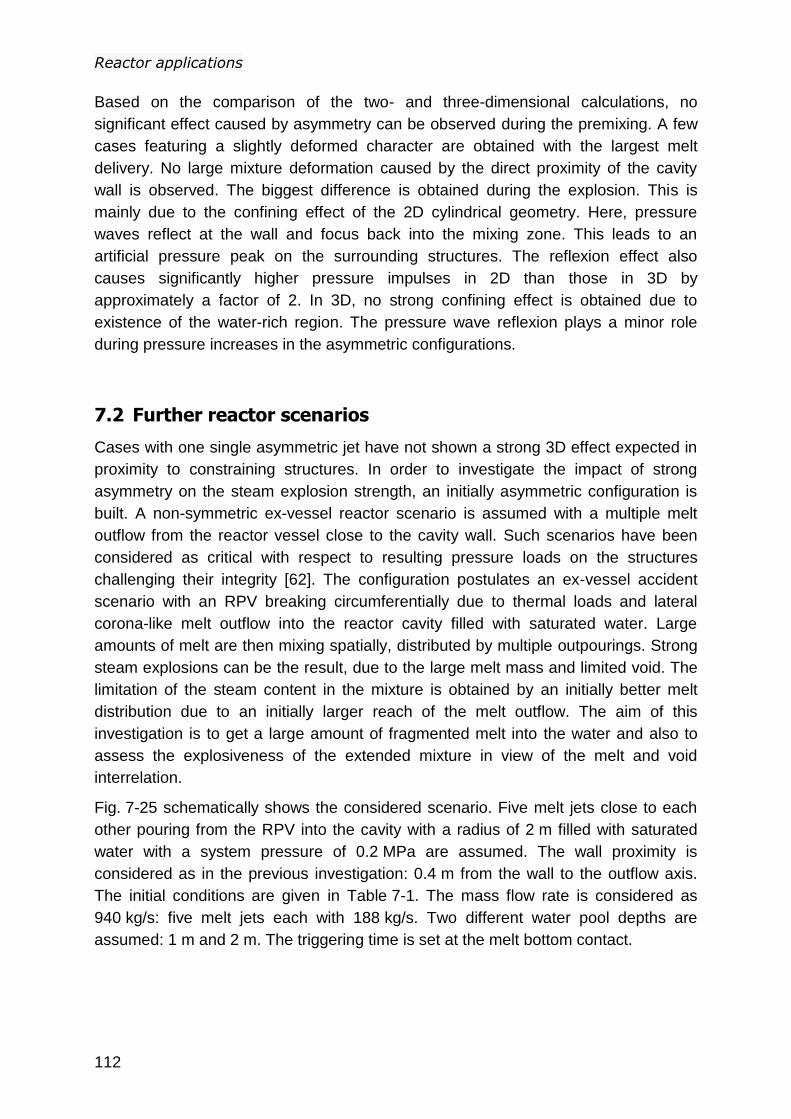
Reactor applications
112
Based on the comparison of the two- and three-dimensional calculations, no
significant effect caused by asymmetry can be observed during the premixing. A few
cases featuring a slightly deformed character are obtained with the largest melt
delivery. No large mixture deformation caused by the direct proximity of the cavity
wall is observed. The biggest difference is obtained during the explosion. This is
mainly due to the confining effect of the 2D cylindrical geometry. Here, pressure
waves reflect at the wall and focus back into the mixing zone. This leads to an
artificial pressure peak on the surrounding structures. The reflexion effect also
causes significantly higher pressure impulses in 2D than those in 3D by
approximately a factor of 2. In 3D, no strong confining effect is obtained due to
existence of the water-rich region. The pressure wave reflexion plays a minor role
during pressure increases in the asymmetric configurations.
7.2 Further reactor scenarios
Cases with one single asymmetric jet have not shown a strong 3D effect expected in
proximity to constraining structures. In order to investigate the impact of strong
asymmetry on the steam explosion strength, an initially asymmetric configuration is
built. A non-symmetric ex-vessel reactor scenario is assumed with a multiple melt
outflow from the reactor vessel close to the cavity wall. Such scenarios have been
considered as critical with respect to resulting pressure loads on the structures
challenging their integrity [62]. The configuration postulates an ex-vessel accident
scenario with an RPV breaking circumferentially due to thermal loads and lateral
corona-like melt outflow into the reactor cavity filled with saturated water. Large
amounts of melt are then mixing spatially, distributed by multiple outpourings. Strong
steam explosions can be the result, due to the large melt mass and limited void. The
limitation of the steam content in the mixture is obtained by an initially better melt
distribution due to an initially larger reach of the melt outflow. The aim of this
investigation is to get a large amount of fragmented melt into the water and also to
assess the explosiveness of the extended mixture in view of the melt and void
interrelation.
Fig. 7-25 schematically shows the considered scenario. Five melt jets close to each
other pouring from the RPV into the cavity with a radius of 2 m filled with saturated
water with a system pressure of 0.2 MPa are assumed. The wall proximity is
considered as in the previous investigation: 0.4 m from the wall to the outflow axis.
The initial conditions are given in Table 7-1. The mass flow rate is considered as
940 kg/s: five melt jets each with 188 kg/s. Two different water pool depths are
assumed: 1 m and 2 m. The triggering time is set at the melt bottom contact.
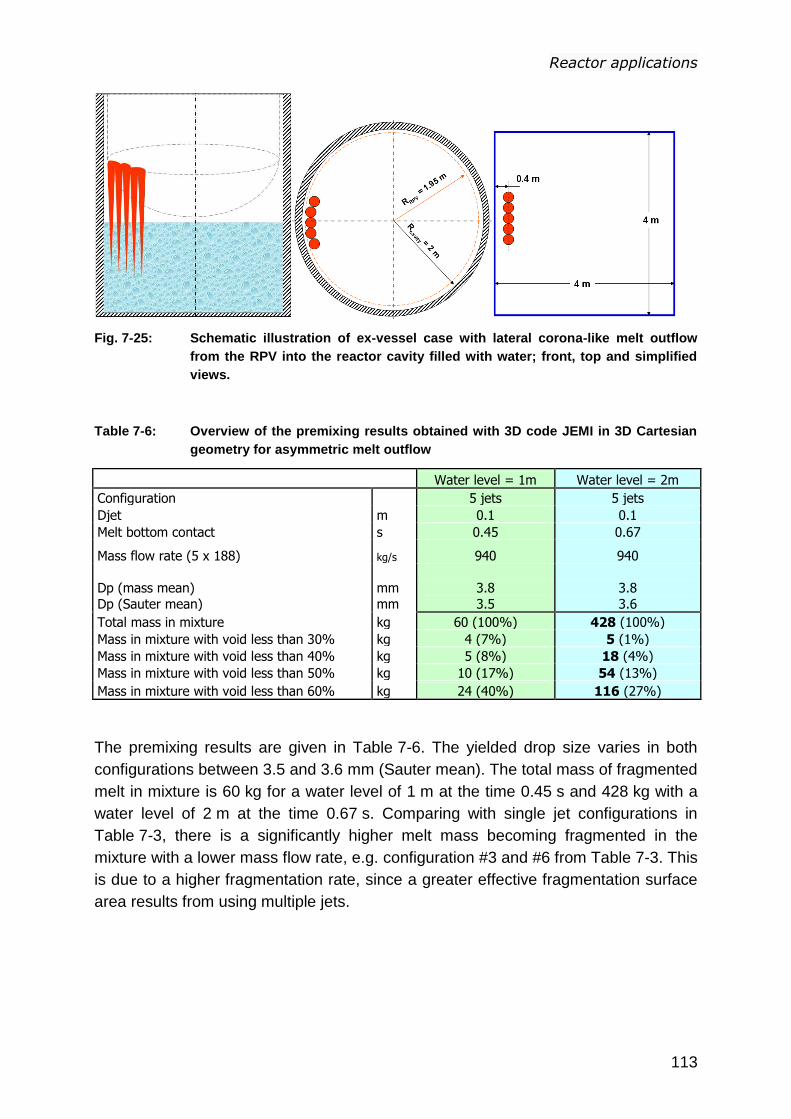
Reactor applications
113
Fig. 7-25: Schematic illustration of ex-vessel case with lateral corona-like melt outflow
from the RPV into the reactor cavity filled with water; front, top and simplified
views.
Table 7-6: Overview of the premixing results obtained with 3D code JEMI in 3D Cartesian
geometry for asymmetric melt outflow
Water level = 1m Water level = 2m
Configuration 5 jets 5 jets
Djet m 0.1 0.1
Melt bottom contact s 0.45 0.67
Mass flow rate (5 x 188) kg/s 940 940
Dp (mass mean)
Dp (Sauter mean)
mm
mm
3.8
3.5
3.8
3.6
Total mass in mixture kg 60 (100%) 428 (100%)
Mass in mixture with void less than 30% kg 4 (7%) 5 (1%)
Mass in mixture with void less than 40% kg 5 (8%) 18 (4%)
Mass in mixture with void less than 50% kg 10 (17%) 54 (13%)
Mass in mixture with void less than 60% kg 24 (40%) 116 (27%)
The premixing results are given in Table 7-6. The yielded drop size varies in both
configurations between 3.5 and 3.6 mm (Sauter mean). The total mass of fragmented
melt in mixture is 60 kg for a water level of 1 m at the time 0.45 s and 428 kg with a
water level of 2 m at the time 0.67 s. Comparing with single jet configurations in
Table 7-3, there is a significantly higher melt mass becoming fragmented in the
mixture with a lower mass flow rate, e.g. configuration #3 and #6 from Table 7-3. This
is due to a higher fragmentation rate, since a greater effective fragmentation surface
area results from using multiple jets.

Reactor applications
114
a) b)
Fig. 7-26: Contoured board of volume fraction of melt (a) and void (b) at the MBC
calculated in JEMI, three-dimensional view, five melt jets with diameter of 0.1 m
and water level of 1 m
a) b)
Fig. 7-27: Representative distribution of melt drops at the MBC calculated in JEMI, (a) top
view and (b) side view, three-dimensional view, five melt jets with diameter of
0.1 m and water level of 1 m
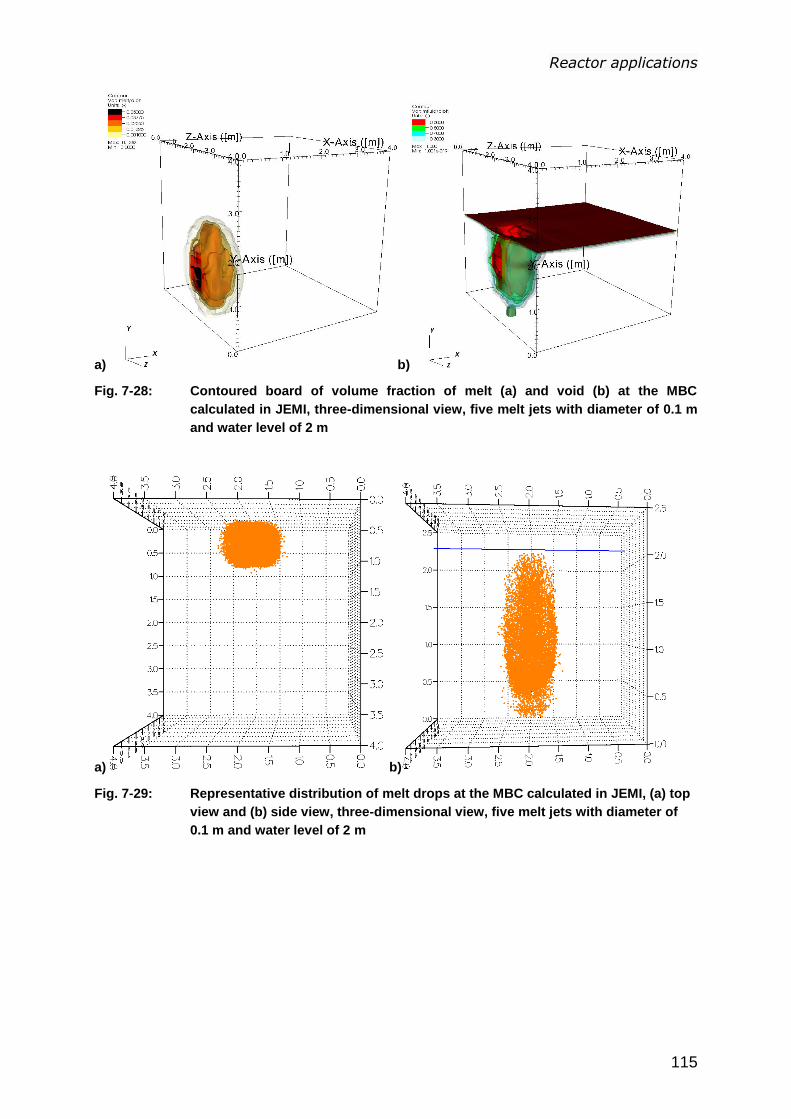
Reactor applications
115
a) b)
Fig. 7-28: Contoured board of volume fraction of melt (a) and void (b) at the MBC
calculated in JEMI, three-dimensional view, five melt jets with diameter of 0.1 m
and water level of 2 m
a) b)
Fig. 7-29: Representative distribution of melt drops at the MBC calculated in JEMI, (a) top
view and (b) side view, three-dimensional view, five melt jets with diameter of
0.1 m and water level of 2 m
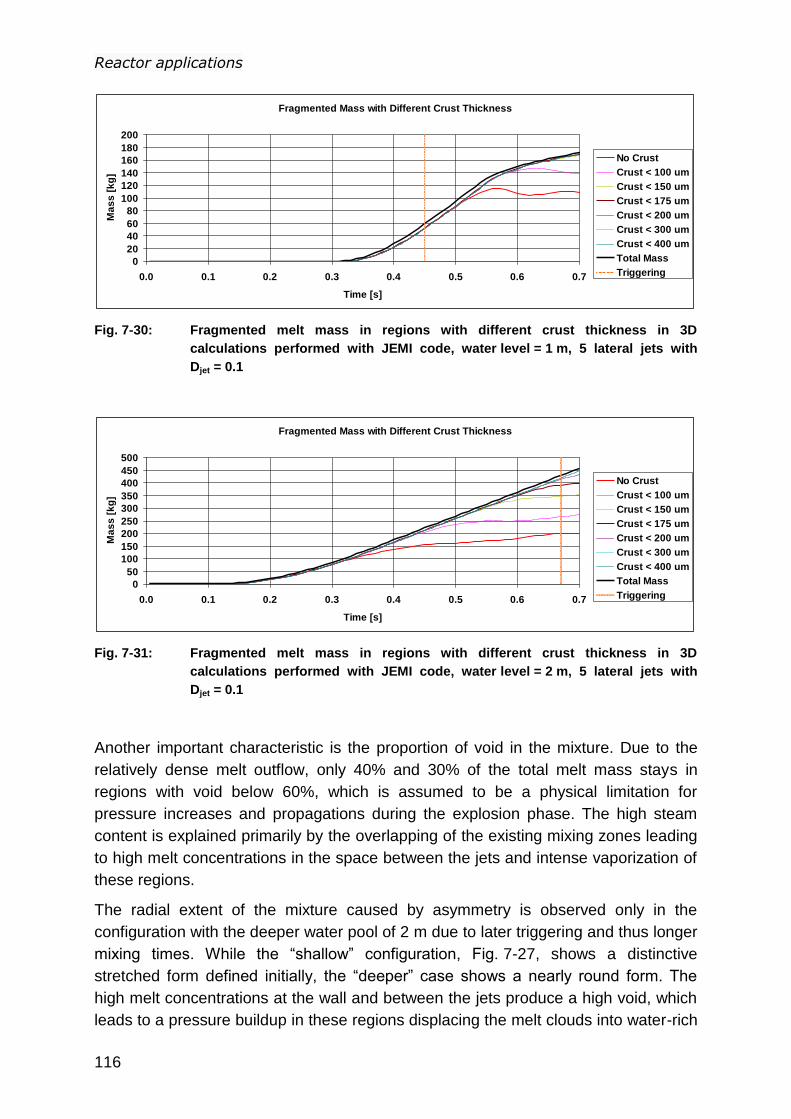
Reactor applications
116
Fig. 7-30: Fragmented melt mass in regions with different crust thickness in 3D
calculations performed with JEMI code, water level = 1 m, 5 lateral jets with
Djet = 0.1
Fig. 7-31: Fragmented melt mass in regions with different crust thickness in 3D
calculations performed with JEMI code, water level = 2 m, 5 lateral jets with
Djet = 0.1
Another important characteristic is the proportion of void in the mixture. Due to the
relatively dense melt outflow, only 40% and 30% of the total melt mass stays in
regions with void below 60%, which is assumed to be a physical limitation for
pressure increases and propagations during the explosion phase. The high steam
content is explained primarily by the overlapping of the existing mixing zones leading
to high melt concentrations in the space between the jets and intense vaporization of
these regions.
The radial extent of the mixture caused by asymmetry is observed only in the
configuration with the deeper water pool of 2 m due to later triggering and thus longer
mixing times. While the “shallow” configuration, Fig. 7-27, shows a distinctive
stretched form defined initially, the “deeper” case shows a nearly round form. The
high melt concentrations at the wall and between the jets produce a high void, which
leads to a pressure buildup in these regions displacing the melt clouds into water-rich
Fragmented Mass with Different Crust Thickness
0
20
40
60
80
100
120
140
160
180
200
0.0 0.1 0.2 0.3 0.4 0.5 0.6 0.7
Time [s]
Ma
ss
[k
g]
No Crust
Crust < 100 um
Crust < 150 um
Crust < 175 um
Crust < 200 um
Crust < 300 um
Crust < 400 um
Total Mass
Triggering
Fragmented Mass with Different Crust Thickness
0
50
100
150
200
250
300
350
400
450
500
0.0 0.1 0.2 0.3 0.4 0.5 0.6 0.7
Time [s]
Ma
ss
[k
g]
No Crust
Crust < 100 um
Crust < 150 um
Crust < 175 um
Crust < 200 um
Crust < 300 um
Crust < 400 um
Total Mass
Triggering
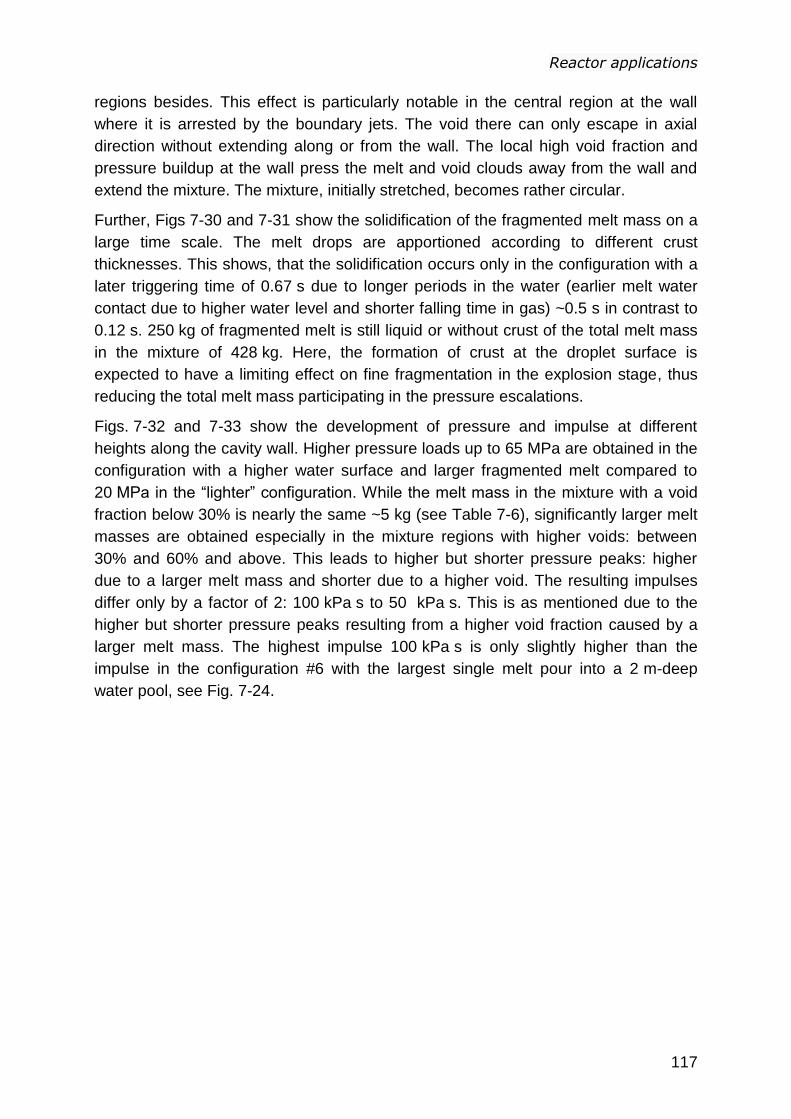
Reactor applications
117
regions besides. This effect is particularly notable in the central region at the wall
where it is arrested by the boundary jets. The void there can only escape in axial
direction without extending along or from the wall. The local high void fraction and
pressure buildup at the wall press the melt and void clouds away from the wall and
extend the mixture. The mixture, initially stretched, becomes rather circular.
Further, Figs 7-30 and 7-31 show the solidification of the fragmented melt mass on a
large time scale. The melt drops are apportioned according to different crust
thicknesses. This shows, that the solidification occurs only in the configuration with a
later triggering time of 0.67 s due to longer periods in the water (earlier melt water
contact due to higher water level and shorter falling time in gas) ~0.5 s in contrast to
0.12 s. 250 kg of fragmented melt is still liquid or without crust of the total melt mass
in the mixture of 428 kg. Here, the formation of crust at the droplet surface is
expected to have a limiting effect on fine fragmentation in the explosion stage, thus
reducing the total melt mass participating in the pressure escalations.
Figs. 7-32 and 7-33 show the development of pressure and impulse at different
heights along the cavity wall. Higher pressure loads up to 65 MPa are obtained in the
configuration with a higher water surface and larger fragmented melt compared to
20 MPa in the “lighter” configuration. While the melt mass in the mixture with a void
fraction below 30% is nearly the same ~5 kg (see Table 7-6), significantly larger melt
masses are obtained especially in the mixture regions with higher voids: between
30% and 60% and above. This leads to higher but shorter pressure peaks: higher
due to a larger melt mass and shorter due to a higher void. The resulting impulses
differ only by a factor of 2: 100 kPa s to 50 kPa s. This is as mentioned due to the
higher but shorter pressure peaks resulting from a higher void fraction caused by a
larger melt mass. The highest impulse 100 kPa s is only slightly higher than the
impulse in the configuration #6 with the largest single melt pour into a 2 m-deep
water pool, see Fig. 7-24.

Reactor applications
118
3D, pressure vs. time:
3D, impulse vs. time:
Fig. 7-32: Pressure vs. time and impulse vs. time at different heights in explosion
calculations performed with IDEMO-3D code in 3D Cartesian geometry with
lateral multiple melt outflow, water level 1 m, jet diameter 0.1 m
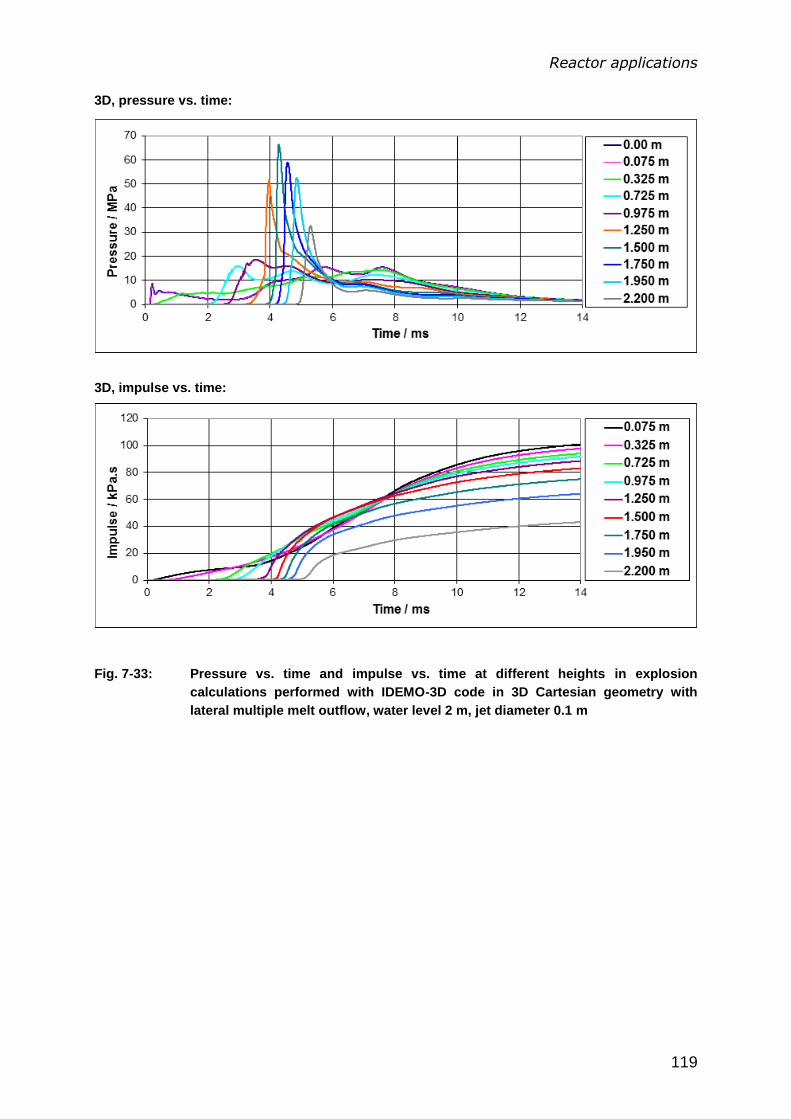
Reactor applications
119
3D, pressure vs. time:
3D, impulse vs. time:
Fig. 7-33: Pressure vs. time and impulse vs. time at different heights in explosion
calculations performed with IDEMO-3D code in 3D Cartesian geometry with
lateral multiple melt outflow, water level 2 m, jet diameter 0.1 m
Reactor applications
120
7.3 Discussion
Premixing and explosion calculations are performed with the three-dimensional
codes, JEMI and IDEMO-3D, for non-symmetric ex-vessel reactor scenarios. The aim
was to assess the effect of the asymmetry on the mixing of fragmented melt and
coolant, steam production and explosion strength in non-symmetric scenarios. Here,
the proximity of structures, e.g. the wall of the reactor vessel or reactor cavity, was of
special interest, since they may be susceptible to damage by pressure increases in
case of vapor explosions.
To investigate such configurations, an ex-vessel scenario with a single melt pour
close to the wall of the reactor cavity has been considered. The water pool depth and
the melt flow rate have been varied. The depth of the water pool defines the axial
extension of the mixture and the duration of the premixing phase before the melt-
bottom contact. The melt flow rate determines the mass of melt that can be
fragmented from the jet and participates in the explosion. In order to assess the 3D
effect, i.e. impact of the nearest wall, on the mixture extension and its explosiveness,
2D and 3D calculations have been performed. The 2D calculations are performed
using 2D approximations: an axis-symmetric melt pour into a water pool. The radial
extension of the calculation domain has been chosen considering the “average”
mixture, i.e. steam content and radial spreading of the melt. Two different domain
sizes are considered for 2D: with a radius of 1 m for premixing and 0.4 m for
explosion. The smaller domain size in the explosion phase is considered according to
the minimal distance between the melt jet and the wall. In the investigation to the
premixing phase, the 2D and 3D calculations have shown a good agreement in the
results, see Tables 7-2 and 7-3. It is due to a symmetric mixture extension and
insignificant 3D effect of the wall. Only in the cases with the largest melt delivery,
higher melt concentrations did occur at the wall side compared to other boundary
regions. However, the pressure buildup in regions with significant melt concentrations
was too small to strongly displace the high dense corium drops. The void migration
from highly concentrated regions occurs dominantly in axial direction.
The melt bottom contact is assumed as the most likely triggering time for a vapor
explosion. The explosion calculations with the obtained premixing data showed that
the vapor explosion strength is slightly overestimated by using two-dimensional
approximations. It shows significantly higher pressure peaks in 2D. This fact is
explained by wave reflexion inside the mixing zone and focusing on the floor,
resulting in reinforcing and escalating effects. However, the pressure peaks are very
short contributing weakly to the final impulse. In conclusion, the 2D approximations
show a satisfactory capability to predict the melt fragmentation in the water, the
distribution of fragmented melt, the solidification of melt drops and void production
even for markedly asymmetric reactor scenarios. Furthermore, no strong 3D effect
has been observed in the comparison calculations, even with a distinctive three-
dimensional character. Comparing with the results obtained by Vujic [77] in the
Reactor applications
121
investigations of similar reactor conditions, it can be concluded that pressure loads
have been generally underestimated by Vujic. This is primarily explained by
differences in modeling the jet breakup yielding smaller fragments and significantly
denser mixture with high melt and void concentrations, which counteract pressure
increases in [77]. In addition, dense mixtures obtained in the previous investigations
are generally questionable, since the jet fragmentation process would be chocked in
reality due to very high melt fractions adjacent to the jet reducing the hydrostatic
head inside the mixture. Thus, such high void fraction as obtained in [77] would entail
very intense void production. This then requires again a certain water content in the
mixture.
The investigation accomplished showed that no significant 3D effect has occurred.
Hence, further asymmetric configurations have been considered, in order to attain
asymmetric effects typically for a 3D reactor case. A non-symmetric ex-vessel reactor
scenario has been constructed assuming a multiple melt outflow from the reactor
vessel close to the cavity wall. The scenario postulates an ex-vessel accident
scenario with an RPV breaking circumferentially due to thermal loads and lateral
corona-like melt outflow into the reactor cavity filled with saturated water. The
configuration means the delivery of a large amount of melt available for mixing by
multiple outpourings. This provides significant masses of fragmented melt distributed
in water with limited void fraction. The initial melt distribution due to the melt outflow
extending azimuthally in the initial phase provides a limitation of steam content in the
mixture. Such scenarios were considered as being a critical concern for pressure
loads on the structures and as a challenge to integrity [62]. The aim of this
investigation is to get a large amount of fragmented melt into the water and to assess
the melt-coolant interaction and the explosiveness of asymmetrically extended
mixtures. Two configurations have been considered by varying the water level in the
reactor cavity: 1 m and 2 m. Melt delivery has been assumed as 940 kg/s portioned
into five single melt outpourings aligned in contact. The principal consequence of the
multiple outflows in the premixing calculations was significantly higher fragmented
melt mass compared to the configurations with a single melt jet with nearly similar
melt delivery. This effect is the result of partitioning the melt inflow into five equal melt
jets that increases the total strip-off surface area of the inflowing melt. The aligned
melt outflows by fragmenting provide a dense mixture with a high fraction supporting
the void production, especially in regions between the jets. The consequence is a
quicker voiding of the mixing zone, a higher steam content in the mixture and a lower
melt fraction (in relation to the total mass) in the regions with void below 60%, in
comparison to the single jet cases. However, the multi-jet configurations have
showed higher fragmented melt masses with limited void fraction than the single jet
ones, in absolute terms. This means more melt is available for fine fragmentation
supporting stronger vapor explosions. The explosion calculations based on the data
from premixing have confirmed the assumption of higher pressure loads due to more
melt mass being available with limited void fraction. However, the pressure peaks are
Reactor applications
122
here shorter than those with a single jet, following generally higher void fractions in
the mixture and a very small melt fraction percentage in regions with void less than
30% and 40%, see Table 7-6. The maximal pressure impulses correlate with the
single jet configuration with jet diameter of 0.4 m.
Initially, the multi-jet cases are markedly three-dimensional and thus impossible to
describe in a two-dimensional approach. The 3D effect caused by the cavity wall is
only observed by later triggering when the water pool depth is 2 m. A later triggering
causes a longer mixing time. Intense steam production and local pressure buildup
displaces the melt fragments radially, in fact from the central mixing zone to the
water-rich region. No azimuthal mixture extension along the wall takes place. The
radial extension gives the mixture (initially distributed along the wall) a nearly round
form. Taking into account the melt delivery into the water, significantly higher
pressure loads have been obtained in the multi-jet cases. Considering higher void in
the mixture on average and higher fragmented melt masses, the melt fragmentation
during the premixing phase is felt to be a cause for that stronger explosion. The
partitioning of the melt delivery by multiple sources provides a better (mass-richer) jet
breakup and more fragmented melt in the mixture which is then available for fine
fragmentation during the explosion phase.
The present 3D results (single and multi-jet) agree with indications from the
investigations of Esmaili on ex-vessel fuel coolant interaction energetics for AP1000
[89]. The calculations have been performed using the two-dimensional premixing
PM-ALPHA [31] and explosion ESPROSE.m [32] computer codes. For the base
case, a failure of the RPV lower head with a break size of 0.4 m in diameter is
assumed. The outflow rate is 1709 kg/s. The particle diameter is set to a constant
value of 10 mm. The water is subcooled by 30 K. The explosion is triggered on the
bottom at 1 s of premixing time. The calculations yield maximum pressure loads at
the cavity wall of up to 90 MPa. The decreasing of the drop size has resulted in
higher steam generation and voiding of the mixture region. The high void limits the
explosiveness of the mixture and leads to weakening of the resulting pressure loads.
Summary and conclusion
123
8 Summary and conclusion
The purpose of this thesis has been to extend the existing two-dimensional premixing
and explosion models IKEJET/IKEMIX and IDEMO to 3D and to investigate the effect
of asymmetry during a severe accident with steam explosion in a Light Water
Reactor (LWR). A steam explosion may occur during a severe accident in LWR‟s
with core melting as a consequence of the interaction of molten core materials with
water, inside the reactor pressure vessel (RPV) or outside the RPV in the reactor
cavity which is likely to be filled with water. Such steam explosions may significantly
enhance the risk of a severe accident, challenging the integrity of the surrounding
structures such as the reactor pressure vessel, the primary containment and possibly
even of the reactor building. The loss of the primary containment integrity as a result
of an ex-vessel steam explosion will cause a release of large amounts of fission
products into the atmosphere and contamination over a large area. Measures to
alleviate the consequences, to inhibit or even to prevent the vapor explosions must
be investigated in the context of reactor safety research.
Factors affecting the development of explosive mixtures and determining the strength
of a steam explosion are given by:
Fragmented melt mass in water mixture due to limited melt delivery,
Jet breakup determining the melt drop size and the melt fraction which can
fragment,
Void buildup during premixing inhibiting pressure escalation during the
detonation,
Solidification at the surface of melt drops during premixing, reducing the
participating melt and
Reflection and venting processes during the detonation, affecting the pressure
escalation and buildup of shockwaves.
Asymmetries caused by geometrical constraints and confinements (e.g. wall
proximity, distributed melt pouring), which are likely during an accident with core
melting, may have a strong impact on the explosion development by affecting the
interaction of melt and coolant during both premixing and explosion stages. In the
past, asymmetric configurations have been investigated with 2D models using 2D
approximations. Questions regarding the mixing of fragmented melt, water and steam
and thus the mixture explosiveness still remained open due to uncertainties existing
with the 2D approach. The 2D approximations which were used, may not deliver a
satisfactory representation of the role of geometrical restrictions on the extent of
mixing. In order to provide an adequate answer to the influence of geometrical
restrictions and predict the explosion strength in a conservative manner, the two-
dimensional premixing and explosion codes IKEJET/IKEMIX and IDEMO have been
extended to 3D in the present work. Additionally to the 3D extension, further

Summary and conclusion
124
modeling adaptations were needed with regard to their applicability to real reactor
conditions:
Modification of the jet-breakup modeling for reactor scenarios with long melt
jets in deep water pools,
Representation of melt drops during the mixing with coolant using a
Lagrangian approach,
Solidification of melt drops and crust growth at the drop surface using a
temperature drop approach and
Modeling of different fine-fragmentation behavior of melt drops with different
crust thicknesses during the explosion phase.
The extended premixing model JEMI has been presented in Chapter 4. JEMI is a
suitable tool for the analysis of the phenomena of mixing of molten fuel in water with
strong steam production. The model includes a description of the entry of molten fuel
into water in the form of jets, the fragmentation of a melt jet under film boiling, heat
transfer from very hot melt fragments to water, strong evaporation and re-
condensation processes as well as solidification of melt drops. The focus has been
particularly on applicability to real reactor conditions: pouring of large melt masses
into a deep water pool very close to the vessel or cavity wall. The delivery of large
melt masses might occur after the failure of the reactor vessel resulting in large
breaks with a consequent melt outflow due to a moderate overpressure inside the
RPV. Scenarios with large melt masses are expected to inflict severe damage due to
more melt being available for energy release causing potentially strong pressure
escalations and loads on the surrounding structure. Large melt outflow rates lead to
thick and long melt jets. This has required a modification of the jet breakup modeling
used in IKEJET/IKEMIX, in order to avoid melt fragments that would be too small
(~1 mm and smaller) in the premixing due to direct coupling of the drop size and
upward steam velocity in the vapor film around the melt jet. Furthermore, the
Lagrangian approach used for the melt drops in the premixing allows one to track of
each drop with regard to its location, velocities, temperatures and crust thickness.
The solidification of melt fragments, i.e. crust development, has been modeled using
the temperature drop approach assuming two different temperature profiles for the
liquid and solid boundary layers. The storage of latent heat is assumed at the
solidification front corresponding to the melting temperature and is represented as a
line source of heat. The solidification at the surface of melt drops represents a
limitation for fine fragmentation during the explosion phase.
The extended explosion model IDEMO-3D has been represented in Chapter 5. The
detonation model implemented in IDEMO has been carried over into IDEMO-3D by
merely extending it to 3D. With the objective of examining differently solidified melt
fragments from the premixing phase, a discretization of the crust thickness for the
melt has been implemented. The effect of a thin solidified layer at the surface on the
Summary and conclusion
125
fine fragmentation ability for melt drops has been covered using a crust stability
criterion. The stiffness and elasticity of the crust at the drop surface is considered as
the stabilizing force against the disruptive hydrodynamic force due to fluid movement.
Thus, once the solid crust develops at the surface of a melt droplet, the crust stability
criterion determines the ability of this droplet to participate in fine fragmentation.
In Chapter 6, verification and validation calculations have been performed. The
verification of the premixing model JEMI is based on the experimental results
performed in the FARO experimental facility at JRC. At first, separate evaluations for
partial models have been performed. The aim was first of all to verify the separate
JEMI modules to guarantee a correct prediction of partial aspects. Evaluations of the
jet breakup, i.e. the coherent jet length and resulting droplet size, have been made by
the modified IKEJET module for jet fragmentation in water with film boiling. The
feedback with the surrounding mixture states was not included in this separate
analysis. The evaluation has showed that the fragmentation process is similar in all
FARO tests due to the similarity of particle size distribution found in the loose debris.
Especially, for low pressures, expected in reactor scenarios with core melting, jet
fragmentation showed a good agreement with the experiments. The modeling of jet
breakup used in JEMI offers an adequate description of jet breakup in water with film
boiling for the coherent jet lengths and resulting fragment sizes. Further, separate
evaluations of the new solidification model CFOR presented in Chapter 4.7 have
been performed for common drop sizes expected in accidents with vapor explosion in
reactor scenarios. The CFOR model is a one-dimensional analytical solution
describing the development of the temperature profile inside a spherical droplet due
to heat exchange with coolant and the progress of the solidification front from the
surface into the droplet. Droplet sizes of 3 and 5 mm with corium material properties
have been chosen to show the ability of the separate solidification modules to resolve
the development of the surface temperature and the thickness of the solid layer at
the droplet surface (crust). The surface temperature is necessary in the premixing
phase to determine the heat exchange between melt and coolant over the surface.
The crust thickness is required in the explosion phase to assess the mechanical
stability of the drop against hydrodynamic disturbances at the surface and ability to
fragment finely. The calculation results of the analytical solution CFOR have been
compared with a numerical solution. The comparison results have shown a good
agreement between both solutions. Deviations have been noticed after 78% of the
entire drop is already solidified. Thus, CFOR represents a good tool to predict the
surface temperature drop and the solidification of melt fragments during their mixing
with coolant.
The JEMI validations of the complete code have been made using the FARO L-24,
L-28 and L-31 experiments. The chosen experiments give relatively detailed results
which allow critical checking by comparison with test. In particular, a long melt
pouring duration of ~ 5 s in FARO L-28 and initial (outlet) jet diameter of 5 cm, allow
the establishment of clear conditions. Generally, long melt pouring durations of
Summary and conclusion
126
several seconds and thick melt jets (10 cm to 40 cm of jet diameter) are considered
as representative for reactor conditions with respect to large melt outflow rates, high
temperatures and material properties (i.e. corium) as used in the FARO tests. A
comparison of the obtained particle size distributions with experimental data from
FARO showed satisfactory agreement. However, the calculated size distribution
lacks sufficient resolution for smaller particles. Nevertheless, the average calculated
particle sizes fall well within the experimental band width. The present modeling of jet
breakup aims to yield information on the fraction of melt broken up into droplets. It
also aims to furnish indications on the dominant particle sizes that can be considered
as generally applicable for void generation in the premixing phase. A full description
of the whole particle size range is not considered. A good agreement has been
achieved calculating the average void fraction and the system pressure increase.
The pressure development is the main indication of steam production, and of the
heat exchange between melt and coolant. Too high void in the mixture chokes the
steam production and too low void means that less steam is produced. Both lead to a
slowing of the pressure increase and to an underestimation of steam production. The
void in the mixture is an important indication for the validity of the modeling of all
mixing processes, including the jet fragmentation, drop size, mixture extent and heat
transfer. The information on the void fraction and drop size is required in explosion
calculations.
The IDEMO-3D verifications are based on the KROTOS experiments performed at
JRC. KROTOS tests have been performed with various stimulant materials such as
tin, Al2O3 and prototypical corium mixture (80 w% UO2 + 20 w% ZrO2). These tests
provide unique experimental data base on steam explosions considered essential for
the model development. The alumina melt produces a coarse mixture with large
fragments independently of water sub-cooling, being able to produce a vapor
explosion either triggered or spontaneously. Corium melts produce a mixture with
relatively fine fragments. No spontaneous steam explosion is produced by the tests
with corium. Moreover, higher pressures have been measured with alumina melts up
to 100 MPa, while the corium melts yielded rather moderate pressure increases up to
20 MPa. Experimental results have led to the conclusion that jet fragmentation during
the premixing and the material properties of alumina and corium melts are the reason
for the discrepancy in the explosion strength. A closer examination of this difference
has been the major focus of KROTOS tests and the validation calculations in the
scope of this verification. Three KROTOS tests are considered as suitable basis for
the verification of IDEMO-3D: KROTOS K-44, K-52 and K-58. The IDEMO-3D code
uses the same modeling as its predecessor 2D code version IDEMO. In the present
work, it is enhanced with regard to the three-dimensionality and the consideration of
drop solidification during premixing. The chosen tests provide a detailed experimental
data on explosion propagation forming a good base for validation of models. Detailed
information for important results exists, e.g. the debris size distribution, no
irregularities are observed, which are responsible for the observed differences in the
Summary and conclusion
127
resulting loads between alumina and corium melts. The initial conditions for the
calculations with IDEMO-3D have been obtained with the premixing model JEMI. The
premixing data (i.e. melt fraction, solidification status of each particle, steam content,
and pressures) have been converted as input data into IDEMO-3D. The premixing
calculations have been considered as an additional verification of the premixing
model JEMI. The aim of the coupled investigation was to check the capability to
predict the pressure loads obtained in the experimental facility in the adequate range
and indicate the important factors yielding the difference between the corium and
alumina melts with respect to the obtained pressure loads. A good agreement
regarding the pressure escalation and propagation has been achieved with K-44
using the stimulant melt Al2O3. Solidification of melt drops of ~9 mm has not occurred
in the premixing stage. This is due to a larger drop size, higher thermal conductivity
and higher solidification enthalpy of Al2O3 drops compared with corium. The
verification analysis based on K-52 and K-58 using corium has shown a satisfying
agreement concerning the pressure increases and propagations. The range of the
pressure loads could be reproduced with some deviations caused by the initial
pressure impulse from triggering. The experimental results have given a definite
explanation for the differences between the alumina and corium melts. The
solidification of melt drops in the tests with corium is a key limitation for the explosion.
In the calculations, only ~20% of the entire melt mass entered the water has had no
crust at the surface. The mass fraction with crust thickness below 10% of radius (low-
crusted) was ~58%. The propagation velocities in tests with corium were lower than
those in tests with Al2O3, reducing fine fragmentation ability of low-crusted particles.
Generally, the IDEMO-3D have shown a good ability to predict pressure loads within
an adequate range using coupled solutions with JEMI. It can be used for
investigation of reactor scenarios.
Calculations on reactor relevant configurations have been presented in Chapter 7.
The aim was to assess the impact of asymmetry in real reactor conditions. For this, a
non-symmetric ex-vessel configuration with a single melt outflow from a failed reactor
vessel was considered by varying the melt entry and water pool configuration. The
melt delivery was varied between 188 kg/s and 3016 kg/s; the pool filled with
saturated water was considered with depth of 1 m and 2 m. The defined
configurations were investigated in 2D and 3D geometries. This primarily addresses
the extent and distribution of the melt and voids under the impact of geometrical
restrictions, in this case, the wall cavity. The extent of the mixture has been
considered as a key characteristic of the mixture explosiveness. Spatial extents of
the mixture (e.g. stretching and dilution of mixing region) affect the melt concentration
and steam content in the mixture. Melt concentrations indicate the energy amount
which may be potentially released; the steam acts as a limiting factor for pressure
increase and shock wave propagations due to its high compressibility. Concentration
of melt fragments leads locally to an increase in explosiveness. The void reduction
always brings with it as a consequence an increase in pressure loads. The proximity
Summary and conclusion
128
of structures, such as the cavity wall, potentially leads to an increase in melt
concentrations at these locations. This can cause significantly higher loads on these
structures leading to their potential failure. High melt concentrations also cause
intense evaporation and local pressure buildup. The latter affects the mixture, thus
potentially displacing and deforming the void and melt clouds.
During the mixing of melt and coolant, the investigations performed with 2D and 3D
geometries have shown no significant effect of the asymmetry on the mixture extent
in the typical considered 3D reactor case. The 2D and 3D have shown a very good
agreement with the experimental results in particular with respect to the jet
fragmentation and the void in the mixture. The solidification of fragmented melt has
been obtained in cases with delayed triggering. No significant displacement or
deformation of the mixing zone under local pressure buildups has been observed.
The explosion calculations with the premixing data have shown that the explosion
strength was slightly overestimated in the 2D geometry. Here, significantly higher
pressure peaks have resulted. However, the pressure peaks were very short and
contributed little to the final impulses. Concluding the achieved results, the 2D
approximations have shown a satisfactory capability to predict the melt fragmentation
in water, distribution of fragmented melt, solidification of melt drops and void
production even in distinctive 3D reactor cases.
The investigations with a single melt pour close to a wall have shown no significant
3D effect and a good agreement with the 2D approximate investigations. Hence, an
additional asymmetric reactor case is considered: a multiple melt outflow from the
reactor vessel close to the cavity wall. This reactor scenario has postulated an ex-
vessel accident scenario with a circumferentially breaking RPV due to thermal loads
and lateral corona-like melt outflow (five aligned melt jets in contact) into the cavity
filled with saturated water. The melt delivery has been assumed 940 kg/s and the
water pool has been varied between 1 m and 2 m. The principal result has been
significantly more fragmented melt compared to the single jet configurations due to
initial partitioning of the melt entry into five single melt pours. This is due to an
increase of the total strip-off surface area of the inflowing melt. The stronger jet
breakup has provided a denser mixture with high melt fraction supporting a strong
evaporation. While the multi-jet scenarios have yielded more fragmented melt in
absolute terms, percentally a very small melt fraction (in relation to the total mass)
was in the regions with void below 30% and 40%. For this reason, the pressure
peaks up to 65 MPa have been shorter than those in case of single jet. The pressure
impulses have correlated with the single jet configurations with melt outflow of
3016 kg/s. This makes factor 3. Considering the asymmetry, 3D effects caused by
the cavity wall (i.e. spatial deformation of the mixing zone) have occurred in the case
with delayed triggering (pool depth of 2 m) causing a longer mixing time. The mixture
has been deformed in radial direction to the water-rich region due to local pressure
buildup in the regions at the wall and between the melt jets. As consequence, the
initially stretched mixing zone has become nearly round.
Summary and conclusion
129
In general it can be concluded, that JEMI and IDEMO-3D are available as suitable
tools for investigations of steam explosions for real reactor applications as well as
separate effects determining the explosion strength. No significant 3D effect during
the premixing has been obtained in asymmetric single-jet configurations.
Deformations induced by a close cavity wall have occurred in the case with the
multiple pours into the deepest water pool. Taking into account the melt amount
entered into water, the multi-jet configurations have provided significantly higher
pressure loads and impulses, and can be considered as most critical. Since the
highest pressure loads have occurred at the water surface, further theoretical
investigations are necessary for ex-vessel scenarios, where the lower plenum of the
RPV is partially arrested by water. Such configurations might yield higher loads on
the RPV with a consequence of integrity failure of the RPV or creating of missiles.

Summary and conclusion
130
List of References
131
9 List of References
[1] N.E. Todreus, M.S. Kazimi. Nuclear System I: Thermal Hydraulics
Fundamentals. Massachusetts Institute of Technology, Taylor & Francis
Group, New Your, 1990. ISBN 1-56032-051-6, pp. 64-70.
[2] INES: The International Nuclear Safety Scale, User‟s Manual, Revised and
Extended Edition 1992, Vienna 1992.
[3] U.S. Nuclear Regulatory Commission Regulations: Title 10, Code of Federal
Regulations. § 50.47.
[4] Swiss Nuclear Environment Regulation 732.112.2: Verordnung des UVEK
vom 17. Juni 2009 über die Gefährdungsannahmen und die Bewertung des
Schutzes gegen Störfälle in Kernanlagen. SR-Nr. 732.112.2, 17. Juni 2009,
Switzerland.
[5] W. Eggleston. Canada‟s Nuclear Story. Clarke, Irwin & Company, Toronto,
1965.
[6] A.W. Cronenberg, R. Benz. Vapor Explosion Phenomena with Respect to
Nuclear Reactor Safety Assessment, US Nuclear Regulatory Commission/
CR.O245-TREE-1242, 1978.
[7] P.T. Speis, S. Basu. Fuel-Coolant Interaction (FCI) Phenomena in Reactor
Safety: Current Understanding and Future Research Needs. In: Proceedings
of the OECD/CSNI Specialists Meeting on Fuel-Coolant Interactions, Tokai-
Mura, Japan, May 19-24, 1997.
[8] GRS, Gesellschaft für Anlagen und Reaktorsicherheit mbH, 1996. The
Accident and the Safety of RBMK-Reactors, February 1996.
[9] N. Fujii. Various styles of intense multiphase interactions viewed from volcanic
explosions. Proc. US (Natl. Sci. Found.-Japan (Jpn. Soc. Promo. Sci.) Joint
Seminar. June 9–13, 1995. Santa Barbara, California, USA, 1995.
[10] M. Bürger, S.H. Cho, D.S. Kim, C. Carachalios, G.Fröhlich, K. Müller, H.
Unger, 1985. Effect of solid crusts on the hydrodynamic fragmentation of melt
drops. Final Report, IKE 2 TF-74, June,1985.
[11] M. Bürger, M., S.H. Cho, C. Carachalios, K. Müller, H. Unger., H. Jacobs,
1986. Effect of solid crusts on the hydrodynamic fragmentation of melt drops.
Science and technology of fast reactor safety, BNES, London, 1986.
[12] L.S. Nelson, P.M., Duda. Steam explosion experiments with single drops of
iron oxide melted with a CO2 laser. Parametric studies. NUREG/CR-2718,
Sandia National Laboratories, 1985.
List of References
132
[13] L.S. Nelson, L.D. Buxton. Steam Explosion Triggering Phenomena: Stainless
Steel and Corium-E Simulants Studied with a Floodable Arc Melting
Apparatus, Sandia Laboratories SAND77-0998, NUREG/CR-0122, May 1978.
[14] L.S. Nelson et al. Steam Explosion Triggering Phenomena; Part 2: Corium-A
and Corium-E Simulants and Oxides of Iron and Cobalt Studied with a
Floodable Arc Melting Apparatus, Sandia Laboratories SAND79-0260,
NUREG/CR-0633, May 1980.
[15] L.S. Nelson. Steam Explosion Studies with Single Drops of Modlten Refractory
Materials, ANS Thermal Reactor Safety Meeting, Knoxville, TN, April 1980.
[16] G. Fröhlich, H. Unger. Investigation of Steam Explosion for Prevention of
Severe Accidents in Plants. Assoc. for Structural Safety and Reliability, pp.
597-601, New York, USA, 1985.
[17] L.D. Buxton, W.B. Bendedick. Steam Explosion Efficiency Studies;: Corium
Experiments, Sandia Laboratories SAND79-1399, NUREG/CR-0947,
November 1979.
[18] W.B. Bendedick, L.D. Buxton, M.L. Corradini. Steam Explosion Efficiency
Studies; Part 2: Corium Experiments, Sandia Laboratories SAND79-1399,
NUREG/CR-0947, November 1979.
[19] D. Magallon, H. Hohmann. High Pressure Corium Melt Quenching Tests in
FARO. Nuclear Engineering and Desing, 155, pp. 123-270, 1995.
[20] D. Magallon, H. Hohmann. Experimental Investigation of 150-kg-scale Corium
Melt Quenching in Water. Nuclear Engineering and Desing, 177, pp. 321-337,
1995.
[21] I. Huhtiniemi, D. Magallon, H. Hohmann. Results of recent KROTOS FCI
Tests: Alumina vs. Corium Melts, Nuclear Engineering and Design 189, 379-
386, 1999.
[22] A. Kaiser, W. Schütz, H. Will: PREMIX TEST PM12, PM14 and PM14
Description and First Results, IRS-4-Notiz Nr. 1409/98, 16. June 1998.
[23] A. Kaiser, W. Schütz, H. Will: PREMIX Tests PM12, PM13 and PM14,
Documentation of Experimental Results, FZK-Bericht on Printing, INV-MFCI
(99) D050, 1999.
[24] A. Kaiser, W. Schütz, H. Will: PREMIX 15, Description. Data Report and First
Results, IRS-4-Notiz Nr. 1445/99, 7. INV-MFCI (99) D049, July 1999.
[25] A. Kaiser, W. Schütz, H. Will: PREMIX-16, Description, Data Report and First
Results, IRS-4-Notiz Nr. 1431/99, 15. INV-MFCI (99) D031, March 1999.
[26] A. Kaiser, W. Schütz, H. Will: PREMIX-17, Description, Data Report and First
Results, IRS-4-Notiz Nr. 1440/99, INV-MFCI (99) D036, June 1999.
List of References
133
[27] M.F. Young. IFCI: An Integrated Code for Calculation of All Phases of Fuel-
Coolant-Interactions. NUREG/CR-5084, SAND87-1048, 1987.
[28] F.K. Davis, M.F. Young. Integrated Fuel-Coolant Interaction (IFCI 6.0) Code.
NUREG/CR-6211, SAND94-0406,1994.
[29] M.F. Young. The TEXAS Code for Fuel-Coolant Interaction Anylsis. Liquid
Metal Fast Breeder Reactor Safety Topical Meeting, Lyon, France, 1982.
[30] C.C. Chu et al. A Code Manual for TEXAS-V: One Dimensional Transient
Fluid Model Fuel-Coolant Interaction Analysis. Revision June 1996.
[31] W.W. Yuen, T.G. Theofanous. PM-ALPHA: A Computer Code for Addressing
The Premixing of Steam Explosion. DOE/ID-10502, 1995.
[32] T.G. Theofanous, W.W. Yuen. ESPROSE.m: A Computer Code For
Addressing The Escalation/Propagation of Steam Explosions. DOE/ID-10501,
1995.
[33] T.G. Theofanous, W.W. Yuen, K. Freeman, X. Chen. The Verification Basis of
the ESPROSE.m Code, Nuclear Engineering and Design, vol. 189, pp. 103-
138, 1999.
[34] C. Brayer, G. Berthoud. First Vapor Explosion Calculations Performed with the
MC3D Code. In: Proceedings of the OECD/CSNI Specialists Meeting on Fuel-
Coolant, Interactions, Tokai-Mura, Japan, May 19-24, 1997.
[35] R. Meignen. MC3D Version 3.5: Description Of The Physical Models Of The
PREMIXING Application. NT/DSR/SAGR/05-66, Directions de la Sûreté des
Réacteurs, IRSN, France, 2006.
[36] K. Moriyama, N. Yamano, Y. Maruyama, T. Kudo, J. Sugimoto, J. Study of
Premixing Phase of Steam Explosion with JASMINE Code in ALPHA Program.
In Proceedings of 4th International Conference on Nuclear Engineering, New
Orleans, volume 1B, pp. 903–915, 1996.
[37] K. Vierow, K. Nagano, K. Araki. Development of the VESUVIUS Module:
Molten Jet Break-up Modelling and Model Verification. In: Proceedings of the
OECD/CSNI Specialists Meeting on Fuel–Coolant Interactions, Tokai-Mura,
Japan, May 19–21, pp. 541–566.
[38] C.C. Chu et al. Ex-Vessel Melt Coolant Interactions in Deep Water Pool:
Studies and Accident Management for Swedish BWR‟s. Nuclear Engineering
and Design, 155, pp. 159-213, 1995.
[39] C.C. Chu et al. Comparison of THIRMAL-1 Predictions with FARO and CCM
Experiments, Transactions of the ANS. Vol. 71, 1994.
[40] G. Pohlner, Z. Vujic, M. Bürger G. Lohnert. Simulation of Melt Jet Break-up
and Debris Bed Formation in Water Pools with IKEJET/IKEMIX. Nuclear
Engineering and Design 236, pp. 2026-2048, 2006.
List of References
134
[41] M. Buck. Weiterentwicklung und Verifikation des thermischen
Detonationsmodell IDEMO, Diploma Thesis, IKE, Universität Stuttgart, Report
IKE 2D-110, Aug. 1994.
[42] M. Buck, M. Bürger. IDEMO - A Thermal Detonation Model of Vapor
Explosions: Multi-Fluid Model, Constitutive Laws and Verification Lines. In:
Proceedings of the 2nd Japanese-German Symposium on Multi-Phase Flow,
Tokyo, September 25-27, 1997.
[43] Magallon, D. et al.: OECD Programme SERENA (Steam Explosion REsolution
for Nuclear Applications) Work Programme and First Results, Proc. of
NURETH-10, Seoul, Korea, October 5-11, 2003.
[44] D. Magallon. OECD Programme SERENA (Steam Explosion Resolution for
Nuclear Applications) Task 2, Reference Data for Calculation of FARO Tests
L-28, L-31 and L-33. Internal Report, 2002.
[45] D. Magallon. Formation and Characterisation of Corium Debris Arising From
Fuel–Coolant Interaction. Nuclear Engineering and Design 236, pp. 1998–
2009, 2006.
[46] R. Silverii, D. Magallon. FARO LWR PROGRAMME, Test L-28 Data Report,
Technical Note No.I.99.76, INV-MFCI(99)-D033, European Commission, Joint
Research Centre, Ispra Site, April, 1999.
[47] S.J. Board, R.W. Hall. Recent Advances in Understanding. Large Scale Steam
Explosions. In: Proceedings of the 3rd Specialist Meeting on Sodium-Fuel
Interactions in Fast Reactors, Tokyo, PNC N251, 76-12, pp. 249-283, 1976.
[48] M.L. Corradini. Analysis and Modeling of Steam Explosion Experiments.
Sandia National Laboratories, SAND80-2131, NUREG/CR-2072, April 1981.
[49] M.L. Corradini. Analysis and Modeling of Large-Scale Steam Explosion
Experiments. Nuclear Science and Engineering, vol. 82, pp. 429-447, 1982.
[50] M.L. Corradini et al. Vapor Explosions in Light Water Reactors: A Review of
Theory and Modeling. Progress in Nuclear Energy, 22(1), pp. 1-117, 1968.
[51] M. Bürger, S.H. Cho, E.v. Berg, A. Schatz. Break-up of Melt Jets as Pre-
condition for Premixing: Modeling and Experimental Verification. Nuclear
Engineering and Design 155, pp. 215-251, 1995.
[52] Y. Abe, E. Matsuo, T, Arai, H. Nariai, K. Chitose, K. Koyama, K. Itoh, 2006.
Fragmentation behavior during molten material and coolant interactions, Nucl.
Eng. Design vol. 236, pp. 1668-1681, 2006.
[53] T. Ginsberg. Liquid Jet Breakup Characterization with Application to Melt-
Water Mixing. ANS Proc. National Heat Transfer Conference, Denver,
USA,1985.
List of References
135
[54] E. Matsuo, Y. Abe, K. Chitose, K. Koyama, K. Itoh. Study on jet breakup
behavior at core disruptive accident for fast breeder reactor. Nuclear
Engineering and Design 238, pp. 1996–2004, 2008.
[55] K.H. Bang, J.M. Kim, D.H. Kim. Experimental Study of Melt Jet Breakup in
Water. Journal of Nuclear Science and Technology, vol. 40, No. 10, pp. 807-
813, 2003.
[56] J.W. Strutt, Lord Rayleigh. On The Instability of Jets. Proceedings of the
London mathematical society, vol. 10, pp. 4-13, London, 1878.
[57] T.G. Theofanous, W.W. Yuen and T.N.Dinh. Calculations of Pre-Mixing
Experiments With the PM-ALPHA.L.3D code. Part1: Calculation of FARO L-28
experiment. CRSS-02/12-02, Center for Risk Studies and Safety, University of
California, Santa Barbara, CA, USA, 2002.
[58] T.N. Dinh, V.A. Bui, R.R. Nourgaliev, J.A. Green, B.R. Sehgal. Experimental
and Analytical Studies of Melt Jet-Coolant Interactions: A Synthesis. Nuclear
Engineering and Design, vol. 189, pp. 299-237, 1999.
[59] L.S. Nelson, L.D. Buxton. Steam Explosion Triggering Phenomena: Stainless
Steal and Corium-E Simulants Studied with a Floodable Arc Melting
Apparatus, Sandia Laboratories SAND77-0998, NUREG/CR-0122, May 1978.
[60] L.S. Nelson et al. Steam Explosion Triggering Phenomena; Part 2: Corium-A
and Corium-E Simulants and Oxides of Iron and Cobalt Studied with a
Floodable Arc Melting Apparatus, Sandia Laboratories SAND79-0260,
NUREG/CR-0633, May 1980.
[61] Y. Abe, H. Nariai, Y. Hamada. The Trigger Mechanism of Vapor Explosion.
Journal of Nuclear Science and Technology, vol. 39, No. 8, pp. 845-853, 2002.
[62] M. Schröder, Z. Vujic, G. Pohlner, M. Buck, M. Bürger, G. Lohnert.
Investigation of Main Limiting Effects to Strong Steam Explosions in 3D
Geometry Considering Real Accident Scenarios. In Proceedings of the
Conference Nuclear Energy for New Europe, Lubljana, Slovenia, 15.-17. Sep
2009.
[63] M. Bürger, G. Pohlner, M. Buck, M. Schröder. Abschlussbericht zum
Forschungsvorhaben BMWA 1501266, Institut für Kernenergetik und
Energiesysteme (IKE), Universität Stuttgart, Bericht IKE 2-151, September
2004.
[64] M. Bürger, M. Buck, Z. Vujic: Stand der Arbeiten zur Vorvermischung,
Zwischenbericht zum Vorhaben BMWA 150 1266, IKE 2-151, Universität
Stuttgart, Februar, 2005.
[65] M. Schröder. Three Dimensional Modelling and Simulation of Steam Explosion
– Need for Three Dimensional Analyses and First Development
Steps.Jahrestagung Kerntechnik, Aachen, 16.-18. Mai 2006.
List of References
136
[66] M. Bürger, M. Buck, M. OECD Programme SERENA (Steam Explosion
Resolution for Nuclear Applications), Analyses of Task 2 Calculation Results.
Internal Report, 2005.
[67] M. Ishii and N. Zuber: Drag Coefficient and Relative Velocity in Bubbly, Droplet
or Particulate Flows. AIChE J. 25 (1979) 843.
[68] Z. Vujic, M. Bürger, M. Buck, G. Lohnert. Investigation of Limitations to Steam
Explosions Strength due to Water Depletion. In: Proceedings of the 15th
International Conference on Nuclear Engineering (ICONE15), Nagoya, Japan,
April 22-26, 2007.
[69] Bürger M., Pohlner G., Vujic Z.: Stand der Arbeiten zur Vorvermischung.
Zwischenbericht zum Forschungsvorhaben BMWA 1501266, Institut für
Kernenergetik und Energiesysteme (IKE), Universität Stuttgart, Bericht IKE 2-
151, September 2004.
[70] L.S. Carreto, A.D. Gosman, S.V. Patankar, S.B. Spalding. Two calculation
procedures for steady, three-dimensional flows with recirculation. In
proceedings of the 3rd International Conference Numerical Methods of Fluid
Dynamics, Paris, France, 1972.
[71] M. Epstein, G. Hauser. Subcooled Forced-Convection Film Boiling in the
Forward Stagnation Region of a Sphere or Cylinder. International Journal of
Heat and Mass Transfer 23, pp. 179–189, 1980.
[72] M. Leskovar, R. Meignen, C, Brayer, M. Bürger, M. Buck, Material influence on
steam explosion efficiency: state of understanding and modelling capabilities,
The 2nd European Review Meeting on Severe Accident Research (ERMSAR-
2007), June 12-14, 2007, FZK, Karlsruhe, Germany, 2007.
[73] T. Okkonen, B.R. Sehgal. “Influence of Melt Freezing Characteristics on
Steam Explosion Energetics”, Proc. ICONE Conference, 1, pp. 923-934, 1996.
[74] K. Moriyama, H. Nakamura, Y. Maruyama. Analytical Tool Development for
Coarse Break-Up of a Molten Jet in Deep Water Pool. Nuclear Engineering
and Design, 236, pp. 2010–2025, 2006.
[75] M. Buck, M. Bürger, Z. Vujic: OECD Programme SERENA (Steam Explosion
Resolution for Nuclear Applications) Task 3, Comparison of various
approaches for calculating explosions. Step 1, Calculation of explosion
experiments. Description of the thermal detonation model IDEMO-2D.
Contribution of IKE, Universität Stuttgart.
[76] M. Bürger, M. Buck, Z. Vujic. Stand der Arbeiten zur Explosionsphase.
Zwischenbericht zum Vorhaben BMWA 150 1266, IKE Universität Stuttgart,
Report: IKE 2-155, Oktober 2007.
[77] Z. Vujic. Improvement and Verification of Steam Explosion Models and Codes
for Application to Accident Scenarios in Light Water Reactors. PhD Thesis,
List of References
137
Institute of Nuclear Technology and Energy Systems (IKE), University of
Stuttgart, 2008.
[78] M. Pilch, C.A. Erdman, A.B. Reynolds. Acceleration induced fragmentation of
liquid drops, Charlottesville, VA: Department of Nucl. Eng., University of
Virginia, NUREG/CR-2247, 1981
[79] R.R. Schröder, R.C. Kitner. Oscillation of drops falling in liquid field, A.I.Ch.E.
Journal, vol 11 no 1 pp 5-8, 1965
[80] N.I. Kolev. Multiphase Flow Dynamics 2. Thermal and Mechanical
Interactions. 2nd Edition, Springer Verlag Berlin Heidelberg, 2005
[81] D. F. Fletscher. Propagation investigations using the CULDESAC model.
Nuclear Engineering and Design, vol. 155, pp. 271-287, 1995.
[82] M. Epstein. “Stability of a Submerged Frozen Crust”, ASMA Journal on Heat
Transfer, Vol.99, pp. 527-532, 1977
[83] M. Cooper and J. Dienes, 1978. The role of Rayleigh-Taylor instabilities in
fuel-coolant interactions. Nucl. Science and Eng., vol. 68, pp. 308-321, 1978.
[84] M. Bürger, C. Carachalios, D.S. Kim, H. Unger H. Theoretical investigations on
the fragmentation of drops of melt with respect to the description of thermal
detonations and their application in the code FRADEMO, Rep. 10660. Comm.
Eur. Commun. Brussels, 1986.
[85] M. Uršič, M. Leskovar, I. Kljenak, B. Mavko. Modelling of material properties
influence in fuel-coolant interaction codes, ICONE17-75039, Proceedings of
the 17th International Conference on Nuclear Engineering (ICONE17), July 12-
16, Brussels, Belgium, 2009.
[86] I. Huhtiniemi, D. Magallon: Insight into steam explosions with corium melts in
KROTOS, Nuclear Engineering and Design 204, 391-400, 2001.
[87] M. Uršič, M. Leskovar, R. Meignen, M. Schröder, M. Buck, M. Bürger.
Improved melt solidification influence modelling in Fuel Coolant Interactions,
ERMSAR-2010, Bologna, Italy, Mai 2010.
[88] I. Huhtiniemi, H. Hohmann, R. Faraoni, M. Field, R. Gambaretti, K. Klein.
KROTOS 38 TO KROTOS 44: Data Report. Technical Note No. I.96.37,
March 1996.
[89] H. Esmaili, M. Khatib-Rahbar: Analysis of Likelihood of Lower Head Failure
and Ex-Vessel Fuel Coolant Interaction Energetics for AP1000. Nuclear
Engineering and Design, vol. 235, pp. 1583-1605, 2005.