This document is prepared by Decentralization and Local ...
92
Transcript of This document is prepared by Decentralization and Local ...


2
This document is prepared by Decentralization and Local Development Programme (dldp), with financial
support of Swiss Agency for Development and Cooperation (SDC)
This publication reflects the view of its authors and not necessarily of SDC.
Prepared by:
Cooperation and Development Institute (CDI)
Published by:
Decentralisation and Local Development Programme (dldp)
HELVETAS Swiss Intercooperation | Albania
Address: Str. "Ibrahim Rugova",
PLUS Building, 2nd Floor / No. 3. Tirana | Albania
www.dldp.al | www.km.dldp.al
3
Contents
I. ABSTRACT .......................................................................................................................................5
II. METHODOLOGY .............................................................................................................................7
III. GENERAL OVERVIEW OF FUNCTIONAL AREA DURRES .....................................................................9 III.1. GEOGRAPHICAL POSITION & INFRASTRUCTURE ........................................................................................... 9 III.2. GEOLOGICAL STRUCTURE AND CLIMATE ................................................................................................... 10 III.3. ENVIRONMENTAL RESOURCES ................................................................................................................ 11 III.4. FUNCTIONAL AREA COMPOSITION, THE ADMINISTRATIVE UNIT BORDERS AND CONNECTIONS ............................ 12 III.5. HISTORY, CULTURE, TRADITIONS, TOURIST ATTRACTIONS ............................................................................ 13
III.5.1. Presentation of history ............................................................................................................. 13 III.5.2. Cultural heritage, museums and ethnographic ....................................................................... 14
III.6. DEMOGRAPHIC TRENDS ........................................................................................................................ 15 III.7. KEY FEATURES OF DURRES FUNCTIONAL AREA – DLDP APPROACH .............................................................. 17
III.7.1. The concept of Functional Area ................................................................................................ 17 III.7.2. Territorial and administrative reform, as well as dldp study on functional areas ................... 17 III.7.3. Findings and proposals of dldp study for FA Durres ................................................................. 18
IV. THE NEW ECONOMY OF DURRES MUNICIPALITY .......................................................................... 23 IV.1. THE ECONOMIC PROFILE OF THE FUNCTIONAL AREA ................................................................................... 23
IV.1.1. General Introduction of FA Durres ........................................................................................... 23 IV.1.2. Number, size, composition and the list of active companies in FA Durres .............................. 24 IV.1.3. Investments in FA Durres ......................................................................................................... 36
IV.2. LABOUR MARKET, EMPLOYMENT, UNEMPLOYMENT RATE ........................................................................... 40 IV.2.1. Education, employment and business needs for qualifications ............................................... 40 IV.2.2. Consultation in the field with 66 enterprises of Durres Region: data on the employees......... 43
IV.3. ECONOMIC INTERACTIONS AND STRATEGIC ECONOMIC SECTORS .................................................................. 46 IV.3.1. Daily moves towards labour centres ........................................................................................ 46 IV.3.2. Processing Industry .................................................................................................................. 48 IV.3.3. Transport & storage ................................................................................................................. 49 IV.3.4. Accommodation & food services ............................................................................................. 50 IV.3.5. Agriculture (with Forestry, and Fisheries) ................................................................................ 51
V. PROFILE OF LOCAL PUBLIC SERVICES ............................................................................................. 58 V.1. WATER SUPPLY / SEWAGE................................................................................................................ 58 V.2. ROADS & PUBLIC TRANSPORT ................................................................................................................ 63 V.3. WASTE MANAGEMENT IN THE FA OF DURRES ................................................................................. 66
V.3.1. At regional level – Regional plan for solid waste management (RPWM) ................................. 67 V.3.2. At local level – local plan for solid waste management (RPWM) ............................................. 71 V.3.3. Porto Romano Landfill .............................................................................................................. 72 V.3.4. Fee collection – family .............................................................................................................. 73 V.3.5. Weaknesses of waste management ......................................................................................... 73
V.4. URBAN PLANNING AND MANAGEMENT OF LAND IN FA DURRES ................................................ 76

4
VI. ORGANIZATION OF LOCAL GOVERNMENT SERVICES IN FA DURRES .............................................. 79 VI.1. PROFILE AND MAIN SERVICES PROVIDED BY LGUS ..................................................................................... 80 VI.2. BUDGET OF LGUS OF THE FA DURRES .................................................................................................... 83 VI.3. DEVELOPMENT AND INTEGRATION STRATEGIES 2014 - 2020 & LOCAL DEVELOPMENT PLAN ....... 88
VI.3.1. Compliance with sectoral strategies 2014-2020...................................................................... 88 VI.3.2. List of strategic plans of the AU ............................................................................................... 89
BIBLIOGRAPHY ................................................................................................................................. 91

5
I. ABSTRACT
The new Municipality of Durres rather than a local unit of the Republic of Albania, is a centre
where economic and social interactions for the whole country are networked and joined. With
85% of active companies, the totality of the administrative centers of main public enterprises at
regional level (and some at country level, such as the Port of Durres or Albanian Railways), and
65% of the population, the administrative unit of Durres (current municipality) is clearly the
dominant unit of the new Municipality, incomparable with the socio-economic strength of the
other five units. As a result Durres is expected to prevail and determine the practical
development of the whole New Municipality.
On the other hand the other five units (Manez, Sukth, Katund i Ri, Rrashbull and Ishem) come
far behind Durres in terms of job (among 11% and 72% of the employees respectively of Ishmi
and Rashbull work in the LU of Durres) public services at the regional level, medical and
education activities (mainly universities). The flux of old-aged citizens from Durres towards
these five units is statistically insignificant.
Regarding the economic development of the New Municipality of Durres, it is de-facto part of
the Metropolitan Zone Tirana - Durres. As such, it is affected directly by national developments,
both of public investments and in attracting foreign investors. The analysis allows us to
understand that the economic structure of the New Municipality of Durres in order to be
consistent, should be oriented toward clusters of enterprises, which are actively affected by the
strategic support policy from the central government (much more than the Municipality). Here
we can focus on a) processing of garment and leather-footwear assisted with public investments
in research, product development & processes and in marketing, distribution and sale; b)
transport logistics with central government assistance in developing and modernizing the legal
context of customs procedures and transport infrastructure; c) agriculture with public assistance
in support of farmers and internationalization of Albanian products.
At country level the New Municipality of Durres is unique in terms of concentration of strategic
projects and respective investments in infrastructure. Among the main ones to be mentioned are
the Blue Highway that runs the Municipality from North to South; Railway development and
connection with Macedonia and Kosovo; Development of the Port of Durres; Industrial Zone
development of Spitalla of 250 ha and employments opportunities of up to 5,000 people, etc. The
amount of investments and number of jobs resulting from these governmental developments, is
significantly higher than it probably can be “created” by the Municipality support only. But
equally important are the possible negative externalities of those projects for the local residents.
Impact of Municipal authorities in determining the profiles of these investments and their
orientation in function of the inhabitants of Durres, will be one of the challenges of the New
Municipality.
Regarding to the public services of the New Municipality, our attention is drawn by two main
groups: direct administrative public services to citizens, such as civil services, and public
services to the context surrounding the citizen, such as waste management, water and sanitation,
etc. In the first case, during 2015-2016 the New Municipality will have as primary challenge
maintaining the quality and network service at the same level at least as before the RAT. This

6
will be conditioned by the effective coverage extension of services throughout the territory.
However the experience and the expertise of the actual Municipality of Durres completed with
the experience and field knowledge of the personnel to other five units are advantages that
should be used wisely to produce success. With the consolidation and modernization of the new
municipal administration, is expected that the efficiency of these services grows.
In general in Albania, we observe that public services like waste management, water and
sanitation (and perhaps road maintenance) are gradually being transferred to separate enterprise
from the local public administration (and even central). The waste case is the most typical. In this
prism it remains the responsibility of local authorities to ensure the maintenance of an acceptable
level of service to citizens with a democratic cost.
However any significant development of the New Municipality of Durres will be conditioned by
implication, dedication and financial support from central government. But the real and
meaningful implication of local actors in all stages of identification, planning, costing, tendering,
implementation, monitoring the initiatives and public policy will be a necessary and essential
condition for a successful Municipality. Furthermore, this approach should not include only the
major LU, that of Durres, but all the active forces spread in Ishem, Rrashbull, Sukth, Katund i Ri
and Manez. Each model imposed from above without the approval of the inhabitants of the New
Municipality of Durres in all its administrative units would create centrifugal forces between the
units of the territory of the New Municipality, and as a result would decrease the effectiveness of
the job of the new local unit.
As a conclusion even if the New Municipality Durres for the moment is obviously dis-balanced
in favour of the city of Durres, this new unit by its geographical location, industrial structure,
human profile and millennial history, offers practical opportunities for a success scenario not
only at national level but also at the international level. The new five units, if they become an
active part of the planning and strategic development of the new Municipality, will offer Durres
the geographical, business and human ability space to be the model municipality of the Republic
of Albania in the XXI century.
The cohesion between six local units and the dedication of the economic units and its inhabitants,
has the potential to make the New Municipality of Durres a national actor, which together with
Tirana Municipality, can direct the development of the territory in the country in the upcoming
years.

7
II. METHODOLOGY
Data gathering was based on the following components:
desk research. Mainly development studies for each of the six LGUs completed with
statistical data (INSTAT data on demography, Ministry of Finance for legal business
entities; NRC for the number of active businesses, Publications of Durres municipality
and the Region for the data on the Region of Durres; National Employment Service for
employment; ShtetiWeb for sectorial policy documents 2014-2020, etc.).
meetings with representatives of all local government units (at least three times in each
unit). These meetings initially served to introduce the project dldp and CDI. They were
based on a preliminary agenda and list of presence. The agenda focused on: a) the present
situation of LGUs; b) the collection of information mainly from the Department of
Taxation, the Department of Development and the Department of Economics / Finance;
c) developing intra-LGU projects and those in preparation influential inter-LGU;
illustrative survey in 62 economic entities of the County of Durres. The aim was to
identify serious trends on the nature of qualifications requested by enterprises in Durres;
meetings with representatives of stakeholders in the development of FA Durres (Albanian
Regions Fund, Regional Development Agency, the Chamber of Commerce of Durres,
University Alexander Moisiu, NGOs active in regional development plans of Durres,
etc.).
The treatment of information resulted in regularization and homogenization of information,
classification, organization and functioning of their logical interconnection. The next step was
the preparation of the analysis structure and the presentation of results.
Methodological problems arise from:
Production of the INSTAT data only at the county level (at commune level or
municipality is extra rare exception);
Non-systematic registering of the closure or businesses in NRC, although in the resulting
tax offices they may result as inactive;
Presentation in the local tax of subjects that own agricultural land and / or urban areas
and their non-registration in NRC and consequently neither in the taxpayers register in
central taxes.
As a result, the figures presented are approximation illustrations that express development trends.
The economic analysis phase has followed these steps:
The preparation of the work plan. Included the identification of the most important local
and national actors, sectors of activity, the problems of amalgamation depending on the
law 115/2014 and the stage of advancement of the law on decentralization, as well as
relevant logistics.
Identification of the sources of information. Data were built by the authors based on data
provided by INSTAT, tax data from LGU's own functional area, from publications and
data from the Ministry of Finance, the NRC, the National Employment Service, from the
interview with 62 economic entity based on a questionnaire, as well as from the
8
individual conversation with the responsible of the sectors of finance, economic
development, tax, municipality and commune leaders, responsible urban planning, etc.
By underlining the differences between these sources of information, our calculations are
supposed to indicate serious trends on a comparative level, rather than absolute
quantitative and data.
Use the nomenclature of classification of economic activities for the classification of data
by the sector of activity (based on NVE REV 2, INSTAT 2014).
Involvement of stakeholders. At this stage we are focused on actors who have
information and direct interest in the analysis of functional area. This includes
municipalities and commune mayors, officials of the ADF, members of the Chamber of
Commerce and Industry Durres, local businessmen, school principals, academic from the
University Alexander Moisiu, etc. At this stage, we have noticed that the city of Durres is
over-represented by civil society actors compared to the other five municipalities. As a
result, we have adapted the access to the forum by postponing it in time, as well as by
adopting the objectives.
The analysis is built on well-functioning and efficiency of FA of Durres. As a result, we are
focused on the modalities of interaction of the units between them, more than in the strategic
development plans of the whole.
Bibliographic references
1. The Functional area approach in the dldp 3 framework. Tirane, June 20th
2014
2. The issue of functional areas in the National Spatial Development Concept 2030 and
Assumptions Partnership Agreement, Magdalena Zagrzejewska
3. Methodological note on the Functional Area Programme

9
III. GENERAL OVERVIEW OF FUNCTIONAL AREA DURRES
III.1. Geographical position & Infrastructure
The Functional Area of Durres (FA Durres) comprises Durres Municipality, including Durres
city. It consists of the Municipality of Manza based in Manez, Municipality of Sukth based in
Sukth, Ishmi commune in its northern extremity based in Likmetaj, Rrashbull commune in its
southern extremity based in Rrashbull, and Katundi i Ri commune with a centre in Katundi i Ri.
The municipality is located between 41 and 36 'to 41 and 15' north latitude and 19 and 15 'to 19
and 38' east latitude. It is extended from the Cape of Rodon in the northwest to Prroi i Agait after
the so-called “Kavaja Rock” in southwest. There is an area of 430 km2, with an average altitude
above sea level of 2-6 meters. Durres city itself occupies the western part of the county of Durres
between the coordinates 41 and 18 ' and 40' 'north latitude to 19 and 26' and 21 ' east longitude
with a surface of 1,626 ha area. The total length of the border is 121.3 km, out of which 52.4 are
land borders, 61.8 sea borders and 7.1 are river borders.
In the western part, Durres is bordering the Adriatic Sea, with a rugged coastline. Land borders
are with Tirana and Kruja district in the east and northeast and with Kavaja district in the south
and southeast. All units, except Manza have access to the sea. Only Kantundi i Ri and Rrashbull
have a direct geographical contact with the Municipality of Durres.
Map 1. Functional Area Durres
The Municipality of Durres (in this study the term New Municipality of Durres and the
Functional Area Durres determine the same territory) has a favourable geographical position and
is located at the junction of major trade routes. Among the main streets are: Durres-Ohrid-

10
Manastir-Sofia-Istanbul, Durres-Elbasan-Korca-Florina-Thessaloniki. Durres has a great
strategic importance. Durres is located on the coasts of the Adriatic Sea, about 33 km in the west
of the capital Tirana. It is located in one of the closest points of the Adriatic Sea, opposite the
Italian ports of Bari (300 km away) and Brindisi. Today, the city spreads out on building
settlements in the east. The country is very low above the sea level in the south bay of Durres.
The distances are 39 km away from Tirana; 30 km from the international airport "Mother
Teresa"; 150 km from the border with Montenegro (Hani Hoti); 243 km from the border with
Kosovo (Morin); 162 km from the border with Macedonia (Qaf Thane) and 184 km from
Tushemisht, and also 178 km away from Bllata.
Durres is the centre of the Albanian railway system. Also, Durres is the most important port in
the country and is connected to Italy by ferry lines Durres - Bari, Durres - Ancona, Durres -
Trieste. It is connected with Slovenia via the ferry line Durres - Kuper. Furthermore Durres is the
starting point of corridor 8, as well as the junction of the most important lines of streets, where
the most important line is Durres - Kukes – Morine, which connects Albania with Kosovo.
The Port of Durres has a total surface of 1.4 km² and an aquarium of 0.67 km². The entrance
channel is 9.5 meters deep, 40 m wide and 1.2 miles long. There are 11 aprons operating in the
port, from 6.6 to 11 m deep and with a length of 2,200 m. The total surface for the storage of
goods is 270,000 m² of which 27,000 m² are covered.
In the port of Durres are charged and deposed all kinds of minerals, fuel, cement and articles of
different categories. Currently, in the port of Durres the number of ferries is doubled compared
to a year ago. In total, there are 40 ferries that connect Durres with other Mediterranean ports,
which are placed every week in this port.
The container terminal is under construction. Besides the quay and the square that are at its
disposal, at the port of Durres, there are also a range of accessories that help in the charging –
deposing process of the terminal containers.
The Port of Porto Romano serves for mooring and deposing tankers that bring hydrocarbons and
gas in the Port’s terminal. Together with Petrolifera, Porto Romano is the largest port for
hydrocarbons in Albania, where are distributed most of the imported products that are consumed
in the country.
III.2. Geological structure and climate
Durres is part of the near Adriatic plain that extends from Lezha to Vlora. Geological
development of the territory of Durres belongs to Pliocene and Quaternary when the near
Adriatic plain began to appear on the water as part of the continent. Sea was finally pulled away.
During this period, in Quaternary, have occurred more processes that have led to the formation
of the anticline and syncline structures. Durres territory consists also of terrigenous sediments
(sandstones, conglomerates, clay, limestone, etc.). In the territory of Durres there are also
alluvial flows. The earthquakes have also influenced in forming the landscape of Durres. The

11
underground resources as coal (mainly in the Municipality of Manza, etc) are also a consequence
of this geological structure.
Durres has a Mediterranean climate. The temperature is from about 5 ° C below zero in January
to about 28 ° C in July and August. June, July and August are the hottest and driest months of the
year. A number of factors such as planetary factors (cosmic) and local ones influence in forming
the climate. The local factors are related to the relief. The most active factor influencing the
climate of Durres is the sea through which is made possible the circulation of the Atlantic and
the Mediterranean air masses. Part of local factors is also the human activity, which in Durres is
expressed by interventioning in natural conditions. Here we can mention the swamp drying, de-
hilly areas, the building of water gatherers or the construction of industrial objects, etc.
The winds are an element of a great geographical and agro meteorological importance for the
western plain. A characteristic wind of Durres is the brisa. During the summer in Durres there
are about 71 days with brisa, and 18 days during the winter. The average annual number is 191
days. In accordance with the weather, brisa starts from 9-10 o'clock in the morning and continues
until 16-18 o’clock in the afternoon. Its average speed in the afternoon is 4-6 m / s. Winds that
blow in Durres are Murrai, Shiroku and Juga. Another element of the climate is cloudiness. The
average number of cloudy days is 89.9 days / year while the one of brighter days is 110.6 days a
year.
III.3. Environmental resources
Air. Based on the monitoring of the first 6 months of 2012 (about 7,500 monitoring) the air
quality in this period in Durres Municipality is problematic, as a result of increased PM.2.5 and
PM10 particles. Contributing factors are: the increasing volume of construction, the raise of dust,
the circulation of vehicles, in certain places, the poor quality of roads, the increasing number of
industries, the poor quality of fuels or their burning waste in containers in the city, but also from
their burning in the landfill area. All these factors constitute a serious threat for the future of air
quality in Durres.
Water. Durres area is rich with shallow underground waters. This is the reason they are also
easily threatened by pollution. Taking into account the Durres pastime as an industrial area in the
period of the communist regime, this pollution is even more disturbing. The shallow
underground waters in Durres area come from Ishmi and Erzeni. These waters have a pH content
of 7 to 9 and are drinkable. Tirana aquifer water is very strong with about 18 -300 dH; the
average level goes from 10 to 200 dH and the maximum is 250 dH. The completion of growing
needs of Durres is thought to be done through new flows from Bovilla of Tirana. This means that
flows in Durres will be doubled from 350 l / s to 700 l / s.
Land. The land in Durres, as we mentioned it above has different characteristics. It contains
farmland, forests and pastures in Manze and Ishem, sandy soil on the sea shore and the land of
industrial and former industrial areas.

12
Seismicity. Durres is considered as the centre of earthquakes in Albania. Acceleration varies
from 0.2g in all territory to 0.3-0.38g in the south and the north west of the country.
III.4. Functional area composition, the administrative unit borders and connections
In accordance with the Law no. 115/2014 "On the administrative and territorial division of local
government units in the Republic of Albania" 31/07/2014, which defines as local government
units (LGU), 61 municipalities and 12 districts. The FA of Durres is part of Durres District and
consists of 6 administrative units (AU): Durres, Sukth Ishem, Katund i Ri, Rrashbull and Manez.
In their composition these AUs include in total 3 towns and 40 villages (as well as six regions
and 14 neighbourhoods of Durres).
Functional Area of Durres (FAD) is composed as follows (and will be referred as such in the
remainder of the document):
• AU Durres: Durres City
• AU Sukth: Sukth City, Hamallaj, Kulle, Perlat, Vadardhe, Rushkull, Hidrovori;
• AU Ishem: Likmetaj, Kertushaj, Kapidanaj, Gjuricaj, Lalez, Kuraten, Bize, Drac, Shetaj;
• AU Katund i Ri: Katund i Ri, Jube, Qerret, Fllake, Bisht-Kamez, Rinia, Erzeni, Sukth, Adriatic;
• AU Rrashbull: Rrashbull, Arapaj, Shenavlash, Shkallnur, Manskuri, Romanat, Bozanxhije,
Xhafzotaj;
• AU Manez: Manez City, Armath, Borc, Hamallaj, Kameras, Rade, Shkalle, Manez Village.
Durres Municipality is divided into six regions which include 14 neighbourhoods. Below is an
overview of the administrative division of the Municipality of Durres (Durres Municipality
consists of the Administrative Unit of Durres in the New Municipality Durres):
Table 1: The administrative division of the Durres Municipality
Region
No 1
Region
No 2
Region
No 3
Region
No 4
Region
No 5
Region
No 6
Surface km2 2.98 1 0.6 10.32 15.8 15.4
Population 28,667 28,737 27,718 53,890 34,999 34,015
Neighbourhoods included in each Administrative Unit or Region are:
• Region 1: quarters 1, 2, 3, 4
• Region 2: quarters 6, 7, 9, 10, 11
• Region 3: quarters 5, 12, 16
• Region 4: quarters 8, 15, 18
• Region 5: quarters 17, 13, 14
• Region 6: neighbourhoods part of Region 5, 4, 3 (newly created)

13
Region 4, 5 and 6 are among the regions that have informal areas with significant surface and
population.
All the AUs are in a more or less favourable distance from the centre of FA, the city of Durres.
The unit with the furthest distance from Durres is Ishem with 37 km. The distance of some others
AUs from the city of Durres is inconsiderable. The infrastructure that connects Sukth and
Rrashbull with Durres city is new, built in the past 10 years, and each of these units has access to
the centre in less than 30 minutes.
The connection of all the new AUs varies depending mainly from the distance from Durres and
the history of trade and human exchanges. The “most distant” units are Ishmi and Manza. In
general, all the units are connected with Durres city through exchanges of decisive nature such as
employment, education and health, and share the same continued territory. Public services such
as waste management, sanitation and drinkable water are also important. Five of them (Durres,
Sukth, Ishem, Katund i Ri, Rrashbull) lie directly on the coast and manage a part of the coast by
sharing common interests in infrastructure, urban, environmental and industrial development
oriented mainly towards tourism, trade, fason and processing industry.
Durres Municipality, as the second biggest in the country (after Tirana) has also areas with
special profile as follows:
a) Area of Porto Romano represents one of the most complex sites of land use of Durres
Municipality. This area was previously used for chemical activity; this makes it a high risk area.
The area also has some important archaeological traces (an ancient wall to protect it). In the near
future this area will become an industrial park. An expansion of low-density settlements, mainly
informal is developed also in this field, to the south. These settlements are identified as priority
areas of urban redevelopment by ALUIZNI, responsible for the legalization of informal
settlements.
b) Rrashbull - This is yet an informal area within the common boundary of Durres in the west,
for which ALUIZNI also has a plan for legalization.
c) The highway axis – Although it is located outside the city and in the inter-connection area of
different levels of highways, this area falls within its administrative boundary. From the first
point of the location, the area has a very strategic value in relation to the development of the
metropolitan axis between Durres and Tirana.
III.5. History, culture, traditions, tourist attractions
The New Municipality of Durres is one of the richest geographical areas in a historical and
cultural perspective. As a gateway in Albania, the city of Durres offers the first experience and
impression of tourists who come to Albania from the sea.
III.5.1. Presentation of history
14
Durres can be compared to the greatest cities of the ancient and medieval Mediterranean. The
city of Epidamn - Dyrrah was built by Illyrians Taulants, in Xlll-XI centuries BC. In the
conditions of a Mediterranean climate, the most appropriate area for housing was that of Erzeni
River and Western plain surrounding it. In the bay coastline of Durres was settled the first centre
or the Liman with the name Dyrrah. According to ancient authors, this city was founded by two
kings with Illyrian origin named Dyrah and Epidamn. At the time of Emperor Anastasius I (491-
519) and Justinian I (527-565), the city suffered significant transformations in its urban structure
by taking the features of a typical Christian-byzantine city.
In XI-XV century, Albanian territories were known by the name of State of Arber. This state,
reached its peak in the period of the reign of Gjergj Kastriot. According to the Ottoman
chroniclers of XVl century, Durres was considered as "The Second Constantinople" and was
occupied and destroyed by the Turkish on 13th
of August 1501. Only in XVll century, the city
began to recover by becoming the centre of the transit trade of the Middle Albania. A group of
patriots headed by Ismail Qemali raised in Durres the Independence flag on 28th
of November
1912. After the Ottoman Empire, the city was under Serb (1913), Austro-Hungarian (1916) and
Italian (1918) occupation.
During the Albanian monarchy (1924-1939) Durres won a new breathlessness and noble
citizenship and made its city a capitalist economic model. On 7 April 1939 the city and its
surroundings were occupied by Italian and German military troops and in November 14, 1944,
Durres was declared free by the Albanian National Liberation Army. During the Socialist period
(1945-1990), the investments belong to certain branches of industry, collectivization of
agriculture, expanding higher education, and establishment of a series of socio-cultural objects.
In the early 90s the democratic system was introduced with lots of problems for the transition
phase, but with prospects for the future. The new system and the economic reforms that were
implemented in Albania and in Durres after 1990s, brought significant transformations in the
economic, social life and in the urban structure throughout the area.
III.5.2. Cultural heritage, museums and ethnographic
Durres is a city with ancient culture, for his own ancient origin. The city has inherited a lot of
values of the past, historical and archaeological centres as the amphitheatre, the Byzantine
Fences, the Venetian Tower, the surrounding Wall of the Castle, the Royal Villa, the Observation
Tower but also the cultural and religious centre of the Basilica in Arapaj ruins, the castle of
Rodon etc.
In Durres, there are plenty of museums and monuments such as the Archaeological Museum, the
Ethnographic Museum, Mujo Ulqinaku Monument, John Lennon Monument, Sabri Tuci
Monument, Orpheus Mosaic etc. The city retains today full trace from the later culture,
contributing also in providing valuable international personalities like Alexander Moisiu, who
was born in Kavaja and was grown up and educated in Durres. The city has consolidated cultural
institutions, like Alexander Moisiu theatre, the Entertainment theatre, folk dances and songs
ensemble which still performs for the public, professional musicians etc. Activities at national
and international level as the Durres International Film Festival, The musical festival of jazz,

15
Poetry contest Poeteka, International Festival of Modern Dancing, Folk and Civic Song
Marathon, Olive Celebration, International Festival of Chamber Music, Summer Book Fair etc,
are organized in Durres also.
The ethnography of Durres, belongs to the culture of Middle Albania, where women dress with
panths and vest, in the head they hold a small scarf decorated with imitation coins, while men
wear trousers, short black woollen jacket or red vest, and in the head they put felt cap with flat
tips. Also the songs and dances belong to the culture and traditions of the Middle Albania.
III.6. Demographic trends
According to the Population and Housing Census of 2011 the total population of Durres County
is 262.785 inhabitants, of which about 203,000 belong to the Durres district and 59.814 belong to
Kruja district. According to this data, this county is ranked the fourth in Albania by the number
of population and like Tirana, is one of the leading destinations for internal migration.
But the 2011 Census data are much lower than those of the Civil Registry (CR). According to it,
in January 2012 the population of the county of Durres results 414.677 (in Durres 336.524
inhabitants and in the district of Kruja 78.153 inhabitants). The big difference between the
resident population and that in CR comes as a result of high immigration that comes mainly from
the city of Durres and surrounding areas. This factor is reflected in a very high frequency of the
representation of the common Albanian-foreign enterprises, located mainly in Durres city (as we
will see later).
Population Census of 2011 identifies a population growth of 9% in this region, mainly in urban
areas. Population in urban areas of the county (municipalities) grew by 56% during this period.
Larger flows are believed to have come from rural areas of the county itself which have shrunk
by 46%, and from northeast mainly situated in the Swamp area, Municipality of Durres.
More specifically, referring to 2011 Census the general population of the FA is 175.110
inhabitants. Gender composition is nearly equal to 87.613 men and 87.497 women. The active
population aged 15-64 interval represents about 68.22% of the total number of residents.
Currently in the Regional Directorate of Employment in Durres (RDED) are registered in total
8.956 unemployed job seekers, of which 4.640 are women. Since the other Employment Centre
of the county is in Kruja (which registers 1,100 unemployed of which 596 are women), RDED
data cannot be dissolved in administrative unit range in the FA of Durres. At the county level,
youth up to 25 years old, constitute 29.5% of unemployed, while 42.6% are unemployed with
secondary education. Employment and professional training will be treated in section IV.2 of the
analysis.
Table 2: Population in the FA Durres
AU Inhabitants
In total Males Females

16
In total 0-14 15-64 65+ In total 0-14 15-64 65+ In total 0-14 15-64 65+
Durres 113,249 21,799 78,528 12,922 56,511 11,467 38,817 6,227 56,738 10,332 39,711 6,695
Sukth 15,966 4,058 10,502 1,379 7,999 2,136 5,178 685 7,967 1,949 5,324 694
Ishem 5,001 1,174 3,229 598 2,487 596 1,598 293 2,514 578 1,631 305
Katund i ri 10,161 2,453 6,715 993 5,071 1,273 3,332 466 5,090 1,180 3,383 527
Rrashbull 24,081 5,700 16,092 2,289 12,194 3,022 8,045 1,127 11,887 2,678 8,047 1,162
Manez 6,652 1,502 4,400 750 3,351 778 2,204 369 3,301 724 2,196 381
In total 175,110 36,686 119,466 18,931 87,613 19,272 59,174 9,167 87,497 17,441 60,292 9,764
Source: INSTAT, Census 2011, Authors calculations
The Municipality of Durres is one of the largest in the country with a surface of 298.3 km2 and a
population of about 219.867 inhabitants, with a density among the highest in the country of
737.3 inhabitants / km². The structure of the population of this local unit is 85% urban and 15%
rural.
The FA of Durres is an area with a very high population density of 681 inhabitants / km². It is
two times higher compared to the national level density of 343 inhabitants / km². Although the
AU of Durres occupies only about 11.24% of the total surface of the FA, it represents about
64.67% of the population of the FA having a significantly higher density. The AU of Ishem
covers about 26.9% of the territory, but has a density of only 55 inhabitants /km².
Table 3: Density of population and the distance of the AU Durres
AU
Population Surface
Km²
Density
Inhabitants /
km2
Distance from
the center of
the FA
Durres 113,249 38.00 2,980.00 0.00
Sukth 15,966 53.00 301.00 14.00
Ishem 5,001 91.00 55.00 37.00
Katund i ri 10,161 54.00 188.00 19.00
Rrashbull 24,081 59.00 408.00 10.00
Manez 6,652 43.25 154.00 15.00
In total 175,110 338.25 681.00
Source: INSTAT, Census 2011, Authors calculations
The average distance of the five AUs from the city of Durres (Durres FA centre) is 19 km, but is
noted that the AU of Ishem, which has a low density of population has at the same time the
largest distance of 37 km from the centre of FA and simultaneously from the services offered
there.
The FA of Durres is visible with a monocentric character. It is noted the existence of a major
regional centre with a strong flow of new residents. The city of Durres, together with its

17
surroundings is very important for the whole area as an economic centre. But, while the regional
centre is very powerful, there are also sub-smaller centres which serve as local centres for the
rural areas surrounding them. In a way, in the FA of Durres are found areas with two types of
specialized centres: the great capital of the region that constitutes the economic & social
epicentre and administrative/cities distributed in the area, where people take some of the utilities
and use local markets. Furthermore, in Durres FA, exchange trends are identified and are
relatively observable among residents of the AU of Katundi i Ri, Rrashbull and Sukth.
III.7. Key features of Durres Functional Area – DLDP approach
III.7.1. The concept of Functional Area
The term "functional area" refers to the notion that space - at any level (municipalities, counties
and so on) - should not be defined by administrative boundaries or historical ones, but should be
based on the basis of inter-actions that occur in that space. This is to show, for example, the way
that is used by its residents or the cooperation that occurs between different government and
economic entities.
The concept of functional area, in the context of the study of DLDP, is used to define a space
where there is an intense and frequent interaction among the residents and institutions for
economic, social, and cultural purposes. The functional area is organized around an urban centre
that has the highest number of population, compared with other centres within the area and has
the ability to provide the full range of public services that a local unit should provide.
At the centre of the functional area concept is placed the citizen and his needs for ongoing
exchanges in the territory that exceed the existing administrative boundaries. Citizens interact
with the state administration, business centres and employment centres providing services,
education and health, and arts and culture. Defined criteria are used to conduct the analysis of
exchanges, highlighting the main poles that support the development in each area. Functional
areas are built on the economic and social structure of the territory and they are identified mainly
through movements for employment, economic potential and value chain (concentration of
businesses); supply of services and network of physical infrastructure. The centres of the
functional areas have greater population and density; they are travel destinations for work
purposes and have businesses concentration and variety of activities.
III.7.2. Territorial and administrative reform, as well as dldp study on functional areas
The study of the FA is not a new methodology, but it is a study that was made and tested in other
countries. This study was conducted between September and December 2013 in five counties:
Diber, Durres, Kukes, Lezha and Shkodra (where will be focused the third phase of DLDP 2014-
2017).

18
The main objective was to identify the LGU (or groups of LGUs) as stable partners which can be
in the centre of regional development dynamics and that can serve as models for delivering
services efficiently.
Since the Albanian government wanted to reduce the number of LGUs, in order to strengthen the
capacities of LGUs and reduce costs, the government agreed to use and customize the Study of
Functional Areas (SFA). The government has recognized the importance of this study and has
chosen the methodology of functional areas as strategic key for undertaking the territorial
reform.
The DLDP study was focused on the analysis of the indicators of interactions as following:
1) Institutional interaction between the local units for public services such as waste management,
water supply, sewage, etc;
2) Economic interaction, including: the number of businesses, economic diversity, mobility of
the workforce, potential of economic development, consumption, quality of life and services;
3) Distance and access to public services such as: health and social services, education, public
transport etc.
4) The number and the density of population
The main findings of the DLDP study include:
i) Identification and description of key geographical patterns of functional areas that exist in five
counties in the study. There were identified three main types of functional areas:
a) Concentric model: important especially for the poorest and most isolated areas, with only a
centre and some few distant LGUs on the suburb, and with little interactions.
b) Polycentric Model - important for the largest districts of Durres and Shkodra, where
smaller centres co-exist with a larger regional centre;
c) Cross-border model - there are areas that are close to national borders, regional or areas
with frequent interaction between these borders.
ii) Using the methodology of functional areas, it becomes possible to identify the new areas with
some LGUs, which would fulfil the needs and demands of citizens in a better way through a
more effective and efficient service management, as a result of a strengthen cooperation between
the existing LGUs or their union.
The concept of functional areas is available and can be functional. However, the approach used
should not be a substitute for democratic decision-making; but the study should be used as a tool
used to facilitate the rational and well informed policy making.
III.7.3. Findings and proposals of dldp study for FA Durres

19
This study classified Durres (together with Shkodra) as polycentric model areas. The main
characteristics of this type of FA include:
• The existence of a major regional centre with a strong flow of new residents. Both cities
Shkodra and Durres are capitals of their respective regions and are very important for the district
and regions as economic centres.
• While the regional centre is very powerful, there are also sub-smaller centres which serve as
centre for their surrounding poor rural areas. Therefore, these areas have two centres: the great
capital of the region but also a smaller city centre of the area where people obtain some of the
services and use local markets.
Accordingly to the territorial reform, the study presents some solutions for the amalgamation of
LGUs in larger units. The study has served to influence the important political decisions i.e.
move toward really great LGUs around the major regional centre or to identify some LGUs with
sub-regional character, choosing thereby the strengthening of smaller cities as respective centres
for the areas surrounding them.
Map 2: Local Government Units of Durres District before the TAR
Source: dldp

20
For the District of Durres, the study identified as the main version the organization in four
functional areas:
1. Three functional areas in Durres with the respective centres: Durres (Durres - Rrashbull);
Shijak (Shijak- Xhafzotaj-Gjepal-Maminas); and Manez (Manez, Sukth, Ishem, Katund i Ri).
2. A functional area in the district of Kruja with the respective centre Fushe Kruja (Kruja, Fushe
Kruja, Cudhi, Koder Thumane).
The study identified, as defining interaction for this proposal, the employment and consumption
patterns, the access to services, especially important for Manez-Sukth axis (both now part of the
New Municipality of Durres). Also, the study identified and discussed other solutions, as
follows:
1) For the Durres District:
• Instead of a FA in Manez-Sukth, there should be two separate areas; one for the group Manez-
Ishem and another one for Sukth-Katund i Ri. Although Sukth is a larger municipality regarding
the population, some of the villages in Sukth receive services in Manez because of its central
location and connectivity.
• Some villages of Katundi i Ri (e.g. Rinia) are closely associated with Durres for all services.
Some villages of Maminas are more closely associated with Manzë than Shijak.
• The villages of Ishmi are associated with Bubqi (mainly traditional villages) also due to an
improved road connection.
2) For Kruja District:
• The demographic and economic trends define the centre of the functional area in the town of
Fushe Kruja while traditionally and administratively (and also historically) the town of Kruja can
be the centre of the FA.
• The commune of Bubq is associated with Ishmi but also (economically) with Vora municipality
in Tirana region.
• The commune of Nikel is part of a functional area with centre in Kamez, Tirana district.
Map 3: Functional areas of Durres District proposed by the study of dldp

21
Source: dldp
DLDP study results (as well as those of the study of "ShtetiWeb" on the new administrative and
territorial division) were consulted and compared by the group of experts of STAR project
(funded by the governments of the United States of America, Sweden, Switzerland, Italy and
UNDP) for the administrative and territorial reform in accordance with the methodology
developed under the criteria adopted by the Parliamentary Committee for the Territorial Reform.
The proposal of the Minister of State for local government based on these studies and
consultations on this territorial division and the territorial division of Durres District under the
Law no. 115/2014 "On the administrative and territorial division of local government units in
the Republic of Albania" 31/07/2014 is presented in the table below:
Table 4: The territorial division of Durres District according to TAR
Proposal of DLDP The proposal of the Minister
of Local Affairs
Law no. 115/2014
1 Durres
District
FA Durres, 2 existing units:
Durres Municipality
The commune of
Rrashbull
FA Durres, with center Durres
Municipality, 5 existing unit :
Durres Municipality
Sukth Municipality
The commune of
Ishem
The commune of
Katund i ri
The commune of
FA Durres, center city Durres,
6 AU
Durres
Sukth
Ishem
Katund i ri
Rrashbull
Manez

22
Rrashbull
2 FA Shijak, 4 existing units:
Shijak Municipality
The commune of
Xhafzotaj
The commune of Gjepa
The commune of
Maminas
FA Shijak, with center Shijak
Municipality, 5 existing unit
Shijak Municipality,
Manez Municipality
Commune of
Xhafzotaj,
Commune of
Gjepalaj
Commune of
Maminas
FA Shijak, center city Shijak,
4 AU:
Shijak,
Maminas
Xhafzotaj
Gjepalaj
3 FA Manz, 4 existing units:
Manez Municipality,
Sukth Municipality,
The commune of Ishëm,
The commune of Katund i
Ri
4 Kruje
District
FA Kruje, center Kruje
Municipality, 6 existing units:
Kruje Municipality,
Fushe-Kruje
Municipality,
The commune of
Thumane,
The commune of Nikel,
The commune of Cudhi
The commune of Bubq
FA Kruje, center Kruje
Municipality, 6 existing units:
Kruje Municipality,
Fushë-Krujë
Municipality,
The commune of
Thumane,
The commune of
Nikel,
The commune of
Cudhi
The commune of
Bubq
FA Kruje, city center Kruje, 6
AUs:
Kruje,
Fushe-Kruje
Thumane,
Nikel,
Cudhi
Bubq
Source: Law No. 115/2014 "On the administrative and territorial division of local government units in the Republic
of Albania", 31.07.2014
As it is noted, the division approved by law gathers now in a single unite, two Functional Areas
initially proposed by DLDP study. The AU of Manez becomes part of FA of Durres, comparing
to the proposal of the government,

23
IV. THE NEW ECONOMY OF DURRES MUNICIPALITY
IV.1. The economic profile of the functional area
Following Tirana, Durres is the second most important economic area in the country for the
economic activity. According to the data of the Enterprises Register in 2013, INSTAT, Durres
Region had at the end of 2013, a total of 10.599 active entities concentrated in the sectors:
• Producers of services: 8.655 entities, representing 81.6%;
• Trade: 4.304 entities, or 35.9%,
• Producers of goods: 1.944 entities, or 18.4%.
Table 5: The most important economic sectors – Economic Unit (EU)/AU
Processing Industry Wholesale trade /
Retail / Repair etc
Transportation /
Storage
Accommodation /
Food Service
Public
Administration /
Security / etc
Ave
rag
e of
em
plo
yees
/
EU
no of
EU
%
ref.
the
total
of
EU
no. of
emplo
yees
no of
EU
%
ref.
the
total
of
EU
no. of
emplo
yees
no of
EU
%
ref.
the
total
of
EU
no.
of
empl
oyees
no of
EU
%
ref.
the
total
of
EU
no of
EU
no of
EU
%
ref.
the
total
of
EU
no.
of
empl
oyees
Durres 403 9,2 7626 1 702 38,7 5261 372 8,5 3330 543 12,3 1482 30 0,7 2040 6
Ishem 5 10,0 20 20 38,0 33 5 10,0 5 12 23,0 13 1 2,0 79 4
KiR 8 12,7 30 27 42,9 82 11 17,5 11 7 11,1 11 2 3,2 106 5
Manze 11 12,6 15 36 41,4 75 11 12,3 14 9 10,3 11 1 1,1 48 2
Rrashbull 41 12,2 381 148 44,2 263 25 7,5 42 66 19,7 155 2 0,6 63 3
Sukth 34 14,8 226 112 48,7 287 20 8,7 26 28 12,2 40 1 0,4 120 4
In Total 502 8298 2 045 6001 444 3428 665 1712 37 2456
Average/
sector 16,53 2,93 7,72 2,57 66,38
Source: Taxes, LGUs, Calculations of the authors
From this table, we can notice that the Wholesale trade / Retail / Repair etc. has the greatest
number of the EU (Economic Units) but with the lowest average of employees per economic
unit. The public administration has the highest number of employees per organization. This
should be taken into consideration during the amalgamation and restructuring of the LGUs as a
result of the reform.
IV.1.1. General Introduction of FA Durres
Although with favourable geographical position and early commercial and tourism tradition,
Durres district has a poverty level higher than the national average. According to LSMS 2012,

24
Durres region marks a poverty level of 16.2%, with depth of 3.3% and rigor of 1.1%, while
average levels of these indicators in the country are 14.3%, 2, 9% and 1%. This phenomenon is a
consequence of large differences in development between the richest municipalities and the
communes entirely undeveloped.
Average income per capita in the LGUs of Durres region is about 54 Euros ( in 2011), compared
to 68 Euro at the country level. Kruje and Fushe Kruje have the highest income per capita (about
70 Euro/capita), and Bubq has the lowest (about 38 Euro/capita). Almost the same trend is
observed in the distribution of local expenditures per resident. The region has a homogenous
ethnic population, without ethnic minorities clearly configured.
Table 6: Active enterprises by sectors in Durres Region
In
total
Produ
cers of
goods
Agricul
ture,
forestr
y,
fishing
Indu
stry
Constru
ction
Pr
oduc
ers
of
good
s
Tra
de
Transpor
tation
and
storage
Accommo
dation
and
gastrono
my
Informati
on and
communi
cation
Othe
r
servi
ces
In
tot
al
1059
9
1 944 209 1 148 587 8655 430
4
820 1 660 166 1705
In
%
100 18.4 2 12.2 4.2 81.6 35.
9
14.8 15.3 1.4 14.2
Source: INSTAT, Registry of the enterprises 2013
IV.1.2. Number, size, composition and the list of active companies in FA Durres
The number of economic units (EU) in the region of Durres, created in 2013 is 1,088. In 2013
there were 7987 entities registered as physical persons (or 75.35%) and 2,612 entities registered
as legal persons.
Regarding ownership, the region of Durres counts 10,075 Albanian entities, 524 shared entities
(foreign and Albanian) and 321 foreign entities. After the region of Tirana, Durres region has
significantly the highest number of concentration of companies with shared ownership. In this
point of view it is noticed the clear dominance of collaborations with Italian and Kosovo
companies.
Table 7: The number of EUs registered in Durres region with common ownership
States
The number
of economic
units
Italy 309

25
Greece 30
Turkey 26
Kosovo 61
Macedonia 10
Germany 27
USA 8
United Kingdom 4
Austria C
The People’s Republic of
China 5
Others 43
In total 524
Source: INSTAT, Registry of the enterprises 2013
Referring to INSTAT data, it is noted that 89.5% of enterprises are small economic units
employing 1-4 people and only 1.4% of economic units employ over 50 people.
Table 8: No. of enterprises according to no. of employees in the Durres FA
Number of employees
1-4 5-9 10-49 50+
Number of
enterprises 9,485 505 461 151
Source: INSTAT, Registry of the enterprises 2013
According to the data from the Tax Offices of some AU of the FA of Durres, as well as the
calculations of some authors, for the fiscal year of 2013, in the FA of Durres, the results show as
active around 5,168 entities that employ 30,403 workers. About 85% of active entities of the FA
develop their activity in Durres and the rest in the other five AUds (varying by 1-7% per AU). In
the AUs like Ishem and Katund i Ri (only 1%), it is observed almost the non-existence of active
entities compared to other similar units.
Below is a description of each administrative unit under the perspective of the economic activity.
Municipality of Durres (before TAR)
In December 2013, the City of Durres counted 4.401 entities in which are employed 27.737
employees. The sector in which are employed the majority of employees, 7.626 people, (or
27.5% of the total number of the workers employed in this AU) is the Processing Industry with

26
about 403 entities. "Wholesale and retail trade and repair of vehicles and motorcycles" is the
second sector that includes 1,702 entities (or 38.7% of the total number of registered entities in
this AU) and 5,261 employees (or 19.0% of employees). About 12.0% of employees (or 3,330
employees) in the AU of Durres deal with transport and storage in 372 entities (or 8.5%) of this
kind. Table 9: Enterpises in the municipality/AU Durres with more than 150 employees
Albanian Railway Freightage, passenger transport, charge, depose
Hospital Durres Health service.
Sh. a. Water and sewage
Durres
Deposit, treatment and distribution of water
Kastrati Retail trade of other products in specialized stores
University "Aleksander
Moisiu"
Teaching
Stella Manufacturing and trade of confections for themselves as well as for third parties,
import and export of products in
Durres Portual Authority Activities associated with the processing of goods and passengers
Ambra Manufacturing and trade of confections in general for men, women and children, in
stofra or synthetic,
Pespa & Albania alumin Aluminum production, import - export
Derrigal The society has as an exclusive object the activity of shoe manufacturing
Confezione Mar The production of different clothing for all ages, import of first materials needed in
the markets
Intimoda The production and trade of clothes on their behalf or of the third parties. import,
export
Durres Municipality Services
Alban Del Manufacturing of footwear and leather products, synthetic materials, basic
materials
Calling Group Providing telephone services for the third parties and for themselves and in
particular telephone sales, Telemark
Arus Production for their own account or for third parties for finished footwear or their
parts, bags, belts
Coral Activities in the construction area, bar and restaurant, investor, marketing and
fishing. product processing
Eco market food Activities in the field of production, storage, and marketing of products, dairy and
agricultural foods
Source: taxes administration, National Employment Service, calculations of the authors

27
Source: Taxes, NES, INSTAT, Calculations of the Authors
Municipality / Administrative Unit of Sukth
0,00
20,00
40,00
60,00
80,00
100,00
Graph. 1. Structure in % of employees in the processing industry by its
subsidiaries - Municipality of Durres (before TAR)
Other unclassified industries
Manufacture of electrical equipment
Manufacture of beverages
Repair and installation of machinery and equipment
Manufacture of articles of paper and paperboard
Manufacture of wood and of products of wood and cork,
except furniture; manufacture of articles of straw and
plaiting materialsMetallurgy
Manufacture of textiles
Manufacture of paper and paper products
Manufacture of machinery and equipment
Manufacture of furniture
Manufacture of chemicals and chemical products
Manufacture of other non-metallic mineral products
Manufacture of rubber and plastic products
Manufacture of fabricated metal products, except
machinery and equipment
Manufacture of food products

28
In the AU of Sukth, there are about 230 subjects exercising their activity. The sector in which are
active almost half of the subjects (112 subjects or 48.7% of them) it is wholesale trade and retail
trade and repair of vehicles and motorcycles. 34 entities (or 14.8%) belong to the processing
industry which employs 226 workers. In this unit, 12.2% of the total numbers of active entities
work in the area of accommodation and food service.
Map 4. Municipality / Administrative Unit Sukth
Source:. Instatgis
Table 10: The main enterprises in the Municipality / Administrative Unit Sukth
Kastrati sh.a
Creation, installation and utilization of plants, stations, units, lines for
trade
G. I. G.
Shoe Trade, clothing manufacturer of plastic footwear, sewing for
themselves and third parties, import-export
KAPPA - OIL Import and export, marketing of lubricating oils. Source: Taxes, NES, Calculations of the Authors
Graph. 2. Structure of employees in the processing industry by its subsidiaries, in Sukth
Commune

29
Source: Taxes, NES, INSTAT, Calculations of the Authors
Commune / Administrative Unit Ishem
In the AU of Ishem, about 40% of the employees in the unit level work for the public
administration and security & compulsory social insurance. 17% of employees (or 33%) work in
wholesale and retail trade sector. Repair of vehicles and motorcycles is represented by 20
entities (or 38% of those who are active in this unit). The third sector that employs the largest
numbers of employees in this AU is Health and social work activities with 79 employees (or
14% of the total).
Map 5. Commune / Administrative Unit Ishem
0,0
20,0
40,0
60,0
80,0
100,0 Repair and installation of machinery andequipment
Manufacture of furniture
Manufacture of wood and of products of woodand cork, except furniture; manufacture ofarticles of straw and plaiting materialsManufacture of beverages
Manufacture of wearing apparel
Manufacture of articles of paper and paperboard
Manufacture of other non-metallic mineralproducts

30
Source:. Instatgis
Graph.3. Structure in% of employees in the processing industry by its subsidiaries, in
Ishem Commune
Source: Taxes, NES, INSTAT, Calculations of the Authors
Table 11. The main enterprises in the Commune / Administrative Unit Ishem
RROTULL-BETON
Production and wholesale and retail trade of concrete, their products,
trade of lime, building materials
ECO ALBA GROUP
Handling, transport, trade, intercession without obstacle, collection
and waste digestion Source: Taxes, NES, Calculations of the Authors
Katund i Ri Commune
As in the AU of Ishem, in the AU of Katund i RI, the sector comprising the largest number of
employees is public administration and security, and compulsory social insurance. Of the 308
employees in this AU, 106 of them (or 34.4%) are included in this field. In the sector "Wholesale
0
10
20
30
40
50
60
70
80
90
100
Manufacture of wood and of products of woodand cork, except furniture; manufacture ofarticles of straw and plaiting materials
Manufacture of beverages
Manufacture of food products

31
and retail trade and repair of vehicles and motorcycles" are included 26.6% of employees (or 82
employees) in 27 economic units (or 42.9% of the total number of registered entities in this AU).
Map 6. Commune/ Administrative Unit Katundi i Ri
Source: Instatgis
Characteristic for KiR is the volume of municipal revenues from the tax on land value in a
proportional order from the depositing enterprises and the trading of hydrocarbons, located in the
Porto Romano area (within the boundary of KiR). Here we can mention, Kastrati ShA, Romano
Port ShA, Inter Gaz ShA, Europetrol Durres, Albania - Elda ShA, Prima Gas ShA, Genklaudis
ShA, etc.
Table 12: The main enterprises in the Commune / Administrative Unit Katund i Ri
Diambe
Retail trade in non-specialized stores, where mainly is sold food,
beverages and tobacco, etc.
Health center Katundi
i Ri Primary health center.
Elezi brothers
construction Arusha Construction.
Sadiku Company 2011
Production and installation of metal structures and others. Projections
and electrical works, hydraulic etc. Source: Taxes, NES, Calculations of the Authors
Graph. 4. Structure in% of employees in the processing industry by its subsidiaries,
in Katund i Ri Commune

32
Source: Taxes, NES, INSTAT, Calculations of the Authors
Commune / Administrative Unit Rrashbull
Although with a large margin, the AU of Rrashbull occupies the second place after AU of Durres
regarding the number of entities (7% of the total) and of the employees (4% of the total)
registered. The population of the commune has increased from 11,000 in 1991 to 28,000
inhabitants in 2011.
Map 7. Commune / Administrative Unit Rrashbull
0,0
10,0
20,0
30,0
40,0
50,0
60,0
70,0
80,0
90,0
100,0
Manufacture of wearing apparel
Manufacture of paper and paper products
Manufacture of rubber and plastic products
Manufacture of textiles
Manufacture of food products
Manufacture of fabricated metal products,except machinery and equipment

33
Source: Instatgis
In December 2013, in the territory of AU of Rrashbull, 335 subjects with about 1,442 employees
exercised their activity. Most of the subjects, 44.2% are in the sector of Wholesale and retail
trade; Repair of vehicles and motorcycles and cover about 23.0% of the employees. Meanwhile,
33.4% (or 381 employees) of the total number of employees in this AU, are active in the
Processing industry, represented with 41 economic units (or 12.2% of active entities in the unit).
The third sector on the number of employees is Food accommodation and service with 13.6% of
employees (or 155 entities) in 66 entities (or 19.7% of the total).
Graph. 5. Structure in% of employees in the processing industry by its subsidiaries, in
Rrashbull Commune

34
Source: Taxes, NES, INSTAT, Calculations of the Authors
Table 13: The main enterprises in the Commune / Administrative Unit Rrashbull
ME-2008-import-export Import-Export, sewing and various leather products with ordered material etc.
Unieuro shpk
Import-export, wholesale and retail trade of various items, sale and manufacture of
confectioner
Premier system
Import-export, production, wholesale and retail trade of various goods; spedition;
transportation activities, etc.
Alpen pulito
Health and hygiene service (washing facade, flooring, commercial facilities, public
and non public, industrial
Beverages Canteen Skenderbeg Production of distilled alcoholic beverages
Source: Taxes, NES, calculations of the authors
Municipality / Administrative Unit MANEZ
A total of 87 subjects with 210 employees were active in the AU of Manez in December 2013.
Even in this AU Wholesale and retail trade; Repair of vehicles and motorcycles is the sector that
employs the majority of employed, 35.7% (or 75 employees) in 36 economic units representing
41.4% of the total number of active entities in this AU. Public administration and security;
0,0
10,0
20,0
30,0
40,0
50,0
60,0
70,0
80,0
90,0
100,0
Repair and installation of machinery and equipment
Other unclassified industries
Manufacture of chemicals and chemical products
Manufacture of rubber and plastic products
Manufacture of fabricated metal products, exceptmachinery and equipment
Manufacture of other non-metallic mineral products
Manufacture of furniture
Manufacture of wood and of products of wood and cork,except furniture; manufacture of articles of straw andplaiting materialsManufacture of food products
Manufacture of beverages
Manufacture of paper and paper products

35
Compulsory social security counts 48 employees (or 22.9%). Health and activities of social work
have 28 employees (or 13.3%) distributed in four enterprises.
Map 8. Municipality / Administrative Unit Manez
Source: Instatgis
Graph. 6. Structure in% of employees in the processing industry by its subsidiaries, in
Manez Commune

36
Source: Taxes, NES, INSTAT, Calculations of the Authors
Table 14: The main enterprises in the Municipality / Administrative Unit Manez
M2R
Production and trade of products of different materials. Inclusion of
metallic materials, etc.
KURTI UNIBLLOK
Import-export of various technologies of construction of equipments
and of their spare parts, etc. Source: Taxes, NES, Calculations of the Authors
IV.1.3. Investments in FA Durres
The FA of Durres has been historically one of the main beneficiaries of central government
funds and / or donors. However a more focused overview in the delivery of the projects and
consequently of the funds shows a concentration of them in the Municipality of Durres.
Public investments - Albanian Development Fund. During the period 1993 - 2010, the region of
Durres has been supported by the Albanian Development Fund (ADF) with 90 projects with a
total value of 1.87 bn ALL, of which 36% on water supply / sanitation and 47% on roads, as
follows:
Table 15: Projects supported by ADF for the year 2013-2014 in Durres district
Durres District
1 Durres. M
The road parallel to the port
surrounding wall 327,510,302 239,987,904 8%
0
10
20
30
40
50
60
70
80
90
100 Manufacture of fabricated metal products,except machinery and equipment
Manufacture of articles of paper and paperboard
Manufacture of wood and of products of woodand cork, except furniture; manufacture ofarticles of straw and plaiting materialsManufacture of beverages
Manufacture of furniture
Manufacture of food products

37
2 Durres .M
Requalification of the square
"Illyria" 165,484,000 155,752,642 13%
3 Durres. M
Realization of bicycle lanes,
lighting and greenness of the road
“Independence” 204,528,312 201,483,642 33%
4
Fushe Kruje
Municipality
Reconstruction of the road
Durres, Fushe Kruje 134,044,874 105,634,674 16%
5
Durres
Municipality
Reconstruction of overpasses in
Plepa and Dajlani Bridge 137,000,000 0 3%
6
Durres
Municipality
Requalification of the joints entry
of Durres city, etc. 67,304,912
7
Kruje
Municipality
The road "Kalaja", Kruje,
systemizing and lighting of the
mountain road, Kruje 16,094,040 0 2%
8
Durres
Municipality
Reconstruction of the road Ere
Pranvere 50,343,125
Approved in
decision 16,
10/10/2014
9
Durres
Municipality
Reconstruction of the road
Sulejman Pitarka 37,743,174
Approved in
decision 16 ,
10/10/2014
10
Durres
Municipality
Reconstruction of the road Porto
Roman 50,182,409
Approved in
decision 16 ,
10/10/2014
11
Durres
Municipality
Reconstruction of the road
Pelumbari 8,197,273
Approved in
decision 16
10/10/2014
12
Durres
Municipality
Reconstruction of the road Durres
Ndershekuj 10,640,546
Approved in
decision 16 ,
10/10/2014
13
Durres
Municipality
Reconstruction of the road Tasim
Kellici 50,182,409
Approved in
decision 16 ,
10/10/2014
14
Durres
Municipality Reconstruction of the road Juba 50,547,553
Approved in
decision 16 ,
10/10/2014
15
Durres
Municipality
Reconstruction of the road
Jezerca 50,394,370
Approved in
decision 16 ,
10/10/2014
16
Durres
Municipality
Reconstruction of the road Rinia
Durresake 48,105,455
Approved in
decision 16 ,
10/10/2014
17
Durres
Municipality
Reconstruction of the road
Bajram Curri 43,661,461
Approved in
decision 16 ,
10/10/2014
The Total of Durres District 1,451,964,215 702,858,862
Source: Albanian Development Fund
As it can be seen, the majority of projects are generated by Durres Municipality which has also
been the main beneficiary. As a result the union of the other five units with this Municipality will
give them the opportunity to benefit from the experience and expertise of Durres Municipality to
prepare and implement projects.
Table 16: Projects supported by the ADF program "Secondary and Local Roads" for 2013
in Durres District
No. The project The funding institution

38
1. Asphalting of the road “Shetaj - Kisha e Skenderbeut” ( 4.5 km) IDA SLRP & GoA (SLRP)
2. Reconstruction of the road " Shijak -Gjepale" (6.3 km) OFID (OPEC) II (SLRP)
3. Reconstruction of the road " Thumane -Lac " (10.54 km) OFID (OPEC) II (SLRP)
4. Reconstruction of the road “Shijak –Maminas” (5 km) CEB (SLRP)
5. Reconstruction of the road “Bubq – Ishem”(13.4 Km) CEB (SLRP)
6. Reconstruction of the road “Xhafzotaj – Bregdet” BE / IPA 2008
7. Reconstruction of the road " Armath -Hamallaj -Hidrovor " (5.1 km) EBRD & EIB(SLRP)
8. Reconstruction of the road " Shen Vlash ‐Kryqezimi Fllake , 3.5 km" and
the Cross Fllake - Katund i Ri, 9.3 km"
EBRD & EIB(SLRP)
9. Reconstruction of the road " Fushe Kruje -By pass" ( 2.8 km) EBRD & EIB(SLRP)
10. Reconstruction of the road “Kruje –Qafshtame” (18.11 km) EBRD & EIB(SLRP)
Public investments - Albanian Regional Fund (ARF). Durres is also supported by the ARF.
The unification of ADF and ARF disbursement and contracting procedures achieved at the end
of 2014 in the 2015 Budget Law will concentrate public investmentS in the new Municipalities
and will increase the efficiency of central funds. Projects supported by the ARF in the period
2008 - 2012 are as follows:
The beneficiary THE PROJECT
The value of the
contract
(ALL)
2012
Sh.A. Water Supply.Durres "The supply of drinking water of the village Shenavlash (Highway
Line - village Shenavlash) 20 603 413
Sh.A. Water Supply.Durres Wastewater system, Neighborhood no. 14, Shkozet 19 382 958
Sh.A. Water Supply.Durres Paving a new water supply line in Rashbull, the area near the school
Shkallnur 18 607 256
Sh.A. Water Supply.Durres Improvement of water supply, Spitalle area Porto - Romano 38 345 926
2010-2011
Durres, Sha.a Water Supply Improving water supply, Neighborhood 14, Nishtulle area, Durres 49 865 000
2008-2009
Municipality Manez, Durres Improvement of water supply, Shkalle village 35 483 000
Commune Rrashbull, Durres Study drilling in Shenavlash village 2 575 000
Commune Ishem, Durres Reconstruction of the water supply of villages Lalez, Bizet, Drac,
Shete and Rrotull 33 230 000
Commune Katund i Ri,
Durres
Reconstruction, replacement of pipeline DN 250 mm for water supply
of villages Qerret, Bisht Kamez, Fllak, Adriatic, Rinia 19 062 000
Municipality Manez, Durres Improvement of water supply, Kuçok village 7 928 000
Public investments – (Old) Durres Municipality. Regarding internal and foreign investments, it
is worth mentioning the strategic projects of the Municipality of Durres for the period 2014 -
2018, which are:
• "Doing Business", aims to increase the competitiveness and private investment in the territory
of the Municipality of Durres. It consists in reducing the costs and the time required for the

39
implementation of administrative procedures that are related to businesses, and improving the
capacities of local government bodies to manage all the administrative procedures.
• "e-government" is a project that has involved public and private sector in the city of Durres. It
consists in the installation and management of the accounting system that creates a system of
local tax management and improves the service from the citizen perspective in a "One-Stop-
Shop".
• Industrial Area. Support of the industrial park with proper infrastructure and services that have
to do with light and fason industry, but not with industry that affects the progress of the tourism
in the city as its main economic orientation.
• Integration Platform of the City with the Port. Durres Municipality will encourage integration
between the city and the port through the improvement of governance and implementation of
physical and management interventions.
• MARINA, promoter of local development. Referring to a sustainable development of the Marina
in the Mediterranean, it has a major impact on local and regional development and is responsible
for creating a successful and sustainable model. MARINA has a huge impact on the economy of
the locality and its residents. European voyage is organized as a community, and Marina Durres
will be part of the international maritime tourism.
• Coordination with port authorities. Establishment of a permanent consolidated round table
between the port authorities, administrative institutions, open to public participation to develop
and consolidate better governance of the relationship between the city and the port.
• Development of Shkozet Area. Promotion of an integrated development of equipment and
services related to logistics and transport functions.
• Support to Small and Medium Enterprises (SMEs). Support and placement of SMEs through
technical assistance measures (training centres, facilities, information technology, business
incubators)
• Commercial space. Obtaining the commercial zones and business centres.
• Information Technology in the service of business. Development of information technology.
The creation of the necessary infrastructure for the extension of telephone and computer
networks from different operators.
• Business Incubators. Within the Industrial Park and the area of Shkozet, business incubators
will be developed, in cooperation with the University of Durres.
• Integrating the industrial area with the urban one. The promotion of physical and functional
integration between the existing informal residential settlements and new industrial park;
• "The new library of the city ". It will function as a multifunctional centre with cinema, library
and vocational training centres. This library will serve as an important cultural centre of the city.
Public investments - Public Enterprises
The government is implementing the detailed project of the railway line Tirana-Rinas-Durres
including the airport of Rinas. Priority is being associated with quality service and with a much
higher speed than the actual one in the current segment Tirana-Rinas and Durres for passengers
and goods. Another development is the revitalization of the line Durres-Montenegro by
increasing its quality, as well as the establishment of connection with Macedonia. Of course,
there are also other important projects regarding the connection of economic zones that elaborate
high volumes, like in the case of hydrocarbons areas (where Porto Romano takes a special
importance).

40
The Investment Project in the Water Sector (EUR 65.5 mln) that has just been signed, aims
the improvement of the quality of service in the field of water and sanitation of Water and
Sewerage Company of Durres (NUKD) and the improvement of the financial performance. The
main components are Water Supply, Sewage and Institutional Development of the Water Supply
and Sewage Company.
Private investment - construction sector
During 2013, Durres has been the city that issued the highest number of building permits with
25% of the total or 91 permits issued. But according to data from the Association of
Constructors, only the area of the beach, counts over 2,000 unsold apartments. In this area there
was a thoughtless and very aggressive investment in the construction of apartments. Today, the
investors are not selling in this area, but the first buyers have put on sale their apartments, most
of them immigrants who had invested time ago on buying a second house and who already see
these apartments as ineffective.
IV.2. Labour market, employment, unemployment rate
By the end of 2013, in the six units of the FA of Durres were employed about 35,000 people, of
which only 4/5 only in Durres Municipality. Rrashbull was ranked down with 5.7% and Ishmi
ranked the last with 0.6%.
The public sector (counting only the administration and not including public state enterprises)
consist of about 6,100 people, or 20% of all employees. The following table gives a summary
overview of the administrations' distribution of employees in each of the units.
Table 18: Distribution of administration employees for Administrative Unit
Category / AU
Durres
Munici
pality
Ishem KiR Manez Rrashbull Sukth In Total
Public Administration (Administrative and Support
Services / Public administration and
security, Compulsory social
security / Education / Health and
social work activities)
5 575 118 137 77 100 157 6 164
In % of the total of FA Durres 90,44% 1,91% 2,22% 1,25% 1,62% 2,55% 100,00%
Source: Taxes, LGUs and calculations of the authors
IV.2.1. Education, employment and business needs for qualifications
The scale of the educational level in the AU of the FA of Durres is quite significant. Although
the Municipality of Durres has the lowest percentage level of primary education level and 8 (or

41
9) year school system with 42.45%, it has the highest level for secondary education - 38.8%. The
percentage for undergraduate and postgraduate in Durres municipality is five times higher than
other LGUs of the FA. It is assumed that the anomaly of primary level is affected by poor
populations of the Swamp Area.
Table 19: The level of education for LGUs Indicator (in%) / Local Unit Durres KiR Rrashbull Sukth Ishem Manez
Educational level completed: Primary and 8
or 9 year system 42,45 69,82 64,63 71,32 72,09 67,48
Educational level completed: secondary 38,8 22,5 26,7 21,3 18,2 23,7
Educational level completed, university and
postgraduate 15,4 3,2 5,3 3 3,3 4
Illiteracy rate 1,8 2,8 2,2 2,5 4,6 3,3
Source: Instatgis and calculations of the authors
Regarding the impact of education in employment, it is interesting to note the fact that while in
the urban municipality of Durres the rate is 45.4% for the professional secondary level, it comes
down to less than a third in municipalities and communes less urbanized and with less industry &
services. Whereas the employment rate for the primary education level and 8 (or 9) year school
system is inversely proportional to the level of industrialization and concentration of enterprises
per AU.
Table 20: Employment by education level Indicator (in%) / Local Unit Durres KiR Rrashbull Sukth Ishem Manez
Employment by education level: Primary and
8/9 year school system 27,49 60,68 55,17 62,63 53,02 60,13
Employment by level of education:
secondary and vocational 45,4 31,98 34,79 29,78 31,43 31,64
Employment by level of education:
university 26,6 6,2 9,7 6,4 14,5 7,8
Source: Instatgis and calculations of the authors
The concentration in the Municipality of Durres of the institutions and decentralized agencies
with regional (including health), and of a series of secondary and high education institutions
contributes in a relatively high level of employment of university graduates.
Table 21: Institutional Education & Health Distribution
Local Unit
High
Schools
(number)
Health
Center and
ambulance
(number)
3 16 17

42
Durres 21 12
Manez 1 9
Ishem 1 12
Katund i Ri 1 9
Sukth 1 7
Rashbull 4 9
The relation between the level of education and employment per sector is confirmed by further
distribution of the level of employment per sector of activity. Although services provide the
highest percentage of employment (with Durres Municipality which holds the record of 68.46%)
we notice that agriculture provides most of the jobs for Sukth, Ishmi and up to half of jobs in the
case of Manez Municipality).
Table 22: The rate of employment by economic branch and LGUs Indicator (in%) / Local Unit Durres KiR Rrashbull Sukth Ishem Manez
Employment by economic sectors:
agriculture 2,5 23,4 20,9 26,3 31,6 53,5
Employment by economic sectors: industry 29 24,8 35 26,8 17,1 16
Employment by economic sectors: services 68,46 51,85 44,11 46,84 51,3 30,51
Source: Instatgis and calculations of the authors
In 2014, Durres Regional Employment Directorate has announced 4.329 employment offers,
where offers in the processing industry and services prevail. It is very interesting to note the fact
that for 1,809 job offers in the service sector (mainly in call centres and processing industry with
requested goods - fason) there were no suitable candidates.
In Durres city, there are 3.375 employees or 87.93% of the total number of employees of the five
AUs that travel every day to the employment centres. At the same time, it is noted that the largest
concentration of employees that do not have to travel to get to work is in the town of Durres.
Over 90% of employees of this city work in the city where they live in.
As it is noted from the published offers by the Employment Service, the largest number of jobs is
in the fason activities, mainly confection and shoe sewing. Also, it is noted that some big amount
of job offers cannot be filled.
Table 23: Declared and fulfilled job vacancies
Main
activities
No.
vacancies
Filled
vacancies
Confection 1310 750
Sewing vamp 1179 731
Other processing
Ind.
764 461
Services 2080 1309
In total 5333 3251 Source: Regional Directorate of NES, calculations of the authors

43
Some of the main reasons for non-filling of vacant jobs are: a) The age criteria complicates the
mediation for unemployed workers over 45 years old; b) lack of adequate education; and c) lack
of knowledge and experience for a particular professions.
Since December 2013, training courses in the Public Vocational Training Centre (PVTC) are
offered free of charge and in 2014, there was an increase of the number of job seekers who
attended vocational training courses. Also during 2014 PVTC opened new professional courses
like electrician, installer and repairer of photovoltaic panels, electronic equipment repairer,
electronic repairer for computers, waterproofing, coatings painting, gardening -, upholsterer,
fishing, wood processing, tourism family, social assistance, carer for elderly care, for home care,
for people with disabilities, small business entrepreneurs and office cashier. The following table
gives an idea of the training opportunities that were given to unemployed people who are
registered at the employment service (courses that are offered by proper professional schools are
not counted).
Table 24: Courses offered by PVTC in 2014 and the number of unemployed job-seekers
that have followed it
The title of course No of
participants
Type of course No of
participants
Secretary 42 Solar panel 32
Tailoring 50 Culinary 129
Electric Ing. 67 Nursery maid 8
Household appliances 31 Automobile service 43
Plumber 59 Rep.sewing machines 34
Bartender 32 Entrepreneur Small. B 27
Waiter 24 Computer technician 22
Esthetic 31 Office cashier 17
Cosmetic 109 Welding 18
Family tourism 7 Conditioner repair 4
Duralumin worker 10 Construction 4
Hotel reception 10 Social assistant 22
IV.2.2. Consultation in the field with 66 enterprises of Durres Region: data on the employees To supplement the data obtained during interviews with the Work office, during November -
December 2014, the CDI undertook a survey in 66 enterprises registered in the region of Durres.
The objective was to outline the main features of the relation between economic actors and the
population in this region, which is dominated undisputedly by the city of Durres. Some key data
are discussed below:

44
First, about two-thirds of the workers of the surveyed enterprises live in the same LGU where the
enterprise is established. Here the results are clearly defined by the Municipality of Durres.
Tab 25. Where the most of your company's workers live (more than 2/3)?
Number
Percentage
of total
Percentage of
respondents
Valid in the city /
commune 43 65,2 72,9
in the district 16 24,2 27,1
Total 59 89,4 100,0
Missing System 7 10,6
In Total 66 100,0
Source: CDI survey with 66 enterprises of Durres Region
Secondly, the network of contacts is clearly expanded in relation with the origin of the clients /
buyers. In this configuration, the AU loses its importance in favour of the District, national trade
(with 21.2%) and International one (with 4.5%).
Tab 26. Where are the clients / your buyers (more than 2/3)?
Number
Percentage
of total
Percentage of
respondents
Valid in the city /
commune 15 22,7 25,4
in the district 27 40,9 45,8
Outside Durres 14 21,2 23,7
abroad 3 4,5 5,1
Total 59 89,4 100,0
Missing System 7 10,6
In Total 66 100,0
Source: CDI survey with 66 enterprises of Durres Region
Third, this tendency gets stronger with the distribution of suppliers. The national and
international level (with 33.3% each) is evidently the main source of supply of the FA of Durres.
Tab 27. Where are your suppliers (more than 2/3)?
Number
Percentage
of total
Percentage of
respondents
Valid in the city /
commune 3 4,5 5,1
in the district 12 18,2 20,3
Outside Durres 22 33,3 37,3
abroad 22 33,3 37,3
Total 59 89,4 100,0
Missing System 7 10,6

45
In Total 66 100,0
Source: CDI survey with 66 enterprises of Durres Region
The following tables highlight the fact that about 90% of surveyed businesses state that they
have not received any services from neither local government institutions (city / commune /
county / etc.), nor the central government institutions (Government / Agencies / Departments in
the region / Prefecture / etc).
Tab 28. What is the most important service that your business has received
from local government institutions (city / municipality / county / etc.)?
Number
Percentage
of total
Percentage of
respondents
Valid 8 12,1 12,1
NO SERVICE 58 87,9 87,9
In Total 66 100,0 100
Source: CDI survey with 66 enterprises of Durres Region
Tab 29. What is the most important service that your business has received from the
central government institutions (Government / Agencies / Departments in Region /
Prefecture / etc)?
Number
Percentage of
total
Percentage of
respondents
Valid 8 12,1 12,1
NO SERVICE 58 87,9 87,9
In Total 66 100 100
Source: CDI survey with 66 enterprises of Durres Region
Whilst in the successive table, it is noted that the activity growth remains the main concern for
the businessmen of Durres region. Other reasons, including quality growth are almost invisible
on the map of challenges for 2015. Also, the impact of public policies, including the TAR and
the reform of decentralization does not seem to disturb the economic actors.
Tab 30. What is the biggest challenge for your business in 2015?
Number
Percentage /
total
Percentage /
respondents
Valid 7 10,6 10,6
SIGNING NEW CONTRACTS 1 1,5 1,5
STUDENTS OF WISDOM CENTER IN
INTERNATIONAL EXAMS ARE THE BEST 1 1,5 1,5
ACTIVITY GROWTH 48 72,7 72,7
INCREASING THE QUALITY OF SERVICES 1 1,5 1,5
CUSTOMER GROWTH 2 3,0 3,0

46
INCREASING THE LEVEL OF SERVICE 1 1,5 1,5
INCREASING THE CUSTOMER 1 1,5 1,5
INCREASING THE NUMBER OF
CUSTOMERS AND INCREASING THE
NUMBER OF EMPLOYEES
1 1,5 1,5
HAVE THE SAME ACTIVITY 1 1,5 1,5
REALIZE AS MUCH SALES 1 1,5 1,5
CONTINUITY OF SIGNING CONTRACTS 1 1,5 1,5
In Total 66 100,0 100,0
Source: CDI survey with 66 enterprises of Durres Region
IV.3. Economic interactions and strategic economic sectors
The six units of the new functional area are part of the metropolitan area of Tirana - Durres as
observed by the employment flows, by the supply with raw materials and final products.
Consequently each analysis of the FA of Durres should be viewed depending on the development
strategies of these two poles: Tirana and Durres and on the national policies that directly or
indirectly affect this area.
The city of Durres is the centre of institutional interaction, being at the same time the centre of
the FA and region of Durres. This city is point of interaction for all institutions of the constituent
AUs of the FA of Durres, and is conditioned by the presence of a number of regional directories
(health, education, social care and forest), Department of Treasury, and the Department of
Taxation. The centre of the region also entails the interaction with all the citizens of the county
due to the presence of the Employment Office, the Court and the Prosecutor Judicial District,
Elderly Care House, Professional Development Centre and Orphanage.
IV.3.1. Daily moves towards labour centres
Every day, 3.375 employees or 87.93% of the total number of employees of the five AUs that
travel every day to their employment centres, travel to Durres city. At the same time it is noted
that the largest concentration of employees who do not have to travel to get to work is in the city
of Durres. Over 90% of employees in this city work in the city where they live in.
Currently Durres city has only 4 lines of public transport by bus: a) Durres - Plepa, b) Durres -
F.Tullave; c) Durres - Porto Romano, and d) Durres - Currila. The bus park has a total capacity
of 5,810,000 passengers / year or 50 passengers / trip. This means that the travel capacity is
covered with 116.200 trips / year or 318 trips / day.
Table 31: Inflows - outflows from the six units of FA Durres
In
Total
Labor Place
DURR
ES
ISH
EM
KATU
ND I
RI
MAM
INAS
MANE
Z
RRA
SHB
ULL
SHIJ
AK
SUKT
H
XHA
FZO
TAJ
KA
VAJ
E
LEK
AJ
SHK
ODE
R
TIRA
NE
VOR
E
DURRES 23 254
21496 * 24 22 21 77 * 9 219 97 512 4 761 12
ISHEM 232 31 193 * * * 4 4

47
KATUN
D I RI 699 224 / 268 4 12 * 147 * 27 8 9 *
MANEZ 457 54 12 315 * 26 16 34 * * * * RRASHBULL 1 681 1 224 4 * * 71 5 246 21 19 * 86 5
SUKTH 1 463 173 * * * 7 8 528 697 * 46 4 *
In
Total
Labor Place
DURR
ES
ISH
EM
KATU
ND I
RI
MAM
INAS
MANE
Z
RRA
SHB
ULL
SHIJ
AK
SUKT
H
XHA
FZO
TAJ
KA
VAJ
E
LEK
AJ
SHK
ODE
R
TIRA
NE
VOR
E
DURRES
100,00
%
92,44
%
0,10
%
0,09
%
0,09
%
0,33
%
0,04
%
0,94
%
0,42
%
2,20
%
0,02
%
3,27
%
0,05
%
ISHEM
100,00
%
13,36
% 83,1
9%
1,72
%
1,72
%
KATUND I RI
100,00
%
32,05
%
38,34
%
0,57
%
1,72
%
21,0
3%
3,86
%
1,14
%
1,29
%
MANEZ
100,00
%
11,82
%
2,63
% 68,93
%
5,69
%
3,50
%
7,44
%
RRASH
BULL
100,00
%
72,81
%
0,24
% 4,22
%
0,30
%
14,6
3%
1,25
%
1,13
%
5,12
%
0,30
%
SUKTH
100,00
%
11,83
%
0,48
%
0,55
% 36,09
%
47,6
4%
3,14
%
0,27
%
Source: INSTAT, Census 2011, calculations of the authors
From the above tables, it is clearly seen that there are almost no exchange between people
leaving in Durres and the five areas of the LGUs: less than 1% of Durres citizens move to
communes and municipalities of the FA. It is also interesting to underline the fact that Ishmi has
0 (zero) inflows / outflows movements in the other four LGUs (except Durres). The rest of the
LGUs do not have any inherent exchange between them (except with Durres).
It is also relevant the fact that Rashbull depends almost entirely from Durres (72.81%) for
employment, while Xhafzotaj (LGU outside of the FA Durres) is very important for the
employment of the residents of Sukth, Katundi i Ri and Rashbulli. Rashbull also provides
employment opportunities only for 4.22% of its residents.
From the above and from additional data that follow, we may conclude that the movements of
residents between the LGUs of the FA of Durres are mainly conducted towards Durres, not at all
between them.
Table 32: No. of outgoing and incoming daily movements of the workforce of FA Durres
AU Outgoing Incoming Total
movements
Durres 1,968 3,375 1,407
Ishem 47 16 -31
Katund i Ri 446 39 -407
Manez 162 180 18

48
Rrashbull 1,807 159 -1,648
Sukth 992 69 -923
In total 5,422 3,838 -1,584 Source: Instat, Census 2011, Calculations of the authors
At the regional level, the city of Kruje and Fushe Kruje, and Ishmi are AUs with high levels of
employment. So, evidently the majority of the inhabitants of these areas work where they have
their residences.
Around 40-60% of employees of Xhafzotaj, Manza, Shijak work in areas where they live in,
while the rest travel to work in neighbouring areas, respectively towards Durres, Shijak and
Xhafzotaj. The low level of employment in the residential area and the higher tendency to work
in bordering LGUs is noted in Katundi i Ri, Sukth, Gjepalaj and Rrashbull which is the indicator
of the low economic development of these LGUs.
Currently the services provided by all AUs of Durres include:
(a) services directly related to the citizen such as civil status service or those which are
directly related to the business such as tax inspectors. These services will continue to be
offered in all the AUs.
(b) services related to internal support functions such as finance, procurement, public
relations, urban planning, etc. These services will focus on the city of Durres, which is
the centre of FA, and will provide a higher efficiency of work thanks to the economies of
scale and avoidance of duplication of positions in small areas, and will cover the volume
of work for the whole territory with a much smaller number of supporting staff.
Compared with the functioning of current organization in five different units of local
government, the new functional area will offer its services for the same territory by having a
more efficient administration and will provide a faster decision-making and more efficient
administration of the territory with a reduced number of local functionaries.
IV.3.2. Processing Industry
The most active enterprises in the AU are the fason companies, where besides Durres, Sukth and
Rrashbull are distinguished. This sector is also the largest employer with an estimated total of
about 8.298 people. Employment in this sector plays the role of a releasing factor for the social
pressure of the area and depends exclusively on export, mainly in neighbouring Italy. Therefore,
any development strategy based on this sector exceeds the limits of FA of Durres, and is directly
dependent on the evolution of international markets and the economic situation of the
neighbouring country. In the concrete case the future of Italy as the biggest requesting market
will determine short-term developments in this sector.
In medium terms perspective, the government is aiming the "U" development model. This
includes for eg sewing / the set of stamps / attaches processes / etc - all processes with low added

49
value but where Albania has a comparative advantage regarding the cost of the labour force and
proximity to markets. In this approach, the enterprises start at the lowest point of U and develop:
a) left towards Research & Development; or b) right towards the marketing and sales under the
logo of the Albanian enterprise.
However, based on the interviews that we had with businessmen and with officials of the
Regional Employment Office, we have established the belief that the biggest problem that
interviewed fason enterprises have in FA Durres is the qualifications of the labour force.
Currently the labour market fails to meet the needs of these industries.
Graph 7: LGUs weight in the processing industry of FA Durres
Source: tax administrations of LGUs, calculations of the authors
IV.3.3. Transport & storage
It is obvious from the table that the Municipality of Durres with about 400 enterprises prevails in
this sector. Taking into account the profile of activity and the average number of employees per
enterprise, the existence of Durres port, railway and transport volume for goods and citizens, the
logistic services and transport at national and international level become strategic development
factor mainly for Durres Municipality. Other administrative units are expected to benefit mainly
in employment.
80%
1%
2% 2% 8%
7%
Durrsi Ishmi Katund Ri Manez Rashbull Sukth

50
Graph 8: The contribution of AU in FA Durres in the wholesale trade
Source: tax administrations of LGUs, calculations of the authors
IV.3.4. Accommodation & food services
The Accommodation and Food Services consists also of the economic entities that provide
services for local and foreign tourists. According to our calculations, it is clearly noted the large
number of these units in Durres, and in Rrashbull, situated on the coastal area. It should be said
that the profile of the tourist economic units in the coastal area in Durres and Rrashbull are
oriented towards a local and regional clientele, mainly in the summer season (a fact that can be
verified by the lower number of employees per unit) and with a modest power of buyers.
While Manz and Katund i Ri do not have a good performance in this sector, it is Ishmi that has
relatively low weight on this sector in all FA of Durres.
Table 33: Number of visitors per season, and the tourist logistics in the five AU
Rubric / time Winter Summer 2011 2012 2013
Ishem visitors 100 5000
rooms 0 0 0
beds 0 0 0
Rrashbull visitors N/A N/A
rooms 750 800 800
beds N/A N/A N/A
Sukth visitors N/A 20 000
rooms N/A N/A N/A
beds N/A N/A N/A
Manez visitors local*
rooms N/A N/A N/A
beds N/A N/A N/A
KiR visitors 0 0
rooms 0 0 0
beds 0 0 0
Based on the assessment of the current conditions of this sector, we believe that strategic
developments can focus on Ishem (as the most undamaged area with the highest potential for
elite services) and in tourism within the land throughout the year. Sukth, Katund i Ri and Manez
83%
17%
Durres Other
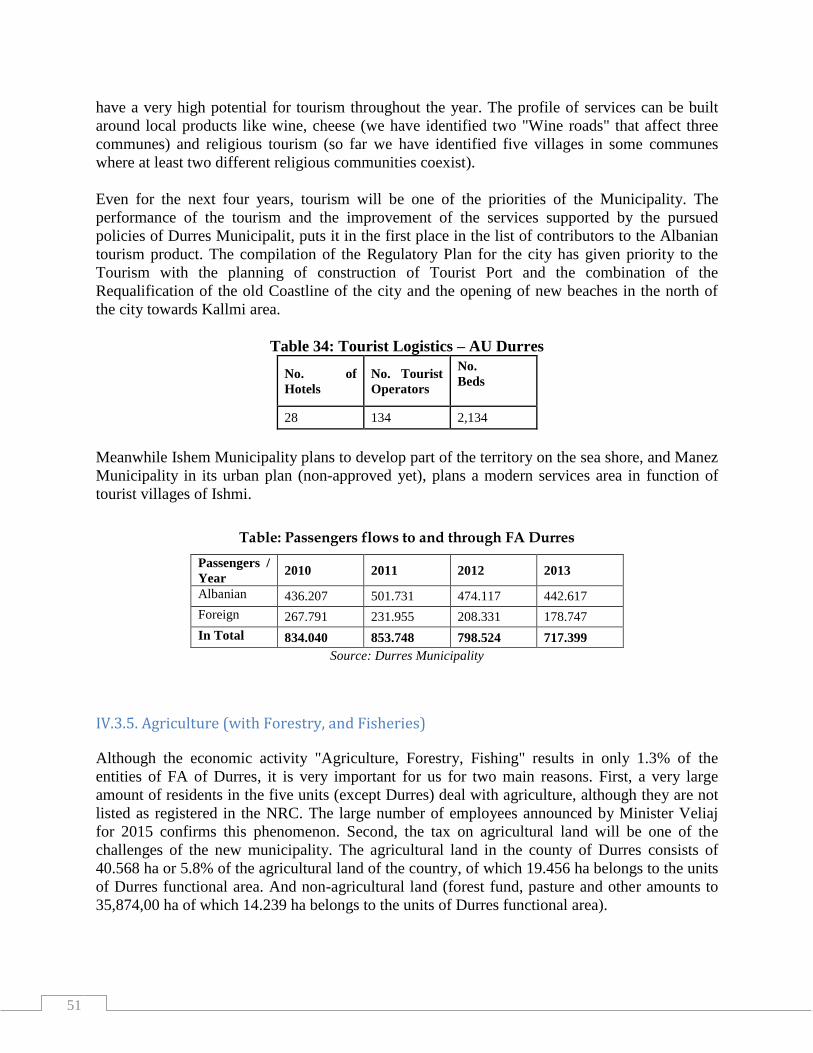
51
have a very high potential for tourism throughout the year. The profile of services can be built
around local products like wine, cheese (we have identified two "Wine roads" that affect three
communes) and religious tourism (so far we have identified five villages in some communes
where at least two different religious communities coexist).
Even for the next four years, tourism will be one of the priorities of the Municipality. The
performance of the tourism and the improvement of the services supported by the pursued
policies of Durres Municipalit, puts it in the first place in the list of contributors to the Albanian
tourism product. The compilation of the Regulatory Plan for the city has given priority to the
Tourism with the planning of construction of Tourist Port and the combination of the
Requalification of the old Coastline of the city and the opening of new beaches in the north of
the city towards Kallmi area.
Table 34: Tourist Logistics – AU Durres
No. of
Hotels
No. Tourist
Operators
No.
Beds
28 134 2,134
Meanwhile Ishem Municipality plans to develop part of the territory on the sea shore, and Manez
Municipality in its urban plan (non-approved yet), plans a modern services area in function of
tourist villages of Ishmi.
Table: Passengers flows to and through FA Durres
Passengers /
Year 2010 2011 2012 2013
Albanian 436.207 501.731 474.117 442.617
Foreign 267.791 231.955 208.331 178.747
In Total 834.040 853.748 798.524 717.399
Source: Durres Municipality
IV.3.5. Agriculture (with Forestry, and Fisheries)
Although the economic activity "Agriculture, Forestry, Fishing" results in only 1.3% of the
entities of FA of Durres, it is very important for us for two main reasons. First, a very large
amount of residents in the five units (except Durres) deal with agriculture, although they are not
listed as registered in the NRC. The large number of employees announced by Minister Veliaj
for 2015 confirms this phenomenon. Second, the tax on agricultural land will be one of the
challenges of the new municipality. The agricultural land in the county of Durres consists of
40.568 ha or 5.8% of the agricultural land of the country, of which 19.456 ha belongs to the units
of Durres functional area. And non-agricultural land (forest fund, pasture and other amounts to
35,874,00 ha of which 14.239 ha belongs to the units of Durres functional area).

52
The total of active economies in the agriculture sector of Durres region is 31.539, of which
14.111 are in the FA of Durres and there are included 32.900 families with a population of
144.030 inhabitants, of which 62.834 are 25-54 years old. From the total of active economies,
21.696 or 69% are from the "Plants & Livestock" activity and 9.843 or 31% are of the simply
plant activity. In the sector of "Arboriculture", 10457 economies are active or 33% of the total
economies.
The average size of the farm in the region of Durres is 1.14 ha (1.21 ha of which is the
nationwide average). Revenues from vegetation and farming in the region of Durres reach about
6.9 bln and constitute 8.2% of the income that this sector gives to the country. From 2,156 agro-
processing enterprises that the country has, 196 or 9.1% are in the region of Durres and 34% of
them in the FA of Durres.
In the AU level, agriculture is very important for the communes of Katudi i Ri and for the
municipalities of Sukth and Manza. Most of the farmers sell their products to buyers who would
travel to their farms from Tirana or Durres. Provisional agricultural markets can be found in
Sukth and most of them occur on weekends. These markets tend to serve temporarily to the local
population, but do not seem to have the ability to attract people or buyers from other regions. An
additional practice consists in delivering products to Shkozet market or in the refrigerating
facilities in Rrashbull. Shkozet market is used by farmers coming from Manez, Sukth, Katund i
Ri and Rrashbull.
Table 36. Agricultural land for Administrative Unit FA Durres - 2013
Local Unit
Surface of
the unit in
km 2
Surface in
km2/1000
residents
Surface of
the
agricultural
land in ha
Surface of
the
agricultural
land in
ha/1000
residents
3 19 20 21 22
Durres 39,9 0,2 2200,8 10,6
Manez 52 4,5 2200,8 192,0
Ishem 85,4 9,6 1693,6 190,3
Katund i Ri 66,4 4,2 3293,2 211,6
Sukth 45,8 1,7 2819,1 105,0
Rashbull 54,8 1,9 2952,8 101,4
Source: Ministry of Agriculture, calculations of the authors
In the Durres functional area, in the entirety of its economic development, agriculture will be an
important sector. If in the current Durres municipality until now, nothing of the agricultural
sector was included, after the new territorial division the agricultural activity will have the same
weight as the other economic sectors. This is not only because of the fact that the surface of
agricultural land that this functional area includes occupies about 37% of agricultural land and
16% of non-agricultural land (forest fund, pastures etc) of Durres district, but it will also be
about 42 % of the population concentrated in villages that will deal with this activity. But even
more important is the weight that this functional area will have in the gross agricultural

53
production. In the following table are presented data of gross income from plants and livestock,
for 2013, in thousand ALL, according to local units involved in Durres functional areas:
Table 37. The gross revenues from Plants & Livestock in .000 ALL - 2013
Agriculture Livestock In Total Average /
farm (ALL)
Sukthi 421 410 732 436 1 153 846 246 432
Rashbulli 253 111 423 345 676 456 229 867
Manza 311 240 358 233 669 473 220 456
Kat I Ri 209 632 543 210 175 176 345
Ishmi 167 840 221 489 389 329 158 790
Amount 1 363 233 1 736 046 3 099 279
By county 48,20% 34,60% 36,10%
Source: Ministry of Agriculture, calculations of the authors
As it appears from the above data, in the agriculture sector, this FA has given nearly 48% of
gross income at regional level and 34.6% of gross income in livestock sector. But this weight is
not at the same level in the processing of agricultural and livestock products, as it is evident from
the data of the table below, but for the same year, 2013:
Table 38. Income from Processing - 2013 (in .000 ALL)
Agricultural Livestock In Total
Sukthi 31 474 15 630 47 104
Rashbulli 19 843 10 235 30 078
Manza 17 344 11 560 28 904
Kat I Ri 9 745 10 448 20 193
Ishmi 7 430 8 642 16 072
Amount 85 836 56 515 142 351
By County 24,10% 23,90%
Source: Ministry of Agriculture, calculations of the authors
According to the information received in the ground, this low level of the scale of agricultural
processing products has its base in the absorption of production, like raw material, by powerful
processors (e.g. milk from "LUFRA" company, grape from the winery "Skanderbeg etc.).
The number of farms occupies a significant weight in this functional area, as it appears from the
data presented in the following table:
Table 39. The number of farms with walnut plants
Walnut
plants Wheat Corn Legume
Vegetable
s Potatos
Sukthi 2 340 432 1 014 813 2 310 408
Rashbulli 1 861 176 654 488 1 277 184
Manza 2 080 560 1 230 917 2 068 467
Kat I Ri 840 211 370 328 477 308
Ishmi 437 78 254 165 269 211
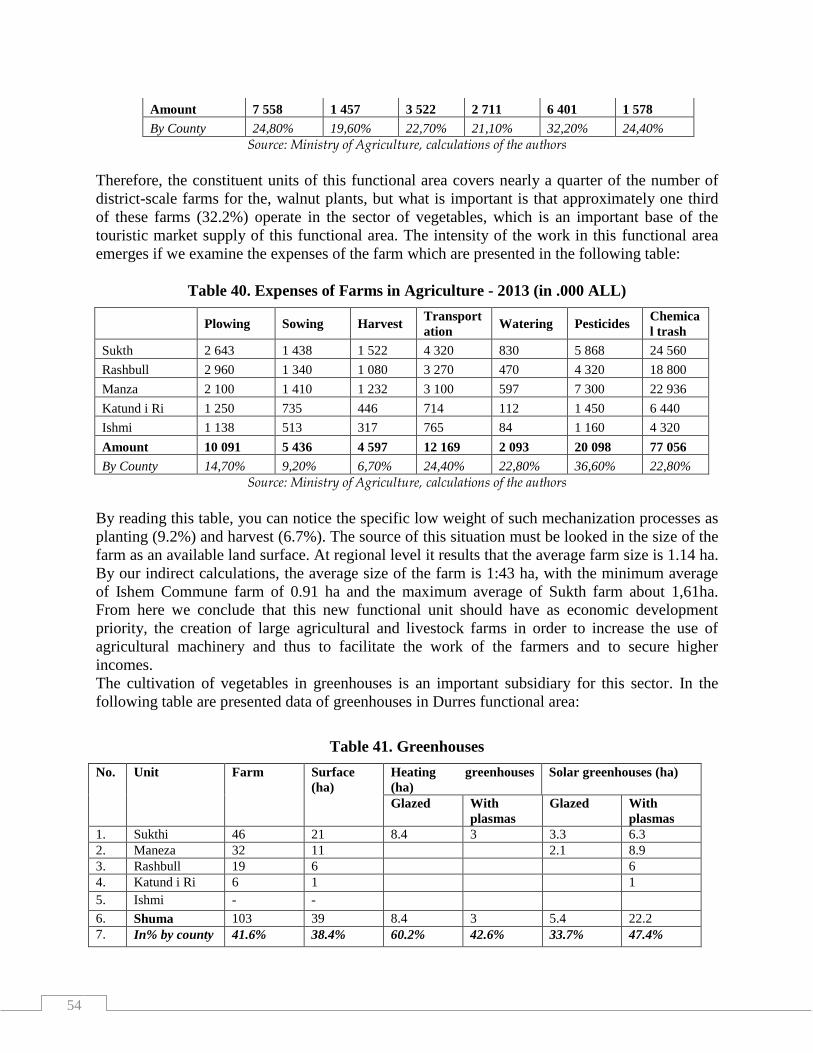
54
Amount 7 558 1 457 3 522 2 711 6 401 1 578
By County 24,80% 19,60% 22,70% 21,10% 32,20% 24,40%
Source: Ministry of Agriculture, calculations of the authors
Therefore, the constituent units of this functional area covers nearly a quarter of the number of
district-scale farms for the, walnut plants, but what is important is that approximately one third
of these farms (32.2%) operate in the sector of vegetables, which is an important base of the
touristic market supply of this functional area. The intensity of the work in this functional area
emerges if we examine the expenses of the farm which are presented in the following table:
Table 40. Expenses of Farms in Agriculture - 2013 (in .000 ALL)
Plowing Sowing Harvest Transport
ation Watering Pesticides
Chemica
l trash
Sukth 2 643 1 438 1 522 4 320 830 5 868 24 560
Rashbull 2 960 1 340 1 080 3 270 470 4 320 18 800
Manza 2 100 1 410 1 232 3 100 597 7 300 22 936
Katund i Ri 1 250 735 446 714 112 1 450 6 440
Ishmi 1 138 513 317 765 84 1 160 4 320
Amount 10 091 5 436 4 597 12 169 2 093 20 098 77 056
By County 14,70% 9,20% 6,70% 24,40% 22,80% 36,60% 22,80%
Source: Ministry of Agriculture, calculations of the authors
By reading this table, you can notice the specific low weight of such mechanization processes as
planting (9.2%) and harvest (6.7%). The source of this situation must be looked in the size of the
farm as an available land surface. At regional level it results that the average farm size is 1.14 ha.
By our indirect calculations, the average size of the farm is 1:43 ha, with the minimum average
of Ishem Commune farm of 0.91 ha and the maximum average of Sukth farm about 1,61ha.
From here we conclude that this new functional unit should have as economic development
priority, the creation of large agricultural and livestock farms in order to increase the use of
agricultural machinery and thus to facilitate the work of the farmers and to secure higher
incomes.
The cultivation of vegetables in greenhouses is an important subsidiary for this sector. In the
following table are presented data of greenhouses in Durres functional area:
Table 41. Greenhouses
No. Unit Farm Surface
(ha)
Heating greenhouses
(ha)
Solar greenhouses (ha)
Glazed With
plasmas
Glazed With
plasmas
1. Sukthi 46 21 8.4 3 3.3 6.3
2. Maneza 32 11 2.1 8.9
3. Rashbull 19 6 6
4. Katund i Ri 6 1 1
5. Ishmi - -
6. Shuma 103 39 8.4 3 5.4 22.2
7. In% by county 41.6% 38.4% 60.2% 42.6% 33.7% 47.4%

55
Source: Ministry of Agriculture, calculations of the authors
Greenhouses sector is quite extended in this functional area and constitutes about 42% of its
extension at the regional level. Graphically the surface of the greenhouse land for the current
local units of Durres functional area is shown in the graphic below:
Graph 9. The surface of greenhouse / LGUs of FA
Source: Ministry of Agriculture, calculations of the authors
Intensification of vegetable cultivation technologies in these greenhouses remains a problem of
the future, because while in Europe, for example the productivity of the tomato in the greenhouse
is 55-60 kg / m², in the greenhouses of this area, the efficiency average is 4-5 kg / m².
Table 42. Income from processed agricultural products - 2013 (in .000 ALL)
Wine Brandy Butter Cheese
Sukthi 2 430 3 640 340 10 430
Rashbulli 1 840 3 290 298 8 489
Manza 724 4 300 413 9 650
Kat I Ri 340 6 400 317 4 790
Ishmi 450 8 123 267 3 444
Amount 5 784 25 753 1 635 36 803
By county 19,30% 25,50% 30,30% 37,10%
Source: Ministry of Agriculture, calculations of the authors
Arboriculture. In this functional area arboriculture is an ongoing sector, as it is evident from the
data of the table below:
Table 43. The numerical situation of arboriculture (in 1,000 root), 2013
No. Unit Tree Olives Citrus Vine Vineyards
52%
27%
15% 6%
Sukthi Manza Rashbulli KatundiI Ri

56
(ha)
1. Sukthi 33 13 4 6 47
2. Manza 39 16 6 14 63
3. Rrashbulli 37 22 5 21 84
4. Katundi i Ri 51 27 7 18 29
5. Ishmi 59 37 9 29 36
6. Amount 219 115 31 87 259
7. In % ndaj qarkut 38.6% 44.3% 39.4% 41.8% 40.1%
Source: Ministry of Agriculture, calculations of the authors
Many farmers of this area are included in the "National Schemes" of support, especially for
olives and vines, but individual spontaneity is damaging the organism, especially regarding to
the irrigation systems with drops, which guarantees annual production and justified incomes.
Graph 10. The structure of fruit trees - FA Durres - in%
Source: Ministry of Agriculture, calculations of the authors
In conclusion, (if we remove the "services" where the administration is also included) in the FA
of Durres, agriculture provides most of the jobs for Sukth (26.3%), Ishmi (31.6%), Katund i Ri
(23,4% or 0.6% less than industry) and Manez (53.5%). Although in absolute value these figures
may not have importance, agriculture remains a vital activity for employment as well as for the
household of these areas, especially as it is seen in the figures of the self-employed and family
contributors. Any economic policy in FA level should account this fact.
1. Table 44. The importance of agriculture for employment
Indicator / Local Unit Durres KiR Rrashbull Sukth Ishem Manez
Employment by economic sectors: agriculture 2,5 23,4 20,9 26,3 31,6 53,5
Employment status: self-employed and family
contributors 26,7 52,2 38,4 49 56 65
Source: Instatgis, calculations of the authors
Bibliography
1. Capital Investment Plan January 2011 - December 2015 Rrashbull Commune
Trees
Olive
Citrus fruits
Grape-wine
48%
25%
6%
19%
in %
Trees Olive Citrus fruits Grape-wine

57
2. Development of the Gas Master Plan of Albania, 19 December 2014
3. Statistical Bulletin 2013, Durres Municipality
4. Towards a Sustainable Development of the Tirana - Durres region, Tirana February 2002
5. Swot Analysis, Edmond Alite, June 2009
6. Official newspaper of the Republic of Albania, 30 December 2013
7. Strategic Plan for Economic Development 2005-2015, Tirana 2006
8. Confindustry -STAR PROJECT, JUNE 2014
9. INSTATGIS

58
V. PROFILE OF LOCAL PUBLIC SERVICES
In this chapter we will treat the sector of Water /Sewage; Roads & Public Transport; Waste
Management and Urban Development and Regulation of Territory. Waste Management is treated
with particular details.
V.1. WATER SUPPLY / SEWAGE
WSSD ShA Water Supply Sewage Durres is being transformed in 27 December 2007 with the
issue number: CN-109836-12-07, where the quota that was held by the only shareholder Ministry
of Economy and Industry of Water Supply and Sewage Durres, was transferred to the local units
of the service area that consists of 5 municipalities and 10 communes. Shareholders in WSSD are
as follows:
SHAREHOLDERS % of Shares
1. Durres Municipality: 54.7
2. Sukth Municipality: 6.7
3. Manez Municipality: 2.5
4. Katund i Ri Commune: 4.3
5. Rrashbull Commune: 7.2
6. Ishem Commune: 1.0
7. Fushe - Kuq Commune: 2.399
8. Thumane Commune: 4.6
9. Shijak Municipality: 3.6
10. Vora Municipality: 2.0
11. Gjepalaj Commune: 1.6
12. Maminas Commune: 1.9
13. Prez Commune: 0.8
14. Xhafzotaj Commune: 4.5
15. Bubq Commune: 2.2
A copy of the organisational structure is enclosed at the end of the study.
Water Supply and Sewage Durres currently provides water supply services and sewerage
services for Durres, Municipality Sukth, Manez, Shijak, Maminas, Xhafzotaj 1 + 2, Ishem,
Fushekuq, Fushekruje, Katund i Ri, Preze, Bubq and Gjepalaj. The daily amount of the supply
for the whole system is 74,000m3.
Incomes (in .000) from the water supply for 2013 were ALL 521,841,942 and from sewerage
ALL 120,499,744.
WSSD administrates two independent systems of water supply from watersheds in Fushe-Kuq
and Fushe-Kruje:
- Production is done in Fushe Kuq (14,000 m3 / day, equivalent of 18%) and Fushe Kruje
(59.963 m3 / day, equivalent of 81%). A small part - about 1% - is bought from Kavaja);

59
- The measurement is done in four branches through four flow meters in the key points of the
district for the calculation of the distributed amount in the main district.
- The calculation of the consumption is done to the final consumers.
Thank to the system in Fushe Kuq (FK), the Municipalities of Durres, Ishem, Manez, Sukth KiR
and Rrashbull (also Xhafzotaj 1 and Fushe Kuq) are supplied. The plant has the following
characteristics: a) 7 wells; b) Q average = 760 l / sec; c) transmission line is DN700; and, e) has
54 receiving points.
Map 9. The coverage with services of Water Supply-Sewage Durres
Source : WSSD ShA Durres
General data
The water supply / day is an average of 6 hours and supplies about 80% of the population.
Moreover, 20% of the villages / neighbourhoods do not have a water supply system. The families
connected to the sewage networks are on average 52% in the city. The rural area has no sewage
system. The length and conditions of the main pipes, reservoirs, treatment plants, etc: about 165
km. The length of the secondary pipeline network, the number of connections with the houses is
about 472 km.
Whereas in Fushe Kruje (it does not supply the Durres FA), it has: a) 3 wells; b) Q average =
180l / sec; c) transmission line DN500, and d) six receiving points

60
According to ASW Durres, the amount billed according to the type of the customer is divided as
below:
• Family: 90%
• Private company: 8%
• State Institution: 2%
Total losses reach 61.1% for the entire FA Durres, according to the following table.
Table 45: Production & Billing of water by NUS Durres - 2013
Local Unit
The
Supplied
Amount
(m3 / day)
The Billed
Amount
(m3/dite)
Losses
1 Durres Municipality 35,144 14,475 59%
2 Ishem 1,956 367 81%
3 Manez 1,808 425 76%
4 Sukth 5,880 1,002 83%
5 KiR 3,387 890 74%
6 Rrashbull 4,087 1,108 73%
Source : WSSD ShA Durres
The causes of losses in the system are: a) Incorrect registration of the quantity by the water
meters of the customers; b) inefficiency in the organization of the reading process; c) Illegal
connections in the water supply system; f) The leaks in the distribution system:
Table 46: Type of Measuring
With
measurements
(%)
Without
measurements
(%)
Fee (%)
Family 80 17 3
Institution 86 12 2
Private company 94 2 4
Source : WSSD ShA Durres
As it can be seen, there are still about 80% of the families and almost as much as institutions that
do not have meters of water consumption.
Financial Statements 2011 and 2012
Based on the FS of the fiscal year 2012, at a first glance, Durres IGC represents a significant
improvement of the results and an increase of the balance. However, a more detailed overview
significantly gives more colours to these figures.
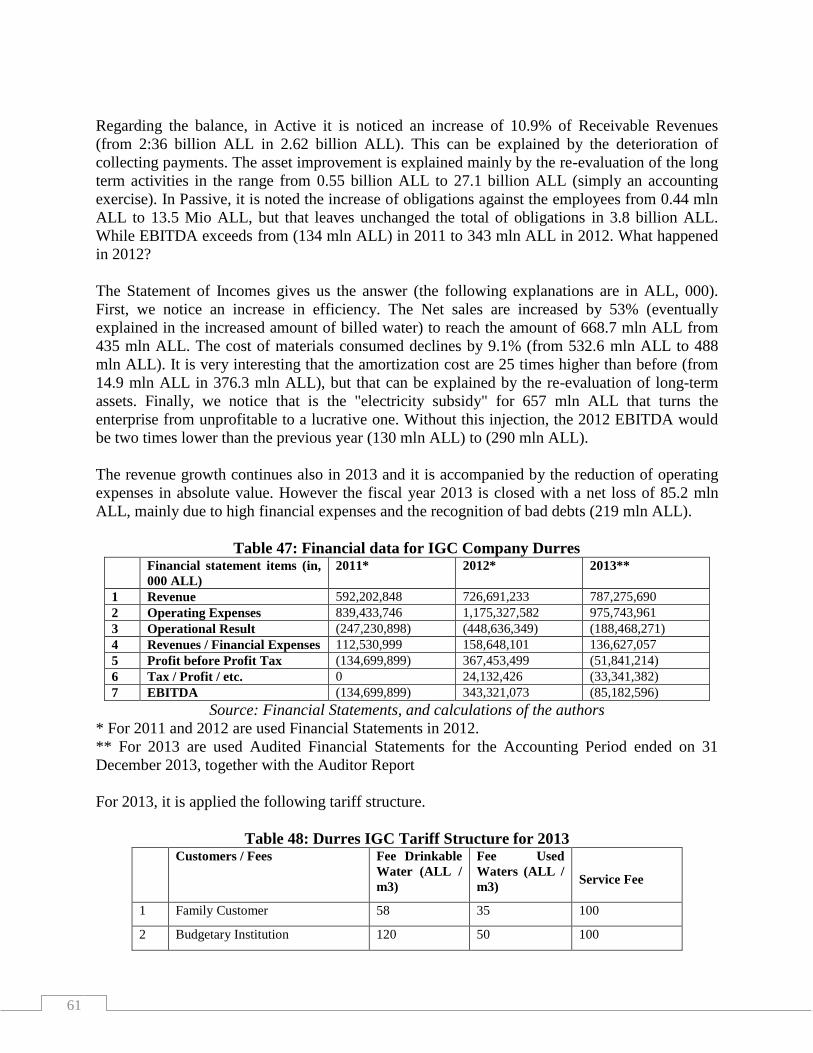
61
Regarding the balance, in Active it is noticed an increase of 10.9% of Receivable Revenues
(from 2:36 billion ALL in 2.62 billion ALL). This can be explained by the deterioration of
collecting payments. The asset improvement is explained mainly by the re-evaluation of the long
term activities in the range from 0.55 billion ALL to 27.1 billion ALL (simply an accounting
exercise). In Passive, it is noted the increase of obligations against the employees from 0.44 mln
ALL to 13.5 Mio ALL, but that leaves unchanged the total of obligations in 3.8 billion ALL.
While EBITDA exceeds from (134 mln ALL) in 2011 to 343 mln ALL in 2012. What happened
in 2012?
The Statement of Incomes gives us the answer (the following explanations are in ALL, 000).
First, we notice an increase in efficiency. The Net sales are increased by 53% (eventually
explained in the increased amount of billed water) to reach the amount of 668.7 mln ALL from
435 mln ALL. The cost of materials consumed declines by 9.1% (from 532.6 mln ALL to 488
mln ALL). It is very interesting that the amortization cost are 25 times higher than before (from
14.9 mln ALL in 376.3 mln ALL), but that can be explained by the re-evaluation of long-term
assets. Finally, we notice that is the "electricity subsidy" for 657 mln ALL that turns the
enterprise from unprofitable to a lucrative one. Without this injection, the 2012 EBITDA would
be two times lower than the previous year (130 mln ALL) to (290 mln ALL).
The revenue growth continues also in 2013 and it is accompanied by the reduction of operating
expenses in absolute value. However the fiscal year 2013 is closed with a net loss of 85.2 mln
ALL, mainly due to high financial expenses and the recognition of bad debts (219 mln ALL).
Table 47: Financial data for IGC Company Durres Financial statement items (in,
000 ALL)
2011* 2012* 2013**
1 Revenue 592,202,848 726,691,233 787,275,690
2 Operating Expenses 839,433,746 1,175,327,582 975,743,961
3 Operational Result (247,230,898) (448,636,349) (188,468,271)
4 Revenues / Financial Expenses 112,530,999 158,648,101 136,627,057
5 Profit before Profit Tax (134,699,899) 367,453,499 (51,841,214)
6 Tax / Profit / etc. 0 24,132,426 (33,341,382)
7 EBITDA (134,699,899) 343,321,073 (85,182,596)
Source: Financial Statements, and calculations of the authors
* For 2011 and 2012 are used Financial Statements in 2012.
** For 2013 are used Audited Financial Statements for the Accounting Period ended on 31
December 2013, together with the Auditor Report
For 2013, it is applied the following tariff structure.
Table 48: Durres IGC Tariff Structure for 2013 Customers / Fees Fee Drinkable
Water (ALL /
m3)
Fee Used
Waters (ALL /
m3)
Service Fee
1 Family Customer 58 35 100
2 Budgetary Institution 120 50 100

62
3 Private Ent 120 50 100
Source : WSSD ShA Durres
Strategic plans for the Water and Sanitation Sector
The objective is to reduce the Water without Incomes (water losses) as a percentage of the
volume of water produced, from 71.4% in 2013 to 50% in 2018. The most important project is
the agreement between the Albanian government and the World Bank for US $ 85 million, as
follows:
• Component 1: Water Supply Network focused on creating new production capacities but also
on network rehabilitation distribution. There are priority investments for water supply, including
the new funding of the supply line together with a new pumping station in Fushe Kuq. The line
will be dedicated only to the city of Durres, while the existing line will be used for the villages
around it. The new line will greatly improve the supply service to the city and the beach area.
Also, the aim is to improve the water supply in all the rural areas through the construction of the
new transmission lines and reservoirs for each village.
• Component 2: The removal / collection of Wastewater, is focused on the construction of the
secondary and tertiary network. Investments will focus on the Sewerage Network which aims to
improve and solve the problem of sewage wastewater in Durres area, including the beach area.
The main goal is the division of drinkable water systems from sanitation and the rehabilitation of
main transmission lines including pumping stations. The informal peripheral areas and rural
areas will also have the sewerage network.
• Component 3: Institutional Support focusing on enhancing the skills of SWD and its staff in
order to achieve financial stability and provide an affordable service to the customer. The
institutional development component, Strengthening of the management demand and the
empowerment of the company, whereby the government policies and reforms in the water sector
will be supported. These reforms will include the preparation and implementation of a
Monitoring Programme for Water Demand. The latter aims the implementing of a measurement
program for Durres including household customers as well as measurement in the connection
points on the main line, the implementation of an awareness campaign for not wasting water, the
support of the Monitoring Unit at GDSW, the technical assistance for the support and
implementation of an effective model for the supply and distribution of water etc.
Measures:
- Rehabilitation of the distribution network of the city.
- Installation of zonal meters in the distribution network, in the receiving points of the main
transmission, storage etc. (250 pieces).
- Replacement of family water meters with problems (12.160 pieces).
- Installation of water meters for new family customers and with flat rate billing (26.690 pieces).
- Installation of water meters for private clients and government agencies (96 pieces).
- Performance of monitoring of losses and the repair of noticeable losses.
- Perform the routine water balance in the system.
- Reduction of the inefficiency of the readers and measurement based on new technologies,
installation of PDAs
- Reorganization of the management of sales areas - water balance

63
The process of updating the data of customers and implementation of the hydraulic model are
expected to finish in 2015.
The following table summarizes the projects implemented by the General Directorate of Water
Supply and Sewage. Table 49: WSSGD projects in Durres Region
No. Project Sponsor
1. Water supply of Keneta area, Durres (Zone 8-14) (Additional Contract) MPPT
2. Water supply of Keneta area, Durres area 8-14 MPPT
3. Water supply in the ex Keneta area Swamp (Quarter 14) MPPT
4. Water supply of the villages of the Sukth Municipality (Hamallaj) MPPT
5. Polluted Water Treatment Plant phase II Kavaja, Construction of a sewerage for Golem
area
BE/IPA 2009
6. KUB construction, Hamallaj Village, Manëz Municipality MPPT
7. KUZ and KUB construction in "Bulk and Lekasejve" neighborhoods MPPT
8. Construction of the main sewerage network KUZ in the beach area of Golem (Lot 1) BE/IPA 2007
9. Construction of the Outside Water Network for beach areas of Durres-Kavaja from the
Rrogozhin well drilling Lot III, water supply lines
MPPT
10. Construction of the new system KUZ in Durres beach area and the delivery line in ITUP
(Lot 2)
BE/IPA 2007
11. Improvement of water supply, Shkalle village
12. The project of the Integrated Management of Water and Ecosystem GEF,EIB,Lux
Development
13. Rehabilitation of the pipeline DN 700 mm in Fushe Kuq area MPPT
14. Reconstruction of Water Line Unaza , Durres Municipality MPPT
15. Reconstruction of the regional Water, Bubq MPPT
16. Rikonstruksioni i Ujësjellësit of villages of Lalëz, Bizë, Drraç, Shete, Rrotull MPPT
17. Increasing water quantity and systemizing of the line water connections in Fushe Kuq MPPT
18. The study of the feasibility and detailed Projects of IPA program 2007 of the European
Community in the Coast Area (associated contract).
MPPT
19. The Study of Water Feasibility Durres – Kavaja (Associated Contract). MPPT
20. The Study of the Project for Water Supply of Durres - Kavaja Beach Areas from the well
drillings of Rrogozhine (associated contract).
MPPT
Source: GDWS
V.2. Roads & Public Transport
Durres Region is one of the regions that connect better with the road network compared with
other regions of Albania. All communes and municipalities are well connected with each other.
Daily buses or minibuses work in the region. There are mini buses and buses from Shijak every
half an hour and every hour that go to Tirana or Durres, and it is directly related to Xhafzotaj,
Rrashbull, Durres and Sukth.
Katundi i Ri has daily buses that go from the centre of commune in the city of Durres or Sukth
municipality. These buses leave at 6:30 o'clock in the village of Qerret, Katundi i Ri Commune
and the last that goes in Sukth is at 15:30. Whereas the buses departing from Durres to Qerret
leaves at 7:00 and the last bus to Katund i Ri is at 17:00 . These buses work only for Qerret and
Jube villages and for the centre of the commune of Katundi i Ri. Other village like Rinia, which
is close to the sea, has its own transport ways. They use the commune only to receive any official
document or to pay taxes. They have easier passage in Durres.

64
Table 50. Transport routes in FA Durres
Manez Ishem Sukth Shijak
Katund i
Ri Durrës
Manez
Daily
MB
Daily
MB Daily MB
Daily
Via
Sukth
Daily
MB
Ishem
Daily
MB
Daily
MB Daily MB
Daily
Via
Sukth
Daily
MB
Sukth
Daily
MB
Daily
MB
Daily MB
Daily
Bus
Dialy
Bus/MB
Shijak
Daily
MB
Daily
MB
Daily
MB
Daily
Via
Durrës
Dialy
Bus/MB
Katund i
Ri
Daily
Via
Sukth
Daily
Via
Sukth
Daily
Bus
Daily Via
Durrës
Daily
Bus
Durrës
Daily
MB
Daily
MB
Dialy
Bus/M
B
Dialy
Bus/MB
Daily
Bus
Source: dldp, calculations of the authors
Table 51. The road network outside the city of Durres
DURRES K/FLLAKE RADIOSTACION (STRATEGIC) 4
DURRES DURRES BISHT PALLE (STRATEGIC.R) 7
DURRES 95%~14km /
TIRANE 5%~ 1 DURRES MARIKAJ 13
DURRES KRUJE QAF SHATME (TOURISTIC.R) 26
DURRES K/NATIONAL ROAD BILAJ (TOURISTIC.R) 3
DURRES SHKOZET SUPERSTRADE 1
Tab. 52: Buses lines for urban transportation - Durres Municipality
NAME OF LINE OPERATING FIRM TIME INTERVALS NUMBER OF
VEHICLES
Durres-Spitalle-Durres IRI TRANS 8 minutes 8
Durres-Nishtulla-Durres IRI TRANS 7.5 minutes (05:00-
23:00)
7
Durres-Currila-Durres IRI TRANS 30 minutes 3
Durres-Universiteti A.Moisiu-Durres IRI TRANS 15 minutes 4

65
Durres-Plepa-Durres MAREN BUSS 6 minutes (05:00-23:00) 12
Durres-Unaze-Kenete-Plepa-Durres MAREN BUSS 20 minutes 5
Source: Durres Municipality, calculations of the authors
Tab 53. The road network - Ishem
Road Name Length (km)
Start End Regional Communal Length (km)
Asphalt
(km)
Crossroad Shkafane Kuratj 5
Crossroad Shkafane Shkafane Center 6
Crossroad Shkafane Fushe Drac 6
Crossroad Rrotull Rotull Center 1,5
Fushe Drac Drac Koder 3
Crossroad Lalez Kurataj 3
Crossroad Lalez Shetaj 10
Qender Shetaj 2
Crossroad Biz Bush Quarter 2
Ishem Road Likmetaj 2
Ishem Road Gjuricaj 4
Bregu Lumit Kertushaj 2
Kertushaj Likmetaj 2
Kertushaj Gjuricaj 2
Gjuricaj Kullos 1
Source: dldp
Tab 54. The road network – Manez
Road Name Length (km)
Start End Regional Communal Length (km)
Asphalt
(km)
Kulle Boro 1,5
Bore Crossroad
Manez Village 1
Rade Center 2
Kameras Center 1,5
Crossroad Manez Village 2
Manez Village Hoxhe Quarter 2
Crossroad
Shkalle Shkalle Village 2
Crossroad Hamallaj Hamallaj Village 3,3
Crossroad Harmath Harmath Village 3,5
Source: dldp
Tab 55. The road network – Katund i Ri
Road Name Length (km)

66
Start End Regional Communal Length (km) Asphalt (km)
Fllake Katund Rinia 3
Katund Jube 5
Jube s Siperme Jube e Poshteme 2
Katund Jube e Siperme 2
Crossroad Sukth
Village Radioestacion 3
Source: dldp
Tab 56. The road network - Sukth
Road Name Length (km)
Start End Regional Communal Length (km) Asphalt (km)
Crossroad
Perlat Perlat Hamallaj 6
Kryq Rrushkull Kryq Hamallaj 4
Hamallaj Center Fshat Center 2,5
Center Sukuth 3
Source: dldp
Tab 57. The road network – Rrashbull
Road Name Length (km)
Start End Regional Communal Length (km) Asphalt (km)
Rrashbull Xhafzotaj 7
Xhafzotaj Pjeshkez Center 6
Kryqezim Bozinxhic 6
Rrashbull 4
Source: dldp
V.3. WASTE MANAGEMENT IN THE FA OF DURRES
At the national level - NPWM, National Plan of Waste Management 2010-2025 (NPWM)
defines 12 areas of waste in county-level, and proposes the development of 12 Regional Plans of
Waste Management (one for each region) in 2014. The objective of NPWM is recycling /
composting of 25% of waste in 2015, and 55% of them in 2020. This strategy was adopted in
2011, but must be re-seen considering the territorial reform. The plans of Shkoder, Dibra and
Tirana districts are approved. There is a pre-feasibility study for DURRES which was the first
and was completed in 2010.
The largest amount of generated urban waste is in the districts of Tirana and Durres, followed by
the districts of Fier and Vlora, referring to the annual Registry of production of urban and solid

67
waste by municipalities and regions, held by the Ministry of Transportation and Infrastructure.
LGUs in general have failed to ensure financial stability – none of the local government units is
able to provide the cover of costs independently.
V.3.1. At regional level – Regional plan for solid waste management (RPWM)
According to paragraph 8 of article 13 of Law no. 10,463, dated 22.9.2011 "On Integrated Waste
Management", the regional plan of integrated waste management is drafted by Durres District
and is approved by the Regional Council of Durres (not from Durres ARM), which then sends it
for review and approval to the Council of Ministers. Only after approval by the CoM the Plan is
effective and is published.
Durres district prepared its own NPWM, but it is not approved yet by the Regional Council. The
objectives defined in this NPWM for differentiated collection of waste in Durres Region are: a)
the differentiated collection for 20% of waste should be done within 4 years from the adoption of
the Plan; b) the differentiated collection for 30% waste within seven years from the adoption of
the Plan, and c) the differentiated collection for 50% waste within 10 years from the adoption of
the Plan. From the current official communications we don’t have official information from
Durres District Council about the drafting of the regional Project plan of the integrated waste
management.
In general, although the strategy is applied at the regional level, the role of the region in the
financing of waste management is very small. Investments and contractions in local level are
conducted by the LGUs of the first level and are monitored only during the procurement
procedure. As a result it is impossible to make a clear analysis of the funds involved.
Regarding the landfills, it was conducted a study from the Austrian consulting company ASA
and supported by IFC for the determination of a suitable place to build a modern regional landfill
for the District of Durres. This place (Area 16 of the study, Rade village, Manez Municipality) is
located in the administrative territory of Manez Municipality. On 18.11.2014, the Ministry of
Environment together with the Ministry of Infrastructure have published in the website of the
Agency of Procurement the open call to give in concessions the Landfill of Durres District
referred to the article 48 of Law 125/2013 "For Concession and Private Public Partnership ". The
bonus in the competitive selection procedure is given to society "Albania Landfill Energy
“A.L.E”. The same company has received in 2012 the “Urban waste collection” permit for
Collection, Deposit & Recycling in the same place in Manez.
Map 10. Location of the village Rade - Location 16
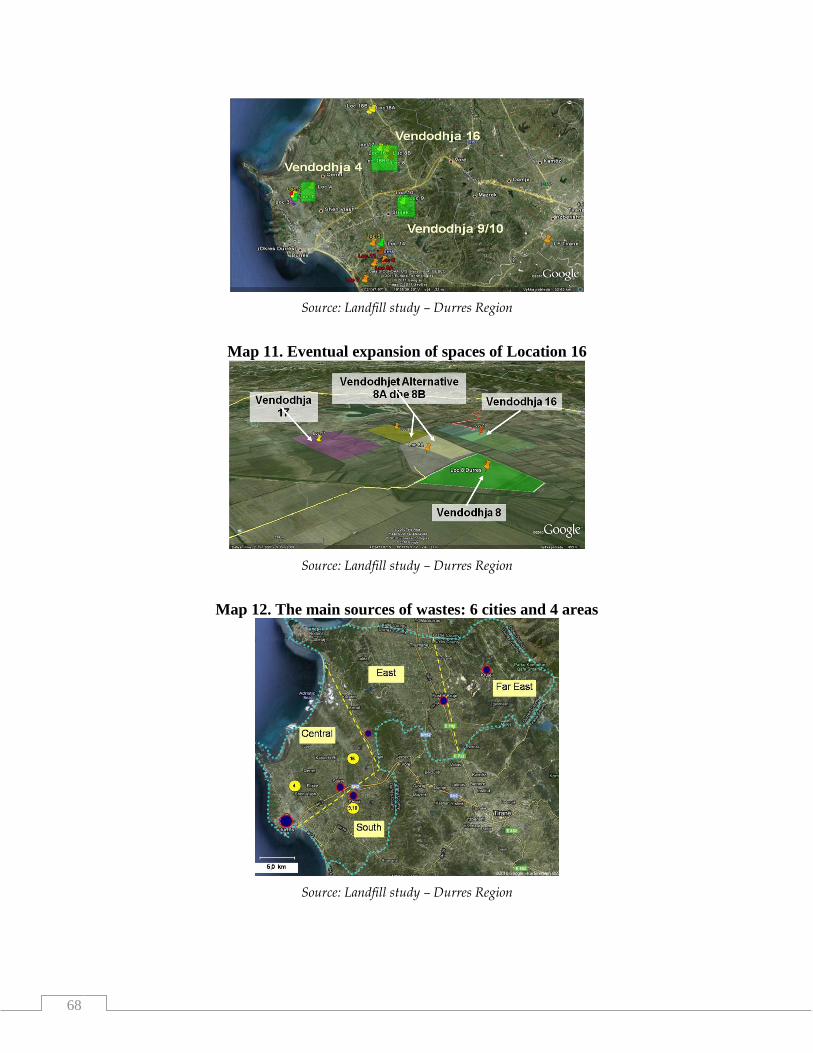
68
Source: Landfill study – Durres Region
Map 11. Eventual expansion of spaces of Location 16
Source: Landfill study – Durres Region
Map 12. The main sources of wastes: 6 cities and 4 areas
Source: Landfill study – Durres Region

69
Until the construction and the operation of this landfill, the local government units deposit the
waste arising in their administrative territory (in their temporary landfills according to the list
presented in the table below). These landfill squares (temporary landfills) actually are managed
by the local government units.
Table 58. Collection, Waste Disposal in FA Durres
LGU Method of Collection / Cleaning Deposition
Durres
Municipality
Durres Municipality has two cleaning
enterprises: NSHK Durres for Durres city
area + Spitalle and CM beach for areas
Beach + Shkozet.
VGM of Porto Romano adopted
years ago by the decision of the
municipal council and the
prefecture of Durres
Manez
Municipality
Conducts itself the waste management,
through the Department of Services
Verçok / Ex Manez Mine, Manez
Municipality
Sukth
Municipality
50% is conduct by the Municipality itself
through the Department of Services and
50% subcontracted private companies -
AFA Group
Vardardhë, Sukth Municipality
Rrashbull
Commune
It conducts the collection and the
transportation of waste itself, through the
Directorate of Services.
Porto Romano, Durres
Katund i Ri
Commune
The collection and the transportation of
waste is done by subcontracted private
company DU & CO Ltd
Porto Romano, Durres
Ishem Commune It conducts the waste management itself,
through the Department of Services
Road Turn Ishem Commune
Source: Regional Agency, Durres Region
In Durres district, it is calculated that one resident "produces" 236 kg per year, based on a
population of 414.677 inhabitants (including Kruje district). With the amount of 140.755 tons per
year of urban waste, the coastal region has 12.4 % of the annual amount in national level, after
Tirana district. Fier and Vlora are listed after Durres.
Table 59: Coverage with services Waste for the New Municipality of Durres
Years 2011 2012 2013
Ishem
No of families 2 500 2 960 2 980
No. of families
to which is
offered the
service
1 100 1 150 2 000
Rrashbull
No of families 5 562 5 713 5 821
No. of families
to which is
offered the
service
4 450 4 507 4 562
Durres No. of families 61 177 61 769 62 757

70
No. of families
to which is
offered the
service
61 177 61 769 62 757
Manez
No. of families 2 490 2 510 2 540
No. of families
to which is
offered the
service
Sukth
No. of families 6 000 6 200 6 400
No. of families
to which is
offered the
service
6 000 6 200 6 400
KiR
No. of families 3 470 3 550 3 600
No. of families
to which is
offered the
service
3 400 3 500 3 500
Source: LGUs data, calculations of the authors
Table 60. Profile of Urban Waste – New Municipality Durres
Years 2011 2012 2013
Ishem Urban waste 1800 2000 2190
Ishem Solid waste no no no
Ishem Medical waste 1 1 1,2
Ishem Urban waste 20 60 100
Rrashbull Solid waste 4 000 4 000 4 000
Rrashbull Medical waste no no no
Rrashbull Urban waste no no no
Rrashbull Solid waste no no no
Durres Medical waste 54 750 44895 31463
Durres Urban waste no no 16,665
Durres Solid waste NA NA NA
Durres Medical waste no no no
Manez Urban waste 2050 2100 2190
Manez Solid waste no no no
Manez Medical waste 30 33 35
Manez Urban waste no no no
Sukth Solid waste 13000 13500 14000
Sukth Medical waste no no no
Sukth Urban waste no no no
Sukth Solid waste no no no

71
Katund i Ri Medical waste 2880 2880 2800
Katund i Ri Urban waste no no no
Katund i Ri Solid waste 0,5 0,5 0,5
Katund i Ri Medical waste no no no
Source: LGUs data, calculations of the authors
V.3.2. At local level – local plan for solid waste management (RPWM)
Local plans are drafted and adopted by Municipalities and Communes, which in accordance with
the Law on Local Government, are the duty of Municipality Councils and respective Communes.
In the FA of Durres, only Durres Municipality has a LPWM. None of the five other units has a
LPWM. In general, the quality of these plans is controversial since they are not based on the
regional plan - in the case of Durres Municipality, the RPWM is not approved. For five other
units, we have noticed that the local level does not have the capacity to develop the plans itself
and consequently planning at the local level remains subject to donor support. On average, a
family in the city of Durres produces about 2 tons of waste per year or 5.5 kg per day (according
to calculations based on data obtained from Durres Municipality).
Durres Municipality is the main authority responsible for waste management services in Durres
and it offers these services through its two Enterprise Utilities: 1) Communal Services Enterprise
of Durres (CSED), and 2) Communal Services Enterprise of the Beach (CSEB). Both companies
are run by the Municipal Council, and funded mainly by the budget of the Municipality. They are
responsible for cleaning the city, waste collection, disinfecting, and maintenance of green spaces.
They are also responsible for street lighting and public cemeteries, providing funeral services,
decoration of the city as well as the planning / monitoring of waste management service.
Both companies have hired about 129 employees (a number that grows to 154 during high
season), use about 23 cars (for the collection and transportation) and over 1,055 containers with a
total capacity of 1,160m3, as it is shown in the table 8. On average, there are five containers per
1,000 inhabitants. The wastes are removed by 506 collection points (where there are on average
2 containers for PGM), and there are on average 263 kg / day.
For the transportation, there are 75 employees (61 employees at CSED and 14 employees at
CSEB) who use 23 cars (10 aggregates, 10 trucks, 2 pick-ups and 1 tractor) that transport wastes
on average through 2 roads a day as shown in table 10 below, according to calculations made by
CSE's. During the past 10 years at least, there has been no change in the number of cars. At each
point of waste collection, 3 labourers work.
During 2013 in Porto Romano (Waste Collection Place) are deposited in total 102.221 m3 or
64.377 tonnes. - volume which is compacted calculated (coefficient of compaction is taken 1 to
5, which means that 1 m3 compacted or compressed weighs 625 kg, this weight calculated
according to Decision No. 175 dated 19.01.2011 for Durres). These wastes are divided as
follows:
• urban waste (Urban and green) total = 96.036 m3 or 60.021 tonnes.

72
• solid waste, inert = 1,153 m3 or 1,845 tons.
• kelp waste = 5.022 m3 waste or 2511 tons.
V.3.3. Porto Romano Landfill
The Landfill of Porto Romano is the only destruction place that is used in Durres. It is
operational since 1994 and is located in the industrial zone, 4-5 km to the North, it is opened
from the beginning of the 90s and it is predicted to have a lifespan of 25 years, until 2015. The
costs for waste management in PR (cleaning, collection, transportation and disposal) are covered
by the budget of the municipality of Durres.
The landfill has been organized into 3 parcels and covers an area of 200,000 m2. It is positioned
in a sensitive environmental area - in a bog that often during the rainy season floods. The bog is
located almost at sea level and extends approximately over some 30 km2 in the North-South
direction, parallel to the coastline. All the quantity of un-separated municipal waste, a mixture of
hazardous waste with non-hazardous waste, medical waste and industrial waste together with
inert waste, end up in this landfill, not following any environmental standard.
The enterprise has 5 employees in the landfill, who work with a bulldozer that is totally
overused. The wastes are transported through a small street of the landfill; they are deposed there
and are moved with bulldozers. Many parts of the landfill are not available as a result of the
floods. The workers simply cover these areas by throwing other remains on them. There are no
basic equipments and machinery, such as the compactor. The distribution area has no bridge
scale; therefore, the operator (CSED) can only calculate the amount of wastes sent to the landfill
based on the day number of roads that makes a truck, the truck volume and standards used for
conversion rates.
Actual quantity of waste disposed per year in Durres is estimated to be in the range from 63.000
to 67.000 tons. In 2009, according to data provided by the Municipality of Durres, 101,507 tons
of waste is deposited.
In 2013, except the Durres CSE, which has deposited a total of 64.377 tons of urban waste, soil
& inert and kelp (2,511 tons of kelp), the following subjects of FA Durres have deposited:
• C.E Beach: 22,754 m3 of which (urban waste 18,000 m3, 112 m3 of soil, 4642 m3 kelp)
converted in a total of 14,335 tons.
• Rashbull Commune: 3,560 m3 urban waste or 2225 tons.
• Durres Portual Authority: 3,400 m3 urban waste or 2125 tons
• Fjona 2006 Ltd (mainly for the wastes in Port): urban waste 564 m3 or 352 tons.
• Different Private: 252m3 urban waste or 157 tons.
• Katund i Ri Municipality: 304 m3 urban waste or 190 tons.
The landfill is a state property in the possession of the Ministry of Economy, Trade and Energy
and is administered by the Municipality of Durres; however it is not registered yet in the basic
register of mortgaged properties.

73
V.3.4. Fee collection – family
Durres currently applies a symbolic level cleaning fee for families: 1,000 ALL per year for 2009,
being at least 5 times lower than the rate that applies in Tirana. The average income in Albania is
around 37,150 ALL / family / month or 445,800 ALL / family / year. According to EC standards,
the affordability percentage of waste tariff is at 0.8% of net revenue. If this percentage would be
applied, the annual fee for cleaning would be 3,566.4 ALL / family. According to the standards
of developed countries, the affordability percentage of waste tariff is 1.2% of net revenue. If this
percentage would be applied, the annual fee for cleaning would be 5,349.6 ALL / family.
The waste management service in Durres is conducted for 49,000 families, but the municipality
counts on its planning only 30,000 families to pay the service fee.
Table 61. Cleaning fees for families and the percentage of collection by the LGU, 2014
AU Annual fees (ALL) % of collection
1 Ishem 2,400 20
2 Rrashbull 500 17
3 Sukth 1,000 66
4 Manez 1,500 80
5 KiR 500 90
Source: LGUs data, calculations of the authors
V.3.5. Weaknesses of waste management
The weaknesses in the management of waste are principally associated with the lack of planning
at the regional level, depreciation and destruction of Porto Romano, as follows:
• Lack of RPWM for Durres Region;
• Lack of connection of LPWM for Durres Municipality;
• Lack of LPWM for the five LGU-s;
• LPWM does not treat Durres strategy for the management of non-urban waste,
including hazardous waste, those from construction and waste from the port;
• The very low degree of re-cycling;
• Porto Romano landfill has not: a) protective layer for the water to avoid underground
penetration of liquids flowing in landfill; b) border barriers; c) collection system for
waste infiltration; d) plant collection of surface waters (for the rain water); e) network to
collect biogases; f) daily coverage of wastes to avoid the winds and the burning of waste;
g) internal road network; h) office in landfill; i) plant for manual separation of waste. The
waste excavators stay on top of the wastes to separate waste streams that are in their
interest; j) fencing of the field; k) controlled access; and l) weighing system.

74
Tab 62. Approved Permits for 2012- 2014 for Collection, Deposit & Recycling FA Durres
Subject Administrat
or Activity Location Year
BAHITI PLAST N/A Collection, transport, recycling
plastic waste Porto Romano Durres 2014
SOMET Export Plastic waste Shkozet, Durres 2013
SHIGJETARI-B Bashkim
Hushi
Collection and storage of used oils,
lubricants
Near ex-SMT Shijak,
Durrës 2013
SERXHO Serxhio
Zeqja
Plant collection and treatment of
non-usable vehicles
Bisht Kamez Village,
Katund I Ri
Commune, Durres
district
2013
Pastrimi Detar Ilir
Karagjozi Portual waste III.2.B Durres 2013
Shijaku Shpëtim
Shijaku Scrap waste III.2.B Durres 2013
Gjyzeli Bujar
Gjyzeli Recycling used oil Durres 2013
Albasud Service Alfredo
Suares Oil accumulation Shkozet, Durres 2013
Essen Rado
Brajoviq
III.2.B Gathering, scrap processing
Used Oil Collection Durres 2013
ITAL-
LUBRIFICANTI
Arbino
Girardi Used Oil accumulation Durres 2013
Ital Lubrificanti Arbino
Girardi III.2.B. Oil accumulation Rrashbull, Durres 2013
Albasud Servise Alfredo
Suarez III.2.B. Oil accumulation Durres 2013
Scholz Arsim Muja K.III.2.B. Gathering, scrap
processing Rrashbull, Durres 2013
La Vitoria Rino Di
Fiore Depolarization, tire recycling
Porto Romano,
Durres 2012
Dawa
International
Trade
Xi Wang Plastic waste Processing Rrashbull, Durres 2012
Albania Landfill
Energia A.L.E.
Arjan
Xhihani Urban waste collection point Manze, Durres 2012
Somet Besnik
Kryekurti Floor. III.2.b. Battery recycling Shkozet, Durres 2012
Edipack Elsa Balteza Collection, paper recycling, paper Spitalle, Durres 2012

75
production
Bibliography
1. Communal Services Company ANNUAL WORK ANALYSIS FOR 2013
2. Landfill of ZONE 2, Manez. (DURRES REGION), The final treatment of solid waste.
3. Local Plan for Waste Management for the Municipality of Durres 2010-2025
4. Study for determining the territory for disposal of solid waste (Sanitary landfill in Durres,
Albania), FINAL REPORT 18.05.2011
5. Approved Permits for 2012- 2014 for Collection, Deposit & Recycling of FA Durres,
Environmental Protection Agency
6. Municipal Waste Management in Albania, Arta Kodra, November 2013
7. The main pollutions in Durres city and the impact on population Health
8. Waste 2013, Durres
9. Waste management in Albania, Prof. Dr. Pellumb Abeshi
10. The problem of pollutions in Durres, towards the solution, Telegraph Journal
11. The Strategic Environmental Assessment of the Local General Plan of Durres Municipality,
December 2012

76
V.4. URBAN PLANNING AND MANAGEMENT OF LAND IN FA DURRES
Regarding the territorial management, it is noted that the coastal landscape of the FA of Durres
has often degraded by buildings realized in the absence of a national and sectional planning.
Also, this area suffers from the planning into plots, where competences and territorial
jurisdictions are shared.
Due to its geographical position, FA Durres is part of the Coastal Intersectional Integrated Plan
(CIIP) that will serve as the regulatory system to ensure standards in planning and ensuring
quality instruments that provide tourist services. These shortages have aggravated the situation
on the ground and degraded the coastal landscape. The vision that will define the Coastal
Intersectional Integrated Plan (CIIP), will establish a fair proportion and balances between the
development objectives according to the perspective of government policy, the right for
development and natural resources in the territory. This process will have in focus the change of
the current situation in the coastal area, by legislating and implementing a new vision, through
the application of legal and urban instruments, that will realize the challenges, by well-managing
country's potentials and giving great quality to the development of tourism.
Also, the FA of Durres is part of the Tirana-Durres Plan which is an integral part of the National
General Plan. Tirana and Durres are cities that have had an extension in their space and the
tendency is that these cities meet. The area in between is one of the areas that has had a rapid
formal development and mostly informal. Chaotic and visionless developments have damaged
the natural landscape, so there is a need for an integrated plan with a clear vision. Tirana-Durres
plan will guide the use and exploitation of the area and will create the adequate infrastructure for
a sustainable development.
Local units that have adopted IPV in CPT are Durres Municipality and Ishem Commune.
However, developments not in accordance with the approved plan are recorded in Durres
municipality and Ishem commune, whose visions and policies of their territorial development
include capacity building of services supportive to tourism, agriculture, as integral part of the
Western Plain, increasing of the economic services organized along the accesses of the main
urban roads of suburb residential areas.
The municipalities and the big cities, which have the most massive development tendency, often
risk to have less transparency in the multitude of their developments. This phenomenon is
translated into abuses of informal developments as shown by statistics provided by ALUIZNI,
where major cities are listed, specifically, those that have the highest number of informal
buildings, such as Durres, Tirana, Shkodra, Vlora, etc.
In 2013, there were 4,574 self declaration in the District of Durres. In cooperation with other
state institutions, local government units, as well as interested parties during the last quarter of
2013, INUK has taken actions to verify the construction situation as well as the execution of
decisions for destruction. In support of I.N.U, near Durres municipality were executed during
2013 and 2014: a) 13 decisions for destruction, and b) 6 Decisions of fine punishment.

77
ALUIZNI Office of Durres district distributed on February 14, 2015, about 1,050 legalization
permits for county residents, of which 620 for the territory of the New Municipality Durres.
Meanwhile, it is announced that are being made more than 1000 other permits that are expected
to be distributed in a few days. Sources from the Agency said that, this area is expected to have
2500 legalization. CEO of ALUIZNI, Artan Lame, at the start of the meeting said that "Durres
Region is one of the regions that have more informal buildings after Tirana, because of the great
movements of thousands people in all these years1." Legalization permits for the District of
Durres issued in February 2015 are: Durres - 1; Katund i Ri - 43; Rrashbull - 482; Sukth – 17;
Manez - 77.
Map 13. Geographical Distribution (in yellow) of Informal Areas of FA Durres
Source: ALUIZNI
In total the Municipality of Durres has an area of 1,420.00 ha in Informal Areas / Informal
Settlements, of which 1,157.6 ha belong to Durres Municipality and 262,4 ha belong to
Rrashbull Commune.
Among urban projects approved by LPWM Durres, can be mentioned:
• Urban regeneration of Shkozet area (currently mix of housing and industry). The strategic plan
for an area of 100 ha provides the re-integration with the urban network, including houses and
small production units (family enterprises). All activities of the secondary sector, scattered
throughout the city including Shkozet, will be located in the Industrial Park
1 http://www.mapo.al/2015/02/legalizimet-lista-me-1050-emra-per-durresin/

78
• Urban Regeneration of “Durres i Ri” area (former swamp). “Durres i Ri”: residential area with
young dynamic population that needs urban renewal. With the projects for the rehabilitation of
the infrastructure, such as: '' Building of the Water Supply System '', '' Rehabilitation of Old
Canals System '' this new area of the city will be incorporated with the rest, becoming one body
with its infrastructure system.
• The recovery of the historic city centre. An integrated restoration where, in addition to urban
aspects and architectural values, will be taken into account economic and social aspects of
cultural heritage;
• Integration of new residential areas with older areas in Porto Romano. The new project of the
“Unaza e Re” tends to limit the traffic of heavy vehicles and a part of private vehicle traffic in
the central area of Durres that surrounds the main residential area in the city.
• Feasibility study and urban rehabilitation of the beach area includes “Revitalisation of Koder
Vila and “Brezit te Gjelber of the city”, which aims to avoid further erosion.
• In the coastal areas between Port and Kavaja, the pedestrian boulevards will stretch into the
promenade area in the north and south of the city of Durres, as to the Currila area and also to
Plepa beach.
• Requalification of the area near the Port, the road Project "March 91 '' & Blue Line” & the
restoration of the sea-city connectivity that was lacking until now in Durres. The port area will
be the destination for many tourists in the future, with a port that has tourist function, a rest area
and a place to organize diverse cultural events. The existing trade port will be moved to Porto
Romano, so Durres can host sailing boats, yachts, large passenger vessels and private sport boats.
• The fishing Port should be intertwined with Tourist Port, where every element should be well
designed and detailed depending upon the Tourism and the city.
Also, the County Council of Durres, the Territorial Adjustment Council decided on 01.1. 2008
for the approval of the master plan entitled "The integrated development (in synergy) of
energetic and industrial area of Porto Romano, Durres, infrastructure and its contours".
Table 63. Value of Land by category – Manez, Sukth and Rrashbull
MUNICIPALITY /
COMMUNE
LOCAL UNIT /
Villages
BUILDI
NG
VALUE
(ALL /
m2)
LAND
VALUE
(ALL /
m2)
AGRICU
LTURAL
LAND
VALUE
(ALL /
m2)
PASTU
RES
MEADO
WS
VALUE
(ALL /
FORES
T LAND
VALUE
(ALL /
m2)

79
m2)
MANEZ
MUNICIPALITY
MANEZ
MUNICIPALITY 40,400 786
ARMATH 739 408 177 21
BORC 739 352 152
HAMALLAJ 369 447 194
KAMERAS 739 788 342 21
KUCOK 2216 744 323
RADE 554 842 365 21
SHKALLE 923 357 155 21
RRASHBULL
COMMUNE HARTE DWG x x x x
SUKTH
MUNICIPALITY
SUKTH.
MUNICIPALITY
ZK 3542 41,500 2983 x x x
VADADHE ZK
3690 647 339 151 x
KULLE ZK 2321 x 339 151 x
RRUSHKULL
ZK 3241 2317 339 151 182
HAMALLAJ ZK
1925 475 330 151 182
Bibliography
1. Urban Planning & Land Management, The County Council of Durres, The Council for
Territorial Adjustment
2. National Agency for Territorial Adjustment, Annual Report 2013-2014
3. Master Plan of the Centre of Durres, 14 February 2007
4. Structural Plan. Durres Municipality, 20 February 2010
5. Territorial Policy Planning, Municipality of Durres
6. Selection of the Winner of "South coastline", and Economic Corridor Tirana - Durres,
19/11/2014, Journal Tema
7. Development Alternatives in Rural and Unfavourable Areas in the Coastal Area of Ishem -
Porto Romano for a Sustainable Development, M. Sc. Shkelqim Sirika, October 2013
8. Plan for Tourism Development, Ishem Commune, June 2009
9.ALUIZNI: http://www.aluizni.gov.al/wp-content/uploads/2014/12/ZONAT-
INFORMALE_Page_2_PHOTOSHPED.jpg
VI. ORGANIZATION OF LOCAL GOVERNMENT SERVICES IN FA DURRES
According to the data obtained by LGUs of FA Durres, the current local government units have
the following composition:

80
• Durres Municipality: 238 employees (including civil status and NRC);
• KiR Commune: 28 employees;
• Manez Municipality: 26 employees;
• Sukth Municipality: 46 employees;
• Rrashbull Commune: 54 employees;
• Ishem Commune: 40 employees.
The current structure of Durres Municipality, which will be the administrative centre of the New
Municipality of Durres, includes:
• The Mayor;
• The Cabinet: 3
• The Sector of Relations with the public: 2
• The Directory of Human Resources: 20
• The Directory of planning & control of the development of territory: 23
• The Directory of local taxes and fees: 33
• The Directory of development policies: 8
• Economic Department: 17
• The Directory of Education-culture-youth-sports, and religious communities: 15
• Department of services: 11
• Department of Social Services: 14
• Municipal police: 20
• Administrative Centre Nr. I: 3
• Administrative Centre Nr. II: 3
• Administrative Centre Nr. III: 3
• Administrative Centre Nr. IV: 3
• Administrative Centre Nr. V: 3
• Administrative Center Nr. VI: 3
• The Inspectorate of Urban Construction: 14
Current representation of LGUs in the County Council is as follows:
• Durres Municipality: 8 representatives
• Sukth Municipality: 3 representatives
• Manez Municipality: 3 representatives
• KiR Commune: 3 representatives
• Ishem Commune: 2 representatives
• Rrashbull Commune: 3 representatives
VI.1. Profile and main services provided by LGUs
The realization of the objectives assigned by legal obligations for the functions and services that
local units must provide to their communities, depend to a significant extent on the level of
education and commitment of decision-makers (municipal or communal councils) and on the
local administration. If you read carefully the following graph 5, it emerges that one of the

81
factors leading to attractive results for the community of Durres city, is the composition of the
Municipal Council, where 90% of the members have higher education. But there are also cases
where the commitment and the accountability of the Mayor, minimizes the negative effect of the
low level of education, as in the case of Manze Municipality. Its administration has only 28%
employees with higher education and its municipal council only 41 %.
Graph 11. Specific weight of higher education in administration and councils of FA Durres
But an even greater role in the performance of community services plays the number of human
resources that deal with the administration and the number of employees in the services that are
available in local units.
There is not a standard defined at national level or by category of local units for this purpose.
Therefore you cannot judge which one responds better or worse. For example in the graph 6, it
results that Ishem commune has a better performance, even compared to Durres municipality.
This is a consequence of the system of determining the number of wage fund which is limited
and controlled by the central government as a contributor to the grant. Therefore, in the context
of a FA, it must be determined first what will be the standard, how many administration
employees and service employees must be in one functional area for it to achieve the standard
(missing) of services provided to the community. Accordingly to the following graph, we are
doing a comparison to understand the essence and the necessity of standardization.
Graph 12. The charge of administration employees and service employees

82
Recently, Durres Municipality is twinned with Thessaloniki Municipality. Even the functional
area of Thessaloniki consists of 6 local units under the reform of 2011, but these units have
separate budget and balance. The Municipality itself, part of Thessaloniki FA has about 343
thousand residents (Durresi 208 thousand), it has a budget of 423 mln €, and a GDP / capita of
17200 €. Comparative charges are:
Graph 13. The charge of administration employees and public services in Durres and
Thessaloniki Municipality, no / 1000 residents
Regarding the level of qualification, there is a high percentage of employees with high education
in Katundi i Ri and Durres.
Tab 56. The level of the Education of Employees in FA Durres

83
Local
Unit
%
of
emplo
yee
s
wit
h
hig
h
educa
tion
in
the
adm
inis
trat
i
on
%
of
counci
lors
wit
h
hig
h
educa
tion
Durres 60,4 90,0
Manez 28,0 41,2
Ishem 50,0 26,7
Katund i
Ri 68,0 58,8
Sukth 14,0 28,0
Rashbull 32,3 56,0
VI.2. Budget of LGUs of the FA Durres
All the six units of Durres functional area have received ALL 650,876 in 2014 and have
budgeted, with the new fiscal law in 2015 a total amount of 591,898 ALL. As it can be seen, the
unconditional transfers for 2015 to the FA Durres, are predicted with a total reduction of about
9% as shown in detail in the following table.
Table 64: Unconditional transfers for Municipalities and Communes of FA Durres 2014
(fact) & 2015 (plan)
LGU Unconditional
transfers 2014
Unconditional
transfers 2015
(plan)
1 Durres 437,906 428,804
2 Manez 31,828 24,289
3 Sukth 69,480 57,460
4 Rashbull 56,808 41,340
5 Katund i Ri 32,083 23,398
6 Ishem 22,771 16,607
Source: Law Budget 2014, No. 185/2013 date 2.12.2013 and
Law Budget 2015, No. 160/2014; Calculations of the authors
If you carefully read the table above, it results that Durres functional area, for 2015 has a funding
source of unconditional transfers about ALL 160 mln or about 27% less than in 2014. This may
be a consequence of the financial difficulties of central government, but essentially it does not
stand. When realizing a new reform, minimally the unconditional transfer should remain at the
level of last year to maintain the standard of services of individual units of the FA, otherwise the
fall of this standard would prejudice the primacy of the reform itself related to the growth of
quality services for the community.
Tab 65. The composition of Incomes 2013 - FA Durres (ALL .000)

84
Local
Unit
The total of
Independent
budget
2013 (000/
lek)
From : The report
in% of the
local
incomes /
Tot.
budget.
Grant
2013
(000/ lek)
Local
incomes
in
000/lek
Durres 1,464,234 360,234 1,104,000 75.4
Manez 42,021 29,521 12,500 29.7
Ishem 171,085 21,085 150,000 87.7
Katund i
Ri 64,256 31,038 33,218 51.7
Sukth 109,455 62,129 47,326 43.2
Rashbull 179,752 54,752 125,000 69.5
Source: Ministry of Finance; Respective LGUs, Calculations of the authors
Graph 14. Incomes of the LGU (2013) – Durres FA (ALL.000)
Source: Ministry of Finance; Respective LGUs, Calculations of the authors
With an average of 68.4% as a functional area, of the report of its own incomes to the total of
incomes in disposal, this can be considered as the most efficient functional area at national level.
Tab 66. The composition of expenses FA Durres - 2013 (ALL .000)
Local
Unit
administrative
expenses in
000/lek
(F.Page +
social
insurance.+
operative
societies.)
Expenses
for 1000
inhabitants
(000/lek)
The report
of
expenses
and
incomes
(F.p. +
insurance
+so.op.)
in % to
the tot. of
expenses
The charge of
administration
(number of
employees)
for 1000
inhabitants
Investment
in % /
independent
budget
Durres Manes Ishem K.i Ri Sukth Rashbul Mes ZF
75,4
29,7
87,7
51,7 43,2
69,5 68,4
Report of its own incomes to the total of incomes in disposal, in %

85
Durres 156,977 754 45.3 1,2 14.2
Manez 19,473 1,699 74.6 4,4 78.7
Ishem 21,512 2,418 15.3 4,7 47.7
Katund i
Ri 13,256 851 48.5 1,6 63.3
Sukth 34,822 1,297 31.8 3,2 51.7
Rashbull 46,960 1,612 43.9 3,3 46.3
Source: Ministry of Finance; Respective LGUs, Calculations of the authors
Graph 15. LGU expenses (2013)
Source: Ministry of Finance; Respective LGUs, Calculations of the authors
But the positive phenomenon highlighted above related to the economic efficiency of the units of
the FA of Durres, does not fully respond to the financial evidences expressed graphically above.
At a first sight, it appears that around 57% goes for capital investments and 43% for operating
expenses. But, if it is divested from capital expenditures the invested part, by the central
government or by the donors, which currently are presented and accounted in an indicator and
that occupy about 62% of the capital investments, then it appears clearly that the expenses for
salaries and operating have the part of the "lion" in the total revenue.
Table 67. The report between the LGUs budgets with the average of LGUs budgets of
Durres District
TR/TAR
Durres District
2011 2010 2009
Durres B 826% 996% 798%
Manez B 35% 29% 55%
Sukth B 78% 63% 76%
Rashbull K 114% 90% 96%
Katund i Ri K 46% 45% 38%
Ishem K 26% 22% 34%
Source: Ministry of Finance; Respective LGUs, Calculations of the authors
45,3
74,6
15,3
48,5 31,8
43,9 42,8
Salaries and operational expenditures compared to
total incomes in the FA Durres, in %

86
Graph 16. LGU budgets: 2011-2014
Source: Ministry of Finance; Respective LGUs, Calculations of the authors
By analysing the budgets of 2015, we noticed that the specific weight of Durres functional area,
versus the average of the years 2011-2014 has been reduced from 58% to 53.2%. All the units
of the area have had discounts, but apparently here the reduction has been more emphasized than
in the other parts of Durres district.
Graph 17. The budget of Durres FA / Durres District 2015
Durres 32.9%
Manze 5,3%
Sukth 7%
Rashbull 8.8%
Ishem 1.7%
K. i Ri 2,3%
Others 42%
Specific weight of the LGU budgets of FA Durres /total,
average 2011-2014, in %
53,2% 46,8%
Budget of Durres FA in % compared to Durres Region, for 2015
FA Durres Others

87
Source: Ministry of Finance; Respective LGUs, Calculations of the authors
Tab 68. LGUs own incomes per capita compared to the average of LGUs incomes in
Albania
OSR /AOSR per capita
Durres District 2011 2010 2009
Durres 149% 152% 180%
Manez 39% 51% 35%
Sukth 39% 43% 41%
Rashbull 179% 164% 173%
Katund i Ri 58% 99% 22%
Ishem 35% 54% 102%
Source: Ministry of Finance; Respective LGUs, Calculations of the authors
Table 69. The total expenses of LGU per capita compared to the average at country level of
expenses/ resident
TE /ATE per capita
Durres District 2011 2010 2009
Durres 139% 135% 81%
Manez 51% 62% 120%
Sukth 68% 59% 66%
Rashbull 122% 102% 101%
Katund i Ri 89% 79% 65%
Ishem 117% 98% 288%
Source: Ministry of Finance; Respective LGUs, Calculations of the authors
It is normal that most of taxpayers are in Durres (though the population there is bigger), but the
disproportionately with Rashbull in the extent of 60% knowing the intensity of Rashbull area,
shows the negligence in their collection, just as it is unjustified by the free survey that Ishmi
collects nearly 4 times more than Katundi i Ri.
In this regard, the disproportionately on the contribution of property taxes can be also
commented, but nevertheless here it is noted, as it should normally be, an approximate level
between Durres Municipality and Rrashbull Commune. To be more accurate in this case, Durres
Municipality emerges more backward (negligent) as it can be read in table 58.
Table 70. Incomes from property taxes for inhabitants according to LGUs of Durres
district, compared to the national average / resident
Property tax / inhabitant
Durres District 2008 2009 2010 2011
Durres 6,04 5,51 5,17 5,48
Manez 0,66 0,73 0,69 0,73
Sukth 0,71 0,74 0,95 0,92

88
Rashbull 4,84 5,22 5,61 6,63
Katund i Ri 0,62 0,25 1,37 1,16
Ishem 1,60 2,19 4,88 3,71
Source: Ministry of Finance; Respective LGUs, Calculations of the authors
The detailed analysis in this respect, for Durres functional area and as for all units, shows that the
main reserves and the decisive source of incomes in the future remain the property and land tax.
VI.3. DEVELOPMENT AND INTEGRATION STRATEGIES 2014 - 2020 & LOCAL DEVELOPMENT PLAN
VI.3.1. Compliance with sectoral strategies 2014-2020
The sectors identified above are generally in line with the national strategic objectives set out for
their development by the Albanian government.
Thus, in the draft "Strategy of business development and investments for the years 2014-2020" ,
the Ministry of Economic Development, Trade and Entrepreneurship defines as one of its
objectives for the development of processing industry "Objective 2.2.3: Strengthening and
further diversification of operations of active processing (fason)". In this strategic document it is
stated that "The achievement of this objective will be realized through financial support for
human capacity building, for textiles and footwear producers, in order to establish independent
enterprises and direct exporters. Also, the government will stimulate the diversification of the
direct processing into other sectors, such as mechanical products, fitting joints or electronic
equipment, by drawing high-tech manufacturer. "
In the Strategy for Public Financial Management 2014 - 2020 (pp. 34, 53 and beyond), the
modalities of coordination of finances of local government after the entry into force of the
administrative and territorial reform and the decentralization strategy, are explained in details.
Regarding the development of transport and storage, there is not any current strategic document
which can elaborate the medium-term directions planning on this sector.
Regarding the accommodation and gastronomy sector / tourism, the "Draft-Strategy of Tourism
Development in Albania 2014-2020" prepared by the Ministry of Urban Development and
Tourism, which is in the process of revision defines four key strategic areas of tourism and
tourism products that will be created in the next years. Specifically, in the framework of strategic
management 1.2: Cultural tourism, the strategy intends to "Improve the offer on cultural tourism
and in tourist destinations, there is a wide range of products and tourist attractions entertaining
and marketable of cultural tourism. Touristic points and cultural tourism offers are famous and
consolidated in the main resource markets. "Also, strategic direction 1.3: The nature and rural
tourism aims to" Develop the nature and rural tourism. There is an attractive range of touristic
products of special interest in selected destinations with attractive natural potential and

89
traditional villages with an authentic lifestyle. The nature and rural tourism offers are well
known and consolidated in the main resource markets".
In the document of Medium-Term Budget Program (MBP) 2014 - 2016, FA Durres is mentioned
as an investment destination, with the main ones mentioned as follows:
• Sea port: The development of Durres Port according to the Land - Lord Port model (Port Land
Management) and the construction of container processing terminals with concessions etc;
Commercialization of port & privatization of services; The rehabilitation of the Infrastructure
and Superstructure of Durres Sea Port, about 85% for 2016; and construction of the fishing port
in Durres;
• Road infrastructure: road connection Porto Romano - Durres; Bypass Plepa - Kavaja and Plepa
- Rrogozhine; A. Goga street - former Chemical Enterprise; Bypass of Shkozet; re-construction
of the Ring Road of the city; Study-projection for the closure of the existing landfills of solid
waste in Durres;
• Waste & sewerage: Rehabilitation of existing field of solid waste in Durres and start of work
for the rehabilitation of the existing fields of solid waste; The purification plant of Durres above
30 ha has a value of 11 million Euros and a treatment amount 700 l / sec. The completion and co
laudation of three objects in Durres, Sanitation "Construction of sewerage network of KUZ in the
beach area Durres (Perroi i Agait Ura Dajlani) and the transporting lines, Water supply in the
beaches of Durres - Kavaja from Yermes sources Loti II ; etc.
Also in its meeting of 14 February 2015, the government has approved three projects with
significant values for Durres Municipality. More specifically, for this municipality, the
government has given ALL 250 million only for the project of expansion of ‘Independence’
boulevard and for the construction of access roads to the beach. Two projects regarding the
facades of city buildings and the activation of city's main pool are also approved. The
government has given other ALL 100 million (a total of ALL 350 MIO) for both these projects.
VI.3.2. List of strategic plans of the AU
In general, the municipalities and communes of the FA of Durres have study documents that
analyze their profiles and provide future development scenarios. However, except Durres
Municipality that has a full and coherent panorama, other LGUs have partial documents, which
in most cases are approaching to the deadline expiry which is 2015.
In particular:
• Durres Municipality and Ishem Commune have an approved territory plan
• Durres Municipality, Ishem Commune and Rrashbull Commune have an official economic
development plan. Sukth Municipality has a research analysis on the economy and
transportation.
• Only Durres municipality has an approved local plan of waste management.
• Only Durres Municipality has a Strategic Environmental Assessment;
• Manez Municipality has prepared the urban regulatory plan (including Landill) but it is not
approved.

90
Below there are mention some major projects with interest for FA
Durres. Spitalla Area of a surface of 850 ha will turn into an Industrial Area - Free Trade Zone.
The document is being prepared by AIDA and the respective DCM is expected to appear soon.
Katundi i Ri. This area includes disadvantaged territories regarding the natural and economic
side, like the non-productive and polluted agricultural land by the former chemical Factory in
Durres, which is also affected by sea erosion. This area, regarding the administrative side is part
of the commune of Katundi i Ri and the selected area consists of an surface of 1,367ha, of which
810 hectares belong to the Energetic Park. In the disadvantaged territories are included 1166
hectares of agricultural badlands, 45 hectares of forest area, 114 hectares of regional land, and 42
hectares of buildings and in general the area is characterized by marshy places with very poor
quality. The centre of expansion of the industrial energetic park is the fuel deposit areas in Porto
Romano, the opposite of the reason the place was build for: processing tank vessels that transport
oil, gas and their products.
Biological Park. This development model, if applicable, expresses his potentials in a
disadvantaged area without vegetation, with non-productive land, exposed to erosion and to
destructive effects of nature due to the inappropriate interference and with the right investments.
The area where the project is expected to be implemented consists in a wet area between the strip
of sand and the first strip of pine along almost the entire coastline of Ishem-Porto Romano. The
area where this development project will be applied includes a non-productive flat area of 382
ha4, bordered to the North by the river Erzeni, and to the West, 150 m from the sand belt, to the
East by the first strip of pine. This area is chosen to be transformed into an intensive, social,
economic and environmental development area. The advantage of this location consists of
favourable climatic conditions, geographical location and the access to the Adriatic Sea.
Ishem. "Lalzi Bay Resort and Spa" is applicable to the coastal area located in rural and
unfavourable territories. This resort is being built near the Lalzi Bay in Hamallaj. This project is
part of the Master Plan for development of tourism in Lalzi Bay near the built touristic village or
in construction process as it is "Lura", "Fisherman". A considerable number of residents will be
employed directly or indirectly as the project will enable the development of other economic
activities, particularly agriculture and farming.
Map 14: Map of Territory Management Ishem - Porto Romano

91
Manez
The development plan is focused on the development of the Landfill, the construction of a
cultural, sport and artistic complex, and on the construction of a modern area, bordering Lalzi
beach.
Bibliography
1. http://www.instat.gov.al/media/247026/regjistri_ndermarrjeve_2013.pdf
2. http://www.instat.gov.al/media/198058/regjistri_ndermarrjeve_ekonomike-2012.pdf
3. http://www.instat.gov.al/media/204741/llogarit__rajonale_n__shqip_ri_2011_final.pdf
4. http://www.instat.gov.al/media/251556/llogarit__rajonale_n__shqip_ri_2012.pdf
5. Labour Market Bulletin, NES 2013
6. CONCLUSIONS OF SURVEY AND BUSINESS MEETINGS FOR THE TERRITORIAL
ADMINISTRATIVE REFORM, CONFINDUSTRY-STAR PROJECT, JUNE 2014
7. Strategic Plan for Economic Develoment 2005-2015, Municipality of Durres, by FLAG
8. Tourism Development Plan. Ishem Commune, FShZH, ISB, June 2009
9. Development Alternatives in Rural and Unfavourable Areas in the Coastal Area of Ishem-
Porto Romano for a Sustainable Development, M .Sc. Shkëlqim Sirika, Academic Journal of
Interdisciplinary Studies, Oct. 2013
10. Towards a Sustainable Development of the Tirana - Durres Regions. Regional Development
Study for the Tirana - Durres region, by GTZ and Institute of Ecological & Regional
Development, Dresden, Tirana 2002

92
11. Medium Term Budget Program Project 2014- 2016, Ministry of Finance, December 2014
12. Statistical Bulletin 2013, Durres Municipality
13. Durres Municipality Budget, 2014
14. Sectional policies, NSDI 2014-2020, Public Policy Repository, Shtetweb.org
15. Business Book, Chamber of Commerce and Industry, Durres
16. KUZ Performance Report 2013
17. KUZ projects in Durres Area: http://www.dpuk.gov.al/qytet.php?id=5&l=1
18. AKPT 2013: http://planifikimi.gov.al/sites/default/files/Raporti_Vjetor_formatA4.pdf;
19. Development Plan Tirana - Durres: http://planifikimi.gov.al/content/plani-tirane-durres-ptd;
20. Integrated Inter-sectional Plan for the Coast: http://planifikimi.gov.al/content/plani-i-
integruar-ndersektorial-per-bregdetin-pis
21. ADF (roads funded by FShZh):
http://www.albaniandf.org/Resources/Publikime/Raporte/Raporti_vjetor_2013_final.pdf
22. The Prime Minister who is nostalgic for Adem Reka, Newspaper Tema 24 December, at
http://www.gazetatema.net/web/2014/12/24/kryeministri-qe-ka-nostalgji-per-adem-reken/
23. WATER RESOURCES AND IRRIGATION PROJECT, Project ID No. P121186, Loan No.:
IBRD 82110
24. "Urban Forums, Peleshi in Lezha: The government offers financial and technical assistance
for the project design" SOT newspaper, 21 November 2014 at:
http://www.sot.com.al/politike/forumet-urbane-peleshi-n%C3%AB-lezh%C3%AB-qeveria-
ofron-asistenc%C3%AB-teknike-dhe-financiare-p%C3%ABr-hartimin#sthash.olQsXRnd.dpuf
25. The national sectional strategy of water supply services and sanitation 2011 to 2017, the
Ministry of Public Works and Transport
26. Environmental Impact Assessment Report, Draft for Consultation, Ministry of Public Works
and Transport
27. KUZ Durres - Consumer Practice measurement, Ing. Edlira HYSA
28. Draft Management for Irrigation and Drainage
29. Results of consultative meetings with LGUs Functional Area Durres, October - November
2014
30. Religious Tourism, Albanian innovation, 21 November 2014, Newspaper Tema
31. ACTION PLAN FOR DURRES FUNCTIONAL AREA
32. DLDP ACTION PLAN FOR DURRES FUNCTIONAL AREA
33. Report Durres District, Second delineation of the functional Areas
34. The Functional Area Programme- Focus on the Functional Area Analysis, Tirana, October
3d, 2014.
35. Haxhinasto: Railway Line Tirana-Rinas-Durres is a priority | NEWSPAPER DITA 07/10/14
36. Strategy for Public Financial Management 2014-2020 (pp. 34, 53 and beyond), REPO
Shtetiweb.org
37. Business Growth & Investments Sectional Strategy2014-2020, REPO Shtetiweb.org
38. KUZ Durres Financial Statements 2012.
39. KUZ Durres Audited Financial Statements for the Accounting Period, ended in 31 December
2013, together with the Auditors Report