Third Quarter of Fiscal 2020 Earnings Presentation
15
Applied Materials External Third Quarter of Fiscal 2020 Earnings Presentation AUGUST 13, 2020
Transcript of Third Quarter of Fiscal 2020 Earnings Presentation

Applied Materials External
Third Quarter of Fiscal 2020
Earnings Presentation
AUGUST 13, 2020
| Applied Materials External
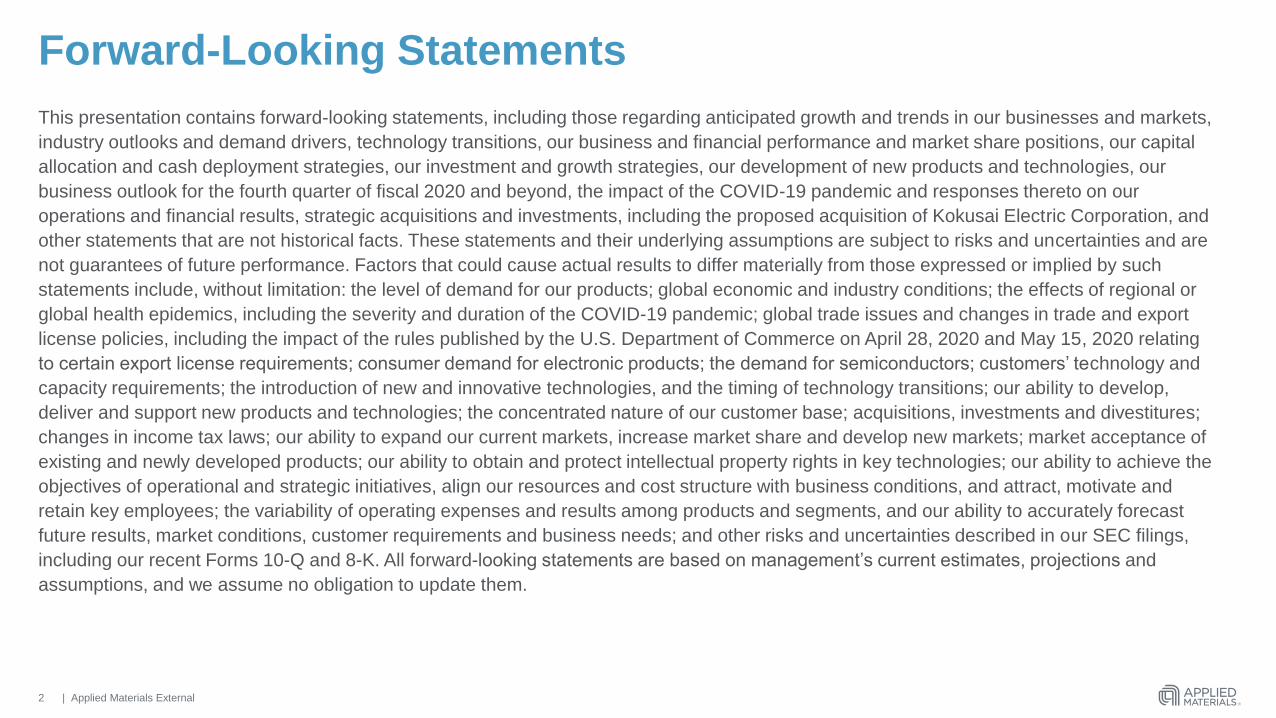
Forward-Looking Statements
This presentation contains forward-looking statements, including those regarding anticipated growth and trends in our businesses and markets,
industry outlooks and demand drivers, technology transitions, our business and financial performance and market share positions, our capital
allocation and cash deployment strategies, our investment and growth strategies, our development of new products and technologies, our
business outlook for the fourth quarter of fiscal 2020 and beyond, the impact of the COVID-19 pandemic and responses thereto on our
operations and financial results, strategic acquisitions and investments, including the proposed acquisition of Kokusai Electric Corporation, and
other statements that are not historical facts. These statements and their underlying assumptions are subject to risks and uncertainties and are
not guarantees of future performance. Factors that could cause actual results to differ materially from those expressed or implied by such
statements include, without limitation: the level of demand for our products; global economic and industry conditions; the effects of regional or
global health epidemics, including the severity and duration of the COVID-19 pandemic; global trade issues and changes in trade and export
license policies, including the impact of the rules published by the U.S. Department of Commerce on April 28, 2020 and May 15, 2020 relating
to certain export license requirements; consumer demand for electronic products; the demand for semiconductors; customers’ technology and
capacity requirements; the introduction of new and innovative technologies, and the timing of technology transitions; our ability to develop,
deliver and support new products and technologies; the concentrated nature of our customer base; acquisitions, investments and divestitures;
changes in income tax laws; our ability to expand our current markets, increase market share and develop new markets; market acceptance of
existing and newly developed products; our ability to obtain and protect intellectual property rights in key technologies; our ability to achieve the
objectives of operational and strategic initiatives, align our resources and cost structure with business conditions, and attract, motivate and
retain key employees; the variability of operating expenses and results among products and segments, and our ability to accurately forecast
future results, market conditions, customer requirements and business needs; and other risks and uncertainties described in our SEC filings,
including our recent Forms 10-Q and 8-K. All forward-looking statements are based on management’s current estimates, projections and
assumptions, and we assume no obligation to update them.
2

| Applied Materials External3
APPLIED MATERIALS AT-A-GLANCE
$16.3 billionTTM REVENUE
~23,600**
employees
in 18* countries
~13,300*
active patents
$2.2 billionTTM R&D
INVESTMENTS
REPORTING SEGMENTS
Semiconductor Systems
Applied Global Services
Display and Adjacent Markets
CURRENT FISCAL
YEAR ENDS
25 October 2020
FOUNDED
1967
FIRST PUBLIC
OFFERING
1974
* As of fiscal year-ended 10/27/19. **As of 7/26/20. TTM is trailing twelve months

| Applied Materials External4
3rd Fiscal Quarter Near-term / Year Longer-term
Operating at pre-COVID
productivity levels in R&D
and manufacturing
Double-digit Y/Y growth in
all segments
Anticipate record fiscal
year for semi and services
revenue (at mid-point of
4QF20 guidance)
Semi demand is
strengthening with
customers committed to
ramping fabs and driving
R&D roadmaps
Outperforming WFE
market overall and fastest
growing company in Etch
and Metrology / Inspection
Mindful of potential
macro-economic
headwinds
Digitization accelerating
with WFH, SFH, on-line
shopping and business
continuity trends
AI mega-trend remains
on track and non-
discretionary
STRONG MARKET AND BUSINESS OUTLOOK

| Applied Materials External
Q3F20 STATUS
▪ Stringent protocols in place to keep workplaces safe and healthy
▪ Recovered pre-COVID productivity levels in R&D labs and
manufacturing operations
▪ Actively managing logistics challenges
▪ Driving “innovate anywhere” vision and advanced remote support
including video, AR, VR and Live Distance Learning
GUIDING PRINCIPLES
1. Maintain trust of employees, customers, suppliers and partners
2. Drive actions that allow us to emerge stronger over the long term
COVID-19 RESPONSE
5

| Applied Materials External
Applied has broadest portfolio of products and
technologies to accelerate new PPACt playbook(PPACt = Power, Performance, Area-cost and Time-to-market)
6
ENABLED BY
Advanced packaging
New structures / 3D
New ways to shrink
New architectures
New materialsPPACt
POWER
PERFORMANCE
AREA-COST

| Applied Materials External7
Q3F20 Non-GAAP Financial Results
$M, except EPS Q3F19 Q2F20 Q3F20 Y / Y Q / Q
Revenue 3,562 3,957 4,395 23% 11%
Gross Margin* 44.0% 44.6% 45.0% 100bps 40bps
Operating Income* 820 976 1,160 340 184
EPS* $0.74 $0.89 $1.06 $0.32 $0.17
Operating Cash Flow 787 635 867 80 232
Free Cash Flow** 694 564 780 86 216
* For reconciliation of GAAP to non-GAAP results, see appendix of this presentation and non-GAAP reconciliation on the investor relations page at www.appliedmaterials.com
** Free cash flow = operating cash flow – net capital expenditures

| Applied Materials External
SEMICONDUCTOR SYSTEMS DISPLAY & ADJACENT MARKETSAPPLIED GLOBAL SERVICES
8
Q3F20 Segment Results | Double-digit Y/Y revenue growth in all segments
▪ Revenue up 18% on a TTM basis
(Q4F19-Q3F20 vs. Q4F18-Q3F19)
▪ Since 2015 launch, cumulatively
shipped >5K Sym3® Y etch chambers
▪ Significant traction for new optical
and e-beam systems
▪ 60% of services and spares
revenue from subscription-like
long-term agreements
▪ Encouraging signs in high end of
market: 8K screen demand,
adoption of OLED in TVs
▪ Optimistic about long-term
opportunities to address inflections,
expand served addressable market
* For reconciliation of GAAP to non-GAAP results, see appendix of this presentation and non-GAAP reconciliation on the investor relations page at www.appliedmaterials.com
TTM is trailing twelve months
Rev
en
ue (
$M
)
No
n-G
AA
P O
pera
ting
Marg
in*
Rev
en
ue (
$M
)N
on
-GA
AP
Op
era
ting
Marg
in*
2,2
73
2,3
02 2,8
14
2,5
67
2,9
1628% 28%
33%31%
34%
Q3F19 Q4F19 Q1F20 Q2F20 Q3F20
339
457
332
365 425
13%
22%
12%
21% 21%
Q3F19 Q4F19 Q1F20 Q2F20 Q3F20
931
977
997
1,0
18
1,0
34
28% 28% 28%26%
27%
Q3F19 Q4F19 Q1F20 Q2F20 Q3F20
Rev
en
ue (
$M
)
No
n-G
AA
P O
pera
ting
Marg
in*

| Applied Materials External9
Liquidity and Uses of Capital
CASH AND INVESTMENTS ($M) Q3F19 Q4F19 Q1F20 Q2F20 Q3F20
Cash and cash equivalents* 3,014 3,129 3,424 5,281 4,350
Short-term investments 547 489 536 423 406
Long-term investments 1,650 1,703 1,713 1,678 1,538
Total cash and investments 5,211 5,321 5,673 7,382 6,294
Short-term and long-term debt*Ratings (Moody’s / S&P): A3 / A-
5,312 5,313 5,314 6,815 5,447
CAPITAL RETURNS ($M)
Share repurchases (528) (500) (200) (199) (200)
Cash dividends (196) (194) (192) (193) (202)
* Q2F20 includes $1.5 billion cash drawn under revolving credit facility
| Applied Materials External10
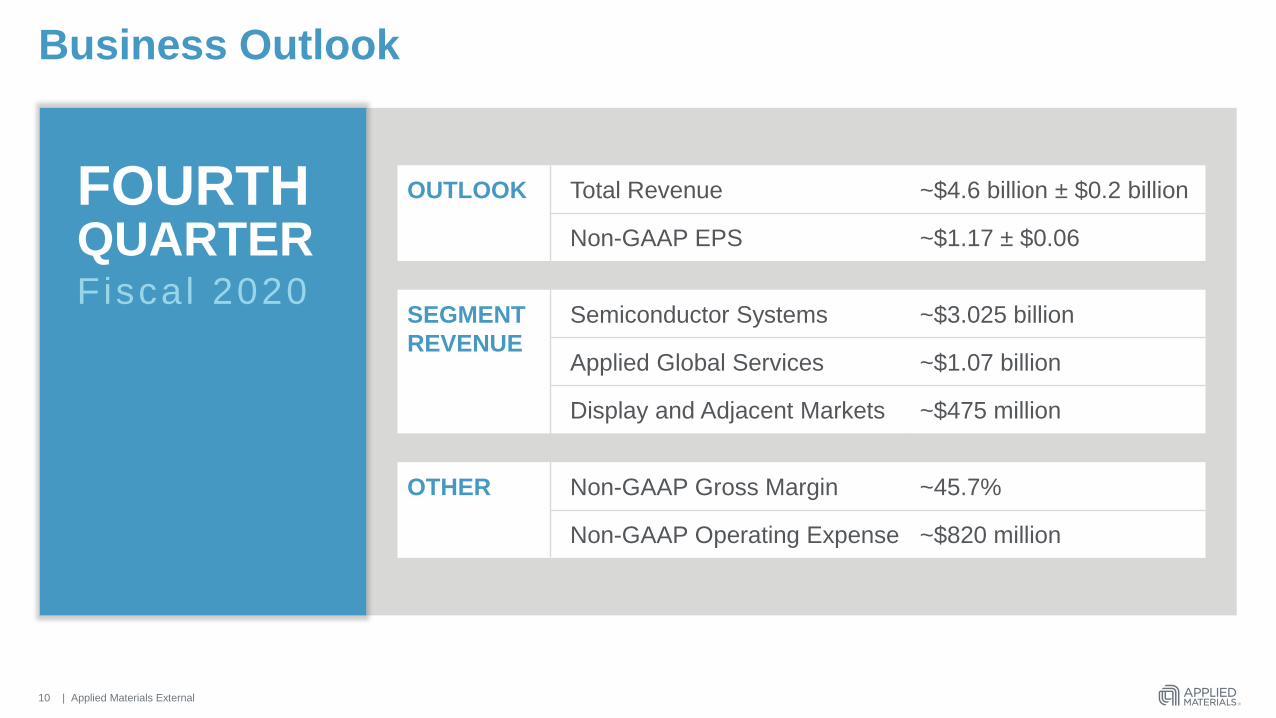
Business Outlook
FOURTHQUARTERFiscal 2020
OUTLOOK Total Revenue ~$4.6 billion ± $0.2 billion
Non-GAAP EPS ~$1.17 ± $0.06
SEGMENT
REVENUE
Semiconductor Systems ~$3.025 billion
Applied Global Services ~$1.07 billion
Display and Adjacent Markets ~$475 million
OTHER Non-GAAP Gross Margin ~45.7%
Non-GAAP Operating Expense ~$820 million

| Applied Materials External11
Use of Non-GAAP Adjusted Financial Measures
Applied provides investors with certain non-GAAP adjusted financial measures, which are adjusted for the impact of certain
costs, expenses, gains and losses, including certain items related to mergers and acquisitions; restructuring charges and
any associated adjustments; certain incremental expenses related to COVID-19; impairments of assets, or investments;
gain or loss on sale of strategic investments; loss on early extinguishment of debt; certain income tax items and other
discrete adjustments. On a non-GAAP basis, the tax effect related to share-based compensation is recognized ratably over
the fiscal year. Additionally, non-GAAP results exclude estimated discrete income tax expense items associated with U.S.
tax legislation. Reconciliations of these non-GAAP measures to the most directly comparable financial measures calculated
and presented in accordance with GAAP are provided in the appendix to this presentation and on Applied’s website,
https://ir.appliedmaterials.com/.
Management uses these non-GAAP adjusted financial measures to evaluate the company’s operating and financial
performance and for planning purposes, and as performance measures in its executive compensation program. Applied
believes these measures enhance an overall understanding of its performance and investors’ ability to review the company’s
business from the same perspective as the company’s management, and facilitate comparisons of this period’s results with
prior periods on a consistent basis by excluding items that management does not believe are indicative of Applied's ongoing
operating performance. There are limitations in using non-GAAP financial measures because the non-GAAP financial
measures are not prepared in accordance with generally accepted accounting principles, may be different from non-GAAP
financial measures used by other companies, and may exclude certain items that may have a material impact upon our
reported financial results. The presentation of this additional information is not meant to be considered in isolation or as a
substitute for the directly comparable financial measures prepared in accordance with GAAP.

| Applied Materials External
Appendix
Non-GAAP to GAAP Reconciliations
12

| Applied Materials External13
UNAUDITED RECONCILIATION OF GAAP TO NON-GAAP ADJUSTED RESULTS
FOOTNOTES:
1. These items are incremental charges
attributable to completed acquisitions,
consisting of amortization of purchased
intangible assets.
2. GAAP basis tax benefit related to share-
based compensation is being
recognized ratably over the fiscal year
on a non-GAAP basis.
3. Charges to income tax provision related
to a one-time transition tax and a
decrease in U.S. deferred tax assets as
a result of the recent U.S. tax legislation.
4. Temporary incremental employee
compensation during the COVID-19
pandemic.
IN MILLIONS, EXCEPT EPS AND PERCENTAGE Q3F19 Q4F19 Q1F20 Q2F20 Q3F20
Non-GAAP Adjusted Gross Profit
Reported gross profit - GAAP basis $ 1,557 $ 1,634 $ 1,858 $ 1,749 $ 1,955
Certain items associated with acquisitions 1 9 9 9 8 8
Certain incremental expenses related to COVID-19 4 - - - 8 15
Non-GAAP adjusted gross profit $ 1,566 $ 1,643 $ 1,867 $ 1,765 $ 1,978
Non-GAAP adjusted gross margin 44.0% 43.8% 44.9% 44.6% 45.0%
Non-GAAP Adjusted Operating Income
Reported operating income - GAAP basis $ 802 $ 864 $ 1,042 $ 932 $ 1,108
Certain items associated with acquisitions 1 13 14 13 13 12
Acquisition integration and deal costs 5 10 13 21 20
Certain incremental expenses related to COVID-19 4 - - - 10 20
Non-GAAP adjusted operating income $ 820 $ 888 $ 1,068 $ 976 $ 1,160
Non-GAAP adjusted operating margin 23.0% 23.7% 25.7% 24.7% 26.4%
Non-GAAP Adjusted Net Income
Reported net income - GAAP basis $ 571 $ 698 $ 892 $ 755 $ 841
Certain items associated with acquisitions 1 13 14 13 13 12
Acquisition integration and deal costs 5 10 13 21 20
Certain incremental expenses related to COVID-19 4 - - - 10 20
Realized loss (gain) on strategic investments, net 1 - 2 5 (8)
Unrealized loss (gain) on strategic investments, net (9) (5) 2 2 (5)
Loss on early extinguishment of debt - - - - 33
Income tax effects related to intra-entity intangible asset transfers 115 6 21 16 67
Resolution of prior years' income tax filings and other tax items (1) 20 (1) (3) (1)
Income tax effect of share-based compensation 2 - 4 (33) 8 12
Income tax effect of non-GAAP adjustments 3 (3) (3) (5) (10) (15)
Non-GAAP adjusted net income $ 692 $ 744 $ 904 $ 817 $ 976
Non-GAAP Adjusted Earnings Per Diluted Share
Reported earnings per diluted share - GAAP basis $0.61 $0.75 $0.96 $0.82 $0.91
Certain items associated with acquisitions 0.01 0.01 0.01 0.01 0.01
Acquisition integration and deal costs 0.01 0.01 0.01 0.02 0.02
Certain incremental expenses related to COVID-19 - - - 0.01 0.02
Realized loss (gain) on strategic investments, net - - - 0.01 (0.01)
Unrealized loss (gain) on strategic investments, net (0.01) - - - -
Loss on early extinguishment of debt - - - - 0.03
Income tax effects related to intra-entity intangible asset transfers 0.12 0.01 0.03 0.02 0.07
Income tax effect of share-based compensation - - (0.03) 0.01 0.01
Resolution of prior years' income tax filings and other tax items - 0.02 - (0.01) -
Non-GAAP adjusted earnings per diluted share $ 0.74 $ 0.80 $ 0.98 $ 0.89 $ 1.06
Weighted average number of diluted shares 937 931 927 923 922

| Applied Materials External14
UNAUDITED RECONCILIATION OF GAAP TO NON-GAAP SEGMENT OPERATING RESULTS
1 These items are incremental charges attributable to completed acquisitions, consisting of amortization of purchased intangible assets.
2 Temporary incremental employee compensation during the COVID-19 pandemic.
IN MILLIONS, EXCEPT PERCENTAGE Q3F19 Q4F19 Q1F20 Q2F20 Q3F20
Semiconductor Systems Non-GAAP Adjusted Operating Income
Reported operating income - GAAP basis $ 613 $ 641 $ 915 $ 782 $ 958
Certain items associated with acquisitions 1 11 11 10 10 9
Acquisition integration costs - - - - 1
Certain incremental expenses related to COVID-19 2 - - - 6 14
Non-GAAP adjusted operating income $ 624 $ 652 $ 925 $ 798 $ 982
Non-GAAP adjusted operating margin 27.5% 28.3% 32.9% 31.1% 33.7%
AGS Non-GAAP Adjusted Operating Income
Reported operating income - GAAP basis $ 259 $ 274 $ 278 $ 256 $ 273
Certain incremental expenses related to COVID-19 2 - - - 4 4
Non-GAAP adjusted operating income $ 259 $ 274 $ 278 $ 260 $ 277
Non-GAAP adjusted operating margin 27.8% 28.0% 27.9% 25.5% 26.8%
Display and Adjacent Markets Non-GAAP Adjusted Operating Income
Reported operating income - GAAP basis $ 41 $ 96 $ 38 $ 75 $ 83
Certain items associated with acquisitions 1 2 3 3 3 3
Acquisition integration costs 1 - - - -
Certain incremental expenses related to COVID-19 2 - - - - 1
Non-GAAP adjusted operating income $ 44 $ 99 $ 41 $ 78 $ 87
Non-GAAP adjusted operating margin 13.0% 21.7% 12.3% 21.4% 20.5%
Note: The reconciliation of GAAP and non-GAAP adjusted segment results above does not include
certain revenues, costs of products sold and operating expenses that are reported within
corporate and other and included in consolidated operating income.