
Third Quarter Fiscal 2015 Earnings - Zonebourse.com Qualcomm Reports Third Quarter Fiscal 2015...
24
Third Quarter Fiscal 2015 Earnings July 22, 2015
Transcript of Third Quarter Fiscal 2015 Earnings - Zonebourse.com Qualcomm Reports Third Quarter Fiscal 2015...

Third Quarter Fiscal 2015 Earnings
July 22, 2015
2
Safe HarborIn addition to the historical information contained herein, this presentation and the conference call that accompanies it contain forward-looking statements that are inherently subject to risks and uncertainties,
including but not limited to statements regarding our Strategic Realignment Plan and the goals, expectations, execution and elements of that plan, including aggressively right-sizing our cost structure, reviewing
alternatives to our corporate and financial structure, reaffirming our plan to return significant capital to stockholders, adding new Directors with complementary skills while reducing the average tenure of the
Board of Directors, further aligning executive compensation with performance, disciplined investment in areas that further our leadership positions and build upon our core technologies and capabilities and offer
attractive growth opportunities and returns; our reduced outlook for QCT and the factors impacting that outlook; QTL and QCT opportunities, including adjacent opportunities, and our positioning for growth in
those businesses; our being very well positioned to capitalize on the significant long-term opportunities before us; our capital return commitments, including our plan to repurchase an additional $10 billion in
stock by March 2016; certain licensees in China not fully complying with their contractual obligations to report their sales of licensed products to us; progress with licensees executing agreements based on the
new China terms and with several other licensees informing us that they intend to retain the terms of their existing agreements, our expectations that it will take some time to conclude negotiations with certain
other licensees, and our belief that the conclusion of new agreements with these licensees will result in improved reporting by these licensees, including with respect to sales of three-mode devices; our business
and financial outlook; and our estimates and guidance related to revenues, earnings per share, MSM chip shipments, revenue per MSM, total reported device sales, device ASPs, operating margins, R&D and SG&A
expenses, tax rates, and 3G/4G device sales and shipments, both globally and which we expect to be reported to us, and the factors influencing our estimates and guidance. Forward-looking statements are
generally identified by words such as “estimates,” “guidance,” “expects,” “anticipates,” “intends,” “plans,” “believes,” “seeks” and similar expressions. Actual results may differ materially from those referred to in
the forward-looking statements due to a number of important factors, including but not limited to risks associated with commercial network deployments, expansions and upgrades of CDMA, OFDMA and other
communications technologies, our customers’ and licensees’ sales of products and services based on these technologies and our ability to drive our customers’ demand for our products and services; competition
in an environment of rapid technological change; our dependence on a small number of customers and licensees; the continued and future success of our licensing programs; attacks on our licensing business
model, including current and future legal proceedings or actions of governmental or quasi-governmental bodies or standards or industry organizations; the enforcement and protection of our intellectual property
rights; government regulations and policies, or adverse rulings in enforcement or other proceedings; the commercial success of our new technologies, products and services; the execution of our Strategic
Realignment Plan; claims by third parties that we infringe their intellectual property; acquisitions, strategic transactions and investments; our dependence on a limited number of third-party suppliers; our stock
price and earnings volatility; risks associated with our indebtedness; our ability to attract and retain qualified employees; global economic conditions that impact the mobile communications industry; foreign
currency fluctuations and failures in our products or services or in the products or services of our customers or licensees, including those resulting from security vulnerabilities, defects or errors. These and other
risks are set forth in the Company’s Quarterly Report on Form 10-Q for the third quarter ended June 28, 2015 filed with the SEC. Our reports filed with the SEC are available on our website at www.qualcomm.com.
We undertake no obligation to update, or continue to provide information with respect to, any forward-looking statement or risk factor, whether as a result of new information, future events or otherwise.
This presentation includes “non-GAAP financial measures” as that term is defined in Regulation G. The most directly comparable GAAP financial measures and information reconciling these non-GAAP financial
measures to the Company’s financial results prepared in accordance with GAAP are included at the end of this presentation.
We refer to “Qualcomm” for ease of reference. However, in connection with our fiscal 2013 reorganization, Qualcomm Incorporated continues to operate QTL and own the vast majority of our patent portfolio,
while Qualcomm Technologies, Inc., its wholly-owned subsidiary, now operates, along with its subsidiaries, substantially all of our products and services businesses, including QCT, and substantially all of our
research and development functions.
3
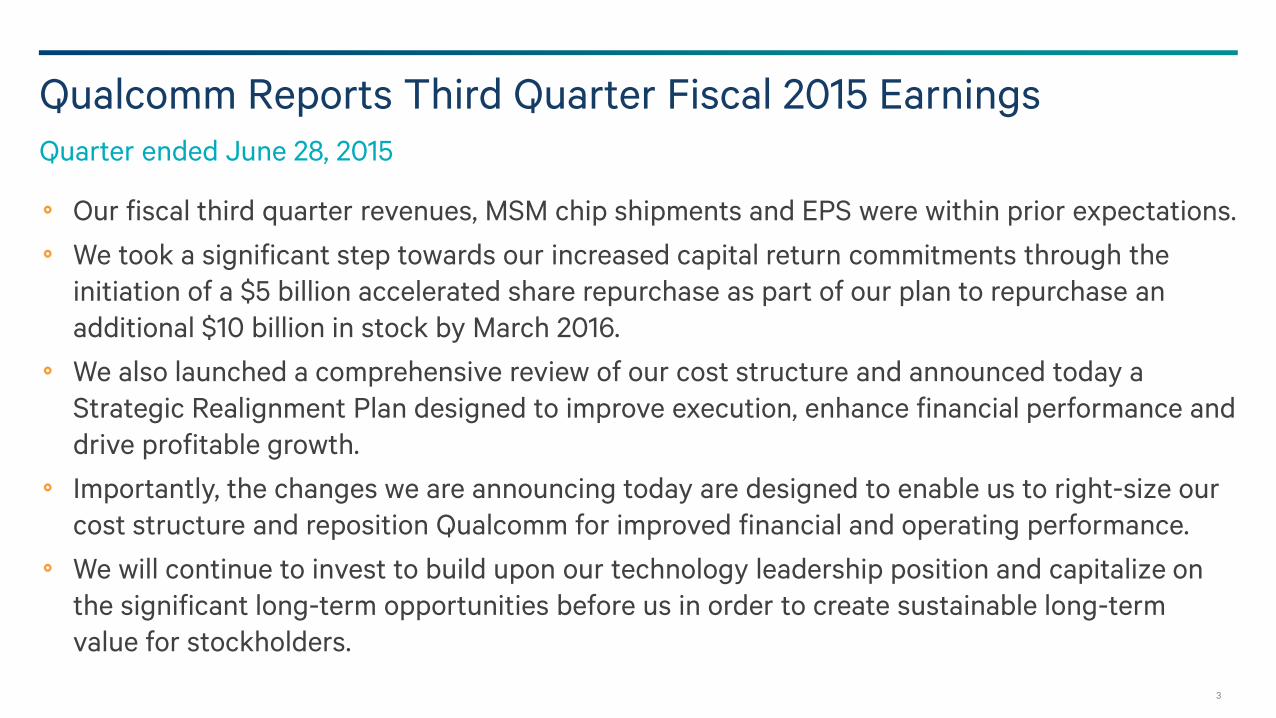
Qualcomm Reports Third Quarter Fiscal 2015 Earnings
Our fiscal third quarter revenues, MSM chip shipments and EPS were within prior expectations.
We took a significant step towards our increased capital return commitments through the
initiation of a $5 billion accelerated share repurchase as part of our plan to repurchase an
additional $10 billion in stock by March 2016.
We also launched a comprehensive review of our cost structure and announced today a
Strategic Realignment Plan designed to improve execution, enhance financial performance and
drive profitable growth.
Importantly, the changes we are announcing today are designed to enable us to right-size our
cost structure and reposition Qualcomm for improved financial and operating performance.
We will continue to invest to build upon our technology leadership position and capitalize on
the significant long-term opportunities before us in order to create sustainable long-term
value for stockholders.
Quarter ended June 28, 2015

4
Mar’14 Qtr Mar’15 Qtr
Third Quarter Fiscal 2015 Results vs. Last Year
Q3’14 Q3’15Q3’14 Q3’15Q3’14 Q3’15
(1), (2), (3), (4), (5) & (7) See Footnotes page at the end of the presentation.
MSM chips are products of Qualcomm Technologies, Inc.
225M225M
MSMTM Chip
Shipments
$5.8B
$6.8B
Revenues(1)
$0.99
$1.44
Non-GAAP(2)
Diluted EPS(3) (7)
$60.4B$58.1B
Total Reported
Device Sales(4) (5)
-14% -31% +4%even

5
Third Quarter Fiscal 2015 Results vs. Guidance
Q3’15 guidance* Q3’15 results
Revenues(1) $5.4B - $6.2B $5.8B
Non-GAAP(2) diluted EPS(3) $0.85 - $1.00 $0.99**
MSM chip shipments 210M - 230M 225M
Total reported device sales(4) (Mar. Qtr.(5)) $61.0B - $67.0B $60.4B
Est. reported 3G/4G device shipments(4) (Mar. Qtr.(5)) not provided 289M - 293M
Est. reported 3G/4G device ASP(4) (Mar. Qtr.(5)) not provided $205 - $211
* Prior guidance as of Apr. 22, 2015.
** Q3 Non-GAAP EPS was above the midpoint of guidance primarily due to additional tax benefits resulting from an increase in the allocation of expenses to our United States operations, partially offset by a decrease in our
estimate of foreign income taxed at rates lower than the rate in the United States.
(1), (2), (3), (4) & (5) See Footnotes page at the end of the presentation.
6
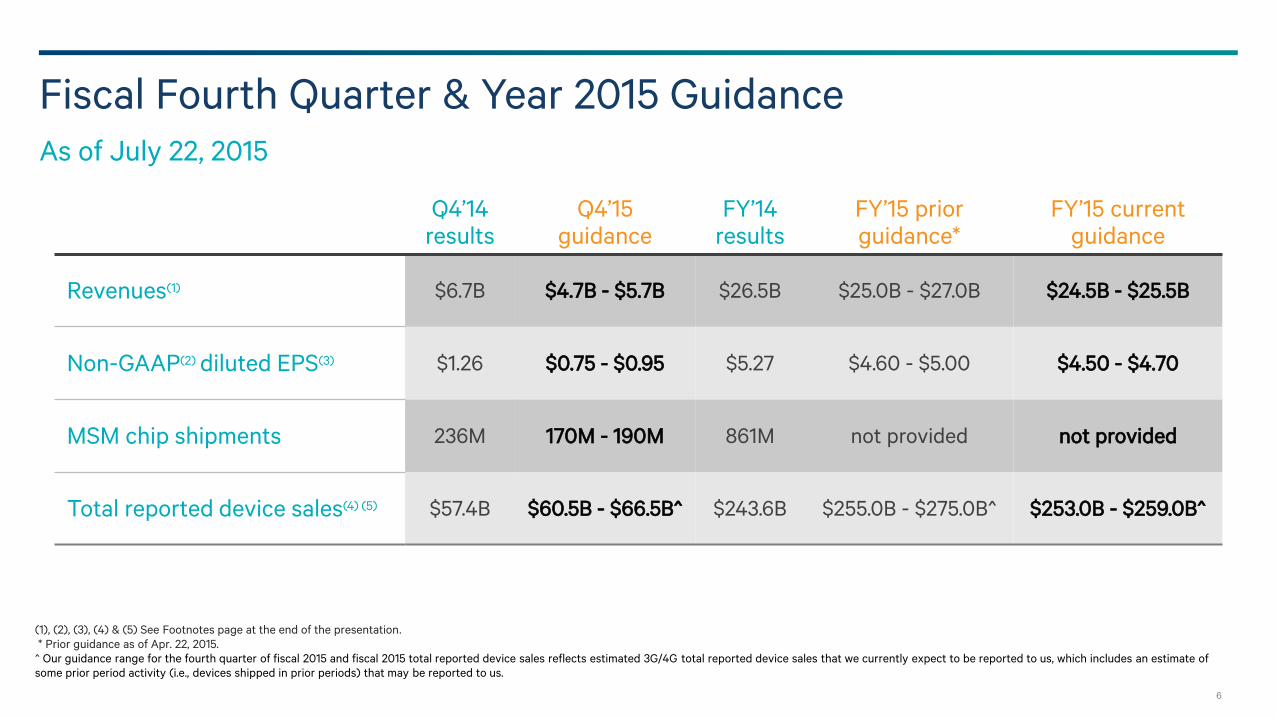
Fiscal Fourth Quarter & Year 2015 Guidance
As of July 22, 2015
(1), (2), (3), (4) & (5) See Footnotes page at the end of the presentation.
* Prior guidance as of Apr. 22, 2015.
^ Our guidance range for the fourth quarter of fiscal 2015 and fiscal 2015 total reported device sales reflects estimated 3G/4G total reported device sales that we currently expect to be reported to us, which includes an estimate of
some prior period activity (i.e., devices shipped in prior periods) that may be reported to us.
Q4’14 results
Q4’15 guidance
FY’14 results
FY’15 priorguidance*
FY’15 currentguidance
Revenues(1) $6.7B $4.7B - $5.7B $26.5B $25.0B - $27.0B $24.5B - $25.5B
Non-GAAP(2) diluted EPS(3) $1.26 $0.75 - $0.95 $5.27 $4.60 - $5.00 $4.50 - $4.70
MSM chip shipments 236M 170M - 190M 861M not provided not provided
Total reported device sales(4) (5) $57.4B $60.5B - $66.5B^ $243.6B $255.0B - $275.0B^ $253.0B - $259.0B^
7
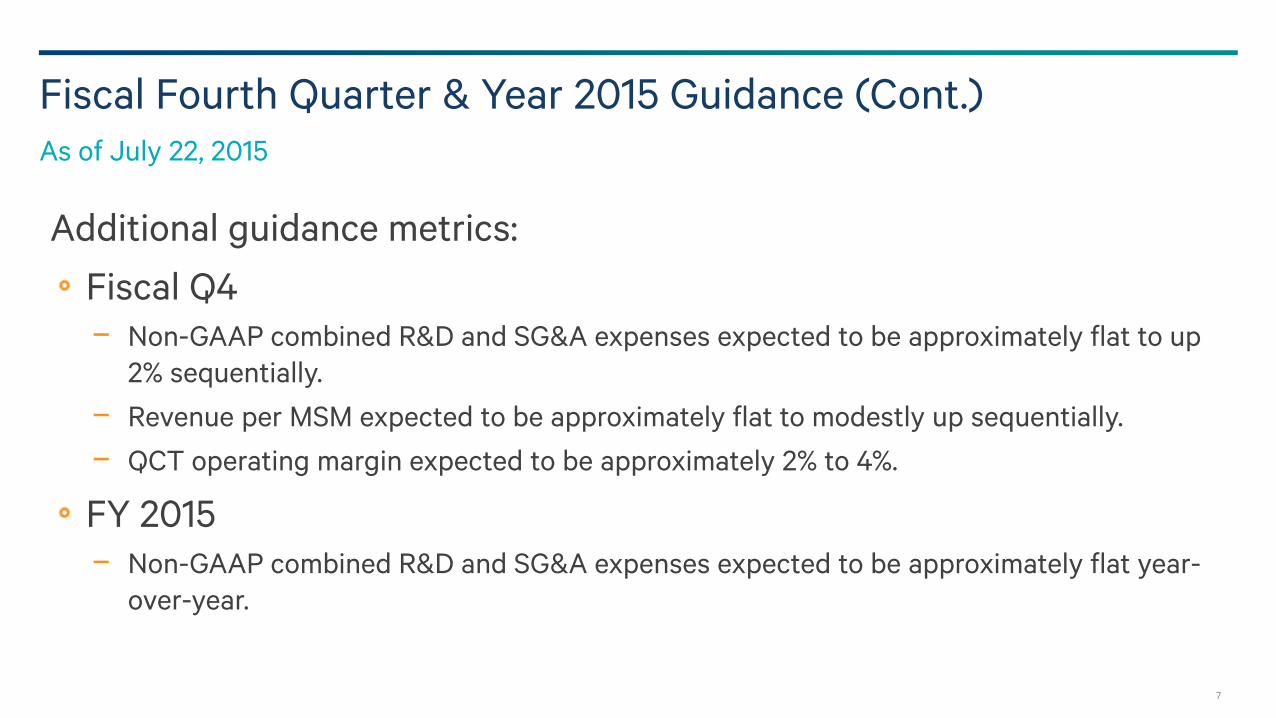
Fiscal Fourth Quarter & Year 2015 Guidance (Cont.)
As of July 22, 2015
Additional guidance metrics:
Fiscal Q4
− Non-GAAP combined R&D and SG&A expenses expected to be approximately flat to up
2% sequentially.
− Revenue per MSM expected to be approximately flat to modestly up sequentially.
− QCT operating margin expected to be approximately 2% to 4%.
FY 2015
− Non-GAAP combined R&D and SG&A expenses expected to be approximately flat year-
over-year.

8
MSM Chip Shipments
Calendar year, millions
* Guidance as of Jul. 22, 2015.
118 152 173 188 233120
141172
225225
127141
190
236170 -
190e*
156
182
213
270
0
100
200
300
400
500
600
700
800
900
2011 2012 2013 2014 2015
Quarter
March June September December
748
919
521
616
9
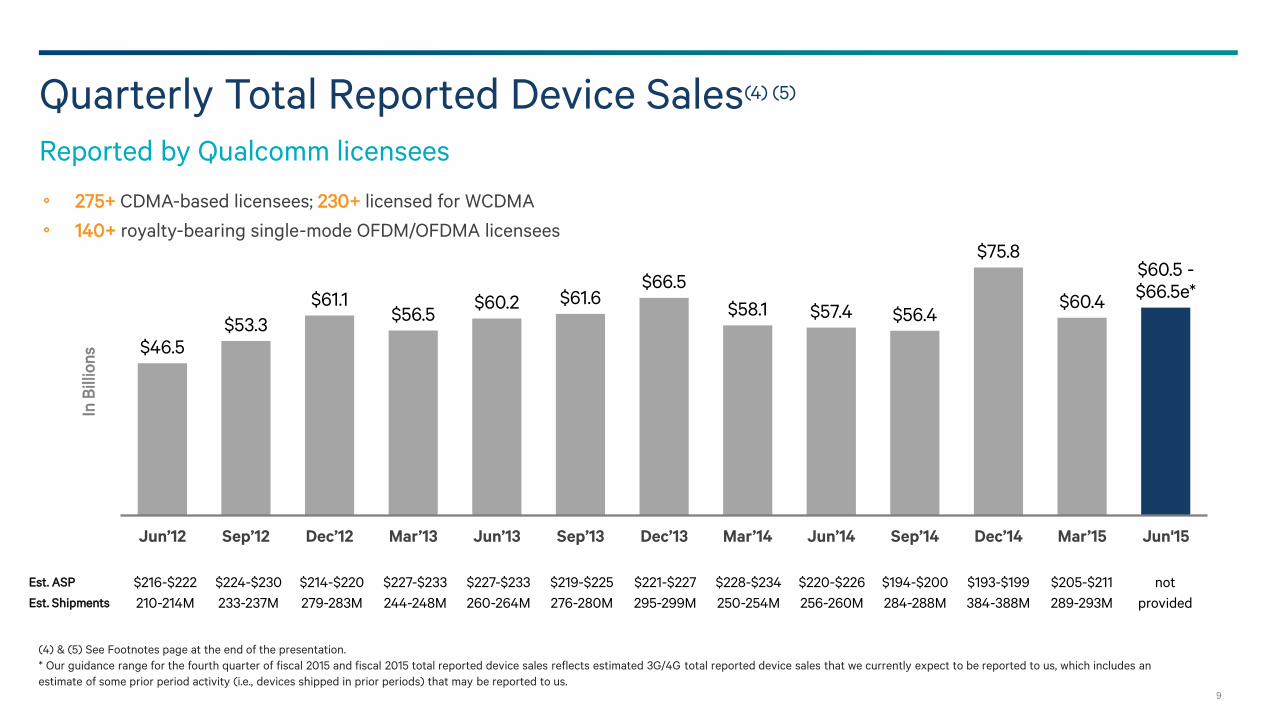
Quarterly Total Reported Device Sales(4) (5)
Reported by Qualcomm licensees
(4) & (5) See Footnotes page at the end of the presentation.
* Our guidance range for the fourth quarter of fiscal 2015 and fiscal 2015 total reported device sales reflects estimated 3G/4G total reported device sales that we currently expect to be reported to us, which includes an
estimate of some prior period activity (i.e., devices shipped in prior periods) that may be reported to us.
$46.5
$53.3
$61.1$56.5
$60.2 $61.6$66.5
$58.1 $57.4 $56.4
$75.8
$60.4
$60.5 -
$66.5e*
Jun’12 Sep’12 Dec’12 Mar’13 Jun’13 Sep’13 Dec’13 Mar’14 Jun’14 Sep’14 Dec’14 Mar’15 Jun'15
In B
illio
ns
Est. ASP $216-$222 $224-$230 $214-$220 $227-$233 $227-$233 $219-$225 $221-$227 $228-$234 $220-$226 $194-$200 $193-$199 $205-$211 not
Est. Shipments 210-214M 233-237M 279-283M 244-248M 260-264M 276-280M 295-299M 250-254M 256-260M 284-288M 384-388M 289-293M provided
275+ CDMA-based licensees; 230+ licensed for WCDMA
140+ royalty-bearing single-mode OFDM/OFDMA licensees

10
Estimated 3G/4G Device Shipments - Update
In the second quarter of fiscal 2015, we reached a resolution with the NDRC regarding its investigation and agreed to implement a
rectification plan that modifies certain of our business practices in China. However, we continue to believe that certain licensees
in China are not fully complying with their contractual obligations to report their sales of licensed products to us (which includes
3G/4G units that we believe are not being reported by certain licensees). We continue to make progress, with licensees executing
agreements based on the new China terms, and with several other licensees informing us that they intend to retain the terms of
their existing agreements. Negotiations with certain other licensees are ongoing, and we expect it will take some time to conclude
these negotiations. We believe that the conclusion of new agreements with these licensees will result in improved reporting by
these licensees, including with respect to sales of three-mode devices (i.e., devices that implement GSM, TD-SCDMA, and LTE)
sold in China.
Our current outlook for our licensing business, QTL, also reflects the following:
We expect global 3G/4G device shipments to be approximately 1.52 billion to 1.6 billion for calendar year 2015. At this time, we
are not providing a forecast for calendar year 2015 reported 3G/4G device shipments.
Our guidance for estimated fiscal fourth quarter and fiscal 2015 3G/4G total reported device sales includes an estimate of
some prior period activity (i.e., devices shipped in prior periods) that may be reported to us.

11
* Device shipments are Qualcomm estimates and include handsets, data devices, telematics, security devices and some quantity of channel inventory.
** We estimate global 3G/4G device shipments were approximately 1.37 billion for calendar year 2014. However, we do not believe that all of the global 3G/4G device shipments for calendar year 2014 were reported to us within the time
periods required by our license agreements. Accordingly, we estimate approximately 1.174 billion to 1.190 billion calendar year 2014 3G/4G device shipments were actually reported to us through the first calendar quarter of 2015. We
expect global 3G/4G device shipments to be approximately 1.52 billion to 1.6 billion for calendar year 2015. At this time, we are not providing a forecast for calendar year 2015 reported 3G/4G device shipments.
(4) See Footnotes page at the end of the presentation.
2013 2014** 2015**
Global 3G/4G Device Shipment* Estimates(4)
Calendar year, as of July 22, 2015
~ +27%
Est. to be Reported
~ 1.075B - 1.091B
~ 1.37B
1.174B -
1.190Be
~ 1.52B - 1.6Be+11 - 17%

12
Supplemental Information – 3G/4G Device Estimates
FY’14 FY’15*^ CY’14*^ CY’15*^
3G/4G Units
Global ~ 1.37B ~ 1.52B - 1.6B
Reported (4) (5) ~ 1,077M - 1,093M ~ 1,174M - 1,190M
3G/4G ASP
Global ~ $208 - $216 ~ down 11 - 12 % YoY
Reported (4) (5) ~ $222 - $228
3G/4G DeviceSales
Global ~ $250B - $257B ~ $270B - $280B
Reported (4) (5) ~ $243.6B ~ $253.0B - $259.0B
(4) & (5) See Footnotes page at the end of the presentation.
* We estimate global 3G/4G device shipments were approximately 1.37 billion for calendar year 2014. However, we do not believe that all of the global 3G/4G device shipments for calendar year 2014 were reported to us within the time periods required by
our license agreements. Accordingly, we estimate approximately 1.174 billion to 1.190 billion calendar year 2014 3G/4G device shipments were actually reported to us through the first calendar quarter of 2015. We expect global 3G/4G device shipments to be
approximately 1.52 billion to 1.6 billion for calendar year 2015. At this time, we are not providing a forecast for calendar year 2015 reported 3G/4G device shipments.
^ Guidance as of Jul. 22, 2015. Our guidance range for fiscal 2015 total reported device sales reflects estimated 3G/4G total reported device sales that we currently expect to be reported to us, which includes an estimate of some prior period activity (i.e.,
devices shipped in prior periods) that may be reported to us.

13
Quarterly Estimated 3G/4G Reported Device Shipments & ASP Trend(4) (5)
FY’13 FY’14 FY’15
Sep’12
Dec’12
Mar’13
Jun’13
Sep’13
Dec ‘13
Mar ’14
Jun’14
Sep’14
Dec‘14
Mar‘15
Jun’15**
Qtr. total reported device sales ($B)
$53.3 $61.1 $56.5 $60.2 $61.6 $66.5 $58.1 $57.4 $56.4 $75.8 $60.4 $60.5 - $66.5e^
FY total reported device sales ($B)
$231.2 $243.6 $253.0 - $259.0e^
Qtr. device shipments* (M) 235 281 246 262 278 297 252 258 286 386 291
CY device shipments* (M) 937 1,083 1,182^^
FY device shipments* (M) 1,025 1,085
Qtr. device ASP* $227 $217 $230 $230 $222 $224 $231 $223 $197 $196 $208
FY device ASP* $226 $225
(4) & (5) See Footnotes page at the end of the presentation.
* Midpoints, see note (6) on the Footnotes page at the end of the presentation.
** Guidance as of Jul. 22, 2015.
^ Our guidance range for the fourth quarter of fiscal 2015 and fiscal 2015 total reported device sales reflects estimated 3G/4G total reported device sales that we currently expect to be reported to us, which includes an estimate of some prior period activity (i.e., devices shipped in prior
periods) that may be reported to us.
^^ We estimate global 3G/4G device shipments were approximately 1.37 billion for calendar year 2014. However, we do not believe that all of the global 3G/4G device shipments for calendar year 2014 were reported to us within the time periods required by our license agreements.
Accordingly, we estimate approximately 1.174 billion to 1.190 billion calendar year 2014 3G/4G device shipments were actually reported to us through the first calendar quarter of 2015. We expect global 3G/4G device shipments to be approximately 1.52 billion to 1.6 billion for calendar year
2015. At this time, we are not providing a forecast for calendar year 2015 reported 3G/4G device shipments.
Note: Sums of quarterly amounts may not equal totals due to rounding.

14
Cumulative $44.7 Billion Returned to Stockholders
$8.6 billion remained
authorized for repurchase
under our stock
repurchase program.
As of July 22, 2015
$0.17 $0.95 $1.50 $1.48 $1.67$0.28
$3.02
$0.14$1.31
$4.61 $4.55
$9.53
FY’03 FY’05 FY’06 FY’07 FY’08 FY’09 FY’10 FY’11 FY’12 FY’13 FY’14 FY’15
YTD
Stock Repurchases*
(Billions)
Ma
r-03
Ju
n-0
3
Se
p-0
3
De
c-0
3
Ma
r-04
Ju
n-0
4
Se
p-0
4
Ja
n-0
5
Ma
r-05
Ju
n-0
5
Se
p-0
5
Ja
n-0
6
Ma
r-06
Ju
n-0
6
Se
p-0
6
Ja
n-0
7
Ma
r-07
Ju
n-0
7
Se
p-0
7
Ja
n-0
8
Ma
r-08
Ju
n-0
8
Se
p-0
8
Ja
n-0
9
Ma
r-09
Ju
n-0
9
Se
p-0
9
De
c-0
9
Ma
r-10
Ju
n-10
Se
p-10
De
c-10
Ma
r-11
Ju
n-11
Se
p-11
De
c-11
Ma
r-12
Ju
n-12
Se
p-12
De
c-12
Ma
r-13
Ju
n-13
Se
p-13
De
c-13
Ma
r-14
Ju
n-14
Se
p-14
De
c-14
Ma
r-15
Ju
n-15
Se
p-15
Quarterly Cash Dividend Per Share
(Based on Date Payable)
$0.025 $0.035 $0.05 $0.07$0.09
$0.12$0.14 $0.16 $0.17
$0.19$0.215
$0.25
Note: The Company effected a two-for-one stock split in August 2004. All references to per share data have been adjusted to reflect the stock split.
* Gross repurchases before commissions.
$0.35
$0.42$0.48

15
Financial Strength
In billions Jun’14 Jun’15
Domestic $6.9 $8.0
Cash resources and operating/
stock repurchase flexibilityOffshore $25.8 $27.2
Total cash & marketable securities $32.7 $35.2
Total assets $48.4 $52.3
Solid balance sheetStockholders’ equity $38.8 $33.2
Debt* $0.0 $10.9
EBITDA** (7) $2.7 $1.6 Cash flow to support future
growth and dividendsFree cash flow*** $2.5 $1.8
* Including long-term and short-term debt.
** EBITDA is defined as income from continuing operations before income tax expense, depreciation and amortization expense and interest and dividend income, net.
*** Free cash flow is defined as net cash provided (used) by operating activities less capital expenditures.
(7) See Footnotes page at the end of the presentation.

16
Footnotes1. Throughout this presentation, revenues, operating expenses, operating income, earnings before tax (EBT) and effective tax rates are from continuing operations
(i.e., before adjustments for noncontrolling interests and discontinued operations), unless otherwise stated.
2. Non-GAAP results exclude the QSI (Qualcomm Strategic Initiatives) segment and certain share-based compensation, acquisition-related items, tax items and other
items. Beginning in the first quarter of fiscal 2015, we changed our methodology for reporting Non-GAAP results to exclude third-party acquisition and integration
services costs and certain other items, which may include major restructuring and restructuring-related costs, goodwill and long-lived asset impairment charges
and litigation settlements and/or damages.
3. Throughout this presentation, net income and diluted earnings per share (EPS) are attributable to Qualcomm (i.e., after adjustments for noncontrolling interests
and discontinued operations), unless otherwise stated.
4. Total reported device sales is the sum of all reported sales in U.S. dollars (as reported to us by our licensees) of all licensed CDMA-based, OFDMA-based and
CDMA/OFDMA multimode subscriber devices (including handsets, modules, modem cards and other subscriber devices) by our licensees during a particular period
(collectively, 3G/4G devices). The reported quarterly estimated ranges of average selling prices (ASPs) and unit shipments are determined based on the
information as reported to us by our licensees during the relevant period and our own estimates of the selling prices and unit shipments for licensees that do not
provide such information. Not all licensees report sales, selling prices and/or unit shipments the same way (e.g., some licensees report sales net of permitted
deductions, including transportation, insurance, packing costs and other items, while other licensees report sales and then identify the amount of permitted
deductions in their reports), and the way in which licensees report such information may change from time to time. In addition, certain licensees may not report (in
the quarter in which they are contractually obligated to report) their sales of certain types of subscriber units, which (as a result of audits, legal actions or for other
reasons) may be reported in a subsequent quarter. Accordingly, total reported device sales, estimated unit shipments and estimated ASPs for a particular period
may include prior period activity that was not reported by the licensee until such particular period.
5. Royalties are recognized when reported, generally one quarter following shipment.
6. The midpoints of the estimated ranges are used for comparison purposes only and do not indicate a higher degree of confidence in the midpoints.
7. The following should be considered in regards to the year-over-year comparisons:
• The third quarter of fiscal 2015 GAAP results included:
• $142 million of charges, or $0.08 per share, that resulted from an impairment of goodwill and long-lived assets related to one of our display businesses.
• The third quarter of fiscal 2014 Non-GAAP and GAAP results included:
• $208 million of income, or $0.12 per share, of which $184 million was recorded in other income, due to the reversal of accruals related to our litigation with ParkerVision; and
• $164 million of charges, or $0.08 per share, that resulted from an impairment of goodwill and long-lived assets related to one of our display businesses.

17
Reconciliations
18
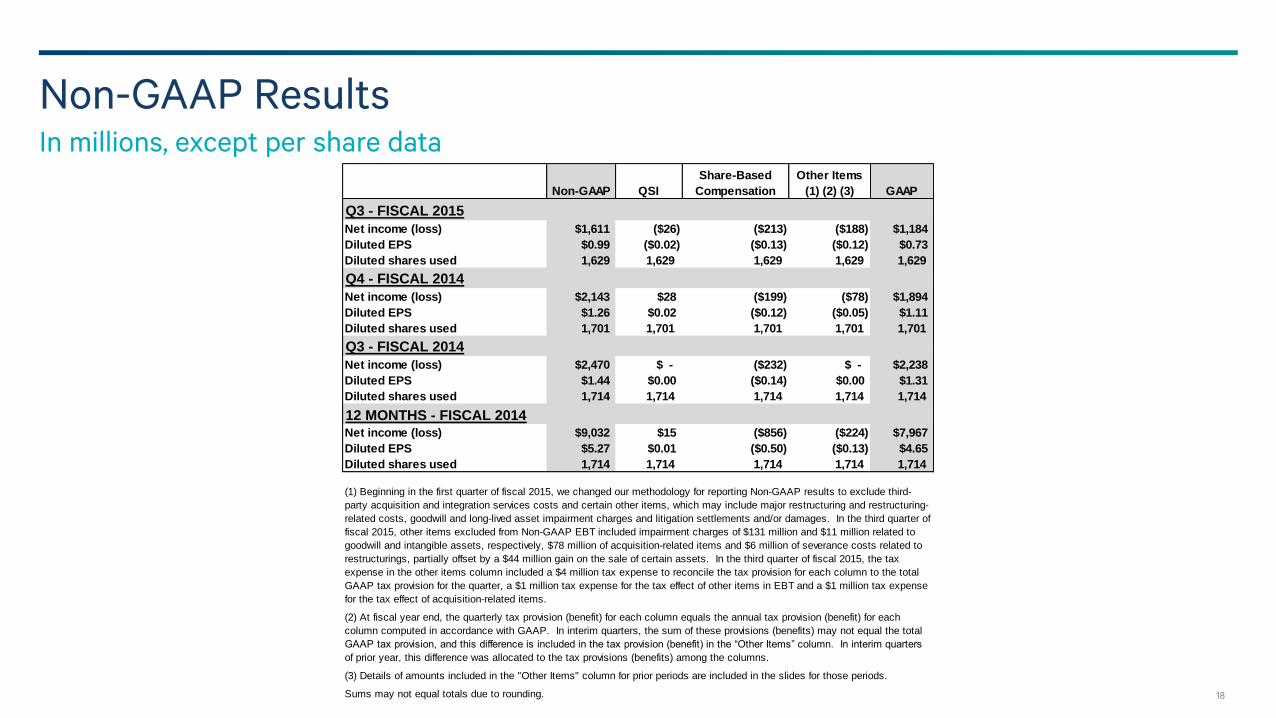
Non-GAAP ResultsIn millions, except per share data
Non-GAAP QSI
Share-Based
Compensation
Other Items
(1) (2) (3) GAAP
Q3 - FISCAL 2015
Net income (loss) $1,611 ($26) ($213) ($188) $1,184
Diluted EPS $0.99 ($0.02) ($0.13) ($0.12) $0.73
Diluted shares used 1,629 1,629 1,629 1,629 1,629
Q4 - FISCAL 2014
Net income (loss) $2,143 $28 ($199) ($78) $1,894
Diluted EPS $1.26 $0.02 ($0.12) ($0.05) $1.11
Diluted shares used 1,701 1,701 1,701 1,701 1,701
Q3 - FISCAL 2014
Net income (loss) $2,470 $ - ($232) $ - $2,238
Diluted EPS $1.44 $0.00 ($0.14) $0.00 $1.31
Diluted shares used 1,714 1,714 1,714 1,714 1,714
12 MONTHS - FISCAL 2014Net income (loss) $9,032 $15 ($856) ($224) $7,967
Diluted EPS $5.27 $0.01 ($0.50) ($0.13) $4.65
Diluted shares used 1,714 1,714 1,714 1,714 1,714
Sums may not equal totals due to rounding.
(2) At fiscal year end, the quarterly tax provision (benefit) for each column equals the annual tax provision (benefit) for each
column computed in accordance with GAAP. In interim quarters, the sum of these provisions (benefits) may not equal the total
GAAP tax provision, and this difference is included in the tax provision (benefit) in the “Other Items” column. In interim quarters
of prior year, this difference was allocated to the tax provisions (benefits) among the columns.
(1) Beginning in the first quarter of fiscal 2015, we changed our methodology for reporting Non-GAAP results to exclude third-
party acquisition and integration services costs and certain other items, which may include major restructuring and restructuring-
related costs, goodwill and long-lived asset impairment charges and litigation settlements and/or damages. In the third quarter of
fiscal 2015, other items excluded from Non-GAAP EBT included impairment charges of $131 million and $11 million related to
goodwill and intangible assets, respectively, $78 million of acquisition-related items and $6 million of severance costs related to
restructurings, partially offset by a $44 million gain on the sale of certain assets. In the third quarter of fiscal 2015, the tax
expense in the other items column included a $4 million tax expense to reconcile the tax provision for each column to the total
GAAP tax provision for the quarter, a $1 million tax expense for the tax effect of other items in EBT and a $1 million tax expense
for the tax effect of acquisition-related items.
(3) Details of amounts included in the "Other Items" column for prior periods are included in the slides for those periods.

19
EBITDA(1)
In millions
Q3'14 Q3'15
Income from continuing operations 2,237$ 1,183$
Plus: Income tax expense 260 215
Plus: Depreciation and amortization expense 292 297
Less: Interest and dividend income, net (139) (96)
EBITDA 2,650$ 1,599$
(1) EBITDA is defined as income from continuing operations before income tax expense, depreciation and
amortization expense and interest and dividend income, net.
Reconciliation of EBITDA to Income from Continuing Operations

20
Free Cash Flow (a)
In millions
Share-Based Other
Non-GAAP QSI Compensation Items (b) GAAP
Net cash provided (used) by operating activities $ 2,153 $ (7) $ (20) (c) $ (10) $ 2,116
Less: capital expenditures (366) - - - (366)
Free cash flow $ 1,787 $ (7) $ (20) $ (10) $ 1,750
Revenues $ 5,832 -$ -$ -$ $ 5,832
Net cash provided by operating activities as % of revenues 37% N/A N/A N/A 36%
Free cash flow as % of revenues 31% N/A N/A N/A 30%
Share-Based Other
Non-GAAP QSI Compensation Items (b) GAAP
Net cash provided (used) by operating activities $ 2,752 $ (9) $ (70) (c) $ - $ 2,673
Less: capital expenditures (158) - - - (158)
Free cash flow $ 2,594 $ (9) $ (70) $ - $ 2,515
Revenues $ 6,806 -$ -$ -$ $ 6,806
Net cash provided by operating activities as % of revenues 40% N/A N/A N/A 39%
Free cash flow as % of revenues 38% N/A N/A N/A 37%
(a) Free cash flow is defined as net cash provided or used by operating activities less capital expenditures.
(c) Incremental tax benefits from share-based compensation during the period.
N/A – Not Applicable
Three Months Ended June 28, 2015
Three Months Ended June 29, 2014
(b) Other items excluded from Non-GAAP include certain acquisition-related items, tax items and other items. Beginning in the first quarter of fiscal
2015, we changed our methodology for reporting Non-GAAP results to exclude third-party acquisition and integration services costs and certain other
items, which may include major restructuring and restructuring-related costs, goodwill and long-lived asset impairment charges and litigation settlements
and/or damages. In the three months ended June 28, 2015, net cash used by operating activities in the other items column primarily consisted of
acquisition-related activities and severance costs related to restructurings.
21
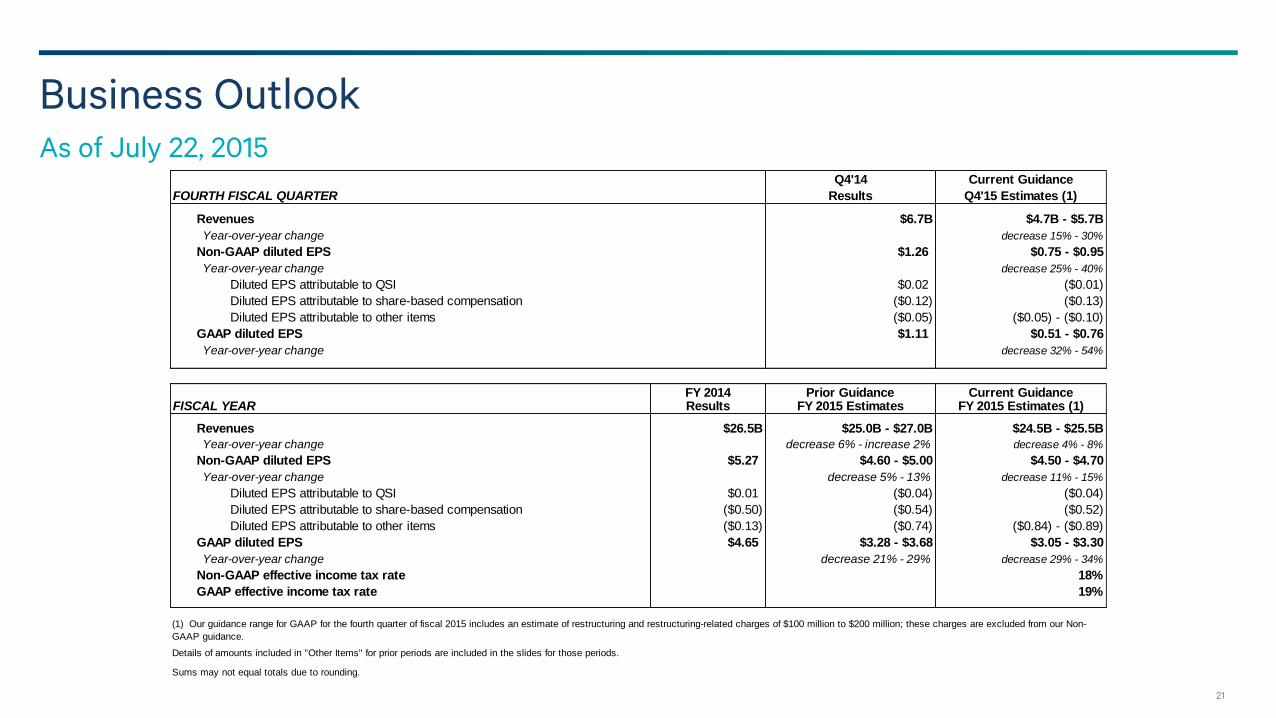
Business OutlookAs of July 22, 2015
Q4'14 Current Guidance
FOURTH FISCAL QUARTER Results Q4'15 Estimates (1)
Revenues $6.7B $4.7B - $5.7B
Year-over-year change decrease 15% - 30%
Non-GAAP diluted EPS $1.26 $0.75 - $0.95
Year-over-year change decrease 25% - 40%
Diluted EPS attributable to QSI $0.02 ($0.01)
Diluted EPS attributable to share-based compensation ($0.12) ($0.13)
Diluted EPS attributable to other items ($0.05) ($0.05) - ($0.10)
GAAP diluted EPS $1.11 $0.51 - $0.76
Year-over-year change decrease 32% - 54%
FY 2014 Prior Guidance Current GuidanceFISCAL YEAR Results FY 2015 Estimates FY 2015 Estimates (1)
Revenues $26.5B $25.0B - $27.0B $24.5B - $25.5B
Year-over-year change decrease 6% - increase 2% decrease 4% - 8%
Non-GAAP diluted EPS $5.27 $4.60 - $5.00 $4.50 - $4.70
Year-over-year change decrease 5% - 13% decrease 11% - 15%
Diluted EPS attributable to QSI $0.01 ($0.04) ($0.04)
Diluted EPS attributable to share-based compensation ($0.50) ($0.54) ($0.52)
Diluted EPS attributable to other items ($0.13) ($0.74) ($0.84) - ($0.89)
GAAP diluted EPS $4.65 $3.28 - $3.68 $3.05 - $3.30
Year-over-year change decrease 21% - 29% decrease 29% - 34%
Non-GAAP effective income tax rate 18%
GAAP effective income tax rate 19%
Sums may not equal totals due to rounding.
(1) Our guidance range for GAAP for the fourth quarter of fiscal 2015 includes an estimate of restructuring and restructuring-related charges of $100 million to $200 million; these charges are excluded from our Non-
GAAP guidance.
Details of amounts included in "Other Items" for prior periods are included in the slides for those periods.

22
Q4 FY’15 Combined R&D and SG&A Expenses GuidanceIn millions
Q3'15 Q4'15
Results Guidance* (est.)
Non-GAAP combined R&D and SG&A expenses 1,717$ Approx. 0% - increase 2%
QSI 21 Not provided
Other Items (1) (15) Not provided
Total combined R&D and SG&A expenses excluding
certain share-based compensation 1,723 Approx. 0% - increase 2%
Share-based compensation allocated to R&D and SG&A 261 Not provided
Total GAAP combined R&D and SG&A expenses (2) 1,984$ Approx. 0% - increase 2%
(1) Other items excluded from Non-GAAP include certain acquisition-related items and other items. Beginning in the first quarter of fiscal 2015, we changed our methodology
for reporting Non-GAAP results to exclude third-party acquisition and integration services costs and certain other items, which may include major restructuring and
restructuring-related costs, goodwill and long-lived asset impairment charges and litigation settlements and/or damages. Other items in Q3'15 primarily consisted of a
$44 million gain on the sale of certain assets, partially offset by $23 million in acquisition-related items and $6 million of severance costs relating to restructurings.
(2) Q4 FY15 total GAAP combined R&D and SG&A expenses guidance includes an estimate of the share-based compensation expense allocated to R&D and SG&A.
* Guidance as of Jul. 22, 2015

23
FY’15 Combined R&D and SG&A Expenses GuidanceIn millions
Fiscal 2014 Fiscal 2015
Results Guidance* (est.)
Non-GAAP combined R&D and SG&A expenses 6,684$ Approx. flat
QSI 18 Not provided
Other Items (1) 55 Not provided
Total combined R&D and SG&A expenses excluding
certain share-based compensation 6,757 Approx. 0% - increase 1%
Share-based compensation allocated to R&D and SG&A 1,010 Not provided
Total GAAP combined R&D and SG&A expenses (2) 7,767$ Approx. 0% - increase 1%
(1) Other items excluded from Non-GAAP include certain acquisition-related items and other items. Beginning in the first quarter of fiscal 2015, we changed our methodology
for reporting Non-GAAP results to exclude third-party acquisition and integration services costs and certain other items, which may include major restructuring and
restructuring-related costs, goodwill and long-lived asset impairment charges and litigation settlements and/or damages. Other items in fiscal 2014 consisted of
acquisition-related items.
(2) Fiscal 2015 total GAAP combined R&D and SG&A expenses guidance includes an estimate of the share-based compensation expense allocated to R&D and SG&A.
* Guidance as of Jul. 22, 2015

24
For more information on Qualcomm, visit us at:
www.qualcomm.com & www.qualcomm.com/blog © 2013-2015 Qualcomm Incorporated and/or its subsidiaries. All Rights Reserved.
Qualcomm, Snapdragon, and MSM are trademarks of Qualcomm Incorporated, registered in the United States and other countries. O ther products and brand names may be trademarks
of registered trademarks of their respective owners.
References in this presentation to Qualcomm may mean Qualcomm Incorporated, Qualcomm Technologies, Inc., and/or other subsidi aries or business units within the Qualcomm
corporate structure, as applicable.
Qualcomm Incorporated includes Qualcomm’s licensing business, QTL, and the vast majority of its patent portfolio. Qualcomm Te chnologies, Inc., a wholly-owned subsidiary of
Qualcomm Incorporated, operates, along with its subsidiaries, substantially all of Qualcomm’s engineering, research and devel opment functions, and substantially all of its product and
services businesses, including its semiconductor business, QCT.
Thank youFollow us on:


