Third quarter 2017 - Vestas | Home/media/vestas/investor/invest… · · 2017-11-09Third quarter...
25
Third quarter 2017 Vestas Wind Systems A/S Copenhagen, 9 November 2017 Classification: Public
Transcript of Third quarter 2017 - Vestas | Home/media/vestas/investor/invest… · · 2017-11-09Third quarter...
Third quarter 2017Vestas Wind Systems A/S
Copenhagen, 9 November 2017
Classification: Public
Disclaimer and cautionary statement
9 November, 2017Third quarter 2017 (Public)2
This document contains forward-looking statements concerning Vestas’ financial condition, results of operations and business. All statements otherthan statements of historical fact are, or may be deemed to be, forward-looking statements. Forward-looking statements are statements of futureexpectations that are based on management’s current expectations and assumptions and involve known and unknown risks and uncertainties thatcould cause actual results, performance, or events to differ materially from those expressed or implied in these statements.
Forward-looking statements include, among other things, statements concerning Vestas’ potential exposure to market risks and statementsexpressing management’s expectations, beliefs, estimates, forecasts, projections and assumptions. A number of factors that affect Vestas’ futureoperations and could cause Vestas’ results to differ materially from those expressed in the forward-looking statements included in this document,include (without limitation): (a) changes in demand for Vestas’ products; (b) currency and interest rate fluctuations; (c) loss of market share andindustry competition; (d) environmental and physical risks, including adverse weather conditions; (e) legislative, fiscal, and regulatory developments,including changes in tax or accounting policies; (f) economic and financial market conditions in various countries and regions; (g) political risks,including the risks of expropriation and renegotiation of the terms of contracts with governmental entities, and delays or advancements in theapproval of projects; (h) ability to enforce patents; (i) product development risks; (j) cost of commodities; (k) customer credit risks; (l) supply ofcomponents; and (m) customer created delays affecting product installation, grid connections and other revenue-recognition factors.
All forward-looking statements contained in this document are expressly qualified by the cautionary statements contained or referenced to in thisstatement. Undue reliance should not be placed on forward-looking statements. Additional factors that may affect future results are contained inVestas’ annual report for the year ended 31 December 2016 (available at www.vestas.com/investor) and these factors also should be considered.Each forward-looking statement speaks only as of the date of this document. Vestas does not undertake any obligation to publicly update or reviseany forward-looking statement as a result of new information or future events other than as required by Danish law. In light of these risks, resultscould differ materially from those stated, implied or inferred from the forward-looking statements contained in this document.
Key highlightsSolid performance in Q3
9 November, 20173
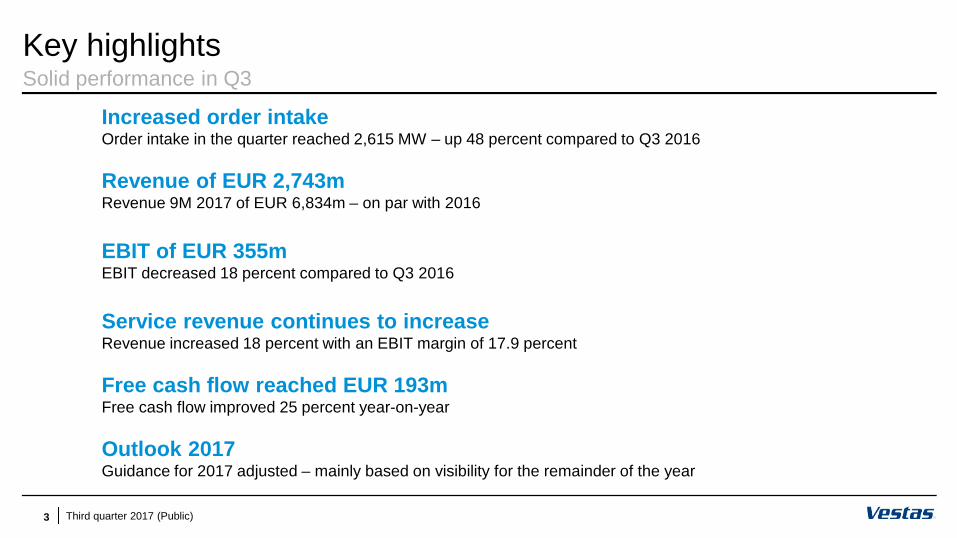
Increased order intakeOrder intake in the quarter reached 2,615 MW – up 48 percent compared to Q3 2016
Revenue of EUR 2,743mRevenue 9M 2017 of EUR 6,834m – on par with 2016
EBIT of EUR 355mEBIT decreased 18 percent compared to Q3 2016
Service revenue continues to increaseRevenue increased 18 percent with an EBIT margin of 17.9 percent
Free cash flow reached EUR 193mFree cash flow improved 25 percent year-on-year
Outlook 2017Guidance for 2017 adjusted – mainly based on visibility for the remainder of the year
Third quarter 2017 (Public)
9 November, 20174 Third quarter 2017 (Public)
Agenda
9 November, 20174
1. Orders and markets
2. Financials
3. Outlook and questions & answers
Q3 Interim financial report,third quarter 2017
Third quarter 2017 (Public)
The wind power industry continues to evolve
9 November, 20175
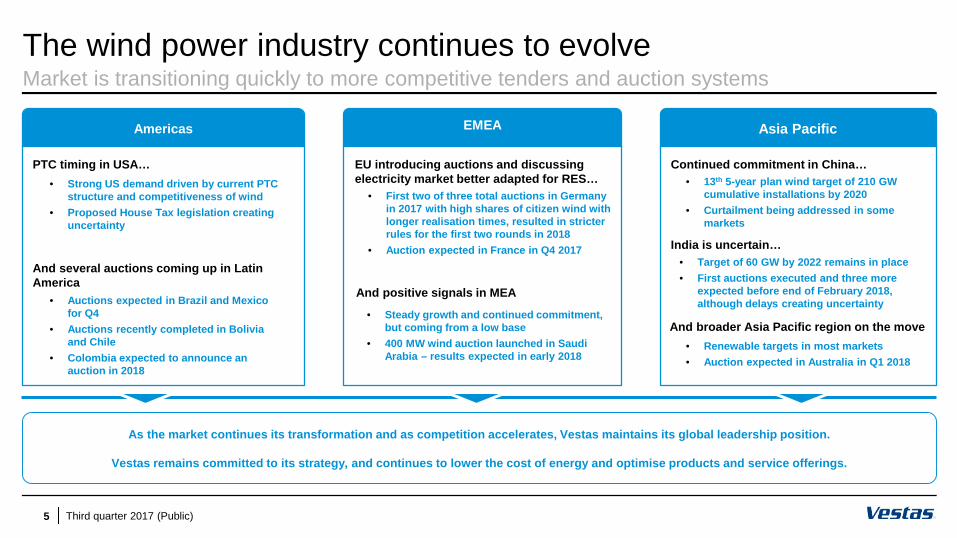
Market is transitioning quickly to more competitive tenders and auction systems
EU introducing auctions and discussing electricity market better adapted for RES…
• First two of three total auctions in Germany in 2017 with high shares of citizen wind with longer realisation times, resulted in stricter rules for the first two rounds in 2018
• Auction expected in France in Q4 2017
And positive signals in MEA
• Steady growth and continued commitment, but coming from a low base
• 400 MW wind auction launched in Saudi Arabia – results expected in early 2018
EMEA Asia PacificAmericas
PTC timing in USA…• Strong US demand driven by current PTC
structure and competitiveness of wind • Proposed House Tax legislation creating
uncertainty
And several auctions coming up in Latin America
• Auctions expected in Brazil and Mexico for Q4
• Auctions recently completed in Bolivia and Chile
• Colombia expected to announce an auction in 2018
Continued commitment in China…• 13th 5-year plan wind target of 210 GW
cumulative installations by 2020• Curtailment being addressed in some
markets
India is uncertain…• Target of 60 GW by 2022 remains in place• First auctions executed and three more
expected before end of February 2018, although delays creating uncertainty
And broader Asia Pacific region on the move• Renewable targets in most markets• Auction expected in Australia in Q1 2018
Asia Pacific
As the market continues its transformation and as competition accelerates, Vestas maintains its global leadership position.
Vestas remains committed to its strategy, and continues to lower the cost of energy and optimise products and service offerings.
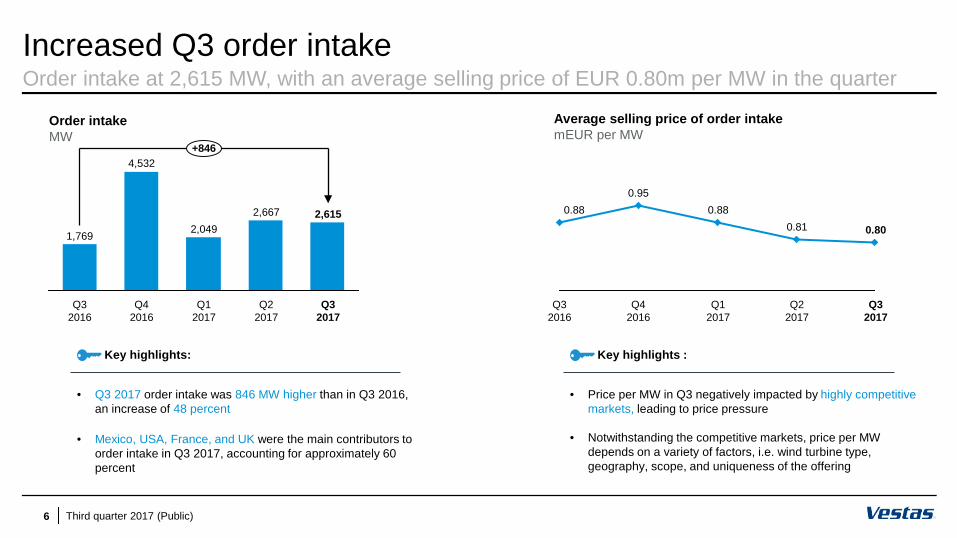
Increased Q3 order intakeOrder intake at 2,615 MW, with an average selling price of EUR 0.80m per MW in the quarter
9 November, 20176
Order intakeMW
Q42016
Q32017
4,532
Q22017
1,769
Q32016
+846
2,615
Q12017
2,6672,049
Average selling price of order intakemEUR per MW
Q32017
0.80
Q22017
0.88
Q42016
0.95
0.81
Q12017
Q32016
0.88
• Q3 2017 order intake was 846 MW higher than in Q3 2016, an increase of 48 percent
• Mexico, USA, France, and UK were the main contributors to order intake in Q3 2017, accounting for approximately 60 percent
Key highlights:
• Price per MW in Q3 negatively impacted by highly competitive markets, leading to price pressure
• Notwithstanding the competitive markets, price per MW depends on a variety of factors, i.e. wind turbine type, geography, scope, and uniqueness of the offering
Key highlights :
Third quarter 2017 (Public)
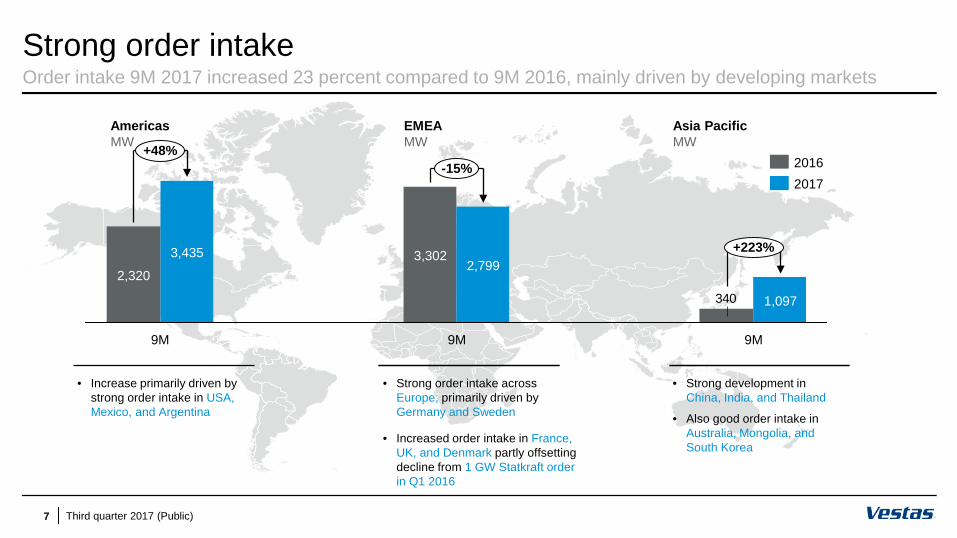
Strong order intakeOrder intake 9M 2017 increased 23 percent compared to 9M 2016, mainly driven by developing markets
9 November, 20177
340
9M9M
3,3023,435
1,097
2,7992,320
9M
+48%
+223%
-15% 20162017
AmericasMW
EMEAMW
Asia PacificMW
• Increase primarily driven by strong order intake in USA, Mexico, and Argentina
• Strong order intake across Europe, primarily driven by Germany and Sweden
• Increased order intake in France, UK, and Denmark partly offsetting decline from 1 GW Statkraft orderin Q1 2016
• Strong development in China, India, and Thailand
• Also good order intake in Australia, Mongolia, and South Korea
Third quarter 2017 (Public)
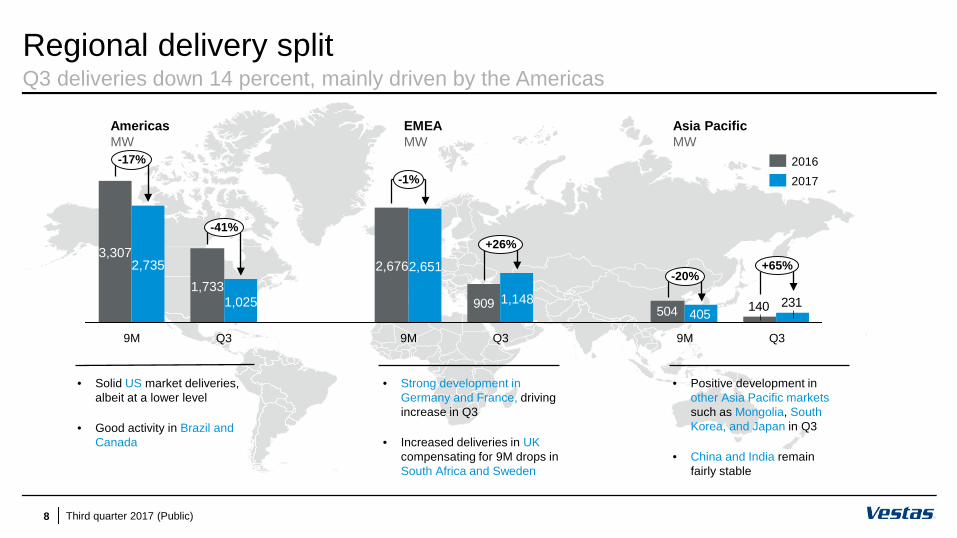
Regional delivery splitQ3 deliveries down 14 percent, mainly driven by the Americas
9 November, 20178
140504909 231405
1,733
9M
1,025
9M
-20%
Q3
2,676
-41%
Q3
1,148
+65%
-17%
Q3
+26%
-1%
2,6512,735
9M
3,307
20172016
AmericasMW
EMEAMW
Asia PacificMW
• Solid US market deliveries, albeit at a lower level
• Good activity in Brazil and Canada
• Strong development in Germany and France, driving increase in Q3
• Increased deliveries in UK compensating for 9M drops in South Africa and Sweden
• Positive development in other Asia Pacific markets such as Mongolia, South Korea, and Japan in Q3
• China and India remainfairly stable
Third quarter 2017 (Public)
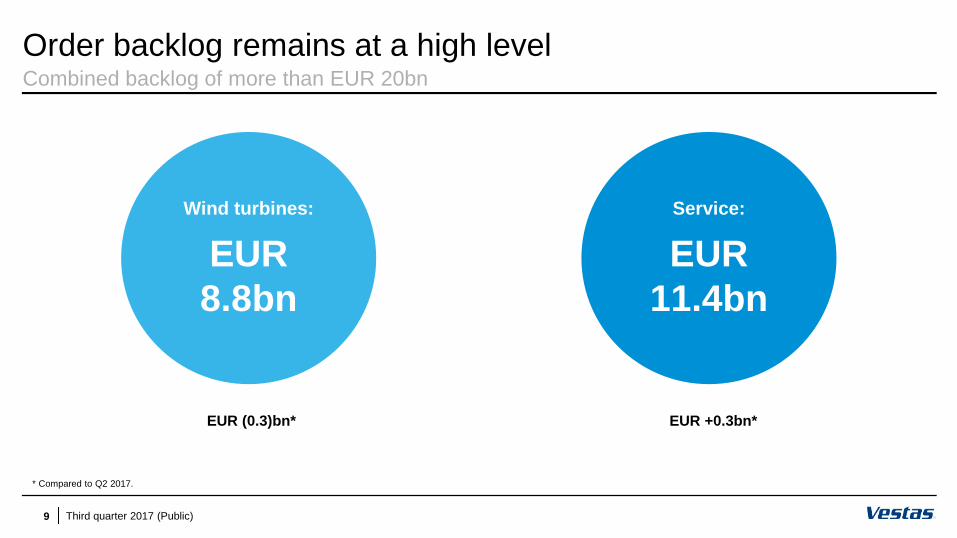
* Compared to Q2 2017.
Order backlog remains at a high levelCombined backlog of more than EUR 20bn
9 November, 20179
Wind turbines:
EUR 8.8bn
Service:
EUR 11.4bn
EUR (0.3)bn*
Third quarter 2017 (Public)
EUR +0.3bn*
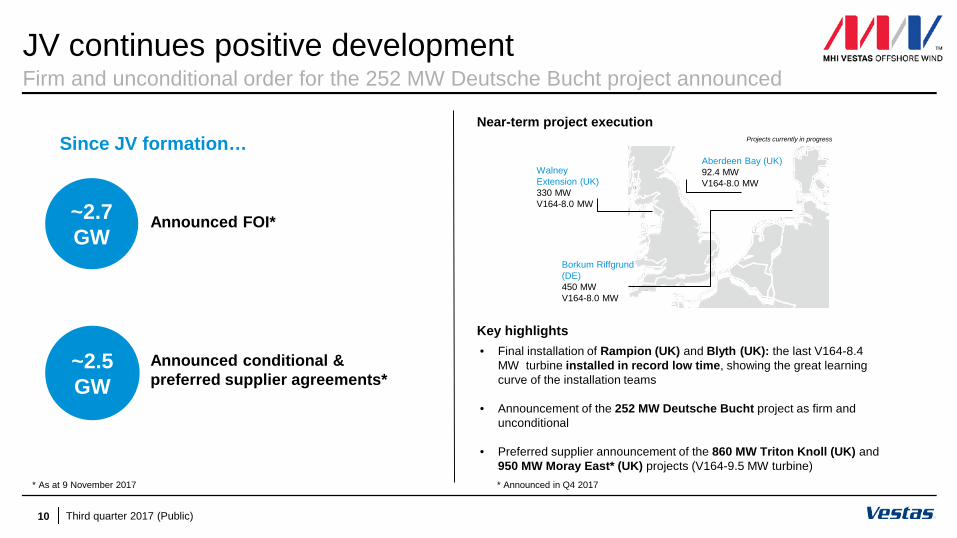
JV continues positive developmentFirm and unconditional order for the 252 MW Deutsche Bucht project announced
9 November, 2017
10
Near-term project execution
• Final installation of Rampion (UK) and Blyth (UK): the last V164-8.4 MW turbine installed in record low time, showing the great learning curve of the installation teams
• Announcement of the 252 MW Deutsche Bucht project as firm and unconditional
• Preferred supplier announcement of the 860 MW Triton Knoll (UK) and950 MW Moray East* (UK) projects (V164-9.5 MW turbine)
WalneyExtension (UK)330 MWV164-8.0 MW
Projects currently in progress
Third quarter 2017 (Public)
Borkum Riffgrund (DE)450 MWV164-8.0 MW
~2.5 GW
Announced conditional & preferred supplier agreements*
~2.7 GW
Announced FOI*
Since JV formation…Aberdeen Bay (UK)92.4 MWV164-8.0 MW
Key highlights
* As at 9 November 2017 * Announced in Q4 2017
9 November, 201711 Third quarter 2017 (Public)
Agenda
9 November, 201711
1. Orders and markets
2. Financials
3. Outlook and questions & answers
Interim financial report,third quarter 2017
Q3
Third quarter 2017 (Public)12
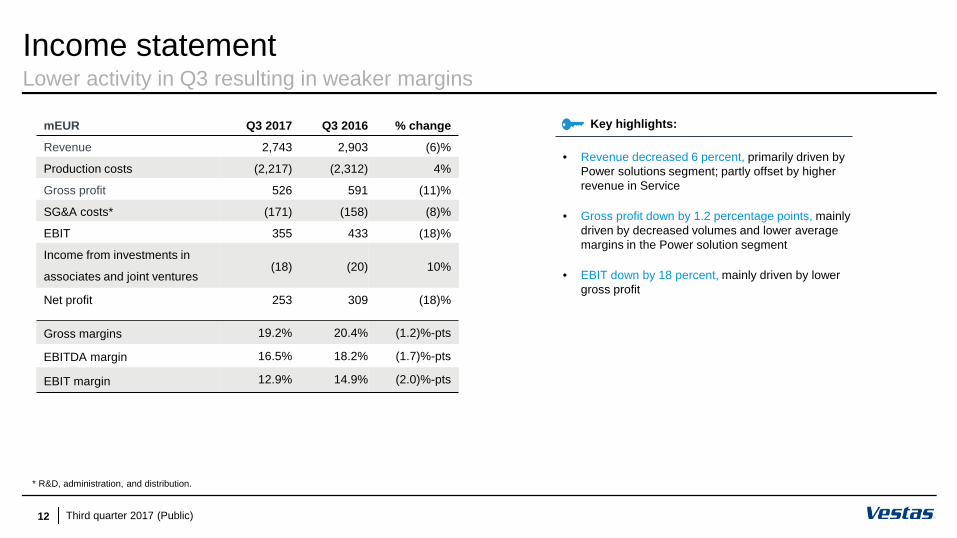
Income statementLower activity in Q3 resulting in weaker margins
mEUR Q3 2017 Q3 2016 % change
Revenue 2,743 2,903 (6)%
Production costs (2,217) (2,312) 4%
Gross profit 526 591 (11)%
SG&A costs* (171) (158) (8)%
EBIT 355 433 (18)%
Income from investments in
associates and joint ventures(18) (20) 10%
Net profit 253 309 (18)%
Gross margins 19.2% 20.4% (1.2)%-pts
EBITDA margin 16.5% 18.2% (1.7)%-pts
EBIT margin 12.9% 14.9% (2.0)%-pts
9 November, 2017
• Revenue decreased 6 percent, primarily driven by Power solutions segment; partly offset by higherrevenue in Service
• Gross profit down by 1.2 percentage points, mainly driven by decreased volumes and lower average margins in the Power solution segment
• EBIT down by 18 percent, mainly driven by lower gross profit
Key highlights:
* R&D, administration, and distribution.
* R&D, administration, and distribution on trailing 12 months basis.
13
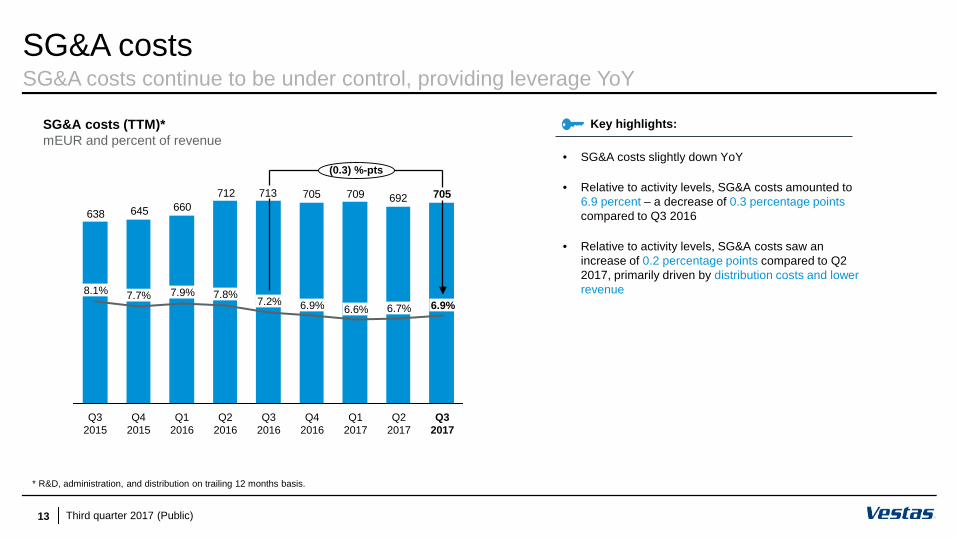
SG&A costsSG&A costs continue to be under control, providing leverage YoY
9 November, 2017
709705713712660645638
705692
Q32017
6.9%
(0.3) %-pts
Q22017
6.6%7.7% 7.2%7.8%
6.9%
Q42016
Q12016
Q22016
Q42015
Q32016
Q32015
7.9%6.7%
Q12017
8.1%
SG&A costs (TTM)*mEUR and percent of revenue
• SG&A costs slightly down YoY
• Relative to activity levels, SG&A costs amounted to 6.9 percent – a decrease of 0.3 percentage points compared to Q3 2016
• Relative to activity levels, SG&A costs saw an increase of 0.2 percentage points compared to Q2 2017, primarily driven by distribution costs and lower revenue
Key highlights:
Third quarter 2017 (Public)
14
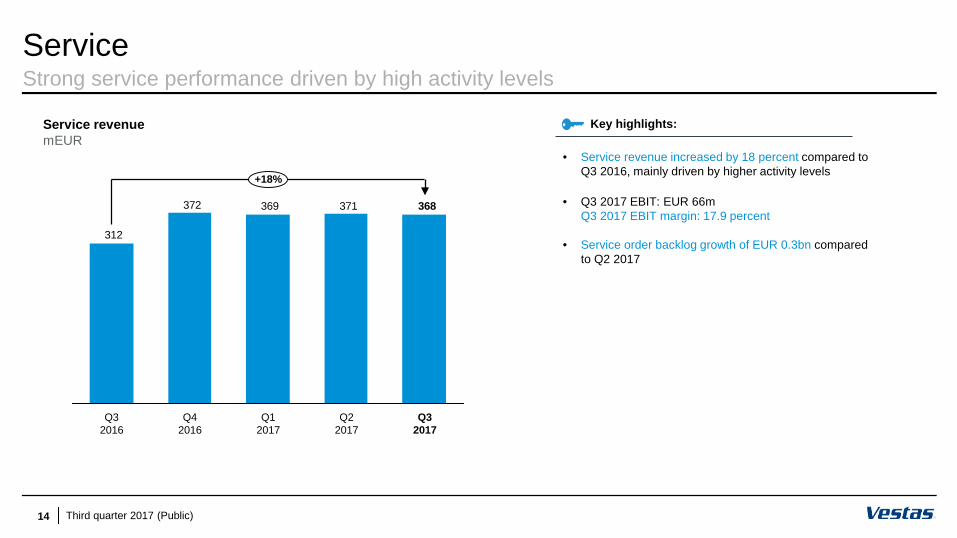
ServiceStrong service performance driven by high activity levels
9 November, 2017
369372
312
368371
+18%
Q32017
Q32016
Q42016
Q12017
Q22017
• Service revenue increased by 18 percent compared to Q3 2016, mainly driven by higher activity levels
• Q3 2017 EBIT: EUR 66m Q3 2017 EBIT margin: 17.9 percent
• Service order backlog growth of EUR 0.3bn compared to Q2 2017
Service revenuemEUR
Key highlights:
Third quarter 2017 (Public)
15
Balance sheetBalance sheet remains strong
9 November, 2017
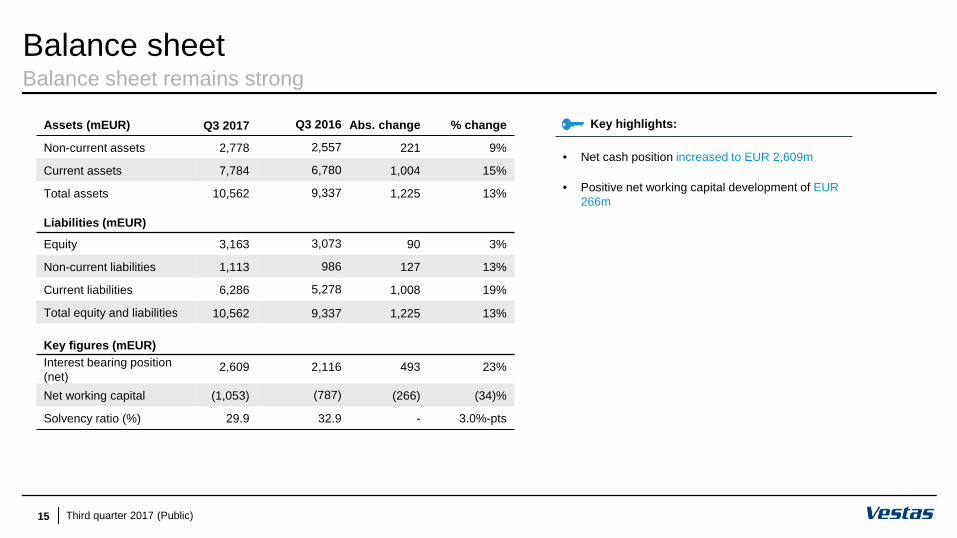
Assets (mEUR) Q3 2017 Q3 2016 Abs. change % change
Non-current assets 2,778 2,557 221 9%
Current assets 7,784 6,780 1,004 15%
Total assets 10,562 9,337 1,225 13%
Liabilities (mEUR)
Equity 3,163 3,073 90 3%
Non-current liabilities 1,113 986 127 13%
Current liabilities 6,286 5,278 1,008 19%
Total equity and liabilities 10,562 9,337 1,225 13%
Key figures (mEUR)Interest bearing position (net)
2,609 2,116 493 23%
Net working capital (1,053) (787) (266) (34)%
Solvency ratio (%) 29.9 32.9 - 3.0%-pts
• Net cash position increased to EUR 2,609m
• Positive net working capital development of EUR 266m
Key highlights:
Third quarter 2017 (Public)
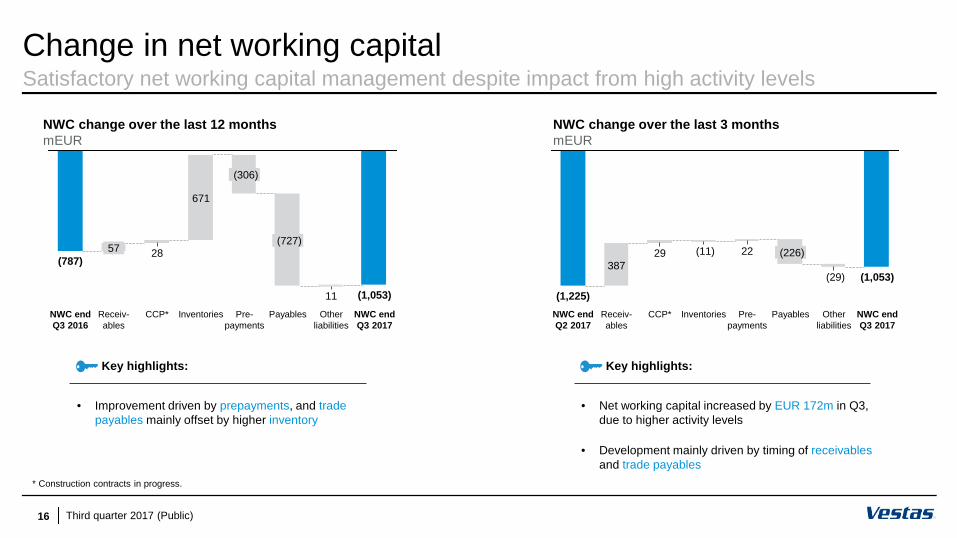
* Construction contracts in progress.
16
Change in net working capitalSatisfactory net working capital management despite impact from high activity levels
9 November, 2017
(787)57
NWC endQ3 2016
28
Receiv-ables
11
(727)
(306)
Inventories Other liabilities
Pre-payments
Payables
671
NWC endQ3 2017
CCP*
(1,053)CCP*
(1,053)
(226)29
Pre-payments
22
Other liabilities
(11)
Payables
(29)
NWC endQ3 2017
Inventories
387
NWC endQ2 2017
(1,225)Receiv-ables
NWC change over the last 3 monthsmEUR
NWC change over the last 12 monthsmEUR
• Improvement driven by prepayments, and tradepayables mainly offset by higher inventory
Key highlights:
• Net working capital increased by EUR 172m in Q3, due to higher activity levels
• Development mainly driven by timing of receivablesand trade payables
Key highlights:
Third quarter 2017 (Public)
0
1
2
3
4
5
6
Dec 2014
Dec 2013
Dec 2015
Dec 2010
Dec 2012
Dec 2011
Dec 2016
Dec 2009
Sep 2017
17
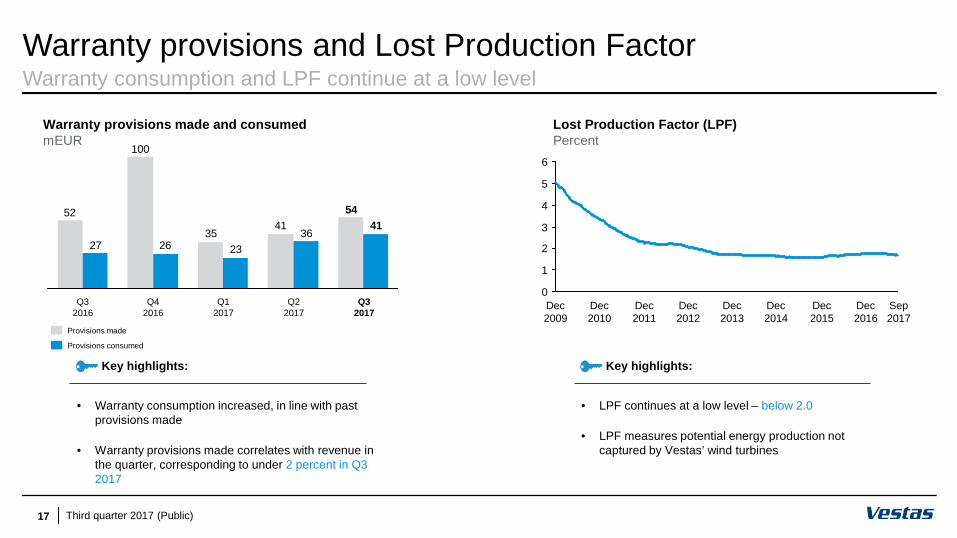
Warranty provisions and Lost Production FactorWarranty consumption and LPF continue at a low level
9 November, 2017
4135
100
52 54
36232627
41
Q32017
Q42016
Q32016
Q22017
Q12017
Provisions made
Provisions consumed
Lost Production Factor (LPF)Percent
Warranty provisions made and consumedmEUR
• Warranty consumption increased, in line with past provisions made
• Warranty provisions made correlates with revenue in the quarter, corresponding to under 2 percent in Q3 2017
Key highlights:
• LPF continues at a low level – below 2.0
• LPF measures potential energy production not captured by Vestas’ wind turbines
Key highlights:
Third quarter 2017 (Public)
18
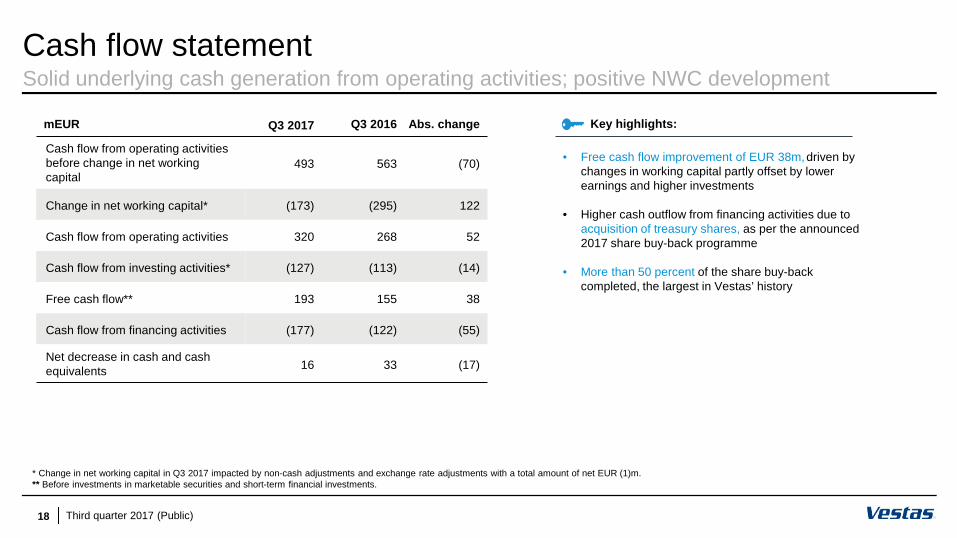
Cash flow statementSolid underlying cash generation from operating activities; positive NWC development
mEUR Q3 2017 Q3 2016 Abs. change
Cash flow from operating activities before change in net working capital
493 563 (70)
Change in net working capital* (173) (295) 122
Cash flow from operating activities 320 268 52
Cash flow from investing activities* (127) (113) (14)
Free cash flow** 193 155 38
Cash flow from financing activities (177) (122) (55)
Net decrease in cash and cash equivalents 16 33 (17)
9 November, 2017
• Free cash flow improvement of EUR 38m, driven by changes in working capital partly offset by lower earnings and higher investments
• Higher cash outflow from financing activities due to acquisition of treasury shares, as per the announced 2017 share buy-back programme
• More than 50 percent of the share buy-back completed, the largest in Vestas’ history
* Change in net working capital in Q3 2017 impacted by non-cash adjustments and exchange rate adjustments with a total amount of net EUR (1)m.** Before investments in marketable securities and short-term financial investments.
Key highlights:
Third quarter 2017 (Public)
19
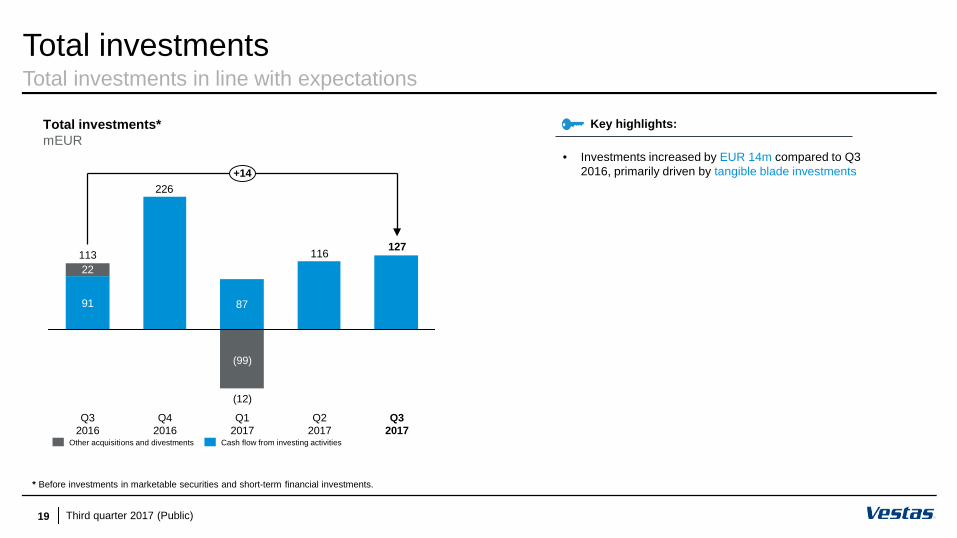
Total investmentsTotal investments in line with expectations
9 November, 2017
226
127116
91 87
22
+14
(99)
Q32016
(12)
Q22017
Q42016
Q12017
113
Q32017
Other acquisitions and divestments Cash flow from investing activities
Total investments*mEUR
Key highlights:
• Investments increased by EUR 14m compared to Q3 2016, primarily driven by tangible blade investments
* Before investments in marketable securities and short-term financial investments.
Third quarter 2017 (Public)
20
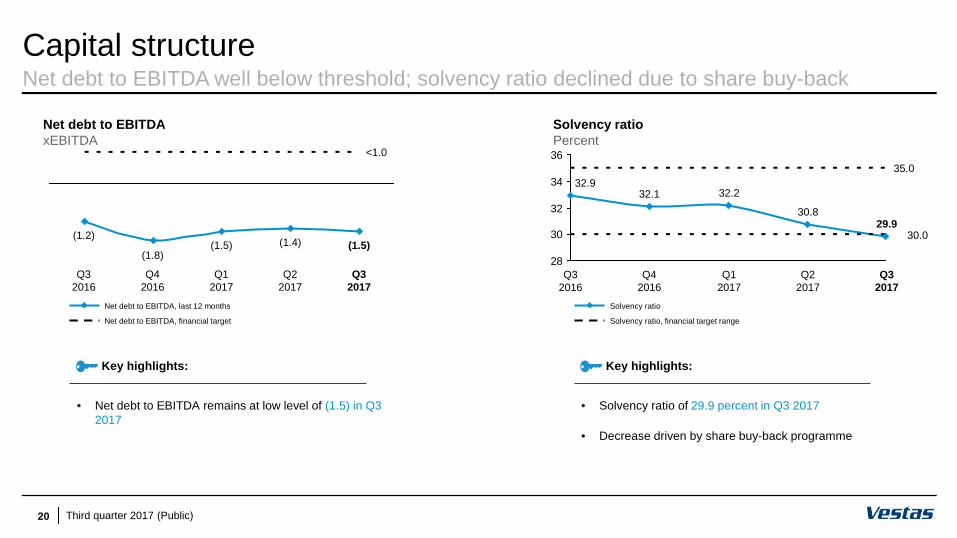
Capital structureNet debt to EBITDA well below threshold; solvency ratio declined due to share buy-back
9 November, 2017
(1.5)(1.8)
Q32016
Q42016
(1.2)
Q22017
(1.4) (1.5)
Q12017
Q32017
<1.0
Net debt to EBITDA, financial target
Net debt to EBITDA, last 12 months
28
30
32
34
36
30.0
35.0
Q32016
32.130.8
29.9
Q12017
Q42016
Q22017
32.232.9
Q32017
Solvency ratio, financial target range
Solvency ratio
Solvency ratioPercent
Net debt to EBITDAxEBITDA
• Net debt to EBITDA remains at low level of (1.5) in Q3 2017
Key highlights:
• Solvency ratio of 29.9 percent in Q3 2017
• Decrease driven by share buy-back programme
Key highlights:
Third quarter 2017 (Public)
21
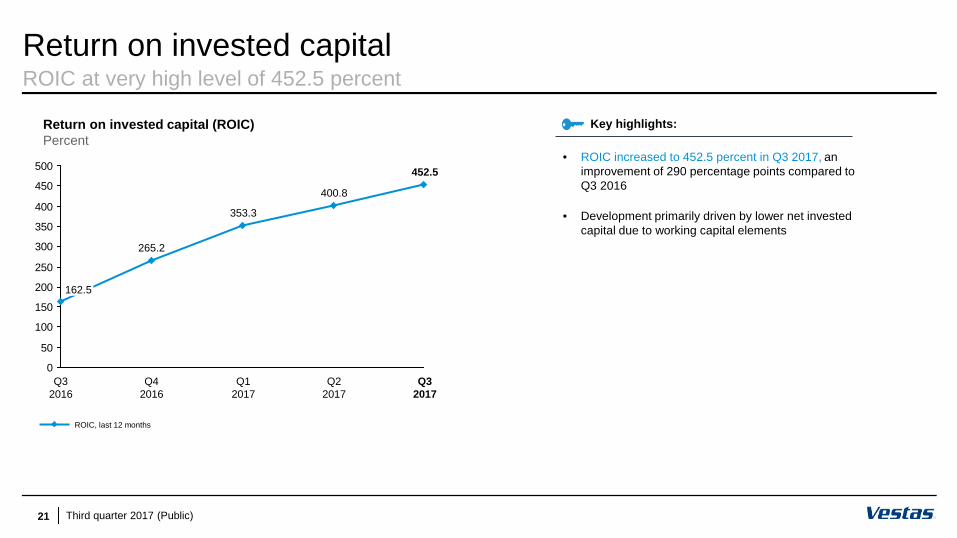
Return on invested capitalROIC at very high level of 452.5 percent
9 November, 2017
0
50
100
150
200
250
300
350
400
450
500
353.3
Q12017
Q22017
400.8
265.2
Q42016
Q32016
162.5
452.5
Q32017
ROIC, last 12 months
• ROIC increased to 452.5 percent in Q3 2017, an improvement of 290 percentage points compared to Q3 2016
• Development primarily driven by lower net invested capital due to working capital elements
Return on invested capital (ROIC)Percent
Key highlights:
Third quarter 2017 (Public)
9 November, 201722 Third quarter 2017 (Public)
Agenda
9 November, 201722
1. Orders and markets
2. Financials
3. Outlook and questions & answers
Interim financial report,Third quarter 2017
Q3
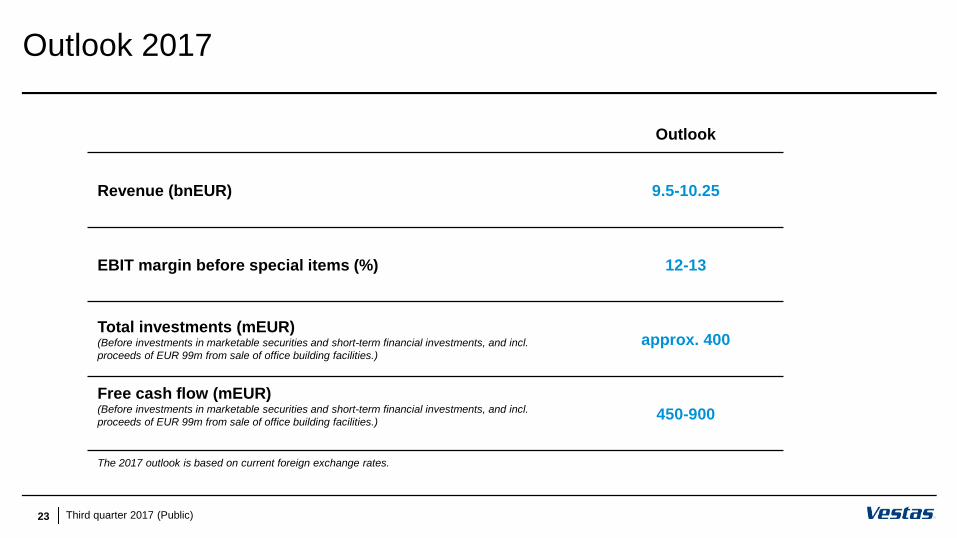
Outlook 2017
9 November, 201723
Outlook
Revenue (bnEUR) 9.5-10.25
EBIT margin before special items (%) 12-13
Total investments (mEUR)(Before investments in marketable securities and short-term financial investments, and incl. proceeds of EUR 99m from sale of office building facilities.)
approx. 400
Free cash flow (mEUR)(Before investments in marketable securities and short-term financial investments, and incl. proceeds of EUR 99m from sale of office building facilities.) 450-900
The 2017 outlook is based on current foreign exchange rates.
Third quarter 2017 (Public)
9 November, 201724
Q&AFinancial calendar 2018:
• Disclosure of annual report 2017 and outlook for 2018 (7 February)
• Annual General Meeting in Aarhus (3 April)
• Disclosure of Q1 2018 (4 May)
• Disclosure of Q2 2018 (15 August)
• Disclosure of Q3 2018 (7 November)
Third quarter 2017 (Public)
Thank you for your attention
Copyright NoticeThe documents are created by Vestas Wind Systems A/S and contain copyrighted material, trademarks, and other proprietary information. All rights reserved. No part of the documents may be reproduced or copied in any form or by anymeans - such as graphic, electronic, or mechanical, including photocopying, taping, or information storage and retrieval systems without the prior written permission of Vestas Wind Systems A/S. The use of these documents by you, oranyone else authorized by you, is prohibited unless specifically permitted by Vestas Wind Systems A/S. You may not alter or remove any trademark, copyright or other notice from the documents. The documents are provided “as is” andVestas Wind Systems A/S shall not have any responsibility or liability whatsoever for the results of use of the documents by you.