Interim financial report - First quarter 2014 - Vestas | Home/media/vestas/investor/invest… ·...
16
Market outlook Anders Runevad, Group President & CEO London, 21 June 2016 Classification: Public
Transcript of Interim financial report - First quarter 2014 - Vestas | Home/media/vestas/investor/invest… ·...

Market outlook
Anders Runevad, Group President & CEO
London, 21 June 2016
Classification: Public

This presentation contains forward-looking statements concerning Vestas' financial condition, results of
operations and business. All statements other than statements of historical fact are, or may be deemed to be,
forward-looking statements. Forward-looking statements are statements of future expectations that are based on
management’s current expectations and assumptions and involve known and unknown risks and uncertainties
that could cause actual results, performance or events to differ materially from those expressed or implied in
these statements.
Forward-looking statements include, among other things, statements concerning Vestas' potential exposure to
market risks and statements expressing management’s expectations, beliefs, estimates, forecasts, projections
and assumptions. There are a number of factors that could affect Vestas' future operations and could cause
Vestas' results to differ materially from those expressed in the forward-looking statements included in this
presentation, including (without limitation): (a) changes in demand for Vestas' products; (b) currency and interest
rate fluctuations; (c) loss of market share and industry competition; (d) environmental and physical risks; (e)
legislative, fiscal and regulatory developments, including changes in tax or accounting policies; (f) economic and
financial market conditions in various countries and regions; (g) political risks, including the risks of expropriation
and renegotiation of the terms of contracts with governmental entities, and delays or advancements in the
approval of projects; (h) ability to enforce patents; (i) product development risks; (j) cost of commodities; (k)
customer credit risks; (l) supply of components from suppliers and vendors; and (m) customer readiness and
ability to accept delivery and installation of products and transfer of risk.
All forward-looking statements contained in this presentation are expressly qualified by the cautionary
statements contained or referenced to in this statement. Undue reliance should not be placed on forward-looking
statements. Additional factors that may affect future results are contained in Vestas' annual report for the year
ended 31 December 2015 (available at vestas.com/investor) and these factors also should be considered. Each
forward-looking statement speaks only as of the date of this presentation. Vestas does not undertake any
obligation to publicly update or revise any forward-looking statement as a result of new information or future
events others than required by Danish law. In light of these risks, results could differ materially from those stated,
implied or inferred from the forward-looking statements contained in this presentation.
Disclaimer and cautionary statement
│ CMD 2016 – Market outlook 2 Classification: Public

What is the real market opportunity? Today, renewable energy only accounts for a small portion of total world energy consumption
Source: BP Statistical Review of World Energy 2016.
│ CMD 2016 – Market outlook 3 Classification: Public
World energy consumption by source
Million tonnes oil equivalent

Renewable energy to lead the way in global electricity generation Growth in energy demand expected to be met primarily by renewable energy sources with wind
forecasted to lead
Source: IEA, World Energy Outlook 2015, November 2015.
│ CMD 2016 – Market outlook 4
Renewables expected to account for half of additional global electricity generation, overtaking
coal around 2030 to become the largest power source.
Classification: Public
Global electricity generation by source in 2014 and 2040
TWh
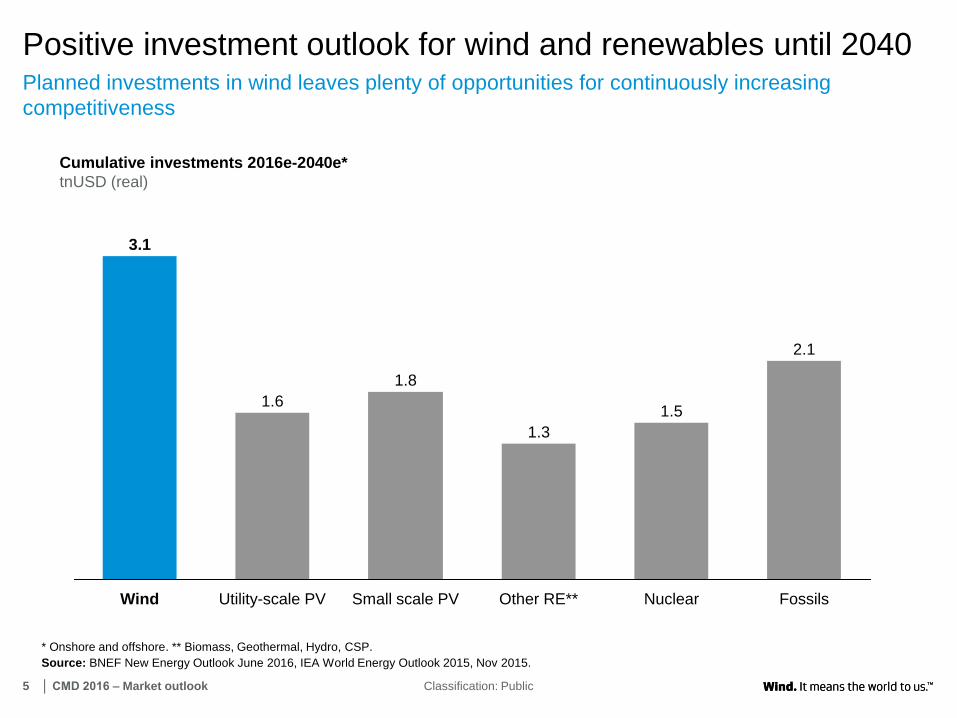
Positive investment outlook for wind and renewables until 2040 Planned investments in wind leaves plenty of opportunities for continuously increasing
competitiveness
5 │ CMD 2016 – Market outlook Classification: Public
Cumulative investments 2016e-2040e*
tnUSD (real)
Nuclear Other RE** Fossils Small scale PV Utility-scale PV Wind
2.1
1.5
3.1
1.6
1.8
1.3
* Onshore and offshore. ** Biomass, Geothermal, Hydro, CSP.
Source: BNEF New Energy Outlook June 2016, IEA World Energy Outlook 2015, Nov 2015.

Long-term outlook for wind and renewables Wind to remain the main utility-scale renewable energy source
6 │ CMD 2016 – Market outlook Classification: Public
Cumulative capacity
GW
21%
21%
21%
2%
5%
8%
5%8%
12%
2013
5,884
2020e
71%
7,299
2030e
59%
8,995
65%
* Onshore and offshore. ** Biomass, Geothermal, Hydro, Solar thermal.
Source: IEA World Energy Outlook Nov 2015.
Solar
Non-renewables
Other RE
Wind

Long-term outlook for LCOE LCOE for wind and solar to decrease
7 │ CMD 2016 – Market outlook Classification: Public
Source: BNEF New Energy Outlook June 2016, Vestas analysis.
Onshore wind
USD/ MWh (real)
Utility scale PV
USD/ MWh (real)
Coal
USD/ MWh (real)
Gas
USD/ MWh (real)
40
0
20
40
60
80
100
2016
60
2030e
40
0
20
40
60
80
100
120
60
2016 2030e
40
0
20
40
60
80
100
120
2016
100
2030e
50
0
20
40
60
80
100
120
2030e
105
2016

Why wind will remain the preferred renewables choice The competitiveness of wind will continue to improve. Market specific reduction between 23 and
36 percent expected 2016-2030
│ CMD 2016 – Market outlook 8 Classification: Public
Source: BNEF Global Wind LCOE Update H1-2016.
Expected LCOE development, onshore wind
USD/MWh
64 6049
-23%
2030e 2016 2020e
USA
7560
48
-36%
Mexico
6653 44
-32%
Brazil
78 7356
-27%
Germany
75 6550
-33%
China
6960
48
-30%
Australia

Long-term outlook for wind penetration Significant upside in both OECD and non-OECD markets
9 │ CMD 2016 – Market outlook Classification: Public
OECD wind* penetration
Percent of cumulative capacity
Non-OECD wind* penetration
Percent of cumulative capacity
12%
9%
2030e
11%
2020e 2015
+33%
2030e
11%
2020e 2015
8%
5%
+120%
* Onshore and offshore.
Source: BNEF New Energy Outlook June 2015.

Significant asset pool to
be decommissioned
Decommissioned capacity
between 2016-30e
GW
• A total of 344 GW is ex-
pected to be decommis-
sioned between 2016-30.
Drivers of renewable demand – OECD markets Decommissioning of assets and long-term policy targets secure wind and renewables additions
│ CMD 2016 – Market outlook 10 Classification: Public
* Based on 1990-levels. ** Clean Power Plan awaiting Supreme Court decision.
Source: BNEF New Energy Finance June 2015, BNEF Global Summit April 2016 Corporate Procurement, BNEF H2 2015 Australia Energy Market Outlook; BNEF Q1
2016 European Policy Update, European Parliament Briefing Jan 2016, Press.
Long-term support for
renewables
Push for early retire-
ment of non-renewables
Economic decarbonising,
and demand driven:
Strong regulatory
support:
COP21 creating push for
long-term RE support.
155
109
65
16
Coal
Gas
Nuclear
Oil
• Shut down
of seven
power plants (gas and
coal) in UK to avoid costly
retrofits.
• Shut down of
all AGL-owned
coal plants by
2050 to decarbonise and
to make new investments.
• Enel will shut
down 8 GW of
gas plants in Europe
among others due to the
rise of renewables.
2030 targets:
• 27% RE share.
• Cut GHG by 40%*.
• PTC support until
2023.
• CPP to set long-
term emission
targets**.

Significant growth in
electricity demand
Growth in electricity
demand
GWh
• Non-OECD CAGR of
2.6% expected from
2016-30e.
Drivers of renewable demand – non-OECD markets According to IEA, non-OECD countries will account for all the increase in energy use
│ CMD 2016 – Market outlook 11 Classification: Public
Source: BNEF New Energy Finance June 2015, Vestas Public Affairs, European Parliament Briefing Jan 2016, IEA.
1917
1513 11111111
+2.6%
20
30
e
20
16
20
25
e
20
20
e
New growth markets
opening up
Long-term support for
renewables
Strong regulatory
support:
OECD Non-OECD
MoUs on energy
investments:
Rising investments
in RE:
• Laos.
• Pakistan.
• Ethiopia.
• Chile.
• Argentina.
• Peru.
• Ecuador.
• RE targets in place or
increasingly coming so.
• Establishment of
framework policies
around REs.
COP21 creating push for
long-term RE support.

Steady growth expected for wind Forecasts agree on a steady development for onshore and offshore market
12 │ CMD 2016 – Market outlook Classification: Public
New wind additions (onshore and offshore), global
GW
Source: BNEF Q2 2016 Global Wind Market Outlook, June 2016, MAKE Consulting Q2 2016 Global Wind Power Market Outlook Update.
66646359
55
7471
69
6158
2017e 2016e 2019e 2020e
+4.7%
2018e
+6.2%
MAKE Consulting
BNEF

Vestas key differentiators remain intact… Global reach, technology and service leadership, and scale give Vestas a unique position to
compete in the marketplace
Global reach Technology and service
leadership Scale
• Pioneer and most experienced
wind energy company in the
world.
• Unique global reach in terms of
sales, manufacturing, installation,
and service.
• In 2015, Vestas had order intake
from 34 countries and deliveries
in 34 countries.
• Wind turbines covering all wind
classes across the world.
• A broad range of service offerings
securing optimal performance.
• Best-in-class quality.
• World-class siting and
forecasting.
• More people dedicated to wind
than anyone else, largest volume.
• Largest global installed base of 75
GW across 75 countries.
• Largest service organisation with
63 GW under service.
• Data insights from monitoring of
more than 30,000 wind turbines.
│ CMD 2016 – Market outlook 13 Classification: Public

… and we are well positioned According to Make Consulting, Vestas is the global No. 1 in terms of market shares. Further,
Vestas was also the largest company in the industry as measured in revenue
│ CMD 2016 – Market outlook 14 Classification: Public
3.4%
Other
Guodian
Suzlon 3.8%
29.6%
Goldwind Siemens
3.6%
Sinovel 7.2% 7.6%
Vestas
16.3%
7.7%
GE
Gamesa
Enercon
8.8%
12.0%
Onshore and offshore, end 2015 Percent
Onshore, 2015 Percent
Cumulative historic installations 2015 grid-connected
100% = 431 GW
Vestas all time No. 1.
Guodian
5.3%
12.0%
6.2%
Vestas
Goldwind
Enercon
5.1%
GE
13.3%
11.0%
4.9% Gamesa
30.1%
Others
Senvion 3.3%
Mingyang
4.3%
Siemens
Envision
4.5%
100% = 58 GW
Vestas No. 1 in 2015.
Source: MAKE Consulting Global Wind Turbine OEM 2015 Market Share, March 2016.

Focus on Profitable Growth for Vestas continues Market environment and Vestas key differentiators continue to support our profitable growth
strategy
│ CMD 2016 – Market outlook 15
Our vision
Our mission
Our values
Our strategic objectives
To be the undisputed global wind leader
• Market leader in revenue
• Best-in-class margins
• Strongest brand in industry
• Bringing wind on a par with coal and gas
Deliver best-in-class wind energy solutions and set the pace in the
industry to the benefit of Vestas’ customers and the planet
Grow profitably in mature
and emerging markets
Capture the full potential of
the service business
Reduce levelised cost of energy (LCOE)
Improve operational excellence
Accountability, Collaboration, and Simplicity
Classification: Public

Copyright Notice
The documents are created by Vestas Wind Systems A/S and contain copyrighted material, trademarks, and other proprietary information. All rights reserved. No part of the documents may be reproduced or copied in any form or by any
means - such as graphic, electronic, or mechanical, including photocopying, taping, or information storage and retrieval systems without the prior written permission of Vestas Wind Systems A/S. The use of these documents by you, or
anyone else authorized by you, is prohibited unless specifically permitted by Vestas Wind Systems A/S. You may not alter or remove any trademark, copyright or other notice from the documents. The documents are provided “as is” and
Vestas Wind Systems A/S shall not have any responsibility or liability whatsoever for the results of use of the documents by you.
Thank you for your attention