ThinkNow Research Hispanic Consumer Media Habits
38
Hispanic Consumer Media Habits Results from ThinkNow Research Omnibus Survey August 2014
-
Upload
thinknow-research -
Category
Marketing
-
view
820 -
download
1
description
Hispanics outspend overall consumers in such areas as food purchases, telephone services, laundry and cleaning supplies and apparel & footwear among others. Hispanics over-index in spending on entertainment mediums that appeal to younger demographics such as video-game and music spending. To learn more about Hispanic consumer media habits, please download the SideShare file.
Transcript of ThinkNow Research Hispanic Consumer Media Habits

Hispanic Consumer Media Habits
Results from
ThinkNow Research Omnibus Survey
August 2014

Online PanelOver 30,000 respondents to recruit from
Nationally-representative per census
Unique recruitment model that encompasses online and offline recruitment methods such as Spanish-language television advertising
ResearchFortune 500 clients
Over 30 years of research experience specifically in the Hispanic market
Only Hispanic market research company that owns & operates an in-house panel
Experts in Hispanic Market Research
ThinkNow Research provides innovative online market research solutions for companies looking to understand the U.S. Hispanic consumer. We specialize in researching the U.S. Hispanic demographic and other hard-to-reach consumers in order to deliver high quality research to our clients that bear actionable and meaningful results.
2

ThinkNow Research designed several studies to take the pulse of U.S. Hispanic Consumers. Themes that
recurred across studies were that U.S. Hispanics are
Very Optimistic About the Future
and value being
Surrounded by Friends and Family
Which manifests in a number of consumer behaviors. In the following slides we look at how
these values drive Hispanic Consumer Media Habits
3

Outline
Methodology
Key Findings
Population Facts
Conclusions
4

Methodology
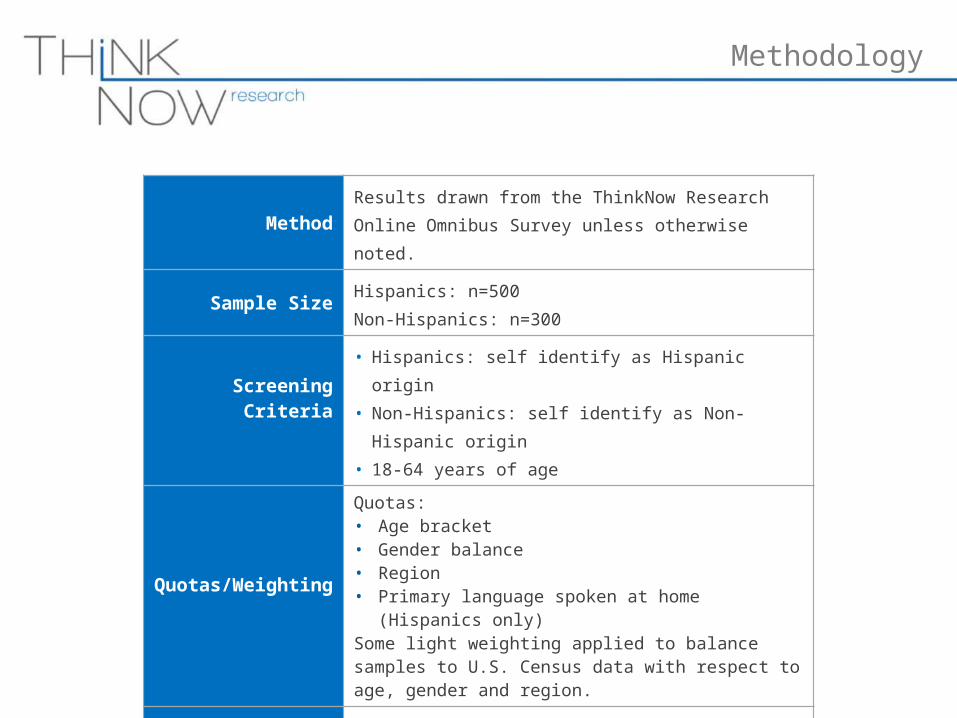
Methodology
Method Results drawn from the ThinkNow Research Online Omnibus Survey unless otherwise noted.
Sample Size Hispanics: n=500Non-Hispanics: n=300
Screening Criteria
• Hispanics: self identify as Hispanic origin• Non-Hispanics: self identify as Non-Hispanic
origin• 18-64 years of age
Quotas/Weighting
Quotas:• Age bracket• Gender balance• Region• Primary language spoken at home (Hispanics
only)Some light weighting applied to balance samples to U.S. Census data with respect to age, gender and region.
Test Area Nationwide
Fieldwork Timing Multiple Waves, 2014

7
Population Facts
Drawn from multiple sources.

US Population by Race and Ethnicity
12% 12% 12% 13%
9%13%
17%19%
4%
3%3%
2%
76%69%
63% 60%
4% 5% 6%African American
Asian
Hispanic
Other
White
Source: U.S. Census Bureau (2012 American Community Survey [ACS] 1-year estimate. Size of Asian not available for 1990.
Whites will become a
minority by 2050
1990 2000 Today53 million Hispanics
2020 66 million Hispanics
(Projection)
8
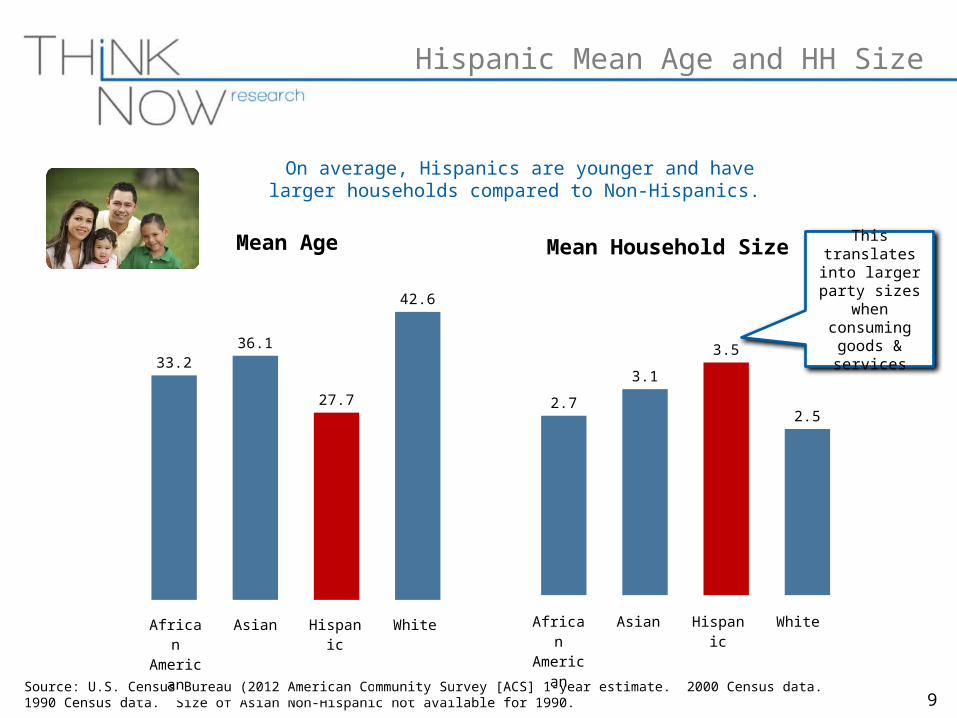
33.236.1
27.7
42.6
9
2.7
3.1
3.5
2.5
On average, Hispanics are younger and have larger households compared to Non-Hispanics.
Source: U.S. Census Bureau (2012 American Community Survey [ACS] 1-year estimate. 2000 Census data. 1990 Census data. Size of Asian Non-Hispanic not available for 1990.
African American
Asian Hispanic White
Mean Age Mean Household Size
African American
Asian Hispanic White
This translates into larger party sizes
when consuming
goods & services
Hispanic Mean Age and HH Size

“Biculturals” make up the biggest segment of the US Hispanic Population
Less25%
Bicultural45%
More30%
Acculturation Level
•ThinkNow Research uses an algorithm to segment Hispanic respondents into one of three acculturation groups. The variables used in the algorithm are:
• Number of years lived in the U.S.
• Language spoke in the home
• Language of media consumed
• Cultural affinity
ThinkNow Hispanic Omnibus Sample
More likely to:• Be born in the U.S.• Speak English only• Consume media in English only
More likely to:• Be born outside of U.S.• Speak Spanish only• Consume media in Spanish only
More Acculturated
Less Acculturated
Bicu
ltura
l
10

% Hispanic Millennial/Total DMA Millennial Population
Source: Geoscape, American Marketscape DataStream™ 2013 Series, Gen Y population/Hispanic Gen Y population
Los A
ngeles
New York
Houston
Chicago
Dallas-F
t. Worth
San Fr
ancisco
-Oakla
nd-San Jo
se
Miami-F
t. Lauderd
ale
Phoenix (Pre
scott)
San Antonio
Sacra
mento-Stock
ton-Modesto
Fresn
o-Visa
lia
San D
iego
Harlingen-W
eslaco
-Bro
wnsville
-McA
llen
Wash
ington, DC (H
agerstown)
Philadelphia
0%
20%
40%
60%
80%
100%
50%
28%41%
25%32% 31%
50%
33%
58%
32%
58%
35%
93%
18% 14%
% Hispani Millenia 2013l
In key DMAs, Hispanic Millennials already represent the majority
11

Hispanics outspend overall consumers in such areas as food purchases, telephone
services, laundry and cleaning supplies and apparel & footwear among others.
Hispanics over-index in spending on entertainment mediums that appeal to younger demographics such as video-
game and music spending.
12
13
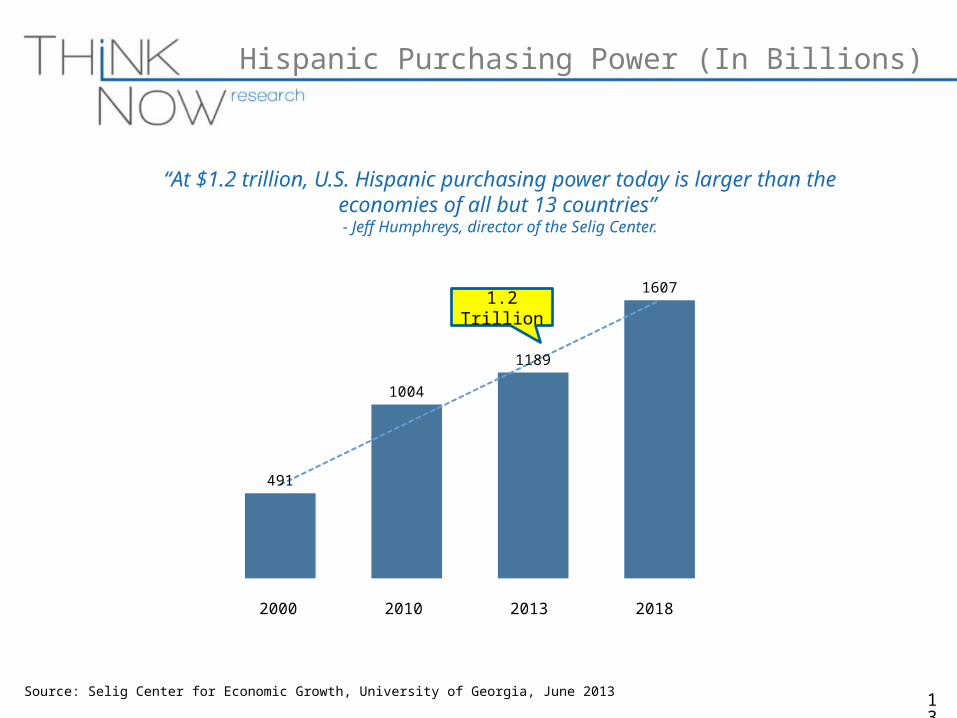
491
1004
1189
1607
“At $1.2 trillion, U.S. Hispanic purchasing power today is larger than the economies of all but 13 countries”
- Jeff Humphreys, director of the Selig Center.
2000 2010 2013 2018
Source: Selig Center for Economic Growth, University of Georgia, June 2013
1.2 Trillion
Hispanic Purchasing Power (In Billions)

Key Findings
14

Without a positive, optimistic attitude no progress would be made in terms of starting new businesses, starting new families, or committing to big ticket purchases. Hispanic Millennials are a positive force in their generation and help move it towards the attainment of these goals.
15

Optimism
Non Hispanic
s
Hispanics
16

Hispanic Millennials Most Optimistic
Extremely Optimistic/Optimistic about the Future0%
10%
20%
30%
40%
50%
60%
70%
80%70%
52%
Hispanic Millennial Non-Hispanic Millennial
Satisfaction with where they currently are in life is 61% for Hispanic Millennial
vs. 50% for Non-Hispanic Millennials
17 Indicates higher/lower at a 95% confidence levelSource: ThinkNow Research Hispanic Omnibus Study – April 2014

Optimism About Economy
41%
25%
18%
14%
2%
37%38%
14%
9%
1%
2012-13 2013-14
37%38%
14%
9%
1%
27%
34%
28%
12%
0%
Hispanics non-Hispanics
Hispanics express more optimism about the U.S. economy compared to Non-Hispanics
Hispanics
Source: ThinkNow Research Omnibus Study: February 2014 & February 2013
Greater optimism about the economy correlates with spending
18 Indicates higher/lower at a 95% confidence level

• Hispanic Millennials continue to believe & be driven by the American Dream
71% of Hispanic Millennials believe in
the America Dream vs. 55% of Non Hispanic
Millennials
Hispanic Millennials & The American Dream
19

Hispanics have bigger families & social networks. They enjoy spending time together. Shopping, dining, gaming, vacationing and TV viewing are all communal activities.
20

Hispanics and Community
Family Unity and being Surrounded
by Friends and Family are top
Hispanic Cultural Values
21

Leisure Time Spent with Friends & Family
Playing a Team Sport0%
5%
10%
15%
20%
25%
30%25%
14%
Hispanic Millennial Non-Hispanic Millennial
Hiking
14%
23%
Hispanic Millennial Non-Hispanic Millennial
Corroborates close knit social
ties
22 Indicates higher/lower at a 95% confidence levelSource: ThinkNow Research Hispanic Omnibus Study – April 2014

Entertainment Activities
50%
53%
46%
44%
32%
30%
16%
Hispanics Non-Hispanics
54%
52%
49%
46%
36%
31%
22%
Go to the movies
Have cable/satellite TV
Watch YouTube Videos
Play video games
Visit theme parks
Have streaming video subscription
Go to bars/night clubs
Hispanics are more likely that Non-Hispanics to go to the movies, visit theme parks, and go to bars and night clubs.
23 Indicates higher/lower at a 95% confidence levelSource: ThinkNow Research Hispanic Omnibus Study – May 2014

Hispanics Non-Hispanics
34%40%
29%
35%
20%
13%
17%12%
Offline with others
Online with others
Offline by myself
Online by myself
Hispanic Gamers more Social than Non-Hispanics
In general, gamers play more often by themselves, either online or offline. Hispanics are most likely to play with others compared to
Non-Hispanics.
63%75%
37%25%
24 Indicates higher/lower at a 95% confidence levelSource: ThinkNow Research Hispanic Omnibus Study – April 2014

Who Do Hispanics Play Video Games With?
33%
30%
26%
13%
3%
7%
16%
35%
Hispanics Non-Hispanics
50%
35%
31%
23%
6%
14%
30%
22%
Hispanics twice as likely to play
online with strangers
Friends
My children
Spouse/Significant Other
Siblings
Parent
Other relatives
Online with people you don’t know
No one - play by myself
Hispanics play with friends most often, followed by children and significant other.
25 Indicates higher/lower at a 95% confidence levelSource: ThinkNow Research Hispanic Omnibus Study – April 2014

Texting & Updating Status/Checking Social Media
On average, Hispanics exchange text messages with more people on a day-to-day basis compared to Non-Hispanics.
None 1-2 3-4 5-6 7+0%
10%
20%
30%
40%
50%
60%
70%
80%
8%
36%34%
12%10%
23%
36%
26%
6%9%
HispanicsNon-Hispanics
Number of People Text With Per Day
Hispanics Non-Hispanics
MEAN 3.3 2.6
None 1-2 3-4 5-6 7+0%
10%
20%
30%
40%
50%
60%
70%
80%
11%
33%
21%
10%
25%
10%
34%
25%
9%
23%
HispanicsNon-Hispanics
Number of Times Use Cell Phone to Up-date Status or Check Social Media Sites
Hispanics Non-Hispanics
MEAN 4.0 3.6
26 Indicates higher/lower at a 95% confidence levelSource: ThinkNow Research Hispanic Omnibus Study –February
2014

Hispanics Non-Hispanics
76% 79%
8% 10%
8% 6%
4% --
2% 4%
-- --
2% 1%
Social Media Apps
Google+
Snapchat
96%
45%
44%
42%
36%
18%
17%
99%
61%
29%
45%
32%
18%
16%
Non-HispanicsHispanics
27
Social Networking Apps Used in Past 7 Days
Favorite Social Networking App
Source: ThinkNow Research Hispanic Omnibus Study –February 2014
Indicates higher/lower at a 95% confidence level

Hispanics use Mobile to Stay Connected While Shopping
Yes60%
No40%
Have you used your mobile phone to help them make decisions or obtain a discount?
When shopping in stores with a friend or relative, 60% of Hispanic consumers report using their phone to help their friend or relative make decisions or obtain a
discount. Sixty percent also report that a friend or relative used their phone to help them.
Yes60%
No40%
Have they used their mobile phone to help you make decisions or obtain a discount?
28Source: ThinkNow Research Hispanic Omnibus Study – February 2014

Attitudes About Mobile Advertising
80%
57%
57%
51%
45%
44%
41%
81%
56%
52%
57%
42%
42%
38%
Non-HispanicsHispanics
29
Top 2 Box Agreement: Agree Completely/Somewhat
Advertisements on cell phones are annoying
I would be willing to receive advertisements on my cell phone in exchange for lower monthly costs
Mobile phones provides me with useful information about bargains
I just want to use my cell phone to make and receive calls and don’t care about any other features
I would be willing to receive advertisements on my cell phone in exchange for services, like live TV or Text Messages
Advertising on mobile phones provides me with useful information about new products and services
Advertising on mobile phones provides me with meaningful information about the product use of other consumers
Roughly 4-in-10 find mobile ads to be useful in
providing info about products/ services
Hispanics more likely to use mobile to look for
Bargains
Source: ThinkNow Research Hispanic Omnibus Study –February 2014
Indicates higher/lower at a 95% confidence level

All Hispanics Speak Spanish Bilingual Speak English0%
10%
20%
30%
40%
50%
60%
70%
80%
90%
100%
69% 75%60%
72%
31% 25%40%
28%
Binge Viewing Behavior
With someone else
By myself
Binge Viewing Alone vs. With Others
30
Bing Viewing of Television Shows is more Social among
Bilingual Hispanics
Indicates higher/lower at a 95% confidence levelSource: ThinkNow Research Hispanic Omnibus Study –February
2014

Live/when shows air
Netflix
Youtube
Recorded via a DVR
Hulu
Amazon Prime
DVD (Rented or Purchased)
Apple TV
Google TV
Other
32%
27%
13%
13%
5%
2%
2%
1%
1%
3%
46%
16%
4%
21%
3%
1%
5%
1%
1%
4%
Non-HispanicsHispanics
Ways of Watching Television
31
Methods Used Most Often to Watch TV
Watching television shows when they are broadcast is the most common method
reported for both Hispanics and non-Hispanics.
However, Hispanics are more
likely to watch via Netflix, YouTube or Amazon Prime
than Non-Hispanics.
Indicates higher/lower at a 95% confidence levelSource: ThinkNow Research Hispanic Omnibus Study –February
2014

Channels Watched in Past Week
32 Indicates higher/lower at a 95% confidence levelSource: ThinkNow Research Hispanic Omnibus Study – May 2014
ABC CBS FOX NBC Univision Telemundo The CW0%
20%
40%
60%
80%
100%
45%
37% 37%31%
26% 26%
16%
55%50%
40%45%
2% 2%
15%
Hispanics Non - Hispanics
Hispanics
<$50k $50k-$99k $100k>
ABC 40% 53% 56%
CBS 33% 42% 45%
FOX 34% 41% 43%
Univision 28% 23% 22%
Telemundo 28% 22% 23%
Hispanics under-index in all English language Broadcast
Television viewing except for the CW.
ABC
Fam
ily
Anim
al P
lane
t
Cartoo
n Net
...
Disney
Cha
... E!
ESPN
ESPN
Dep
o...
HBO MTV
Nicke
lode
on
Show
time
0%
10%
20%
30%
40%
50%
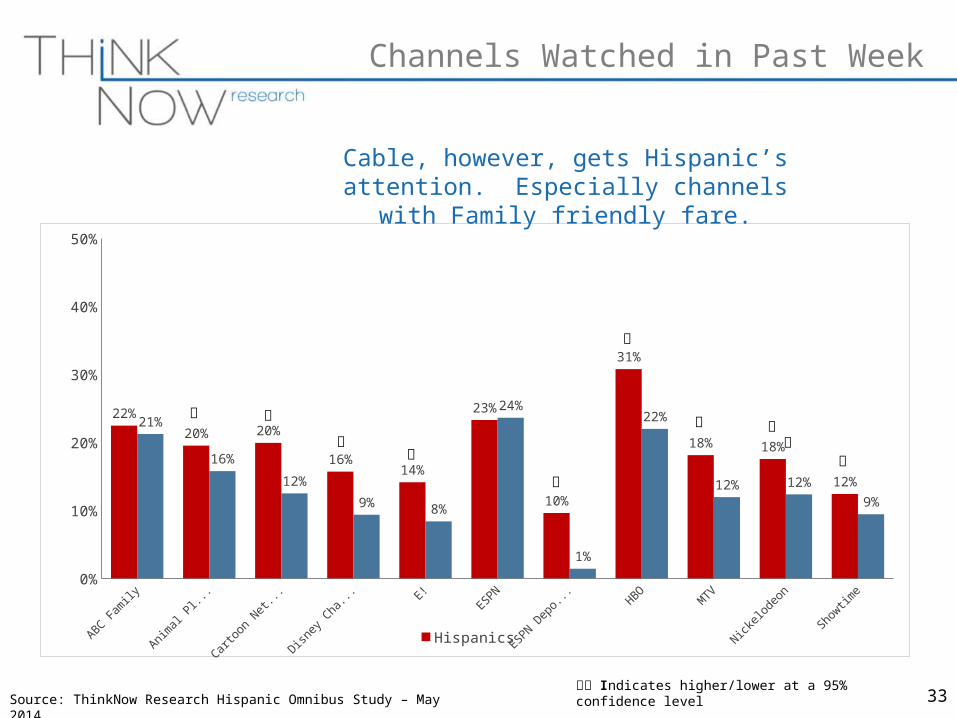
22%
20% 20%
16%14%
23%
10%
31%
18% 18%
12%
21%
16%
12%
9% 8%
24%
1%
22%
12% 12%
9%
Hispanics Non - Hispanics
Channels Watched in Past Week
Cable, however, gets Hispanic’s attention. Especially channels with
Family friendly fare.
33 Indicates higher/lower at a 95% confidence levelSource: ThinkNow Research Hispanic Omnibus Study – May 2014
NFL (National Football League)
NBA (National Basketball Association)
MLB (Major League Baseball)
FIFA (Soccer)
NCAA Football
NCAA Basketball
MLS (Major League Soccer)
NASCAR
NHL (National Hockey League)
Tennis
Golf
43%
33%
31%
28%
27%
24%
23%
19%
18%
18%
13%
48%
29%
33%
14%
32%
29%
13%
23%
22%
14%
17%
Non - Hispanics Hispanics
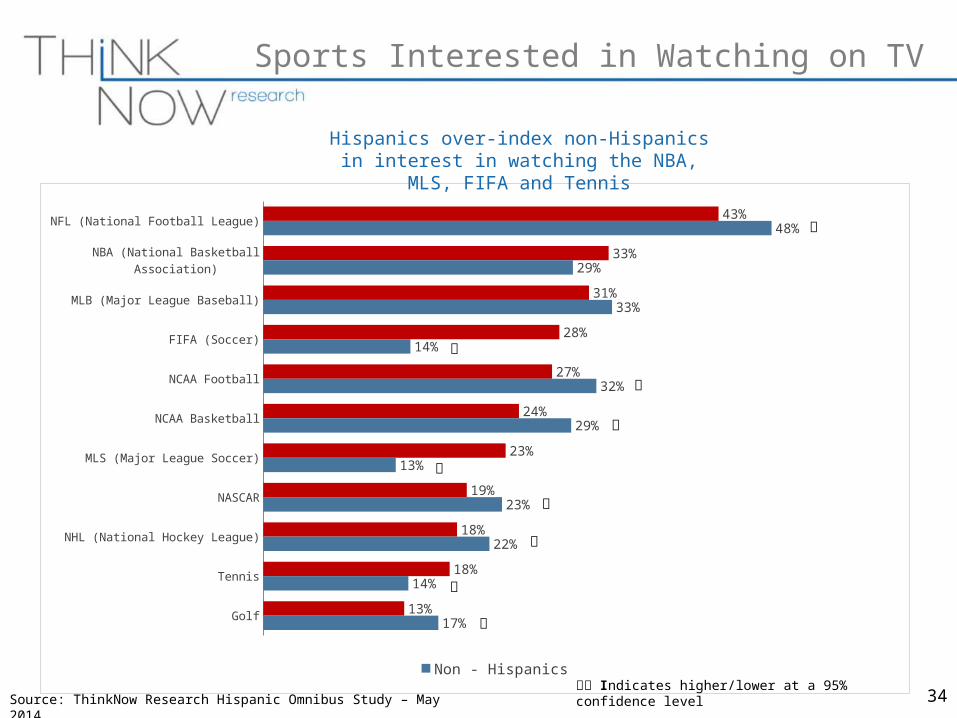
Sports Interested in Watching on TV
Hispanics over-index non-Hispanics in interest in watching the NBA, MLS, FIFA and
Tennis
34 Indicates higher/lower at a 95% confidence levelSource: ThinkNow Research Hispanic Omnibus Study – May 2014

English only
English mostly
Spanish and English equally
Spanish mostly
Spanish only
35%
25%
29%
8%
3%
27%
23%
36%
12%
3%
29%
17%
33%
15%
6%
33%
22%
27%
13%
6%
Language Preference by Media
35
Language usage varies by type of content on media. Many Hispanics read online content in English but view Spanish language YouTube videos and stream Spanish
language music.
Source: ThinkNow Research Hispanic Omnibus Study.

Larger Party Sizes equals Greater Vacation Spending
Hispanics spend more than non-Hispanics across all income brackets, in part because they are more likely to fly and have larger families on
average.
All Hispanics <$50k Upscale ($50k-$99k)
Affluent ($100k+)
$2,359
$1,819
$2,623
$3,643
Average Spending on a Vacation within the U.S.
Total <$50k Upscale ($50K-$99K)
Affluent (100K+)
$2,359
$1,819
$2,623
$3,643
$2,006
$1,517
$1,981
$2,798
Average Spending per Vacation
Hispanics (D) Non-Hispanics (E)
36 Indicates higher/lower at a 95% confidence levelSource: ThinkNow Research Hispanic Omnibus Study – May 2014

Conclusions
SOCIAL
YOUNGER
o Hispanics are more socially connected
o Hispanics over-index on entertainment
spending
o Each Hispanic consumer that has a positive
experience with your brand has the potential
to introduce it to their social network
o Family friendly entertainment does best with
this group
o Media often consumed bilingually
o Size of the U.S. Hispanic market will continue
to grow
OPTIMISTIC

Quantitative ResearchCarlos Yanez 818-843-0220 [email protected]
Qualitative ResearchJairo Moncada818-843-0220 [email protected]
PanelGus Peña818-843-0220 [email protected]
Contact Info:
CorporateMario X. CarrascoPartner 818-843-0220 [email protected]
Roy Eduardo KokoyachukPartner818-843-0220 [email protected]
38