Thinknow research-hispanic-binge-tv-viewing-2015
26
Hispanic Binge TV Viewing February 2015
-
Upload
daniel-almada -
Category
Marketing
-
view
54 -
download
0
Transcript of Thinknow research-hispanic-binge-tv-viewing-2015
Hispanic Binge TV Viewing
February 2015
Outline
Methodology
Detailed Findings
Appendix
Methodology
Methodology
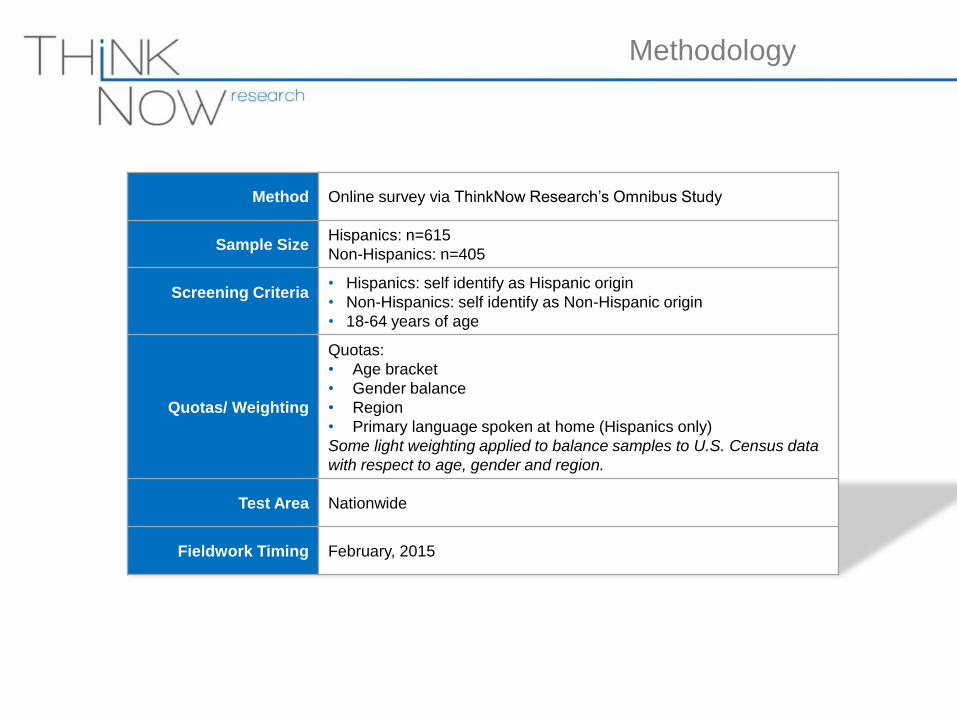
Method Online survey via ThinkNow Research’s Omnibus Study
Sample SizeHispanics: n=615
Non-Hispanics: n=405
Screening Criteria• Hispanics: self identify as Hispanic origin
• Non-Hispanics: self identify as Non-Hispanic origin
• 18-64 years of age
Quotas/ Weighting
Quotas:
• Age bracket
• Gender balance
• Region
• Primary language spoken at home (Hispanics only)
Some light weighting applied to balance samples to U.S. Census data
with respect to age, gender and region.
Test Area Nationwide
Fieldwork Timing February, 2015
Detailed Findings
Hispanics are significantly more likely than
Non-Hispanics to prefer watching multiple
episodes of their favorite television series
back-to-back.
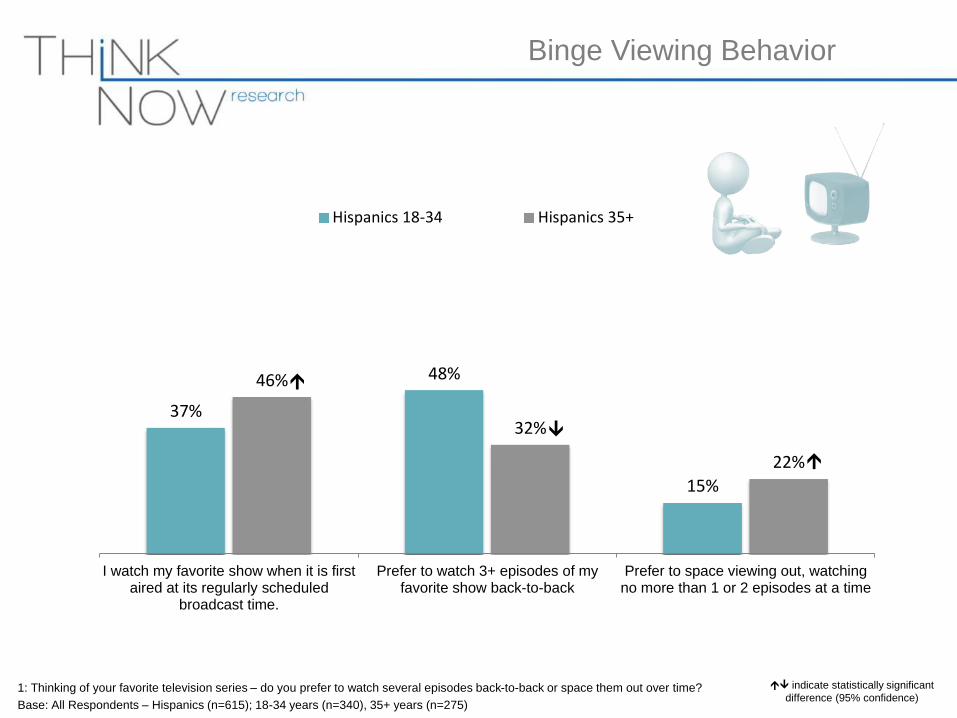
Among Hispanics, television binge viewing
behavior is more common among those under
35 years old.
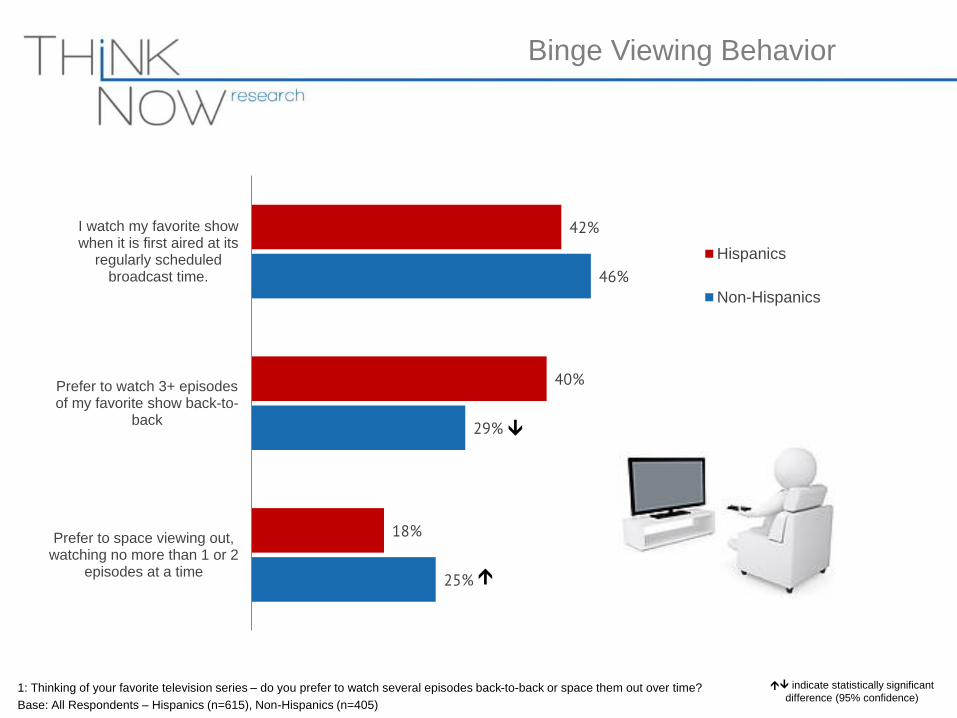
1: Thinking of your favorite television series – do you prefer to watch several episodes back-to-back or space them out over time?
Base: All Respondents – Hispanics (n=615), Non-Hispanics (n=405)
indicate statistically significant
difference (95% confidence)
Binge Viewing Behavior
42%
40%
18%
46%
29%
25%
I watch my favorite showwhen it is first aired at its
regularly scheduledbroadcast time.
Prefer to watch 3+ episodesof my favorite show back-to-
back
Prefer to space viewing out,watching no more than 1 or 2
episodes at a time
Hispanics
Non-Hispanics
1: Thinking of your favorite television series – do you prefer to watch several episodes back-to-back or space them out over time?
Base: All Respondents – Hispanics (n=615); 18-34 years (n=340), 35+ years (n=275)
Binge Viewing Behavior
37%
48%
15%
46%
32%
22%
I watch my favorite show when it is firstaired at its regularly scheduled
broadcast time.
Prefer to watch 3+ episodes of myfavorite show back-to-back
Prefer to space viewing out, watchingno more than 1 or 2 episodes at a time
Hispanics 18-34 Hispanics 35+
indicate statistically significant
difference (95% confidence)
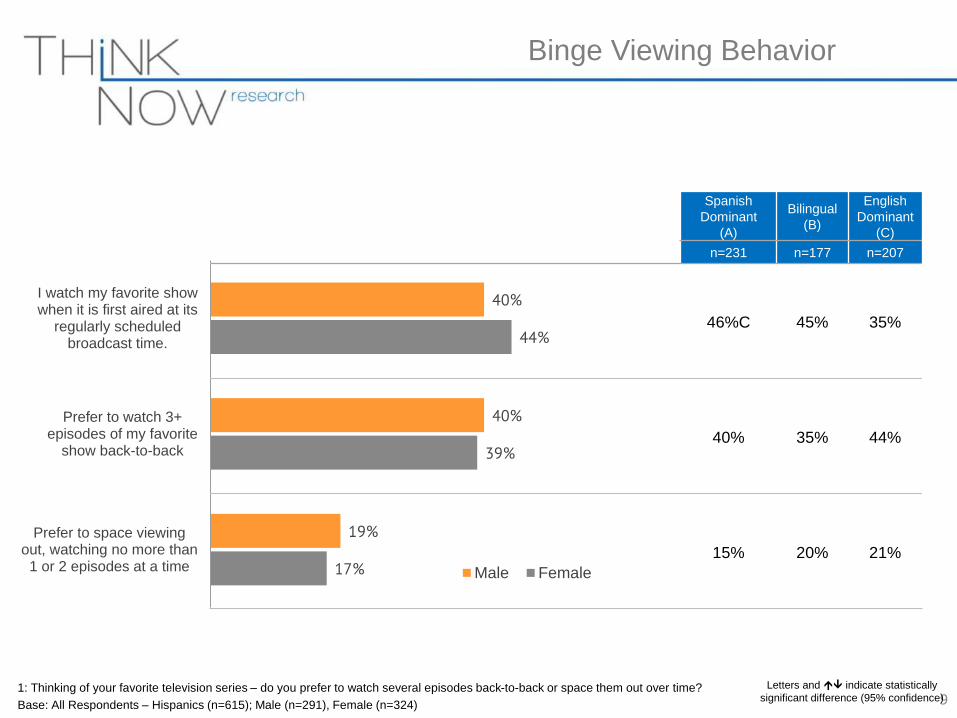
40%
40%
19%
44%
39%
17%
I watch my favorite showwhen it is first aired at its
regularly scheduledbroadcast time.
Prefer to watch 3+episodes of my favorite
show back-to-back
Prefer to space viewingout, watching no more than1 or 2 episodes at a time Male Female
Spanish
Dominant
(A)
Bilingual
(B)
English
Dominant
(C)
n=231 n=177 n=207
46%C 45% 35%
40% 35% 44%
15% 20% 21%
9
Binge Viewing Behavior
1: Thinking of your favorite television series – do you prefer to watch several episodes back-to-back or space them out over time?
Base: All Respondents – Hispanics (n=615); Male (n=291), Female (n=324)
Letters and indicate statistically
significant difference (95% confidence)
Hispanics consistently show higher binge
viewing behavior than Non-Hispanics. On
average, Hispanics watch 3.43 episodes in a
single viewing while Non-Hispanics watch an
average of 3.02.
When looking at age comparisons among
Hispanics, we found that 18-34 year olds are
more likely to watch a greater number of
episodes compared to those 35+ years of age.
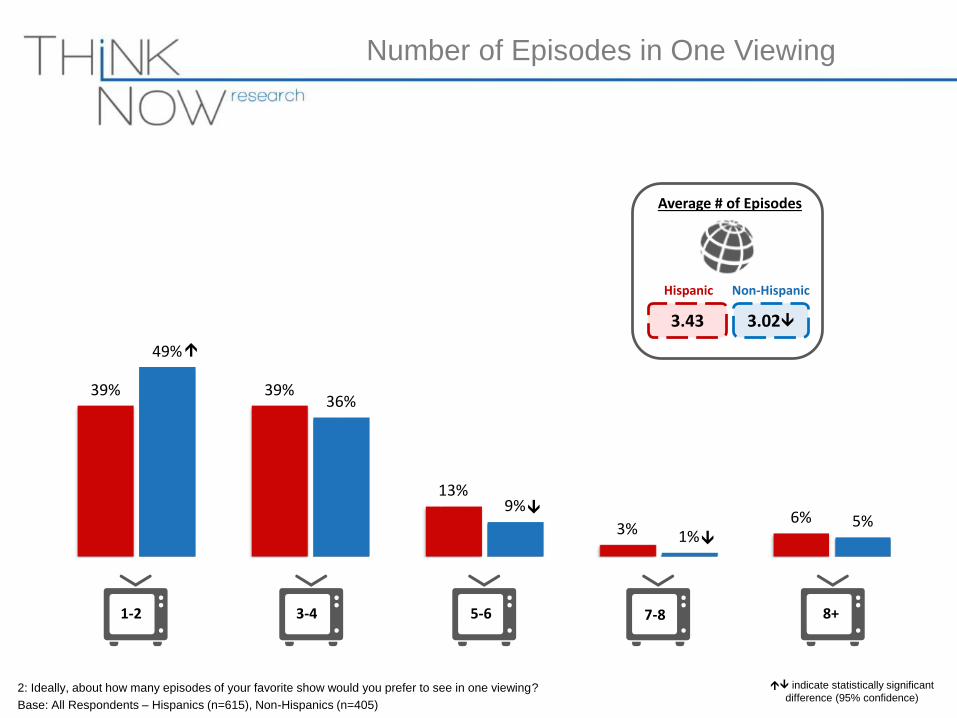
2: Ideally, about how many episodes of your favorite show would you prefer to see in one viewing?
Base: All Respondents – Hispanics (n=615), Non-Hispanics (n=405)
Number of Episodes in One Viewing
1-2 3-4 5-6 7-8 8+
5%1%
9%
36%
49%
6%3%
13%
39%39%
3.43 3.02
Hispanic Non-Hispanic
Average # of Episodes
indicate statistically significant
difference (95% confidence)
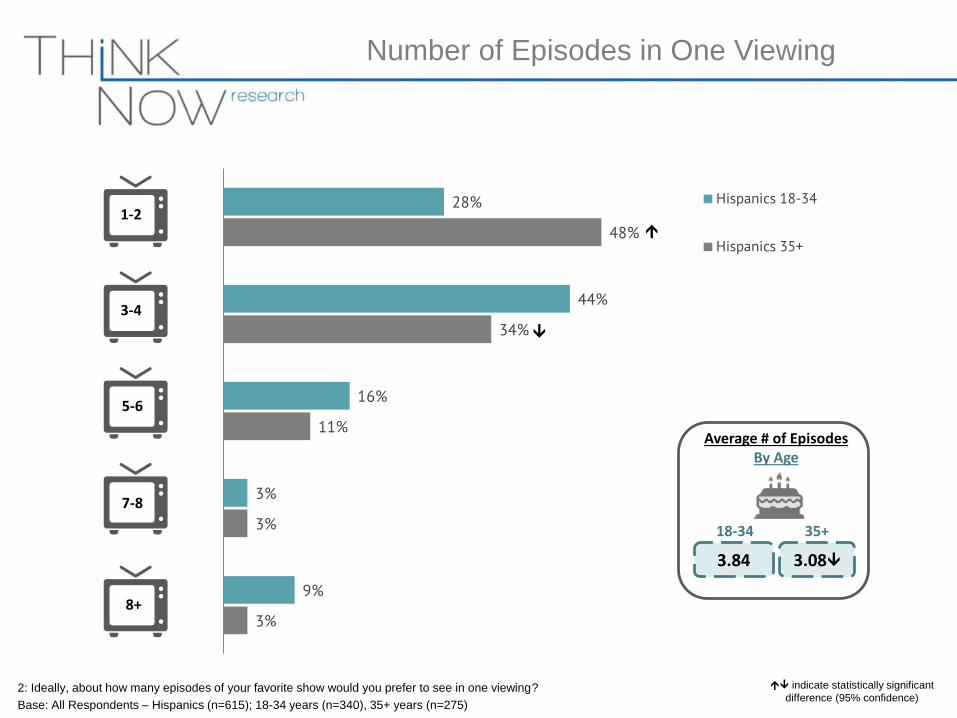
28%
44%
16%
3%
9%
48%
34%
11%
3%
3%
Hispanics 18-34
Hispanics 35+
2: Ideally, about how many episodes of your favorite show would you prefer to see in one viewing?
Base: All Respondents – Hispanics (n=615); 18-34 years (n=340), 35+ years (n=275)
1-2
3-4
5-6
7-8
8+
3.84 3.08
18-34 35+
Average # of EpisodesBy Age
indicate statistically significant
difference (95% confidence)
Number of Episodes in One Viewing
Hispanics, especially those under 35 years of
age, are more likely than Non-Hispanics to
watch an entire season of a favorite show in
one weekend or in one week.
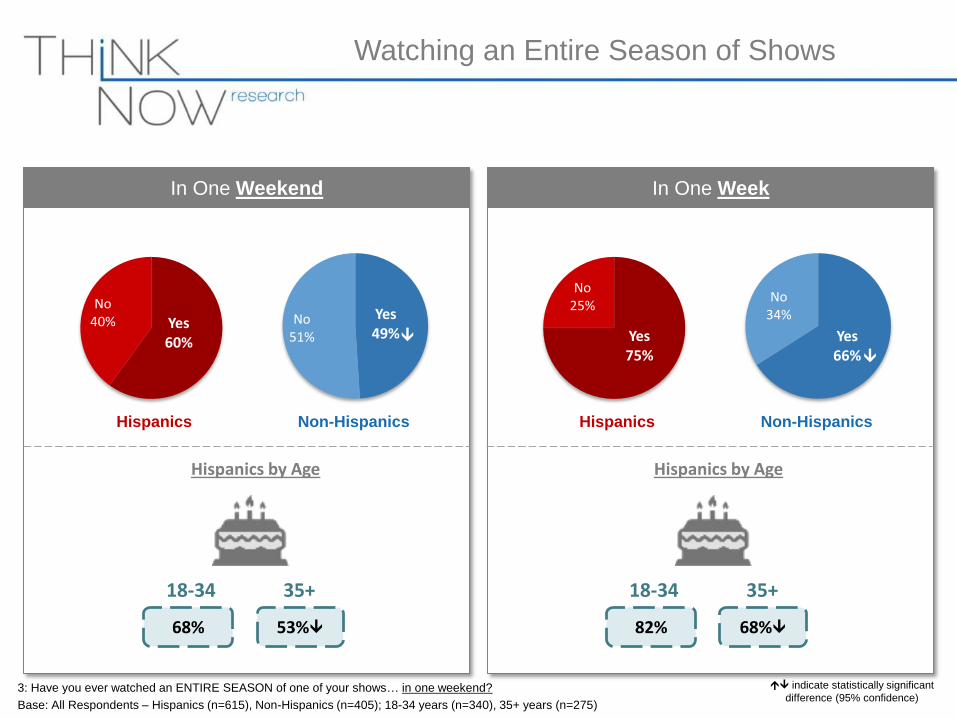
In One Weekend In One Week
3: Have you ever watched an ENTIRE SEASON of one of your shows… in one weekend?
Base: All Respondents – Hispanics (n=615), Non-Hispanics (n=405); 18-34 years (n=340), 35+ years (n=275)
Watching an Entire Season of Shows
Yes60%
No40% Yes
49%No
51%
Hispanics Non-Hispanics
68% 53%
18-34 35+
Hispanics by Age
Yes75%
No25%
Yes66%
No34%
Hispanics Non-Hispanics
82% 68%
18-34 35+
Hispanics by Age
indicate statistically significant
difference (95% confidence)
Among binge viewers, both Hispanics and
Non-Hispanics are more likely to watch their
favorite shows by themselves.
Hispanic binge viewers under the age of 35
are particularly likely to watch their favorite TV
series alone.
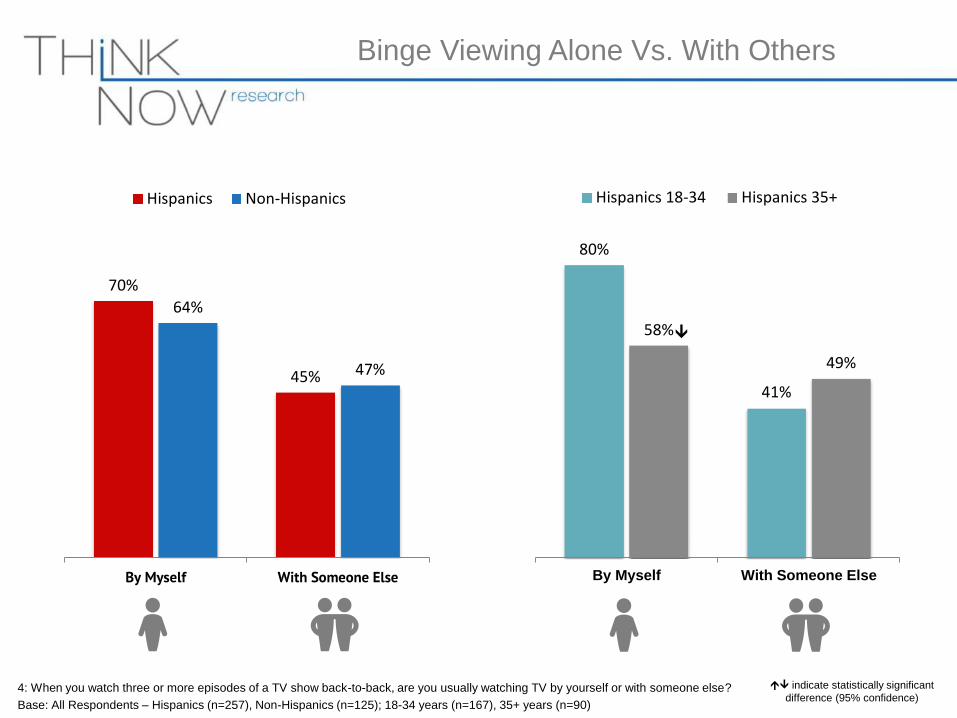
4: When you watch three or more episodes of a TV show back-to-back, are you usually watching TV by yourself or with someone else?
Base: All Respondents – Hispanics (n=257), Non-Hispanics (n=125); 18-34 years (n=167), 35+ years (n=90)
Binge Viewing Alone Vs. With Others
70%
45%
64%
47%
By Myself With Someone Else
Hispanics Non-Hispanics
80%
41%
58%
49%
By Myself With Someone Else
Hispanics 18-34 Hispanics 35+
indicate statistically significant
difference (95% confidence)
66%
50%
75%
39%
By Myself
With Someone Else
Male Female
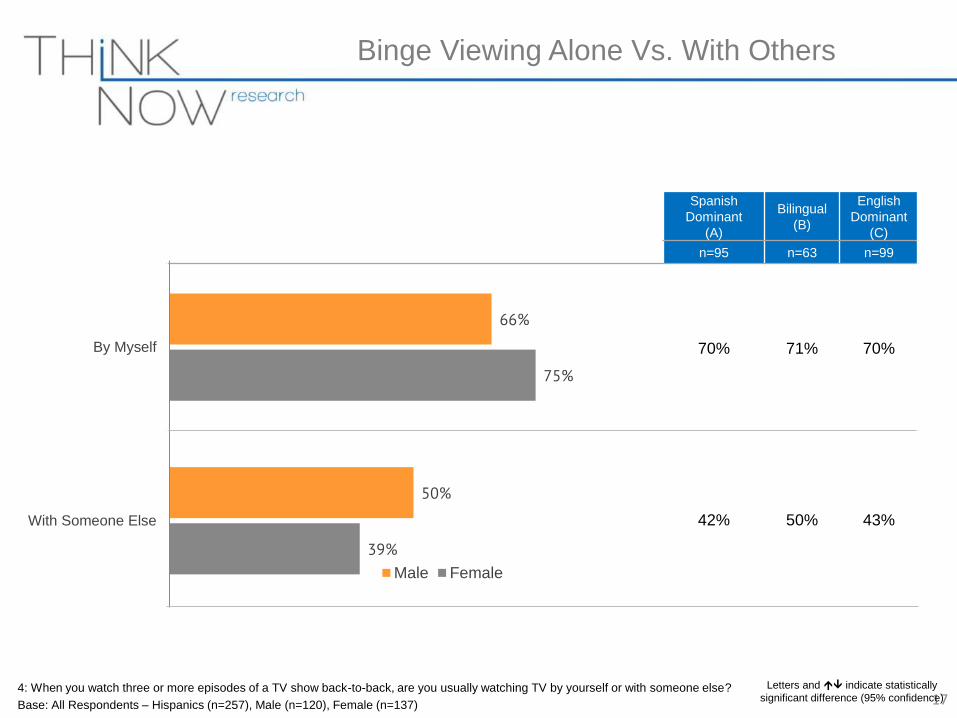
174: When you watch three or more episodes of a TV show back-to-back, are you usually watching TV by yourself or with someone else?
Base: All Respondents – Hispanics (n=257), Male (n=120), Female (n=137)
Binge Viewing Alone Vs. With Others
Spanish
Dominant
(A)
Bilingual
(B)
English
Dominant
(C)
n=95 n=63 n=99
70% 71% 70%
42% 50% 43%
Letters and indicate statistically
significant difference (95% confidence)
Live broadcasted television is still the most
common way that both Hispanics and Non-
Hispanics watch TV. This is especially true
among the 35+ Hispanics.
Among binge viewers, Netflix is the most
frequently used method of watching 3 or more
episodes of a television show. This trend is
true for both Hispanics and Non-Hispanics,
and notably among Hispanics 18-34 years old.
Hispanics
18-34
Hispanics
35+
36% 54%
31% 17%
11% 18%
7% 4%
9% 1%
2% 2%
2% 1%
- 1%
0% -
2% 2%
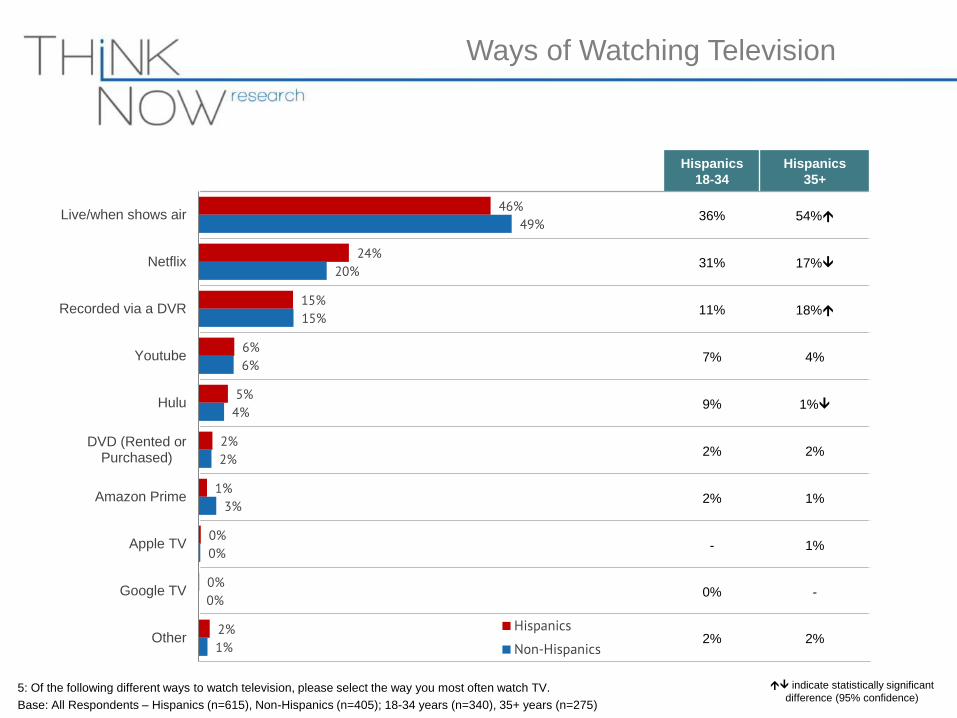
5: Of the following different ways to watch television, please select the way you most often watch TV.
Base: All Respondents – Hispanics (n=615), Non-Hispanics (n=405); 18-34 years (n=340), 35+ years (n=275)
Ways of Watching Television
46%
24%
15%
6%
5%
2%
1%
0%
0%
2%
49%
20%
15%
6%
4%
2%
3%
0%
0%
1%
Live/when shows air
Netflix
Recorded via a DVR
Youtube
Hulu
DVD (Rented orPurchased)
Amazon Prime
Apple TV
Google TV
OtherHispanics
Non-Hispanics
indicate statistically significant
difference (95% confidence)
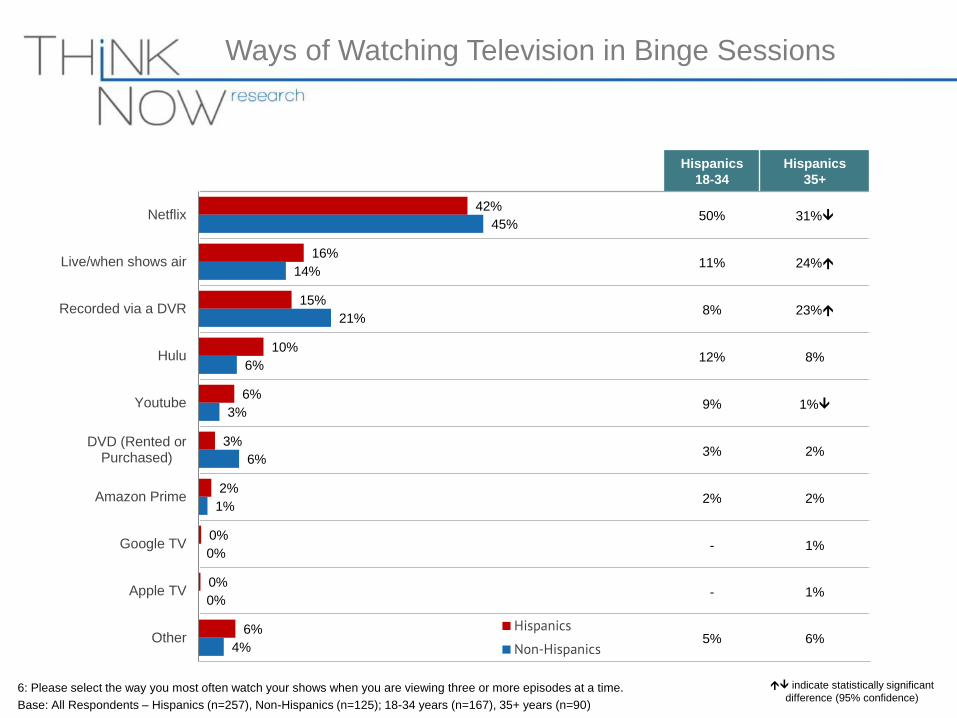
6: Please select the way you most often watch your shows when you are viewing three or more episodes at a time.
Base: All Respondents – Hispanics (n=257), Non-Hispanics (n=125); 18-34 years (n=167), 35+ years (n=90)
Ways of Watching Television in Binge Sessions
Hispanics
18-34
Hispanics
35+
50% 31%
11% 24%
8% 23%
12% 8%
9% 1%
3% 2%
2% 2%
- 1%
- 1%
5% 6%
42%
16%
15%
10%
6%
3%
2%
0%
0%
6%
45%
14%
21%
6%
3%
6%
1%
0%
0%
4%
Netflix
Live/when shows air
Recorded via a DVR
Hulu
Youtube
DVD (Rented orPurchased)
Amazon Prime
Google TV
Apple TV
OtherHispanics
Non-Hispanics
indicate statistically significant
difference (95% confidence)
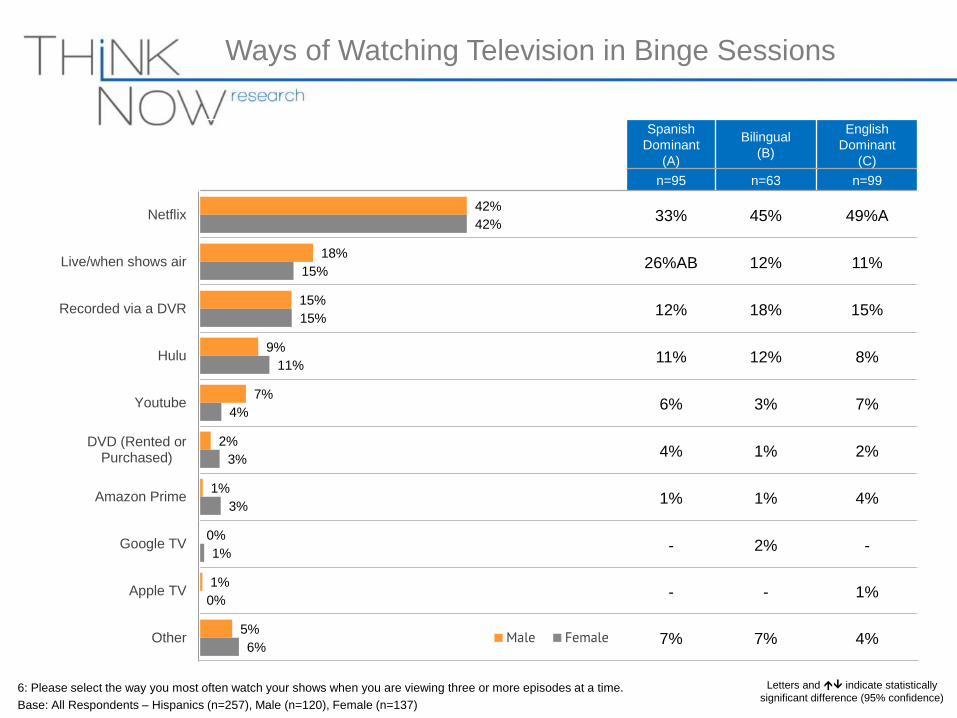
6: Please select the way you most often watch your shows when you are viewing three or more episodes at a time.
Base: All Respondents – Hispanics (n=257), Male (n=120), Female (n=137)
Ways of Watching Television in Binge Sessions
42%
18%
15%
9%
7%
2%
1%
0%
1%
5%
42%
15%
15%
11%
4%
3%
3%
1%
0%
6%
Netflix
Live/when shows air
Recorded via a DVR
Hulu
Youtube
DVD (Rented orPurchased)
Amazon Prime
Google TV
Apple TV
Other Male Female
Spanish
Dominant
(A)
Bilingual
(B)
English
Dominant
(C)
n=95 n=63 n=99
33% 45% 49%A
26%AB 12% 11%
12% 18% 15%
11% 12% 8%
6% 3% 7%
4% 1% 2%
1% 1% 4%
- 2% -
- - 1%
7% 7% 4%
Letters and indicate statistically
significant difference (95% confidence)
Appendix
MetricHispanics
n=615
Non-
Hispanics
n=405
MetricHispanics
n=615
Non-
Hispanics
n=405
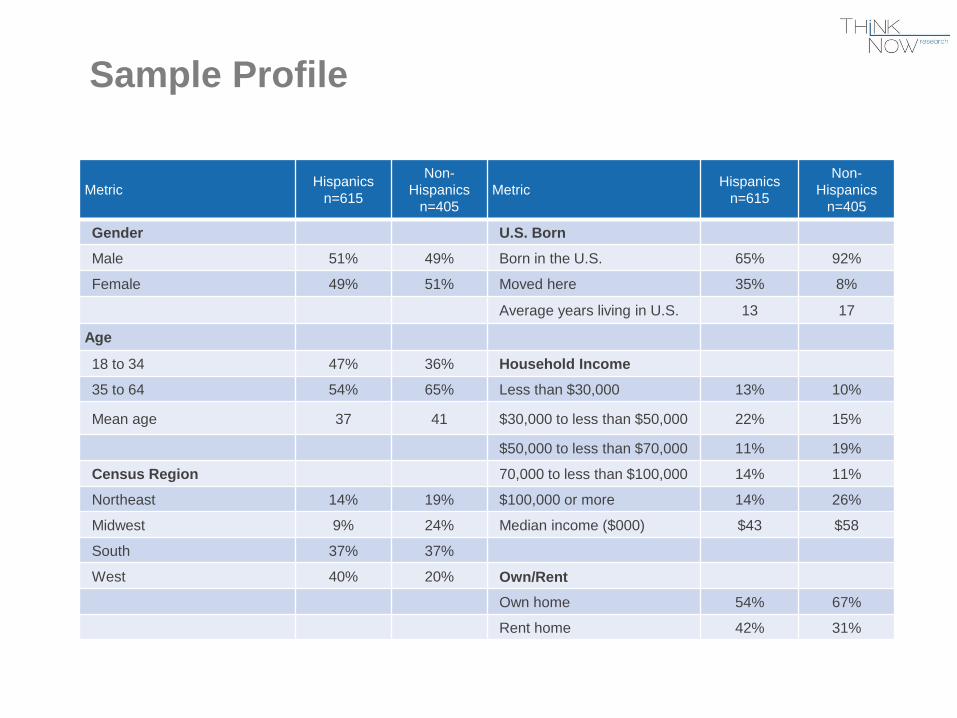
Gender U.S. Born
Male 51% 49% Born in the U.S. 65% 92%
Female 49% 51% Moved here 35% 8%
Average years living in U.S. 13 17
Age
18 to 34 47% 36% Household Income
35 to 64 54% 65% Less than $30,000 13% 10%
Mean age 37 41 $30,000 to less than $50,000 22% 15%
$50,000 to less than $70,000 11% 19%
Census Region 70,000 to less than $100,000 14% 11%
Northeast 14% 19% $100,000 or more 14% 26%
Midwest 9% 24% Median income ($000) $43 $58
South 37% 37%
West 40% 20% Own/Rent
Own home 54% 67%
Rent home 42% 31%
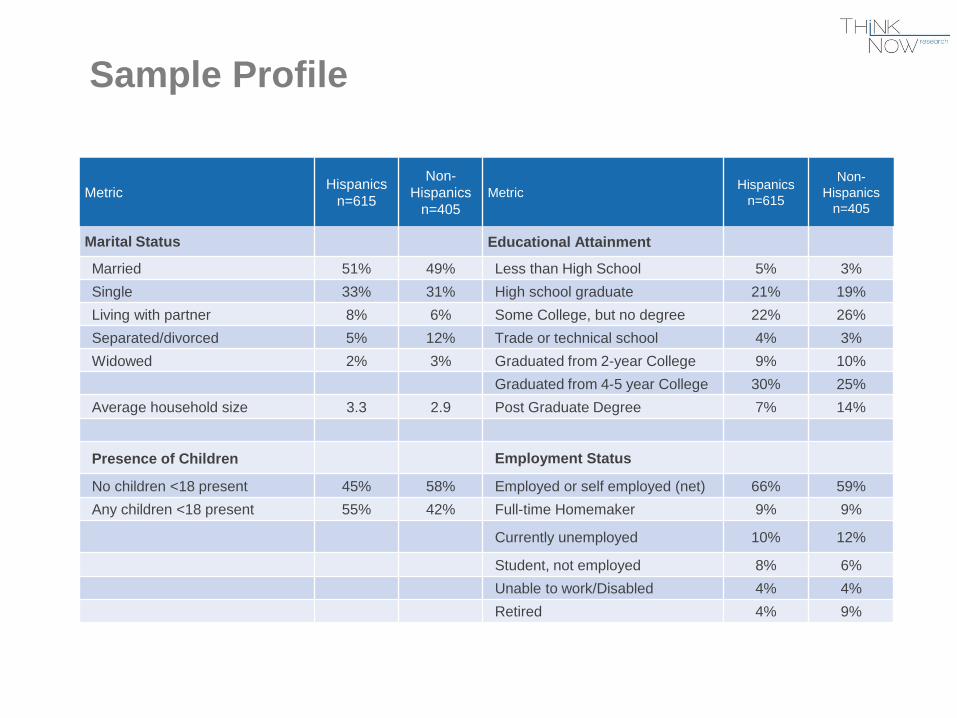
Sample Profile
Sample Profile
MetricHispanics
n=615
Non-
Hispanics
n=405
MetricHispanics
n=615
Non-
Hispanics
n=405
Marital Status Educational Attainment
Married 51% 49% Less than High School 5% 3%
Single 33% 31% High school graduate 21% 19%
Living with partner 8% 6% Some College, but no degree 22% 26%
Separated/divorced 5% 12% Trade or technical school 4% 3%
Widowed 2% 3% Graduated from 2-year College 9% 10%
Graduated from 4-5 year College 30% 25%
Average household size 3.3 2.9 Post Graduate Degree 7% 14%
Presence of Children Employment Status
No children <18 present 45% 58% Employed or self employed (net) 66% 59%
Any children <18 present 55% 42% Full-time Homemaker 9% 9%
Currently unemployed 10% 12%
Student, not employed 8% 6%
Unable to work/Disabled 4% 4%
Retired 4% 9%
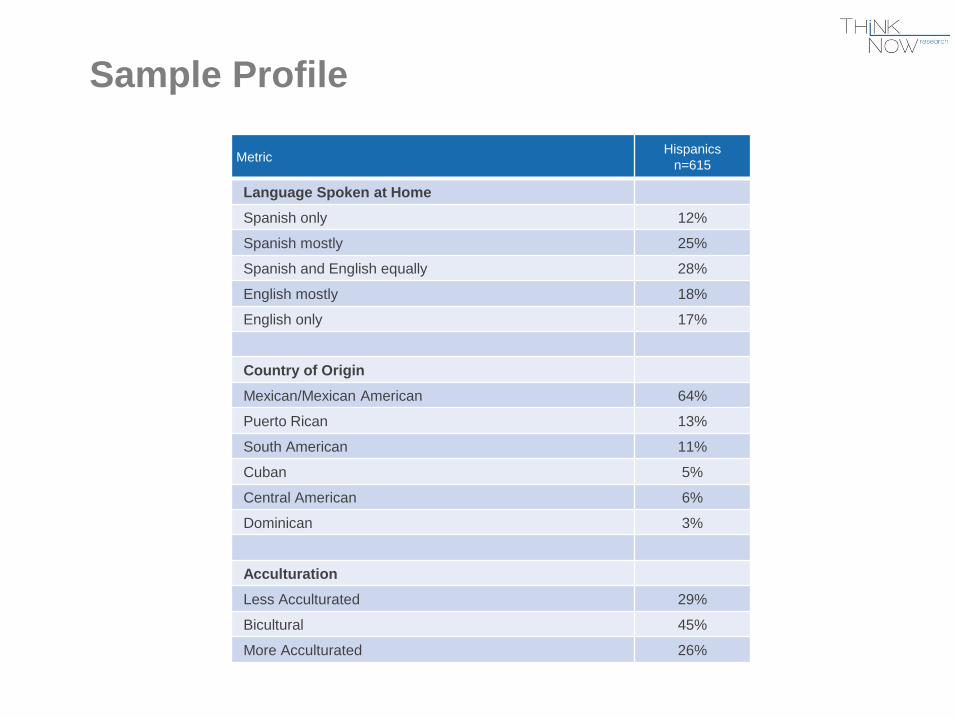
Sample Profile
MetricHispanics
n=615
Language Spoken at Home
Spanish only 12%
Spanish mostly 25%
Spanish and English equally 28%
English mostly 18%
English only 17%
Country of Origin
Mexican/Mexican American 64%
Puerto Rican 13%
South American 11%
Cuban 5%
Central American 6%
Dominican 3%
Acculturation
Less Acculturated 29%
Bicultural 45%
More Acculturated 26%
Quantitative Research
Carlos Yanez
818-843-0220 x110
Qualitative Research
Jairo Moncada
818-843-0220 x111
Panel
Gus Peña
818-843-0220 x107
Contact Info
Corporate
Mario X. Carrasco
Partner
818-843-0220 x101
Roy Eduardo Kokoyachuk
Partner
818-843-0220 x102