Thinking Geographically
78
Chapter One Thinking Geographically
Transcript of Thinking Geographically

Chapter One
Thinking
Geographically

Where are you?
Tell me where you are.
How do you know?

Important Terms
Map – two dimensional or flat scale model of the Earth.
Place – A specific Point on the Earth’s surface.
Region – an area of the Earth described by a distinctive
combination of cultural and physical features.
Scale – Relationship between a portion of the Earth and the
whole.
Space – physical gap between two objects.
Connections – relationships between people and objects
across space.

Key Issue # 1
How Do Geographers Address Where Things Are?

How Geographers Address Location
Maps
Early mapmaking
Map scale
Projection
U.S. Land Ordinance of 1785
Contemporary Tools
GIS
Remote sensing
GPS

Cartography
The science of mapmaking,

Early Mapmaking
Maps surfaced in 2300 BC.
Aristotle was the first to see the describe the earth was
spherical.
Map making and exploration were revived during the Age of
Exploration.

Maps of the Marshall Islands
A Polynesian “stick chart” depicts patterns of waves on the sea route between two South Pacific
islands. Modern maps show the locations of these Marshall Islands.

Polynesian
Stick Chart

Marshall Islands
depicted in stick chart

Marshall Islands in the South Pacific

World Political Boundaries (2007)
Fig. 1-2: National political boundaries are among the most significant elements of the
cultural landscape
Map Scale
How much of the map do you draw?
Once that question is answered we look for map scale.

Scale
Differences Maps of
Washington
State
Fig. 1-3: The effects of scale in maps of Washington State. (Scales from 1:10 million to 1:10,000)

Washington State (1:10 million scale)

Western Washington (1:1 million scale)

Seattle Region (1:100,000 scale)

Downtown Seattle, Washington (1:10,000 scale)

Projection
The problem with a map is that the Earth is round and maps
are flat.
The projection of maps to a flat surface gives us distortion.
Shape can be distorted.
Distance can be distorted.
Size can be distorted.
Direction can be distorted.

US Land Ordinance of 1785
Commissioned to Thomas Hutchins to map the US and
divide into sections to sell.
Surveyor General is in charge of any land mapping for the
US.

Township &
Range
System in the
US
Fig. 1-4: Principal meridians & east-west baselines of the township system. Townships in northwest
Mississippi & topographic map of the area.

Townships
A square 6 miles on each side (36 square miles)
The square has 36 sections.
Each section has 4 parts (NE, NW, SE, SW) of 160 acres, this
is how land was developed and sold.
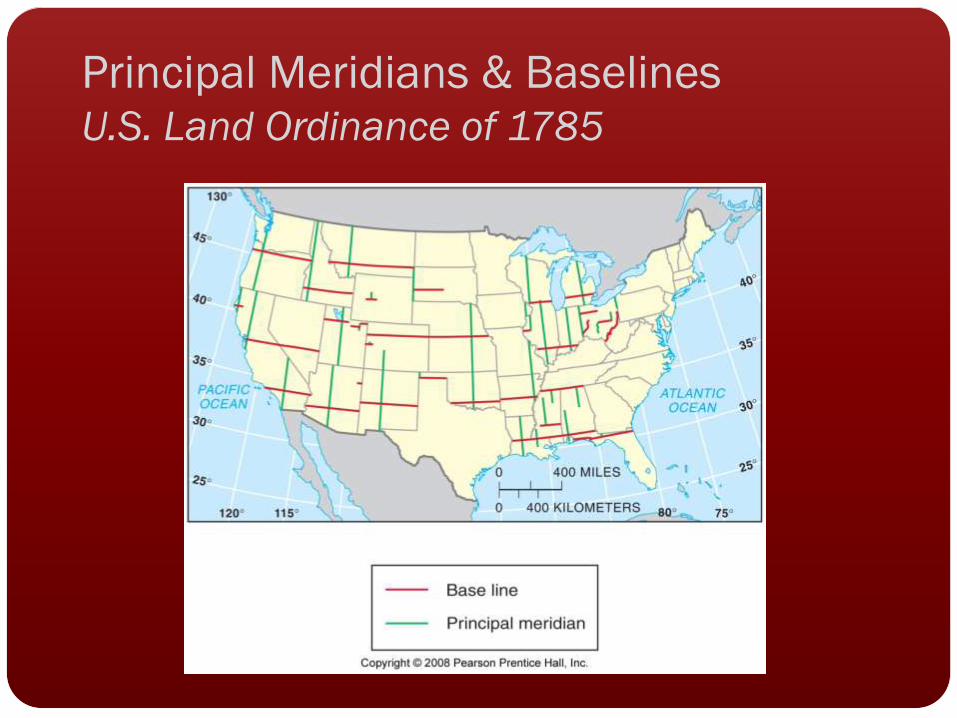
Principal Meridians & Baselines U.S. Land Ordinance of 1785

Tallahatchie
River,
Mississippi
in Township
Sections
The Tallahatchie River is located in the southeast and southwest quarter-sections of Section
32, T23N R1E.

Tallahatchie River,
Mississippi
The topographic map of the U.S. Geological Survey
has a scale of 1:24,000

Contemporary Tools
GIS
Remote sensing
GPS

GIS – geographic information system
Computerized system that can store, query, analyze and
display geographic data.

Layers of
a GIS
Fig. 1-5: A geographic information system (GIS) stores information about a location in several
layers. Each layer represents a different category of information.

Remote Sensing
Satellites scan the Earth for a variety of applications.
Vegetation, temperature, population, pollution are possible
uses.

GPS – global positioning system.
Tells the exact location of something on Earth.

Google Map
Chicago pizza restaurants

Key Issue # 2
Why is Each Point on Earth Unique?

Uniqueness of Places & Regions
Place: Unique location of a feature Place names
Site
Situation
Mathematical location
Regions: Areas of unique characteristics Cultural landscape
Types of regions
Spatial association
Regional integration of culture
Cultural ecology

Place: A Unique Location of a Feature
Location is the position that something occupies on Earth’s surface.
A toponym is the name given to the location of the Earth.
Page 15 in your book.
Some name are more descriptive.
El Paso
Las Cruces
San Antonio
Baton Rouge
Boca Raton
Grand Teton National Park

Longest Town name in the World
Llanfairpwllgwyngyllgogerychwyrndrobewllllantysiliogogog
och.
The Church of St. Mary’s in the grove of the white hazelnut
tree near the rapid whirlpool and the Church of St. Tisilio
near the red cave.

Vocabulary
Site – the physical character of a place.
Situation – location relative to other places.

Site: Lower
Manhattan
Island
Fig. 1-6: Site of lower Manhattan Island,
New York City. There have been
many changes to the area over the
last 200 years.

Situation: Singapore
Fig. 1-7: Singapore is situated at a key location for international trade.

Downtown Singapore

Mathematical Location
Meridian – arch drawn between North and South poles.
Parallel – circle drawn around the globe parallel to the
equator.
Longitude
Prime Meridian
Latitude

World Geographic Grid
Fig. 1-8: The world geographic grid consists of meridians of longitude and parallels of latitude.
The prime meridian ( 0º) passes through Greenwich, England.

World Time Zones
Fig. 1-9: The world’s 24 standard time zones each represent about 15° of longitude. They are often
depicted using the Mercator projection.

New Orleans after Hurricane Katrina
Fig. 1.1: Most of the area of New Orleans flooded after Hurricane Katrina was majority
African American. Physical and political geography intersect in analyzing the
impacts of the natural disaster

New Orleans

New Orleans after Katrina

Regions
Formal Region – uniform region or a homogeneous region
States
Agricultural regions
Voting patterns

Presidential Election 2004 Regional Differences
Fig. 1-10: Presidential election results by county & state illustrate differences in regional voting
patterns.

Presidential Election, 2004
Results by County

Presidential Election, 2004
Results by State

Functional Regions
Areas that are around a node or focal point.

Formal and Functional Regions
Fig. 1-11: The state of Iowa is an example of a formal region; the areas of influence of various
television stations are examples of functional regions.

Vernacular Regions
A place that exist as part of the cultural identity

Vernacular Regions
Fig. 1-12: A number of features are often used to define the South as a vernacular region, each of
which identifies somewhat different boundaries.

Spatial Association at Various Scales
Fig. 1-13: Death rates from cancer in the US, Maryland, and Baltimore show different
patterns that can identify associations with different factors.

Cancer Death Rates in the U.S.

Cancer Death Rates in Maryland

Cancer
Death
Rates in
Baltimore

Culture – to care for
Body of customary beliefs, material traits and social forms
that together constitute the distinct tradition of a group of
people.
Language
Religion
Ethnicity
Wealth
Political Institutions

Cultural Ecology
Environmental determinism – how the physical environment
caused social development.

World Climate Regions
Fig. 1-14: The modified Köppen system divides the world into five main climate regions.

Environmental
Modification in
the
Netherlands
Fig. 1-15: Polders and dikes have been used for extensive environmental modification in the
Netherlands.

Environmental
Modification in
Florida
Fig. 1-16: Straightening the Kissimmee River has had many unintended side effects.

C-38 Canal
Florida
The canal has carried water with
agricultural runoff and pollution into
Lake Okeechobee

Similarity of Different Places
Scale: From local to global
Globalization of economy
Globalization of culture
Space: Distribution of features
Distribution
Gender and ethnic diversity in space
Connections between places
Spatial interaction
Diffusion

Globalization of the Economy
Fig. 1-17: The Denso corporation is headquartered in Japan, but it has regional headquarters
and other facilities in North America and Western Europe.

Distribution:
Density,
Concentration, &
Pattern
Fig. 1-18: The density, concentration, and pattern (of
houses in this example) may vary in an
area or landscape.

Density and Concentration of Baseball
Teams, 1952 & 2007
Fig. 1-19: The changing distribution of North American baseball teams illustrates the
differences between density and concentration.

U.S. Baseball Teams, 1952
Fig. 1-19: Baseball teams were highly concentrated in the Northeast and Midwest
in 1952.

U.S. Baseball Teams, 2007
Fig. 1-19: By 2007, U.S. baseball teams were much more dispersed than in 1952, and their
number and density at a national level had increased.

Space-Time Compression, 1492-1962
Fig. 1-20: The times required to cross the Atlantic, or orbit the earth, illustrate how transport
improvements have shrunk the world.
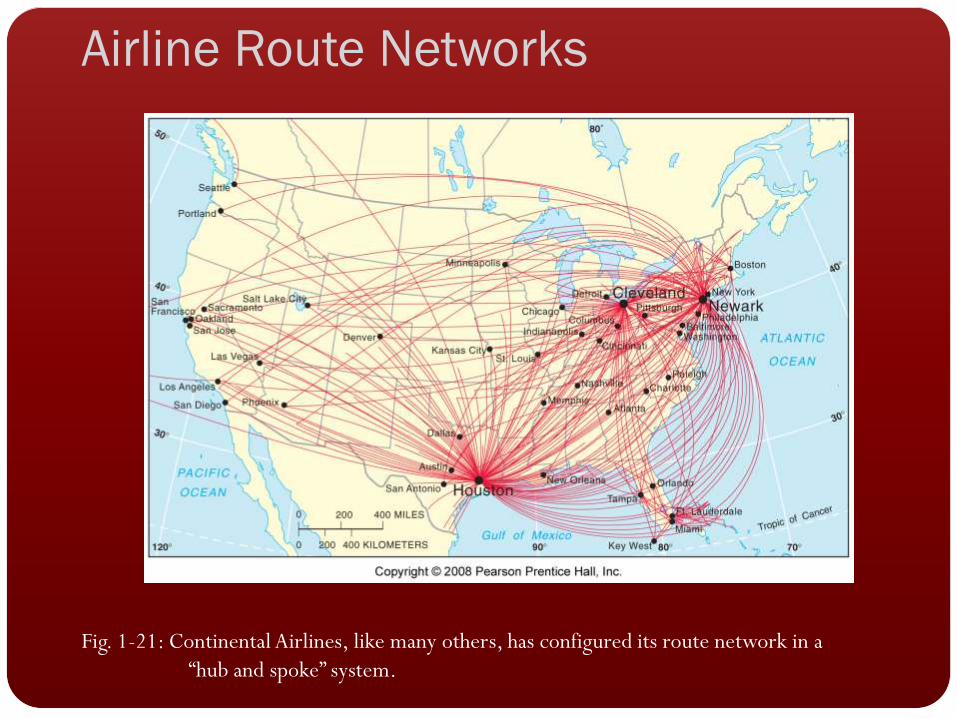
Airline Route Networks
Fig. 1-21: Continental Airlines, like many others, has configured its route network in a
“hub and spoke” system.

AIDS
Diffusion in
the US, 1981-
2002
Fig. 1-22: New AIDS cases were concentrated in three nodes in 1981. They spread through the
country in the 1980s, but declined in the original nodes in the late 1990s.

New AIDS Cases, 1981 (per 100,000 population)

New AIDS Cases, 1993 (per 100,000 population)

New AIDS Cases, 2002 (per 100,000 population)

Cumulative AIDS Cases, 1981-2002

The AIDS
Memorial
Quilt

Big Mac Geography