thesis/writing doc/Hasmiah… · Web viewdeterminative laws of nature described by a mathematical...
47
1 CHAPTR IV DEVELOPMENT OF A SYSTEM THINKING AND MODELLING PROCESS FOR SOCIOECONOMIC SYSTEMS DEVELOPMENT OF A SYSTEM THINKING AND MODELLING PROCESS FOR ANALYSING ICT IMPACT DYNAMICS 4.1 INTRODUCTION The purpose of this work is to provide a modelling process based on system thinking paradigm. It helps to socioeconomic policy making in macro level or national planning to gain a deeper understanding of complexity and dynamic in problematic situation of this area. HELPS TO UNDERSTAND ICT IMPACT DYNAMICS? ( the one you discuss in chapter 2? i.e to integrate social, economic and environmental objectives? This proposed modelling process which has rooted in two powerful and widely used methodologies, Soft Systems Methodology (SSM) and Systems Dynamics (SD), is adopted and adapted from Lane & Oliva (1998) and Rodrıguez-Ulloa (2004) which are explained in more details in section 4.5. This work attempts to combine or synthesize some stages of both methodologies which are suitable for modelling
Transcript of thesis/writing doc/Hasmiah… · Web viewdeterminative laws of nature described by a mathematical...

1
CHAPTR IV
DEVELOPMENT OF A SYSTEM THINKING AND MODELLING
PROCESS FOR SOCIOECONOMIC SYSTEMS
DEVELOPMENT OF A SYSTEM THINKING AND MODELLING
PROCESS FOR ANALYSING ICT IMPACT DYNAMICS
4.1 INTRODUCTION
The purpose of this work is to provide a modelling process based on system thinking
paradigm. It helps to socioeconomic policy making in macro level or national planning to
gain a deeper understanding of complexity and dynamic in problematic situation of this area.
HELPS TO UNDERSTAND ICT IMPACT DYNAMICS? ( the one you discuss in chapter
2? i.e to integrate social, economic and environmental objectives?
This proposed modelling process which has rooted in two powerful and widely used
methodologies, Soft Systems Methodology (SSM) and Systems Dynamics (SD), is adopted
and adapted from Lane & Oliva (1998) and Rodrıguez-Ulloa (2004) which are explained in
more details in section 4.5.
This work attempts to combine or synthesize some stages of both methodologies which
are suitable for modelling problematic situation in socioeconomic systems ICT impact
dynamics?. At the beginning, it is worth to clarify the meaning of model or modelling that
will be used in this context frequently. According to Manni & Cavana (2007) “A model is
defined as being a representation of the real world” (p22). As it is argued before, there are
two system thinking and modelling approaches which is called hard and soft modelling. Soft
modelling has been developed by Checkland in 1981 and refers to conceptual and contextual
approach that compared to hard model is more realistic and holistic. As mentioned before,
these approaches deals with social dynamics of systems behavior, while, hard modelling
approaches deals with physical and natural aspects of the reality to understand and control the
user, 05/09/13,
Give a name of your proposed methodology?Think about it . E.GSSD Approach of Modelling Socio- Economics System ?
user, 05/10/13,
Explain what do you mean complex and dynamic here in terms of ICT impact for example relating economics , social and environmental impacts?Do not make too strong and too general statements.You are developing a methodology that able to analyse ICT impacts not of any

2
determinative laws of nature described by a mathematical language. Manni & Cavana (2007)
further theorized that hard models are referred to as ‘quantitative or positivist’ and soft
models are referred to as ‘qualitative’ or interpretivist.
Please add a section describing the CONTEXT of your proposed framework
- the definition
- important concepts
- assumptions
-norms that govern your proposed framework/approach/modeling
methodology
-What can your proposed methodology do in analyzing Iran ICT?
4.2 THE SITUATION OF PROPOSED MODELLING PROCESS
To distinguish the position of the proposed modelling process the following graph is designed
(Figure 4.1). The curve line connected up the degree of “soft” modelling and degree of
“hard” modelling as two main borders. The approaches located on this curve are rooted in SD
and SSM with different level of coherence with each border. In the sense that soft system
thinking paradigm has primacy for those modeling strategies located at the top left hand
corner while hard system thinking paradigm is dominant at the bottom right hand end. In
other words, at the top we have qualitative or interpretivist models and at the bottom we have
quantitative or positivist models. The approaches along the curve are located based on the
degree to which they trade off these two kinds of models. In addition, synthesis or
combination of both methodologies and modelling process inside the borders is feasible.

3
Figure 4.1 The position of the proposed modeling process
At the very top of the curve is the SSM as the "softest" approach and therefore, most
subjective position of the modelling in system thinking approaches. As it is mentioned in
previous section, SSM is a methodology with a flexible process which provided by
Checkland (1981) that is helpful in engaging human beings, and provides a conceptual model
of what could exist in the real world. He believes that SSM focuses on a better understanding
of a system through an iterative learning process and purposeful action based on this
understanding. It is participatory in nature and accommodates the perceptions, judgements
and values of system actors.
At the very bottom of the curve is the first generation of SD methodology which
assumes that it is located in the quantitative side of systems thinking. It emanates in the
engineering tradition and demand that objectives can be well defined and defined as a
discipline to model complex systems in real world. The models are used to improve our
understanding of the general patterns of dynamic behavior.
During an intellectual evolutionary journey in system dynamic paradigm that has started
from its initial concepts in the 1960s, SD claims to be abandoning its functionalistic
beginnings an immerse in epistemologies closer to interventions in a more phenomenological
Explain greater detail why your proposed methodology for ICT impact dynamics is here? Why not SSDM/Holon Dynamics? Give examples. Don’t just explain in general. Give evidence for every strong statements

4
strands (Forrester (1994) Sterman (2000) and others). As Forrester (1992) reported the
system dynamics concept has changed because of its inclusion in a number of more general
system thinking concepts and systems methods. Therefore it can be seen as a movement to a
softer modelling by the works of Forrester (1994), Sterman (2000) and many others system
dynamics academics and practitioners. Nowadays, System dynamics has been widely used in
business, public policy and energy and environmental policy making.
The next point above the SD Methodology is where SSM and SD paradigm are
synthesized introduced by Lane and Oliva (1998). They claimed that this synthesis underpins
the SD’s theories by the SSM philosophical principles and concepts for generating and
representing diverse issues and for enhancing sensitivity to socio-political aspects. According
to Lane and Oliva (1998) this leads to complementing logic-based analysis of the issues at
hand with an “extended cultural analysis”. Their Holon Dynamics or Interactive Dynamics
approach is in the structure of SD paradigm. As a matter of fact the epistemological stance
and the boundaries of the proposed synthesis have been thoroughly developed, but the
procedure outlined needs further operationalization (Switzerland, 2003).
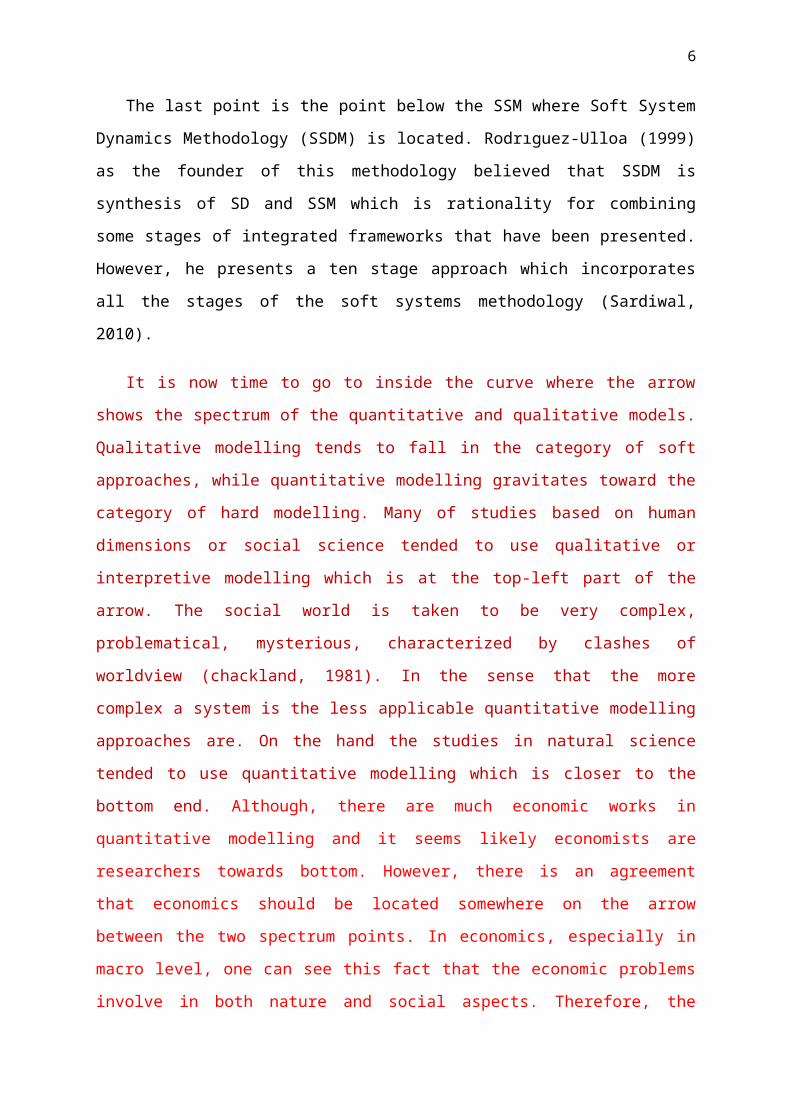
The last point is the point below the SSM where Soft System Dynamics Methodology
(SSDM) is located. Rodrıguez-Ulloa (1999) as the founder of this methodology believed that
SSDM is synthesis of SD and SSM which is rationality for combining some stages of
integrated frameworks that have been presented. However, he presents a ten stage approach
which incorporates all the stages of the soft systems methodology (Sardiwal, 2010).
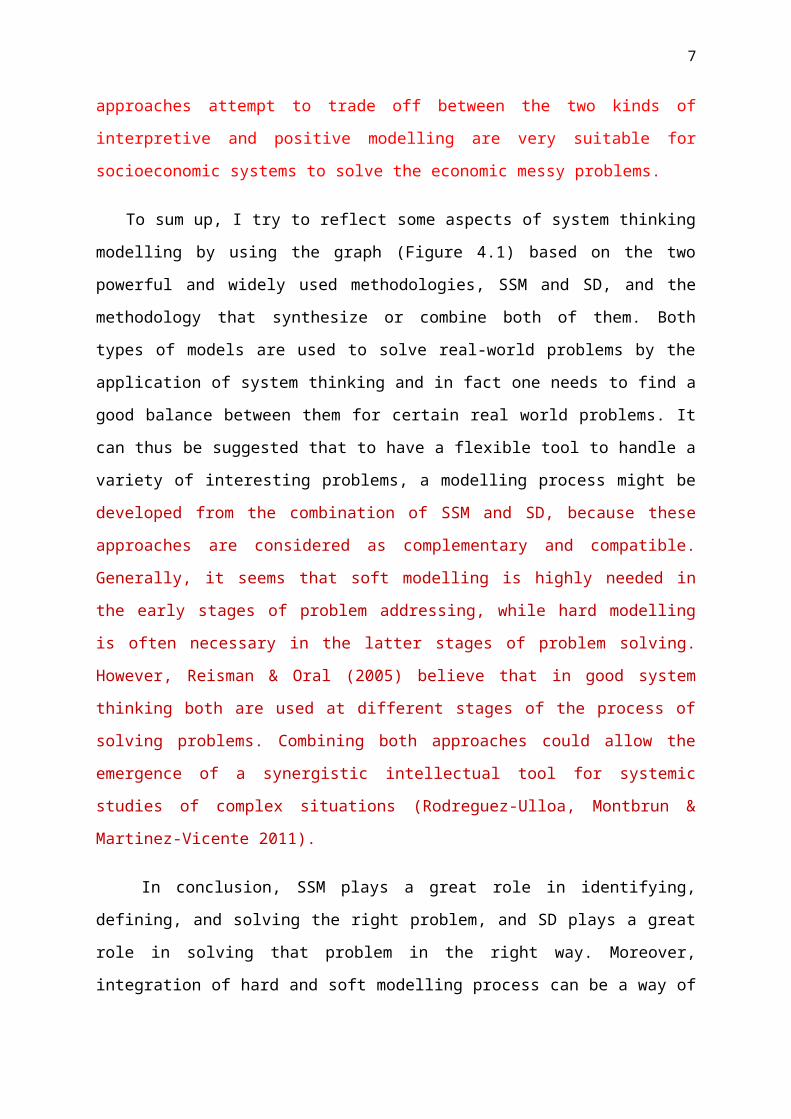
It is now time to go to inside the curve where the arrow shows the spectrum of the
quantitative and qualitative models. Qualitative modelling tends to fall in the category of soft
approaches, while quantitative modelling gravitates toward the category of hard modelling.
Many of studies based on human dimensions or social science tended to use qualitative or
interpretive modelling which is at the top-left part of the arrow. The social world is taken to
be very complex, problematical, mysterious, characterized by clashes of worldview
(chackland, 1981). In the sense that the more complex a system is the less applicable
quantitative modelling approaches are. On the hand the studies in natural science tended to
use quantitative modelling which is closer to the bottom end. Although, there are much
economic works in quantitative modelling and it seems likely economists are researchers
towards bottom. However, there is an agreement that economics should be located
somewhere on the arrow between the two spectrum points. In economics, especially in macro
user, 05/09/13,
Can you explain what is the application area using SSDM ?OR Can we use SSDM to explain socioeconomics system?If possible , what is the strength and limitation of the SSDM in explaining socio economics system?
user, 05/09/13,
What is the application area that use Lane and Oliva methodology?

5
level, one can see this fact that the economic problems involve in both nature and social
aspects. Therefore, the approaches attempt to trade off between the two kinds of interpretive
and positive modelling are very suitable for socioeconomic systems to solve the economic
messy problems.
To sum up, I try to reflect some aspects of system thinking modelling by using the graph
(Figure 4.1) based on the two powerful and widely used methodologies, SSM and SD, and
the methodology that synthesize or combine both of them. Both types of models are used to
solve real-world problems by the application of system thinking and in fact one needs to find
a good balance between them for certain real world problems. It can thus be suggested that to
have a flexible tool to handle a variety of interesting problems, a modelling process might be
developed from the combination of SSM and SD, because these approaches are considered as
complementary and compatible. Generally, it seems that soft modelling is highly needed in
the early stages of problem addressing, while hard modelling is often necessary in the latter
stages of problem solving. However, Reisman & Oral (2005) believe that in good system
thinking both are used at different stages of the process of solving problems. Combining both
approaches could allow the emergence of a synergistic intellectual tool for systemic studies
of complex situations (Rodreguez-Ulloa, Montbrun & Martinez-Vicente 2011).
In conclusion, SSM plays a great role in identifying, defining, and solving the right
problem, and SD plays a great role in solving that problem in the right way. Moreover,
integration of hard and soft modelling process can be a way of eliciting information about
attitudes and values that are crucial to the simulation of human dimensions within a
quantitative model. These advantages can be gained in a hybrid modelling based on SSM and
SD in system thinking paradigm through its careful application in socioeconomic problem
solving.
Before you described the proposed modeling process:
Give a name to the proposed methodology
Explain what is its role, scope and objectives of the proposed Methodology
The main assumptions of the proposed methodology
user, 05/09/13,
What is the different between problem in socio-economics, engineering, public policy/business etc…As such different approach of soft system dynamics methodology need to be developed?
6
The Context where the methodology is useful
4.3 THE PROPOSED MODELLING PROCESS
The phases of the proposed modeling process (Figure 4.2) are incorporated across two worlds
and two main cycles:
- World 1: Real World;
- World 2: System Thinking World;
- Cycle 1: Conceptual and Dynamic Modelling;
- Cycle 2: Scenario Planning with Learning Lab based Simulator.
Explain?
7
Figure 4.2 Propose modelling process
In general, the process, firstly, starts in Real world to structure problem situation. Then it
moves into systems thinking world to devise a suitable intervention with two continuous
cycles, which are involving conceptualization (cycle 1) and experimentation based on a
simulator (cycle 2) Where is cycle 1 and cycle 2 in the Fig 4.2?). Iteration
around phases 2, 3 and 4 and their activities continues until it is felt that the proper
conceptual models have been assembled and the wider iterations around phases 3, 5, 6, and
4&7 represent the simulator for scenario planning. It is important to emphasize that the
comparison, testing and evaluating phase is a common phase between both cycles and
worlds. Finally, the process is ended in the Real world to suggest changes policy and action
8
to improve the situation. In the following sections, these phases and the activities within each
phase are outlined with the account of the detailed.
4.3.1 Phase 1: Finding Out About Problem Situation (In Real World)
This is the phase in which all the elements become first identified, linked, and then shaping
the structure of the problematic situation. To do this, there are some important aspects that
require consideration, such as to identify problem stockholders and actors existing in the
situation, their worldviews, level and type of power relationships existing among them, the
cultural issues, etc. These are precisely the aspects that make the situation problematic and
difficult to understand if we are trying to make recommendations for its improvement
(Rodreguez-Ulloa, Montbrun & Martinez-Vicente 2011). At the same time, it provides the
criteria to decide what can be ignored so that only the essential features necessary to fulfill
the purpose are left because “The art of model building is knowing what to cut out” (Sterman,
1991 p89).
At the first phase of the process, it is worth to mention that according to SSM, in order to
study the problem situation in a holistic manner, the problematic situation must be regarded
in an open manner and trying not to see the situation (real world) as a system itself (Paucar-
Cacere & Rodriguez-Ulloa, 2007). Instead, trying to see purposeful activity that could, in
principle, be enacted in the real world by humans as a Human Activity System.
The following activities are powerful to help to understand and comprehend of the
phenomena and events occurring in a problematic situation, where something is not working
well and something needs to be done to improve the problem situation.
Looking at the Unstructured Problem Situation
It is the first step to involve with the problem situation under study and to learn as much as
possible about the problematical situation. Consequently, analysts cannot clearly distinguish
the identity of the problems, conflicts, aspirations, beliefs, attitudes, habits and human
relationships that exists in that situation (Rodreguez-Ulloa, Montbrun & Martinez-Vicente,
2011). Hence, the analyst should approach the investigation with an open mind and should
not limit himself to a limited context. In this activity, the analyst reads background material,

9
performs interviews and other activities that are needed in the learning process and apply a
variety of disciplines, techniques, methods, to understand and comprehend all the issues
involved in the social situation under study.
Preliminary Information & Data Collection
Information and data in the modeling process will be served: as basic sources of identifying
the problem situation in the real world, as the basis for the initial conceptual model
development, the causal and effect relationships' construction and simulation modeling effort,
and as one of the basic sources of comparison and evaluating models and outcome's behavior
of models in phase 4&7. Sterman (2000) presented the term of "reference mode" literally a
set of graphs and other descriptive data showing the development of the problem over time.
Reference modes help observers break out of the short term event-oriented worldview so
many people have.
Regarding about mentioned explanations, the preliminary information and data can
contain any form of documents such as media reports, historical and statistical records, policy
documents, previous studies, and stakeholder interviews and so.
Boundary Selection
One of the purposes of the modeling process is that models are tools for examining the
behavior of key variables over time. The model boundary can be determined while studying
the variables that affect the system (Ratha, 2001). In this respect, the problem situation
defines the key variables as the factors have the most effect on the systems of purposeful
human activity. In the sense that deciding whether or not a certain variable is important in
determining the system’s behavior within problematic situation. To do this, Sterman (2000)
suggests the model boundary chart which summarizes the scope of the model by listing which
key variables are included endogenously, which are exogenous, and which are excluded from
the model. In addition, he emphasized that the time horizon should extend far enough back in
history to show how the problem emerged and describe its symptoms. It should extend far
enough into the future to capture the delayed and indirect effects of potential policies. A
principal deficiency in our mental models is our tendency to think of cause and effect as local
and immediate. But in dynamically complex systems, cause and effect are distant in time and
space. Most of the unintended effects of decisions leading to policy resistance involve
feedbacks with long delays, far removed from the point of decision or the problem symptom.
10
A long time horizon is a critical antidote to the event-oriented worldview so crippling to our
ability to identify patterns of behavior and the feedback structures generating them. The
choice of time horizon dramatically influences your perception of the problem and the
evaluation of policies (Sterman, 2000).
Rich Picture Building
One of the key tasks in this phase is the development of a ‘rich picture’ of the problem
situation. The idea is to represent pictorially all the relevant information and relationships as
a good way of communicating to get a good picture and feel about the problematic situation
that should be investigated. Its rationale lies in the fact that the complexity of human affairs is
always a complexity of multiple interacting relationships; thus, diagrams are more effective
than linear prose in presenting relationships and that pictorial representation of multiple
interacting relationships promotes holistic thinking (Checkland 2000). This is simply to aid
the modeller or consultant to gain an understanding of the situation. It represents what the
human system is “about”, and can be considered as a mental map (Avison and Fitzgerald,
1995).
Developing a rich picture is a creative skill which as checkland and Winter (2006)
provides some guidelines as to what should be included. These are:
- Structures and viewpoints in the situation, that is, the elements that are slow to
change;
- The processes going on, that is, the continuously changing elements that are carried
out within the system;
- The connections between these elements, that is, a view of the climate that is
generated by the way they fit together.
Accordingly, this material will be summarized in a "rich picture" which usually includes
graphics as well as words and from this pictorial overview, themes relevant to the problem
situation may be identified and modeled as systems of purposeful human activity.
Cultural Analyses
In addition to rich picture building, other frameworks which help to make the grasp of the
problem situation as rich as possible is initiated to explore its cultural dimension (Checkland,

11
1988b) with the carrying out three kinds of inquiry, known as the intervention itself, a social
analysis (What kind of ‘culture’ is this?) and a political analysis (What is the disposition of
power here?). The aim of the social and political analysis is to understand the different
worldviews of the people and groups involved in the problem situation.
Cycle 1: Conceptual and Dynamic Modelling
This will be the first cycle of model building in the system thinking world that to be obtained
with the contribution of SSM and SD tools. The models as the output of this cycle are the
devices which enable that discussion to be a structured rather than a random one (chekland &
Poulter, 2010) and must help to organize information in a more understandable way
(Forrester, 1998). Afterward during iteration of this cycle, the conceptual models derived
from the root definition and dynamic hypothesis may serve to structure causal loop models
based on each particular W. This may greatly help to have the coherent thinking what Lane
and Oliva (1998) called ‘‘dynamic coherence: consistency between the intuitive behavior
resulting from proposed changes and behavior deduced from ideas on causal structure" (1998,
p. 226) which is examined using an iterative combination of SD and SSM modeling
processes.
It is important to emphasize that in the modeling process one will iterate through the
phases and activities many times until when a model is defensible in relation to the concept
being expressed. No one ever built a model by starting with phases respectively and
progressing in sequence through a list of activities. The iteration happens both within each
activities of phases, and across phases, as desired or needed. At any point in the process, there
exists some degree of understanding and discernment regarding the problem situation and the
system of purposeful human activity under study.
TRY TO SUMMARISED Phase 1 into a diagram that consists of arrow and
related sub activities and boxes of guidance, and concepts to conduct the
activity????
4.3.2 Phase 2: Formulating Root Definitions and Dynamic Hypothesis (In System
Thinking World)
This is the phase which moves out of the real world into the system thinking world. First,
when making system models it is very important to be aware that they are always constructed
12
from a worldview (Checkland, & Poulter, 2006). In fact, it is the advantage of the SSM that
to deal with the complexity of a problematical situation contains the framework to define a
problematic situation from a particular worldview (Checkland 1981). Next, it is needed a
statement to describe each relevant purposeful activity system, which viewed through the
worldview perspective of the problem situation, these descriptions that will be modelled are
called Root Definitions in SSM that aim to capture the basic elements involved in the system.
Finally, the dynamic hypothesis, the SD step that guides modelling efforts by focusing on
certain structures will be expressed based on the mixtures of worldviews and the purposeful
activity system taken from the root definitions and joined in the model. Consequently, the
core way is to select a particular perspective and put it through very structured and dynamic
framework as follows. It might be ended up with very different root definitions, dynamic
hypotheses and ultimately different models.
Understanding Worldviews
The perceptions of the problem situation depend on the worldviews which are assumptions
made about the system; that is, how the system is perceived from a specific viewpoint by
observers in the situation. chekland & Poulter (2010) emphasized that the worldviews are the
internalized taken-as-given assumptions which cause us to see and interpret the world in a
particular way. Therefore, Different individuals will perceive the same event in different
ways according to their view of the world, based on their experiences, personality and
situation. It should be noted that in SD the term of metal model is closer to worldview
concept. As Forrester (1971) argued that the mental model is “a mental image of selected
concepts and relationships of the world around us which we consider relevant for explaining
the behavior of a particular system" (p213).
In general, therefore, the purpose of this activity is to understand the concept of different
perspectives that are possible to draw out of the rich picture, and then manifest worldviews
or mental models, relating to problem situation.
Describing the Purposeful Activity
In order to construct a model of a purposeful ‘activity system’ viewed through the perspective
of a pure, declared worldview, we need a statement describing the main purpose activity of a
relevant system to be modelled. Such descriptions are known in SSM as Root Definitions
(chekland & Poulter, 2010), which the idea is to provide a minimal definition of a system,

13
viewed partly in input and output terms, to enable discussion about what is required (pidd
2007). As Rodriguez (2000) the founder of SSDM argued, problem-oriented root definitions
is to try to understand why the situation is the way it is, that is, it expresses the problematic
transformation process that it is assumed to occur in the real world and expressed in the ‘rich
picture’. It is worth to mention that this perspective of root definitions is much more close to
dynamic hypothesis in SD.
Checkland and Scholes [1990], recommended three ways (Table 4.1) to describe
purposeful activity as the transformation process that is made by an observer(s) based on a
specific worldview and the description provides the interpretive arguments to justify it.
Table 4.1 The transformation process descriptions
Type Description Language
Transformation
process diagram
In which an entity, the input to the transforming
process, is changed into a different state or
form, so becoming the output of the process.
PQR formulaAnswers to three quick questions: What?,
How?, Why? And complete the PQR formula.
P: DO
Q: By
R: Achieve
Written statementWrite out any purposeful activity you can think
as a transformation process.natural language
Another way to describe the real word activity is what Sterman (2000) called subsystem
diagram; it shows the overall architecture of a model. Subsystem diagrams convey
information on the boundary and level of aggregation in the model by showing the number
and type of different organizations or agents represented. They also communicate some
information about the endogenous and exogenous variables.
Expressing Dynamic Hypotheses
In fact, a root definition is similar to a hypothesis or a mission statement that expresses the
purpose of the system [Checkland and Scholes, 1990]. However, this will be the activity to be
14
obtained with the contribution of SD that called dynamic hypothesis, in the sense that
modelers must begin to develop a theory to account for the problematic behavior.
Investigating feedback causal structure requires the development of a dynamic hypothesis
because the drivers of system behavior can evolve over time. As Sterman (2000) argued it is
a hypothesis because it is always provisional, subject to revision or abandonment as
practitioners learn from the modeling process and from the real world; in deeded, it is
dynamic because it must provide an explanation of the dynamics characterizing the problem.
A hypothesis (theory) generated for how the system is crating the troubling behavior
(Forrester, 1994).
In general, therefore, the purpose of this activity is to capture describe the theories about
the causes of the problematic behavior based on a specific worldview that can guide
conceptual dynamic modeling efforts by focusing modeler on certain structures.
4.3.3 Phase 3: Causal Loop Modelling of Dynamic Conceptual Models (In System
Thinking World)
During this phase, dynamic conceptual models of the purpose activity of a relevant system
are created by causal loop diagrams as a tool to represent its causal structure. The dynamic
conceptual model provided the framework for subjective analysis as an initial set of opinions,
recommendations for strategy and scenario planing; consequently, this is one of the major
components of this modelling process. As Maani and Cavana (2007) believe building the
conceptual model may greatly help to have the coherent thinking required in the process of
understanding a problematical situation. In addition, Variables and causal relationships need
to express the problematic situation as a whole (holon) from a specific worldview so that in
the end the modeler is aware under which worldview the modeling of the problematic
situation has been conducted (Rodreguez-Ulloa, Montbrun & Martinez-Vicente 2011). These
are one contributions of SD and SSM synchronization.
Through the following activities, the dynamic conceptual model is created with the
techniques drawn from SD to elaborate important activities, variables and relationships in the
system, which is expressed by casual loop maps.
Identifying the Key Activities and Variables

15
As the corresponding conceptual models need to show how the root definition has been done
in the real world: therefore, the conceptual model is built by identifying the key activities and
variables within the root definition and dynamic characteristic that expressed by dynamic
hypothesis. As mention before, at the core of this process is purposeful human activity.
Human activity systems are imbued with values, intentions, and norms that are rooted in the
worldviews that make each system meaningful in the context of the problem situation.
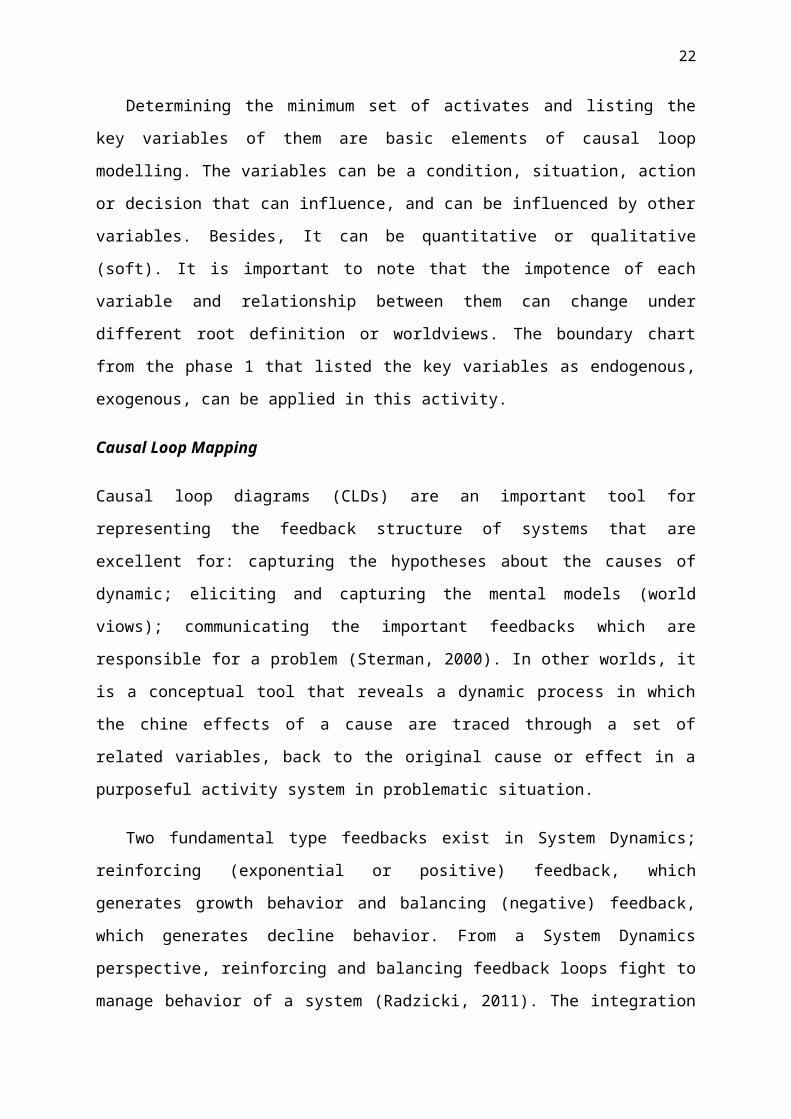
Determining the minimum set of activates and listing the key variables of them are basic
elements of causal loop modelling. The variables can be a condition, situation, action or
decision that can influence, and can be influenced by other variables. Besides, It can be
quantitative or qualitative (soft). It is important to note that the impotence of each variable
and relationship between them can change under different root definition or worldviews. The
boundary chart from the phase 1 that listed the key variables as endogenous, exogenous, can
be applied in this activity.
Causal Loop Mapping
Causal loop diagrams (CLDs) are an important tool for representing the feedback structure of
systems that are excellent for: capturing the hypotheses about the causes of dynamic; eliciting
and capturing the mental models (world viows); communicating the important feedbacks
which are responsible for a problem (Sterman, 2000). In other worlds, it is a conceptual tool
that reveals a dynamic process in which the chine effects of a cause are traced through a set
of related variables, back to the original cause or effect in a purposeful activity system in
problematic situation.
Two fundamental type feedbacks exist in System Dynamics; reinforcing (exponential or positive) feedback, which generates growth behavior and balancing (negative) feedback, which generates decline behavior. From a System Dynamics perspective, reinforcing and balancing feedback loops fight to manage behavior of a system (Radzicki, 2011). The integration process creates all dynamic behavior in the world being in any system.
A causal loop diagram contains four elements: (1) variables that are related in cause/effect sequence(s); (2) arrows that indicate which variables are affecting other variables; (3) symbols associated with the arrows that

16
denote the direction (either same or opposite) of the influence of the relationships; central symbols that indicate the type feedback loop as mentioned above (either reinforcing or balancing). Table 4.2 lists the symbols and their descriptions used in a causal loop diagram.
Table 4.2 The symbols in causal loop diagram (CLD)Symbol Description
cent
ral s
ymbo
l
or
Reinforcing (exponential or positive) Feedback Loop: the loop is reinforcing and grow, or shrink, until acted upon by a limiting force
or
Balancing (negative) Feedback Loop: the loop is “balancing” and moves toward, return to, or oscillate around a particular condition.
sym
bols
asso
ciate
d wi
th th
e ar
rows
Or
The influence effect which shows both variables move in the same direction. If the first variable at the arrow tail increases/ decrease, the second variable at the arrow head will be greater/ less than it would have been otherwise.
Or
The influence effect which shows both variables move in the opposite direction. If the first variable at the arrow tail increases/decrease, the second variable at the arrow head will be less/ greater than it would have been otherwise.Delayed Influence: A double line across the link signifies that the influence is significantly delayed.
4.3.4 Phase 4: Comparison, Testing and Evaluating
This is a very important phase as Checkland (1999) believes it better to undertake the
comparison stage, have the discussions, gain insights, and return to the model, rather than
spend a long time on the initial model building. This contains the activities at which system
thinking world (conceptual models) is compared with the real word based on the
understanding phenomena and events occurring in problematic situation as developed in
phase one.

17
From this comparison, two outcomes are possible. Ether more potentially relevant
systems to be modelled are detected - in which case the modelling and comparison phases are
iterated, or, alternatively, a number of changes to the problem situation are identified (Lane &
Oliva 1997). Furthermore, these comparisons lead to revisions in model structure and
parameters as well as additional data collection, interviews, and refinement of the values and
justification for parameters. Finally, it is compared what should happen with what actually
happens and identifies a number of things, which could be done to bring the real world closer
to the conceptual model.
Checkland and Scholes (1990) suggest four ways of doing comparison in the form of
unstructured discussions; structured questioning of the model using a matrix approach;
scenario writing based on dynamic models; and trying to model the real world in the same
structure as the conceptual models. All these offered ways will be done in this phase with the
combination of SD and SSM principles.
It important to notice that this phase is embedded in both cycles of the proposed process;
therefore, the following activities will be conducted for with both conceptual models and
dynamic or simulation models.
Comparing and Testing the Models Structure and Behavior
Both model structure and model behavior tests will be done in this activity in comparison
with phenomena and events occurring in problematic situation as developed in phase one.
Each model is now confronted with the problem situation, either through an orchestrated
debate or a point by point comparison of the model and the real world situation. The purpose
here is validation of model structure through comparison and reconciliation with the evidence
and to validate whether or not the conceptual model is viable and can be implanted in the real
world. Success in testing of the model creates confidence in the model.
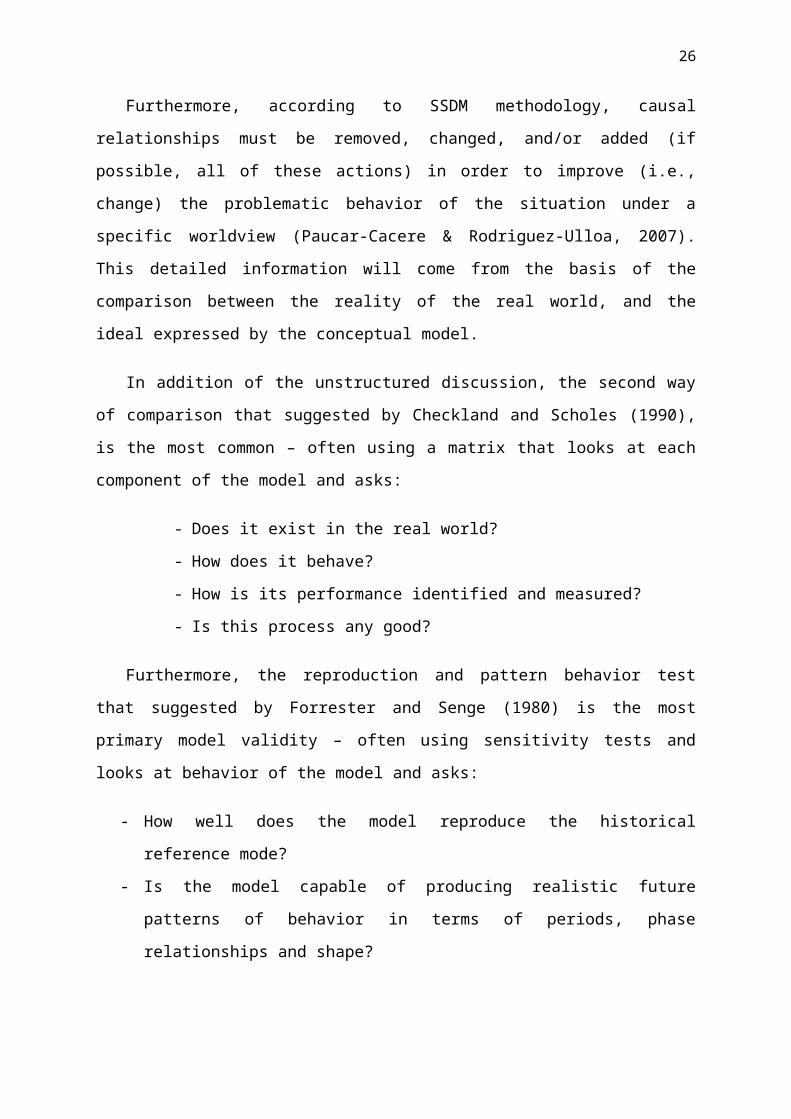
Furthermore, according to SSDM methodology, causal relationships must be removed,
changed, and/or added (if possible, all of these actions) in order to improve (i.e., change) the
problematic behavior of the situation under a specific worldview (Paucar-Cacere &
Rodriguez-Ulloa, 2007). This detailed information will come from the basis of the
comparison between the reality of the real world, and the ideal expressed by the conceptual
model.

18
In addition of the unstructured discussion, the second way of comparison that suggested
by Checkland and Scholes (1990), is the most common – often using a matrix that looks at
each component of the model and asks:
- Does it exist in the real world?
- How does it behave?
- How is its performance identified and measured?
- Is this process any good?
Furthermore, the reproduction and pattern behavior test that suggested by Forrester and
Senge (1980) is the most primary model validity – often using sensitivity tests and looks at
behavior of the model and asks:
- How well does the model reproduce the historical reference mode?
- Is the model capable of producing realistic future patterns of behavior in terms of
periods, phase relationships and shape?
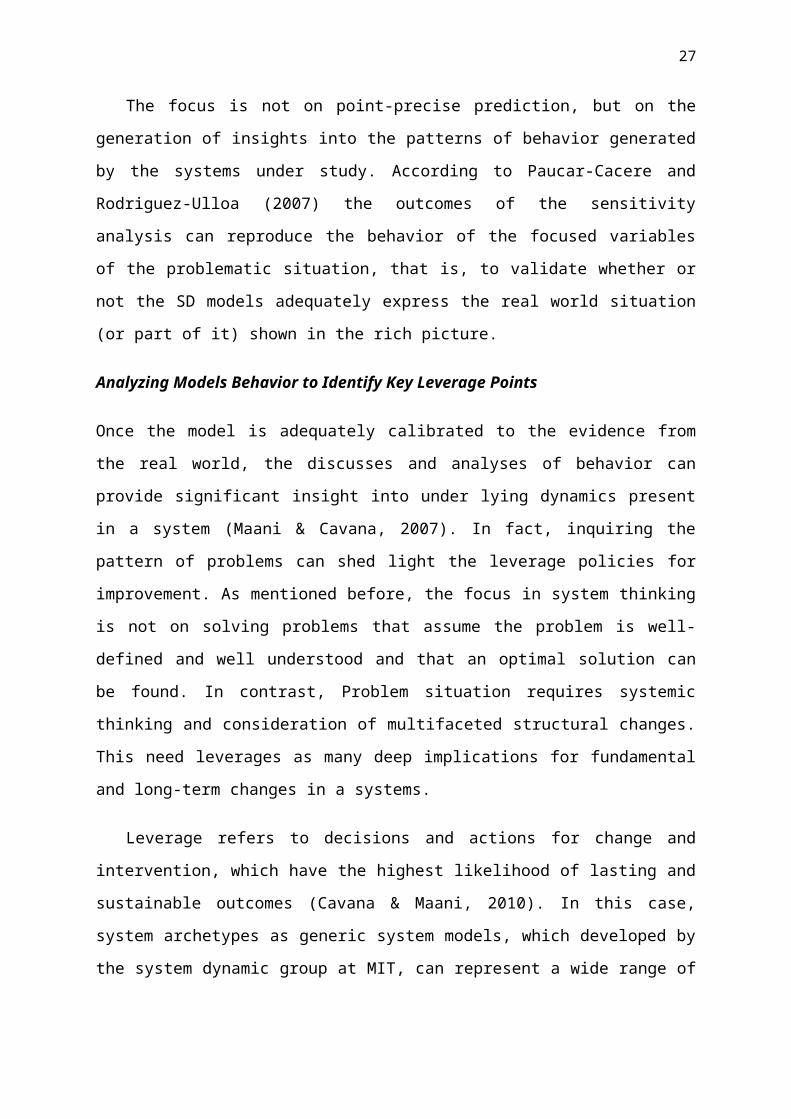
The focus is not on point-precise prediction, but on the generation of insights into the
patterns of behavior generated by the systems under study. According to Paucar-Cacere and
Rodriguez-Ulloa (2007) the outcomes of the sensitivity analysis can reproduce the behavior
of the focused variables of the problematic situation, that is, to validate whether or not the SD
models adequately express the real world situation (or part of it) shown in the rich picture.
Analyzing Models Behavior to Identify Key Leverage Points
Once the model is adequately calibrated to the evidence from the real world, the discusses
and analyses of behavior can provide significant insight into under lying dynamics present in
a system (Maani & Cavana, 2007). In fact, inquiring the pattern of problems can shed light
the leverage policies for improvement. As mentioned before, the focus in system thinking is
not on solving problems that assume the problem is well-defined and well understood and
that an optimal solution can be found. In contrast, Problem situation requires systemic
thinking and consideration of multifaceted structural changes. This need leverages as many
deep implications for fundamental and long-term changes in a systems.
Leverage refers to decisions and actions for change and intervention, which have the
highest likelihood of lasting and sustainable outcomes (Cavana & Maani, 2010). In this case,

19
system archetypes as generic system models, which developed by the system dynamic group
at MIT, can represent a wide range of problematic situation's pattern. They help us to see or
find leverage of relevant systems (Senge. 1990).
Cycle 2: Scenario Planning With Learning Lab based Simulator
Scenario planning involves using the model as the basis for developing coherent scenarios
about the problem situation and then using these as the basis for discussion in the situation
(checkland, 1981). In this respect, an appropriate and effective tool that contributes to create
the formal model of simulators for scenario planning is system dynamics modeling instead of
guessing the hypothetical scenarios. Simulators are computer-based simulation games of real-
world scenarios that users take on the role of decision-makers within the systems (Größler,
Rouwette & Vennix, ). Stterman (2000) has pioneered the development of management flight
simulators of corporate and economic systems- microworlds where space and time can be
compressed and slowed so we can experience the long-term side effects of decisions, speed
learning, develop our understanding of complex systems, and design structures and strategies
for greater success. These flight simulators are used in research to understand and improve
scenario planing and decision making in complex dynamic systems. Scenario planning based
simulator tries to capture the benefits of advance learning as well as guidelines for action help
policy maker visualize alternative changes to improve problem situation and organizes them
into stories.
The purpose of making simulator and learning lab in this cycle is that it allows
researchers and policy makers to run models with different values or scenario and to be role-
play in dynamically complex systems due to see the consequent of policy making before
implementation. The Simulator will be developed with one of the sophisticated and user‐friendly system dynamics software such as STELLA, iThink, Vensim, etc.
In short, after building dynamic and computer-based model, it is run based on a
determined scenario and results are described and analyzed by the modelers in the
comparison phase. Frequent iteration of this process creates a learning cycle as a lab.
4.3.5 Phase 5: Dynamic and simulation Model building (In System Thinking World)
The causal loop maps of conceptual models as the output from the cycle 1 are used for
developing dynamic model in this phase. Following this, the formal computer-based
20
model will be constructed to serve as simulators to analyze the consequences of scenario,
strategies and policies. The simulator which will be developed in the following activities can
reproduce the behavior of the system by simulating the model over time. It provides a means
for better understanding the impact of alternative policies and their implementation in the
form of decisions (Sterman, 1988).
Identifying Stock and Flow Variables and Constricting Dynamic Diagram
Forrester (1961) created a language to portray the dynamics of a system which include four tips or blocks: Stock (also called level), Flow (also called rate), Converters (also called auxiliary variables) and Connector. Stocks accumulate (i.e., sum up) the information or material that flows into and out of them. Mathematically, stock is called integration and a system’s flow equations are ordinary differential equations (Radzicki, 2011).
In simple concept, Flows can be thought of as pipe and tap assemblies that fill or withdraw the stocks. Stocks can be thought of as bathtubs that accumulate or de-cumulate a system’s flows over time. Auxiliary variables submit an application the computation between stocks, flows, constants and other variables and connector link all these variables to show the feedback causal loops formed by them. This is a very smart idea for portraying the structure of a system, not important how big it is, all we need to know is four building blocks or scripts and their simple language rules.
Table 4.3 lists the tips, symbols and their description and equation used in a stock-flow diagram (SFD).
Constructing Computer Simulation Models
Computer-based simulation model will be constructing based on the stock flow diagrams and
the inter-relationships of the identified key variables by using one of many user‐friendly
computer software (such as STELLA, iThink, Vensim, and so on) developed to assist system
dynamics modelling logic. Furthermore, the initial values for stocks and parameter values for
auxiliary variables should be identified. The initial value of levels (stocks) can be a number

21
or a value of another variable, such as a constant or an auxiliary. The constants, tables and
mathematical functions will be determined by the structural relationship between the
variables (Cavana & Maani, 2010). Finally, by running the model simulation results can be
viewed immediately and the graphical and table output will be produced by simulating the
model over time to show behavior of the system in the base case of the model.
Now the computer-based model can be converted into an interactive flight simulator
with an intuitive interface that can be used to design and analyze the implications of policies
and strategies against the backdrop of the scenarios developed.
Table 4.3 The tips in the stock-flow diagram (SFD)Tip name
and Symbol
Description and Equation
Stock (Level)
An accumulation of stuff that can increase or decrease over time. Stocks are the “nouns” which represent things or status. Stocks can only be modified through flows. Stocks integrate their flows. The value of the level at any point in time equals the value from the previous time step plus any inflows and minus any outflows in the current time step.
Equation: Stock(t) = ∫t 0
t
[Inflow (s)−Outflow (s)]ds + Stock(t0)
Flow (Rate)
Action or process that transports “stuff,” directly adding to (inflow) or taking away from (outflow) the accumulation in the stock. The “cloud” at the end of the flow symbol represents the boundary of the system. Flows are the “verbs” which represent actions or activities. A flow is always a rate and is defined in terms of units of the stock per unit of time. The net rate of change of any stock, its derivative, is the inflow less the outflow, defining the differential equation.Equation: d(Stock)/dt = Inflow(t) - Outflow(t).
Converter (auxiliary)
Holds information about the system that affects the rate of the flows, or that affects the value of another converter.
22
Auxiliary variable receive, compute and pass on information. Auxiliary variable are adverbs which change volume of Flow or combine two or more variables consistently. They are functions of stocks and constants or exogenous inputs.
Connector Moves information from one element of the system/map to another. It originates at the point where it “picks up” that information and terminates (the arrowhead end) at the place the information is delivered.
Steady State and Parameter Sensitivity Test
Before any validating the behavior of the model in phase 4 & 7, we need to test steady-state
equilibrium or stability condition and parameter sensitivity. A steady-state condition for a
simulation model can be detected by examining the stocks in the model. In steady-state, the
sum of all inflows to each stock is equal to the sum of all outflows, and therefore the
magnitudes of the stocks do not change over time.
On the other hand, the model's parameter values in simulation models are very important
areas for testing; because, there may be elements that are not usually quantified, especially in
human purposeful activity system, but that are critical to the system being modeled. Then
many required parameter values may not exist and must be developed. Therefore, parameter
sensitivity test guides researcher in answering the question as Forrester and Senge (1980)
argued:
- Have the insensitive many parameters been distinguished from the critical few?
- Were the appropriate techniques used to develop parameter?
The result of this test can increase the level of confidence in the simulation model and
reduce the uncertainties of some parameter values. Since, as mentioned in theatrical
foundation of system dynamics it is often the structure of a system, more than the parameter
values, that primarily determines the system behavior.
4.3.6 Phase 6: Policy Formulation and Scenario Determination (In System Thinking
World)

23
Once the researcher has developed confidence in the structure and behavior of the models,
modeler can use it to design policies based on the explored leverage point of relevant systems
in phase 4. Therefore, the objective of this phase is to design policy and write scenarios based
on the insight of system structures that create or increase perceived problem situation in the
real world instead of guessing the hypothetical scenarios.
Scenario Specification
In this activity researcher attempt to answer the question:
- What environmental conditions might arise?
To answer this question general scope, time frame and boundaries of external
environment for scenarios will be developed and the key drivers of change, uncertainties and
factors would be identified that could have a significant impact on the decisions, policies and
strategies being evaluated. It also determines ranges for external parameters and graphs. At
the end, it would be provided the theme scenarios or stories of possible situation.
Determination and Simulating Scenarios
This activity guides researcher in answering the question as Sterman (2000) argued:
- What new decision rules, strategies, and structures might be tried in the real world?
- How can they be represented in the model?
There are several variables in the model which can be changed to reflect possible
environment changes in the real word. Policy design, however, is much more than changing
the values of parameters; Policy design includes the creation of entirely new strategies,
structures, and decision rules and Strategy is the combination of a set of polices and as such
deals with leverage points. Since the feedback structure of a system determines its dynamics,
most of the time high leverage policies will involve changing the dominant feedback loops by
redesigning the stock and flow structure, eliminating time delays, changing the flow and
quality of information available at key decision points, or fundamentally reinventing the
decision processes of the actors in the system (Sterman, 2000).
The next step after defining policies is to perform it by computer based simulator. The
activities at this part can range from simple change of one variable to complete redesign of a

24
decision rule, a policy or the whole strategy. One common method is to define best and worst
case scenarios. In the best (worst) case scenario, you set the values of all parameters and
relationships to the values most (least) favorable to the outcomes you desire or the policies
you want to test (Sterman, 2000).
This activity will be wildly applied to generate scenarios indicating the alternative
consequences of the proposed strategies. Users can then trace changes in outcomes back to
the assumptions and polices that produced those changes in the iterating cycle and various
strategies can be formulated as scenarios for improvement problematic situation.
4.3.7 Phase 7: Comparison, Testing and Evaluating
As mentioned before (in phase 4), the third way of using models to question reality that
suggested by chekland and Poulter (2010) is to use a model as a basis for writing an account
of how some purposeful action would be done according to the model, and comparing this
story, or scenario, with a real-world account of something similar happening in the real
world. In this part of assessment, policy maker with a holistic worldview would be able to act
in consonance with the long-term best interests of the system as a whole, identify the high
leverage points in systems that can produce sustainable benefit, and avoid policy resistance
(Sterman, 2000).
To do this, in addition of the comparison and testing activities in phase 4, the behavior
sensitive analysis will be carried out for structure and behavior validation of simulation
model, and then it is begun to discuss and evaluate how the system will respond and change
under the various scenarios.
Behavior Sensitivity Analysis
Behavior sensitivity analysis is used to determine how sensitive a model is to changes in the
structure and parameters value of the model. It helps a modeler to develop intuition regarding
the relationship between the structure and behavior of complex dynamic systems (Sterman
2000). As Rodreguez-Ulloa, Montbrun & Martinez-Vicente (2011) argued, one continues
with its calibration and sensitivity analysis in order to examine the diverse consequences that
may result from a particular worldview of the problematic situation, under the simulation of
different conditions of key causal variables.

25
Furthermore, the sensitivity tests indicate the area that some changes result in greater, or
more significant, changes than others. Consequently, behavior sensitivity analysis can also
help to identify high leverage points, which are the best intervention points for effective
policies. This confirms that the most influential parameters, elements and part of structure are
the ones responsible for the network effects in the system.
Scenario Analysis
This activity guides researcher in answering the question:
- What are the effects of the policies to improve the problematic situation (What if
analysis)?
To pass the test, the performance of the policies and strategies should be evaluated for
each scenario. In the sense that the behavior outcome of the model would allow a modeler to
start scenario analysis to gain important insights assessment of the long-term impact of
environment changes and the impact of structural and policy changes.
The outcomes should be assessed against a range of relevant performance measures for
overall robustness (Cavana & Maani, 2010). The interactions of different policies must also
be considered: Because real systems are highly nonlinear, the impact of combination policies
is usually not the sum of their impacts alone. Often policies interfere with one another;
sometimes they reinforce one another and generate substantial synergies (Sterman, 2000).
Finally, the structure, behavior and outcome of policies or strategies must be analyzed, in
terms of which parameter values, variables and links have to be removed, varied and/or
added in order to improve (i.e. change) the problematic behavior of the situation.
4.3.8 Phase 8: Proposed Changes and Action to Improve the Problem Situation (In
Real World)
Once a proper balance has been found among both cycles, where the full trusted models
(conceptual and simulation) and the well analyzed policies, strategies and scenarios would be
arose, in the final phase the ultimate changes must be chosen and readied to implement for
improving problem situation.
26
Checkland (1999) argued three kinds of changes: making changes to structures;
changing processes or procedures; and changing attitudes. Structural changes are changes
made to those parts of reality which in the short term, in the on-going run of things, do not
change. Procedural changes are changes to the dynamic elements. Changes in attitude
includes such things as changes in influence, and changes in the expectations which people
have of the behavior appropriate to various roles, as well as changes in the readiness to rate
certain kinds of behavior good or bad relative to others. Implementation often involves
reversing deeply embedded policies and strongly held emotional beliefs (Forrester 1994).
The purpose of this phase is to make an environment to debate about changes (any or all
of the three kinds) to define changes which meet two criteria systematically desirable and
culturally feasible as SSM presented. It is possible to provide the leaning laboratory, like to
scientific environment, with developing a “Microworld” (Manni & Cavana, 2007) or
“Management Flight Simulator” (Sterman, 2000) for people in problematic situation, or at
least for those having authority of influence, who care about the perceived problem and want
to do something about it. This involves adding necessary features (i.e. from computer
software) to convert the simulation model into an interactive and user-friendly microworld
(Cavana & Maani, 2010). To be clear and understandable, this laboratory can provide a series
of diagrams of behavior for discussing results and insights of the study and the reasons for the
proposed changes.
Done this, changes are ready to implement in the real world. The possible courses of
action to improve the situation that is proposed by different assumedly feasible and desirable
changes obtained within an accommodation among worldviews. That is to say, it is a version
of the situation which different people with different worldviews could nevertheless live with
(Chekland & Poulter, 2010). The implementation step is therefore, centrally concerned with
transforming the specification to make it convenient to execute. Although Implementation of
intervention strategy is the final activity, systems thinking practice does not end here.
CONCLUSIONS ????
Summarised the proposed methodology: It takes into account
SSM, SSDM, Lane &Oliva and Econometric modeling tools?
27
What is the strength of the methodology over other system-based
methodology specifically SSDM and methodology by Lane and
Oliva?
I accept this chapter as initial stage. This is not the final version for chapter
4. The final version must take into account your experience in using the
methodology in analyzing the ICT Impact Dynamics of Iran Economy. Your
experience in using the methodology in analyzing data of Iran ICT impact
dynamics will help you to fine tune the chapter.
Please plan for chapter 5 : The ICT Industry of Iran
Chapter 6: Analysing ICT data of Iran using the proposed
Methodology and findings of data analysis. Show how you conduct every phase
of your proposed methodology using Iran Data. Show what ever you claim that
your proposed methodology can do in the case of IRan?
Show how it can relate ICT impact to economy , social and environmental
objectives and what are the results. Show the results differ from conventional
econometrics?
I think you have to restructure your chapter 4 in tune to methodology
specific to analyse ICT impact dynamics . Your existing chapter 4 is too
general, and difficult to proof. Your proof is just analyzing ict impact dynamics
of Iran?? So make your proposed methodology specific to analysing ict impact
dynamics.
Name your proposed methodology:
DEVELOPMENT OF A SYSTEM THINKING AND MODELLING
PROCESS FOR ANALYSING ICT IMPACT DYNAMICS

28
OR
DEVELOPMENT OF PROPOSED METHODOLOGY FOR ICT
IMPACT DYNAMICS ANALYSIS
(Checkland, P. & Poulter, J. (2006). Learning for Action: A Short Definitive Account of Soft Systems Methodology and its use for Practitioners, Teachers and Students, p. 3).
.(Ekasingh, B. and R. Letcher (2008). "Successes and failures to embed socioeconomic dimensions in integrated natural resource management modeling: Lessons from Thailand." Mathematics and Computers in Simulation 7)

29
Bennetts, P.D.C.,Wood-Harper, A.T., Mills, S.: ‘An holistic approach to the management of information systems development – a view using a soft systems approach and multiple viewpoints’, Syst. Pract. Action. Res., 2000, 13, (2), pp. 189–205
Platt, A. and S. Warwick (1995). "Review of soft systems methodology." Industrial Management & Data Systems 95(4): 19-21.
Rosenhead, J. (Ed.), Rational Analysis of a Problematic World, Wiley, Chichester, 1989.
Forrester JW (2003) Dynamic models of economic systems and industrial organizations. Syst Dyn Rev 19:331–345
Forrester, J. W. 1961. Industrial dynamics. New York: John Wiley & Sons, Inc.][Forrester, J. W. 1989. The Beginning of System Dynamics, Cambridge, MA: Banquet Talk at the international meeting of the System Dynamics Society ]
Barlas Y (2002) System Dynamics: Systemic Feedback Modeling for Policy Analysis. In: Knowledge for Sustainable Development, an Insight into the Encyclopedia of Life Support Systems, vol 1. UNESCO‐EOLSS, Oxford, pp 1131–1175
Coyle RG (1996) System Dynamics Modelling: A Practical Approach. Chapman and Hall, London
Ford A (1999) Modeling the Environment: An Introduction to System Dynamics Modeling of Environmental Systems. Island Press, Washington, DC
Maani KE, Cavana RY (2007) Systems Thinking, System Dynamics: Managing Change and Complexity. Pearson Education (NZ) Ltd, Auckland
Morecroft J (2007) Strategic Modelling and Business Dynamics: A Feedback Systems Approach. Wiley, West Sussex

30
Richardson GP (1991) System Dynamics: Simulation for Policy Analysis from a Feedback Perspective. In: Fishwick P, Luker P (eds) Qualitative Simulation Modeling and Analysis. Springer, New York 70.
Richardson GP (1996) System Dynamics. In: Gass S, Harris C (eds) Encyclopedia of Operations Research and Management Science. Kluwer Academic Publishers, Norwell
Richardson G, Pugh J (1981) Introduction to System Dynamics Modeling. Pegasus Communications, Waltham
Roberts N, Andersen DF, Deal RM, Grant MS, Schaffer WA (1983) Introduction to Computer Simulation: a System Dynamics Modeling Approach. Addison Wesley, Reading
Warren K (2002) Competitive Strategy Dynamics. Wiley, Chichester
Qudrat-Ullah, H., J. M. Spector, P. I. Davidsen. (2008). Complex Decision Making: Theory and Practice, Springer.
Also available in: ‘Complex Systems in Finance & Econ- ometrics’, Springer, NY, 2010
Camilo Olaya. 2009. System Dynamics Philosophical Background and Underpinnings, Encyclopedia of Complexity and Systems Science

31
Midgley - G., ‘The Ideal of Unity and the Practice of Pluralism in Systems Science’, pp. 25 - 36. In R. L. Flood & N. R. A. Romm (eds.), Critical Systems Thinking: Current Research and Practice, New YO::^: Plenum Press, 1996.]
Sardiwal, Sangeeta 2010 A Systems Thinking Approach To Investigating Delayed Discharges In The UK , The 28th International Conference of the System Dynamics Society July 25 – 29, 2010 --- Seoul, Korea
Checkland, P., & Poulter, J. (2010). Soft systems methodology. In M. Reynolds & S.
Holwell (Eds.),Systems approaches to managing change: A practical guide (pp. 191–242).
London: Springer.
Checkland, P (1999) Systems Thinking, Systems Practice : a 30 year retrospective. Chichester: Wiley.}
Rego, J. C. ,1999 After 40 years, has System Dynamics changed? National Research Council of the Argentine Republic. Buenos Argentina
Forrester JW (1961) Industrial Dynamics. Press MIT, Cambridge
[P.B. Checkland, J. Scholes, Soft Systems Methodology in Action, John Wiley & Sons Ltd, Chichester, England, 1990.,
Schwaninger M. (1996a): Integrative Systems Methodology: Framework and Application. Discussion Paper no. 22. St. Gallen: Institute of Management of the University of St. Gallen.