_thesis of Dairy Industry Design
348
Conceptual Methodology for the Design of Dairy Processes A Thesis Presented in Fulfilment of the Requirements of the Degree of Doctor of Philosophy Department of Chemical and Process Engineering University of Canterbury, Christchurch, New Zealand Nohemi Quispe-Chavez 2004
-
Upload
audrey-patrick-kalla -
Category
Documents
-
view
50 -
download
6
Transcript of _thesis of Dairy Industry Design
Conceptual Methodology
for the Design of Dairy Processes
A Thesis Presented in Fulfilment of the Requirements
of the Degree of Doctor of Philosophy
Department of Chemical and Process Engineering
University of Canterbury,
Christchurch, New Zealand
Nohemi Quispe-Chavez
2004
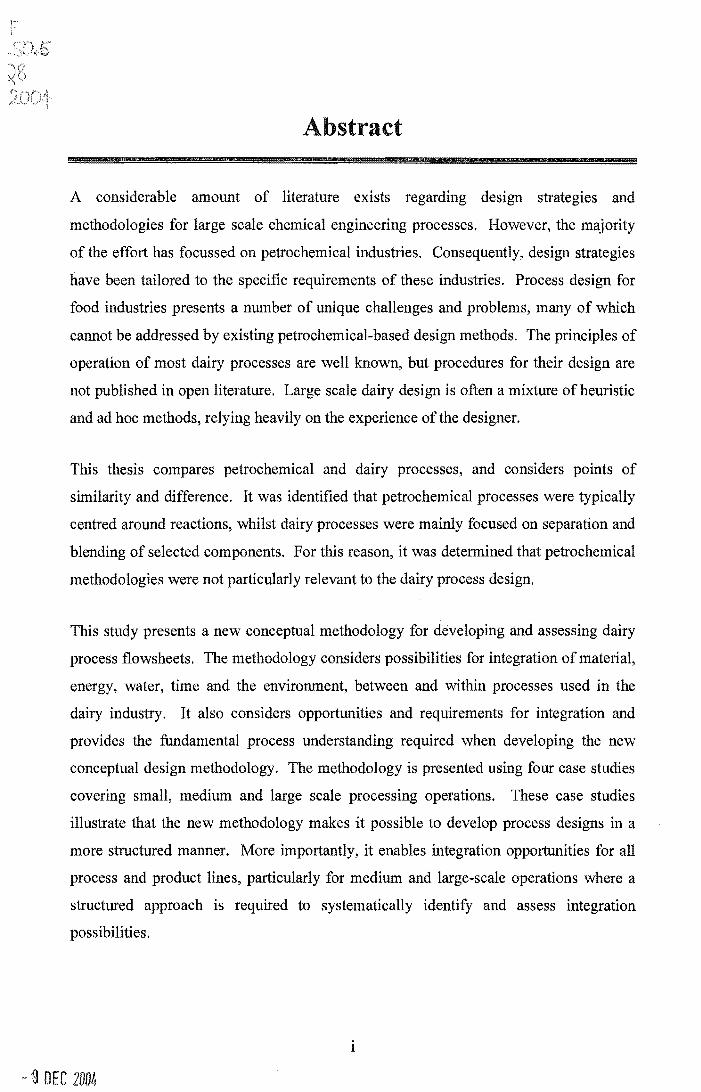
Abstract
A considerable amount of literature exists regarding design strategies and
methodologies for large scale chemical engineering processes. However, the majority
of the effort has focussed on petrochemical industries. Consequently, design strategies
have been tailored to the specific requirements of these industries. Process design for
food industries presents a number of unique challenges and problems, many of which
cannot be addressed by existing petrochemical-based design methods. The principles of
operation of most dairy processes are well known, but procedures for their design are
not published in open literature. Large scale dairy design is often a mixture of heuristic
and ad hoc methods, relying heavily on the experience of the designer.
This thesis compares petrochemical and dairy processes, and considers points of
similarity and difference. It was identified that petrochemical processes were typically
centred around reactions, whilst dairy processes were mainly focused on separation and
blending of selected components. For this reason, it was determined that petrochemical
methodologies were not particularly relevant to the dairy process design.
This study presents a new conceptual methodology for developing and assessing dairy
process flowsheets. The methodology considers possibilities for integration of material,
energy, water, time and the environment, between and within processes used in the
dairy industry. It also considers opportunities and requirements for integration and
provides the fundamental process understanding required when developing the new
conceptual design methodology. The methodology is presented using four case studies
covering small, medium and large scale processing operations. These case studies
illustrate that the new methodology makes it possible to develop process designs in a
more structured manner. More importantly, it enables integration opportunities for all
process and product lines, particularly for medium and large-scale operations where a
structured approach is required to systematically identify and assess integration
possibilities.
- g DEC 2DD4

This thesis lays the foundation for dairy process design by introducing the evolution of
conceptual process synthesis using a top-down framework to complement subsequent
detailed design when required. This methodology represents a significant improvement
over the current methods available for chemical process design in the dairy industry.
11
Acknowledgments
The author takes great pleasure in acknowledging the contribution during the course of
this research of the many people who have made this research possible.
I would like to thank my supervisor, Dr. Ken Morison, for his guidance and support as a
willing and very insightful advisor during the course of this research. Dr. Ken Morison
has always been very supportive and encouraging towards this work. I would also like
to express my gratitude to Dr. Pat Jordan for the encouraging words that he always had
forme.
I am also deeply indebted in particular to Gordon Maxwell Burrowes who has been very
supportive during these years of settling into a new country and experiencing a whole
different world.
I would like to express my deepest thanks to my husband, Jose-Antonio Castro-Macias,
whose care, support and faith have helped me through stressful times.
Special thanks are extended to Tristan and Angela Hunter, MichaelHii, Mike Hedley,
and Robyn Alcanzare for their tremendous support in terms of academic discussion and
invaluable friendship during these years and for the good times and for being good
colleagues and friends. My thanks go to all the friends and colleagues who I have not
mentioned, but without whom I would not have got this far.
Last but absolutely not least, I would like to express my deep gratitude to my parents,
Rosalvina-Lucrecia Chavez de Quispe and Juan-Gualberto Quispe-Aucca, for their
never ending care and love. In spite of the distance, they always encouraged me toward
the completion of this thesis. They understand that sometimes you have to leave the
shore to see other oceans. This was the most rewarding and satisfying task that I
undertook at university.
111
Table of Contents
Abstract
Acknowledgments
Chapter 1: Introduction
1.1 Overview of Design
1.2 Dairy Industry Background and Historical Dairy Process Design ............ .
1.3 Attributes of Dairy Process Design .......................................................... ..
1.4 Aims of this Work .................................................................................... .
1.5 Outline of Thesis ...................................................................................... .
1.6 The Contribution of This Thesis ................................................................ .
Chapter 2: General Aspects of Process Design
2.1 Chemical Process Design .................................................................. .
2.1.1 Process of Design ...................................................................... .
2.1.2 Conceptual Process Design
2.1.3 Chemical Engineering Process Design .................................... ..
2.1.4 Smith (1995) Methodology ........................................................ .
I
111
1-1
1-2
1-3
1-5
1-6
1-7
2-1
2-2
2-4
2-6
2-8
2.2 Review of Methodologies for Conceptual :r;>esign ................ "................ 2-10
2.2.1 Douglas (1988) Methodology.................................................... 2-10
2.2.2 Shigley & Mischke (2001) Methodology.................................... 2-12
2.3 Design Management .............................................................................. 2-14
2.3.1 The Management of Design Process .......................................... 2-15
Chapter 3: General Aspects of Dairy Process Design
3.1 Dairy Process Design ............................................................................. 3-1
3.2 The Perspective of Methodologies for Design Dairy Processes ............. 3-3
3.3
3.4
Process Definitions
Art, Science, Technology, Engineering and Process Design in the
Dairy Industry ......................................................................................... .
3.5 Raw Material Supply and Characteristics
3.6 Product Safety and Fouling
IV
3-3
3-6
3-8
3-10
3.7 Batch, Semi-continuous or Continuous Processing ............................... 3-11
3.8 Other Significant Aspects for Conceptual Dairy Design ....................... 3-13
3.8.1 Environmental Factors in Dairy Process Design 3-13
3.8.2 Site Location and Limitation ...................................................... 3-13
3.8.3 The Management of Process Design in the Dairy Industry 3-14
3.9 Summary 3-19
Chapter 4: Unit Operations in the Dairy Industry from a Process
Point of View
4.1 Heat Transfer Operations ..................................................................... 4-2
4.2
4.1.1 Overview...................................................................................... 4-2
4.1.2 Direct Heating and Cooling
4.1.3 Indirect Heating and Cooling
4.1.4 Heat Treatment for Pathogen Control
Separations
4.2.1 Filtration
4.2.1.1 Dead-end Filtration
4.2.1.2 Cross-flow Filtration
4.2.2 Centrifugal Separations
4-3
4-5
4-8
4-15
4-16
4-17
4-18
4-31
4.2.3 Evaporation ............................................................ ...................... 4-33
4.2.4 Drying ........................................................................................... 4-38
4.2.5 Ion Exchange
4.2.6 Crystallisation
4-42
4-44
4.2.7 Precipitation ........................................................ .......................... 4-45
4.2.8 Reverse Micellar Separation ........................................................ 4-45
4.3 Mixing or Blending ............................................................................... 4-46
4.4 Homogenisation Special Case of Size Reduction
4.5
4.6
4.7
Reaction
Storage
Packaging
4.7.1 Product Characteristics on Packaging
4-47
4-48
4-49
4-50
4-51
4.8 Other Emerging Processes for Pathogen Control................................ 4-53
4.8.1 High Pressure ............................................................................... 4-53
v
4.9
4.8.2 Ultraviolet Light
4.8.3 Electromagnetic Radiation
4.8.4 Electron and Gamma Rays
Mass Balances in Dairy Processes
4.9.1 Guide to Mass Balance Rules
4-54
4-54
4-55
4-56
4-57
4.9.2 Mass Balance Guidelines for Different Unit Operations 4-58
4.9.3 Mass Balance Rules for Different Products .............................. 4-61
4.10 Economics Analysis in Dairy Processes 4-62
Chapter 5: Dairy Industry Processes from a Product Point of View
5.1 Dairy Products .................................................................................... 5-1
5.2 Production of Liquid Milk ................................................................. 5-4
5.3
5.4
5.2.1 Liquid Milk Process ................................................................ 5-6
5.2.2 Production Requirement and Constraints
Production of Fermented Liquid Milk Products ............................... ..
5.3 .1 Yoghurt Process ...................................................................... ..
5.3.2 Sour Cream Process
5.3.3 Production Requirements and Constraints ............................... .
Production of Fat-based Products .................................................... ..
5.4.1 Cream Process
5.4.2 Butter Process
5.4.2.1 Fritz Butter Process
5.4.2.2 Ammix Butter Process
5.4.3 Anhydrous Milk Fat (AMP) Process
5.4.4 Fractionated Milk Fat Process
5.4.5 Phospholipids Fat Fractions Process
5.4.6 Spreads with Vegetable Oils Process
5-7
5-8
5-8
5-10
5-11
5-11
5-14
5-15
5-15
5-17
5-18
5-20
5-22
5-22
5.4.7 Production Requirements and Constraints ................................ 5-23
5.5 Production of Milk Powders ............................................................... 5-24
5.5.1 Milk Powder Process ................................................................. 5-24
5.5.2 Production Requirements and Constraints ................................ 5-26
5.5.3 Special Powders ........................................................................ 5-27
5.5.3.1 Cheese Powder Process
vi

5.6
5.7
5.8
5.9
5.5.3.2 Baby Formula Process
Production of Casein
5.6.1 Casein Process
5.6.2 Caseinate Process ................................................................. .
5.6.2.1 ~-Casein Fraction Process ., ............................................. ..
Production of Cheese
5.7.1 Cheese Making Process
5.7.2 Production Requirements and Constraints .............................. .
Production of Whey Protein Products ............................................... .
5-28
5-30
5-31
5-34
5-36
5-37
5-39
5-40
5-41
5.8.1 Whey Products Processes ......................................................... 5-42
5.8.2 Whey Protein Concentrate (WPC) Process ............................... 5-43
5.8.3 Whey Protein Isolates (WPI) Process ....................................... 5-44
5.8.4 Special Whey Proteins
5.8.4.1 Lactoferrin Process
5.8.4.2 a-Lactalbumim Protein Fraction Process
5.8.5 Production Requirements and Constraints
Production of Lactose
5.9.1 Lactose Process
5.9.2 Products from Lactose
5-45
5-46
5-47
5-48
5-48
5-49
5-51
5.9.3 Production Requirements and Constraints ................................ 5-51
5.9.4 Hydrolysed Lactose ...................................................................... 5-51
5.9.5 Production of Ethanol 5-52
Chapter 6: Integration based design
6.1 Definition of Process Integration 6-1
6-3
6-3
6.2 Types of Process Integration
6.2.1 Integration "within" an Operation
6.2.2 Integration "within" a Process ................................................... 6-3
6.2.3 Integration "between" Processes (same site) ............................. 6-4
6.2.4 Integration "between" Sites 6-5
6.2.5 Integration "between" Dairy Processing and Other Activities 6-5
6.3 Application Areas for Process Integration
6.3.1 Product and Component Integration
vii
6-6
6-6

6.3.2 Energy Integration in Dairy Industry
6.3.2.1 Energy for Dairy Processing
6.3.3 Water Integration for Dairy Processing
6.3.3.1 Water Uses in Dairy Industry
6.3.3.2 Constraints on Water Reuse
6.3.3.3 Water Component Integration
6.3.304 Examples of Water Integration
6-7
6-10
6-12
6-13
6-14
6-15
6-16
6.3.4 Time Integration ........................................................................ 6-18
6.304.1 Design for "Schedule Ability" ........................................ 6-19
6.3.5 Clean-in-Place Integration
6.3.6 Environmental Integration
6.3.6.1 Emissions Control for Good Process Design
6-20
6-21
6-22
604 Dairy Requirements and Limitations on Process Integration ................ 6-23
6.5
604.1 Differences from Petrochemical Methodologies .......................... 6-23
604.2 Similarities to Petrochemical Methodologies
Effect of Scale on Economics of Integration
6.5.1 Small Scale Dairy Process Industry
6.5.2 Medium and Large Scale Dairy Process Industry
6-24
6-25
6-26
6-27
Chapter 7: Conceptual Design Methodology of Dairy Processes
7.1 Introduction ............................................................................................ 7-1
7.2 Conceptual Design Methodology of Dairy Processing ......................... 7-2
7.3
704
7.2.1 Key Process Operation
Dairy Process Design Methodology
Dairy Process Design Methodology Case Studies ............................... ..
704.1 Small Scale Milk Processing .................................................... ..
704.1.1 Case Study One: Very Small Scale Milk Processing .... ..
704.1.2 Case Study Two: Small Scale Milk Processing
704.2 Medium Scale Milk Processing ................................................ ..
704.2.1 Case Study Three: Medium Scale Milk Processing ......... .
704.3 Large Scale Milk Processing
704.3.1 Case Study Four: Large Scale Milk Processing
viii
7-4
7-6
7-11
7-11
7-13
7-16
7-33
7-33
7-59
7-59

Chapter 8 Conclusions .............................................. ......... ...................... 8-1
References ..................................................................................................... 9-1
APPENDICES
A Case Study Two: Small Scale Milk
Processing (Packed Cottage Cheese)
Case Study Three: Medium Scale Milk B
C
Processing (Packed Casein Powder)
Case Study Four: Large Scale Milk
Processing (Packed Whole Milk Powder)
ix
A 1 A 7
BIB 26
CI-Cll

1 Introduction
1.1 Overview of Design
Design is the focal point of chemical engineering practice, but is far more than the
development of a set of specifications for a new chemical plant. Design is that creative
activity through which engineers continuously improve the operation of facilities to
create products that enhance the quality of life (Turton et at., 1998). Design typically
starts as an ill-posed problem to be resolved; the first activity is to establish the goals
and tests, establish starting points and define the design space. For example, the
purposes of chemical processes are to create the highest return on investment, in a safe
and flexible process. Tests are used to evaluate and compare design alternatives before
the final decision is made. There is also a need to define where to start the design,
whether to base it on an existing one, or start from scratch. In addition, it is necessary
to define the design space. The design space is defined as the set of all alternative
process designs but it keeps changing as technological advances give more available
alternatives (Westerberg et at., 1997). The space of design alternatives is very large and
continually changing (Laing & Fraga, 1997; Westerberg et at., 1997). Design is
difficult because problems tend to be open-ended; designers do not always have
complete information and need to make complex decisions (Biegler et at., 1997).
Design generally is initiated by ideas from almost anywhere. For example, a customer
might need a material with properties not available in any product currently on the
market or the company may want the engineers to come up with a process whereby the
surplus feedstock the company is currently producing can be used (Biegler et at., 1997).
There is a number of traditional process design methods available in the literature and
most of them focused on the reactor as the first stage (Douglas, 1988; Smith, 1995; Wall
et at., 2000). Some of these traditional process design methods are examined for their
applicability in dairy process design in Chapter 2.
1-1

1.2 Dairy Industry Background and Historical Dairy Process Design
Since European settlement, the New Zealand bush has given way to grass as feed for
animals. Family cows produced milk for the settlers' families and the surplus was sold,
initially as butter and later as liquid milk and cheese.
Until the 1 960s, the cheese making throughout the world was a highly labour intensive
art. Since then New Zealand scientists have contributed greatly to the understanding of
the chemistry and biochemistry of the process, and through mechanisation have
transformed cheese-making into a reliable and profitable industry.
As the scale of the industry increased, from cottage industry to medium and larger scale
plants, a factor of economy appeared. Complex operations, product control, production
capacity, and the need to scale up, all required the knowledge of chemical engineers.
Waste minimisation also became an important issue.
Eventually it was recognised that many of the dairy industry's problems are unique and
that other industries' solutions to apparently similar design problems might not work in
this industry, or vice versa. Further the design needs vary from region to region.
The growth of milk production, industrial .structures and processing operations have
changed from chemical engineers providing a service to many small companies with a
variety of problems, to in-house operations, where specialist engineers tackle the
concerns of the industry as a whole. The production of dairy products is carried out on
a variety of scales throughout the world. Design challenges and requirements differ
depending on the scale of the operation.
Process integration is a relatively new area for engineering design methodology. Until
recently, engineers developed conceptual process designs by experience and intuition
without using methodology (Linnhoff et at., 1994). Process integration is carefully
considered in this study (see Chapter 6). Therefore, the design for this research will
start with a household batch process, and from there move to a small scale process
operation in the Andes of Peru (Pucyura), then to the medium scale on a small site in
South America (Lima), and finally to the large scale process in New Zealand. The
1-2

research will identify opportunities in each case, according to the location of the process
design and the raw milk capacity.
The chemical engineering design approach demands that the design of dairy processes
includes all the disciplines of chemical engineering such as thermodynamics, physics,
chemistry, thermal and mass transfer, and fluids. Science frequently needs to draw on
biochemistry and microbiology, as well as purely chemical and physical aspects.
1.3 Attributes of Dairy Process Design
Milk provides a good model in the food industry because most of the requirements of
dairy processing overlap with general food processing such as food safety, supply
volume based processing, the enrichment or deployment of its composition, the
tendency to depend on some off-the-shelf equipment. Therefore, the design
methodology for the dairy process offers a good model case study to compare with other
branches of food processing.
Chemical engineers want the process to be safe, flexible, operational, economical and
environmentally friendly. The dairy industry has specific design demands of
engineering and formality in engineering design as follows:
Food safety
• If not handled properly milk can present a potential high risk to human health
because it provides an ideal environment for the growth of pathogenic
organisms.
• There is pressure to deliver a product on time to avoid spoilage.
In the case of milk, meat, fruit and many vegetable raw materials, it is an absolute
requirement that products reach the market in a safe condition (Sharma et al., 2000).
Under this circumstance it is desirable to select the formulation that provides market
satisfaction while meeting product and process constraints, and fulfilling safety
requirements.
1-3

The specific food safety requirements for dairy process design are systems that ensure
the hygiene of both plant and product. Food safety and product hygiene require regular
clean-in-place (CIP) which involves periodic shut-down of the equipment. Therefore,
scheduling is needed to coordinate these requirements effectively.
Profit
The purpose of a design methodology for the dairy industry is to create the best return
for farmers (shareholders) in the use of their land and investment, maximising long-term
income and profit to shareholders. The design objective is to process the milk and
maximise return to the farmer by selecting the right equipment ,and process options. A
number of issues arise here including:
1/1 Farmers must make a living from the land, producing milk or there is no raw
material.
1/1 Shareholders demand return on capital.
" The profit depends on the chosen product mix of the processes and on the
demands of the market.
• There are reduced profit margins for some products, for example, for drinking
milk.
• Cost of production depend on the capital cost of the plant, operating costs.
• Extra costs are involved because of the need for plant and product hygiene
Environment
Milk processing presents several challenges to the chemical engineer. Because the raw
material is perishable, the milk can not be stockpiled, nor can it be dumped into the
environment because of its high biological oxygen demand (BOD) (Bloore, 2001). This
places great importance on timely processing and plant reliability.
CD Pressures to reduce the environmental impact of milk processing are increasing.
1-4
.. Chemical engineers want the process to be environmentally friendly.
Milk Supply
Dairy process design also needs to take into account complex biological feedstock
variability of the composition and physical properties of milk components. The
seasonal variability of milk volumes on the processing operations is dictated by farmers,
not customers, and this too is an important factor when considering design.
Many foods consist of a mixture of ingredients that must be blended together to meet
product specifications. Levels of fat, protein, water and other ingredients are generally
taken into account. Milk already has a mixture of those ingredients which makes it a
nutritionally complete food.
1.4 Aims of This Work
This work aims to bring dairy design methodology up to the standards of chemical
process design at a conceptual design level. A top down approach is employed to
provide a framework for subsequent detailed design. The developed methodology
considers different scales of dairy process operations.
The present study represents a timely and appropdate topic for evaluation in the light of
the call for higher productivity and quality in the dairy process industry. Apart from
examining how milk components resources may be better integrated to enhance the
productivity levels in the dairy industry, the study is also a pioneering investigation into
the conceptual methodology for the design of dairy processes. It draws together the
available literature and study in the manufacturing industry and enhances the current
understanding of dairy components for the dairy process industry.
In addition, this study will provide decision-makers and chemical engineers with a
powerful tool in the design of a dairy process industry. A full appreciation of the
importance of design methodologies and the factors which are pertinent for its
successful application will potentially increase the efficiency and effectiveness of the
dairy industry. For some dairy processing companies, it may even enhance their
1-5

competitive edge over others.
Many specific factors must be considered at the conceptual process design stage. No
methodology currently exists for including these considerations in a conceptual process
design; its development constitutes a significant research opportunity.
1.5 Outline of Thesis
Design methodologies for the chemical process industry are reviewed in Chapter 2.
Several significant differences and their main design implications are described in
Chapter 3.
Unit operations typically used and the relevant applications in the dairy industry are
reviewed in Chapter 4. Chapter 5 examines the typical production methods for different
products derived from milk in the dairy processes.
In Chapter 6, simplified examples of integration are identified, between and within
processes in the same site and between sites. In Chapter 7 the synthesis methodology
for dairy process flowsheets is presented. This may permit chemical engineers to
develop a completely new approach to dairy process design. The physical, chemical
and biological phenomena must be understood to translate opportunities shown on the
different flowsheets into dairy process designs.
The challenges are to find relevant information, to recognise the key elements of that
information, and to apply those elements of the manufacture of desired products into an
integrated dairy process design method. The method developed is applied in four case
studies. These case studies show the design and development of process design
methodology.
The design methodology for the dairy process industry should ideally lead to innovative
designs.
1-6

1.6 The Contribution of This Thesis
The methodology, although it is deceptively short, is the distilled product of many
months of considerations, thoughts, synthesis and analysis of the design process. The
development of the methodology required a wide knowledge of dairy products, dairy
processes and design synthesis techniques. The methodology can generate a large
number of potential design options, some of which are clearly impractical, but others
challenge existing processes.
The first consideration can have a large number of potential design options. It is
believed that this thesis will be a stepping stone to more creative thinking on how to
design a dairy process. The main contribution of this thesis are:
• First known attempt of conceptual design of dairy processing or in factory food
processing.
• Creation of a framework for describing processes in terms of design objectives
and constraints rather than the more general "principles of" processes that often
give no useful design infonnation.
\9 Fonnalisation of most dairy processes in terms of design infonnation.
• Distillation of product infonnation to the essential information for a designer.
\9 Development of a methodology which uses the new concept of a key process
from which to synthesise a flowsheet.
For an experienced dairy process designer, the context of the thesis may seen
obvious. This is seen as an indication that this work has been successful in
extracting the essentials of design from the vast resource of available infonnation of
the principles of dairy processing.
1-7
2 General Aspects of Process Design
2.1 Chemical Process Design
The development of an optimal design solution to a specified problem requires a
significant amount of skill and effort from a designer. Chemical process design is
especially challenging because the number of possible flowsheet solutions is often
enormous. The identification, selection and development of the final flowsheet design
from a large number of alternatives are most efficiently achieved using a consistent
strategy.
A number of process design methodologies have been presented in the literature,
developed mainly from the petrochemical industries. Such methods represent the
obvious starting points for developing a conceptual design methodology for dairy
processes.
However, as noted in the previous chapter, there are a number of constraints and
requirements specific to food processing which are not encountered in the
petrochemical industries. The first part of this chapter reviews the main process design
philosophies and tools published in the literature. It provides general information on the
heuristics and hierarchy of the principles in the design processes. The primary design
requirements and constraints that exist in the dairy processing are then considered.
Finally, the conclusions on the applicability of the various methodologies to conceptual
dairy process design are presented. It is intended for this chapter to lay a foundation for
developing a specific dairy process design methodology in the later chapters.
This thesis focuses on the design process itself, specifically looking at methodologies
for generating optimal dairy processing flowsheets over a range of scales, from single
cow farm milk production through to the largest international processing sites.
2-1
2.1.1 Process of Design
Process design is an ill-posed posed problem with multiple, conflicting goals; a process
must deliver high levels of safety and efficiency at minimal capital cost. The final
"optimal" solution will provide the best combination of compromises or decisions that
satisfy the original project goals (Ray & Sneesby, 1998). To achieve this, the designer
must first generate or identify a set of feasible candidate flowsheets. Once this is done,
a ranking strategy is applied to determine the most suitable option from which to
generate the final design. This is usually an evolutionary process which iterates
between the generation and assessment of candidate flowsheets. Westerberg et al.
(1997) stated, that "design methodologies" play an important role aspect during this
process. However, companies today assign only a small percentage of the intellectual
capital they have at their disposal for the purpose of design processes (Westerberg et al.,
1997). Given the cost of poor design decisions and the increasing complexity of
process flowsheets, design methodologies are more important than ever.
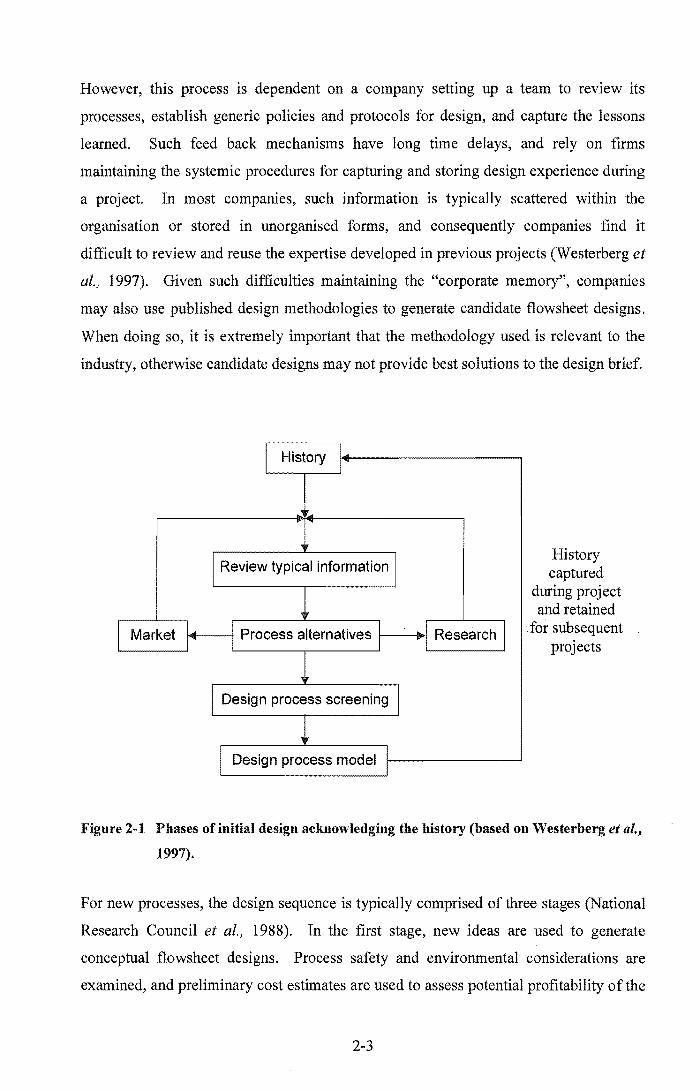
Figure 2-1 shows how a company should ideally capture and use history to improve the
design process and shows also information flow during the design process. Knowledge
from previous projects is typically used as the starting point for developing candidate
designs from the current project. For new processes, the designer may start with a
"proto-typical" design developed during the research and development stage. Many
new process designs are developed in response to market demand. These may be
generated by the need to fulfil customer requirements or by the identification of new
opportunities within existing processes. New design projects may be initiated by either
research developments or changes in market requirements (Westerberg et al., 1997).
The market imposes volume, cost and quality objectives for a product, derived from the
scale and nature of the customers' use. The market thus influences the raw material
selection, the choice of the process and the separation procedures used, as well as the
scale of the operations (Scott et al., 1992). For this reason, candidate flowsheets are
checked with the lead up to "feed-forward" modifications and predicted market demand.
Reviewing the project sometimes can lead to "feed-back" modifications (Westerberg et
al., 1997). Both "feed-forward" and "feed-back" mechanisms typically occur within a
specific design process, hence they operate in a relatively short time frame. At the
completion of the project, design experiences can be captured and use as the basis for
learning and reuse in subsequent design processes.
2-2
However, this process is dependent on a company setting up a team to review its
processes, establish generic policies and protocols for design, and capture the lessons
learned. Such feed back mechanisms have long time delays, and rely on firms
maintaining the systemic procedures for capturing and storing design experience during
a project. In most companies, such information is typically scattered within the
organisation or stored in unorganised forms, and consequently companies find it
difficult to review and reuse the expertise developed in previous projects (Westerberg et
al.) 1997). Given such difficulties maintaining the "corporate memory", companies
may also use published design methodologies to generate candidate flowsheet designs.
When doing so, it is extremely important that the methodology used is relevant to the
industry, otherwise candidate designs may not provide best solutions to the design brief.
I History L I~
I Review typical information I
I Market I 1 Process alternatives 1
I DeSign process screening I
I DeSign process model 1
,I Research I
History captured
during project and retained
for subsequent projects
Figure 2-1 Phases of initial design acknowledging the history (based on Westerberg et al.,
1997).
For new processes, the design sequence is typically comprised of three stages (National
Research Council et ai., 1988). In the first stage, new ideas are used to generate
conceptual flowsheet designs. Process safety and environmental considerations are
examined, and preliminary cost estimates are used to assess potential profitability of the
2-3

process. This stage is commonly referred to as "process synthesis" (Wai et al., 1996;
Biegler et al., 1997; Turton et al., 1998; Seider et al., 1999; Steffens et al., 1999,
Steffens et al., 2000b). In the second stage, one or more candidate flowsheets are
selected, then all significant process details are specified and rigorous design
calculations are carried out. The third and final stage involves detailed design, with the
preparation of engineering drawings and an equipment list required for construction.
Detailed process design is only carried out for the final "optimal" flowsheet selected for
construction.
2.1.2 Conceptual Process Design
Conceptual process design :bas been defined by Nishida & Stephanopoulos (1981) as
"an act of determining the optimal interconnection of processing units as well as the
optimal type and design of the units within a process system". Douglas (1988) added
that "the goal of a conceptual design is to find the best process flowsheet (i.e. to select
the process units and the interconnections among these units) and estimate the optimum
design conditions". Identifying a small set of candidate process flowsheets is a daunting
task given the huge number of possible design concepts. For this reason, it is important
to use a design methodology to efficiently generate and identify a set of realistic
flowsheets that are likely to best fulfil the design brief.
However, Sinnott (2000) observes, "when considering possible ways of achieving the
objective the designer will be constrained by many factors, which will narrow down the
possible designs". Through the conceptual design activities, the solutions are generated,
selected and evaluated. This is not a trivial problem because there are often dozens or
even hundreds of flowsheet possibilities to be assessed against the specified project
requirements and constraints. The output produced by these activities is a design
concept (Hales, 2000; Pahl & Beitz, 1996).
The use of design methodologies for generating process flowsheets, in conjunction with
numerical methods for assessment and ranking, form a powerful base for conceptual
process design (Linnhoff et al., 1994). Design methodologies must enable the
integration of a diverse range of process requirements and constraints including:
II Minimisation of capital,
• Low operating costs,
2-4

• Production flexibility,
• Reliability,
• Worker safety,
• Good controllability,
• Environmental protection and safety,
• Societal expectations.
Since many of these requirements are often contradictory, flowsheet development
requires considerable compromise and trade-off (Grossman et at., 1983). As an
example, process controllability and flexibility can be improved through the provision
of additional storage of the intermediate products. However, this may be contradictory
to the capital cost minimisation objectives. For hazardous or perishable materials,
increased inventory introduces additional environmental safety or health risks.
A design brief has similarities with a mathematical optimisation, having one or more
objectives and being subject to various constraints. However, process design cannot be
considered the same as scientific or mathematical problems which have a single solution
or "correct answer". This is primarily because the design problem is ill-defined, with
missing or uncertaiti information, and constraints that cannot always be clearly
quantified. It is the role of the designer to interpret the available information and
specified constraints, in order to generate and select viable flowsheets. Many of the
required decisions are made based on experience and heuristics. Such decisions require
a degree of risk management, since it is necessary to assess the relative uncertainty in
each piece of information (known or estimated), and its significance relative to the
design objective(s) and constraints.
In many situations, the process requirements change over time from those initially
specified in the design brief. Many petrochemical installations are expected to have a
lifetime of decades. During this time it is likely that process will be modified as
production, market and environmental demands change. This further complicates the
design process, since possible changes in available technology, societal expectations
and product specifications must somehow be the interpreted by the designer. It is this
requirement for designer input and judgement that distinguishes the design process from
a numerical optimisation.
2-5

2.1.3 Chemical Engineering Process Design
In chemical engineering, the design objective is to create a new flowsheet or modify an
existing one to be capable of manufacturing a desired chemical (Westerberg et al.,
1997). By rethinking the development activity and using qualitative process models, it
is possible to identify efficient and innovative process options without excessive
experimental data (Sadr-Kazemi et al.; 2000, Westerberg, 1999).
The design work required in the chemical manufacturing process is divided into two
broad phases according to Sinnott (2000). The first phase design covers the steps from
the initial selection of the process to be used. These include the selection, specification,
design of equipment and the piping and instrumentation diagram (P&ID). Chemical
engineers generally do this. The second phase covers the detailed mechanical design of
the equipment. The structural design, civil design, electrical design, and the
specification of the ancillary services responsibilities, will be carried out by other
engineering disciplines.
Modem strategies for the design of chemical processes have been developed based on
process design principles, and there has been an increasing introduction of computer
resources involving spreadsheets, mathematical packages such as ASPEN PLUS,
HYSYS, PRO-II, CHEM-CAD and FLOWTRAN, SPEEDUP, FORTRAN and
simulators as more data is obtained in many' cases; the material and energy balances are
performed at least in part by these computer-aided process simulators (Seider et al.,
1999; Herman et al., 1985). A strategy recommended by Seider et al. (1999) involves
assembling the process operation in a specific order. Table 2.1 shows the organised
process operation into a series of steps to eliminate the differences between streams in
the process. The aim is to reduce these differences until the stream that leaves the last
operation is identical to the required product. In chemical engineering literature, unit
operations equipment such as evaporators, filters, and centrifuges are all involved in one
or more of these eight basic operations (see Table 2.1) and the process synthesis step
involves the selection of processing operations to convert the raw material to products
Seider et al. (1999).
2-6

Table 2-1 Synthesis steps and the basic process operations (arranged from Seider et al.,
1999).
Synthesis step Basic process operations
1. Eliminate differences in molecular types 1. Chemical reaction
2. Distribute the chemicals by matching 2. Mixing
sources and sinks
3. Eliminate differences in composition 3. Separation of chemicals
4. Phase separation
4. Eliminate differences III temperature, 5. Change of temperature
pressure, and phase 6. Change of pressure
7. Change of phase
5. Integrate tasks; i.e., combine operations into 8. Mixing and splitting
unit processes. streams or batches.
of
In addition, Seider et al. (1999) show in Figure 2.2 how these parts are related to the
entire design process and to each other, starting with process invention, synthesis and
development of base case designs. Process design is rarely straightforward and it
originates in the exploration of research, the availability of inexpensive raw material or
the discovery of new markets.
Rather than discuss these steps in general, Seider et al. (1999) also discuss the concept
of a synthesis tree (see Figure 2.2), which visually represents base case flowsheet
development using the five synthesis steps. The synthesis tree suggests that flowsheet
design is a sequential process. Realistically, there will be iteration between various
tiers, particularly when process integration is carried out in both steps 2 and 5. The
authors suggest that the synthesis tree is closely related to heuristic or rules of thumb
typically used in design. Seider et al. (1999) describe them as they are applied to a
particular process.
2-7

This methodology has limited applicability to dairy process design, due to its focus on
chemical reactions, which are rarely carried out in dairy processing. If the fIrst step is
ignored, the methodology is reduced to matching chemical sources and sinks using
industry-based heuristics. In this form, the method differs little from current dairy
design practice,
Reaction Path ........ " ..... ,,' ......... ::::: •.. ::::::.::::::::.,, G"
Distribution of Chemicals
Separations
Temperature, Pressure and Phase Changes
Task Integration
, , I • t1 I, I, I ,
• t I I , I I
I , t \ . .,
f\ Il It I,
I \ I i I l I ,
I t I \ I \ I \
I \ I, I \ I \
I , I \
,;, .,;, . l\ 1\ I \ I, , \ I , I \ I , I \ I I , \ I t I \ I, t \ I I , \ I \ " .. . " t I t,
t , t ,
I ,
I I t , I ,
.; . /I I,
t , I I
I , t ,
I , I ,
t I
.; .
" 1\ , \ , I , \
t I t I I , , \ .. .
II I, t, I , , ,
t , I ,
I , I ,
,. . Figure 2-2 Iuverted synthesis tree heuristics (Seider et al., 1999).
2.1.4 Smith (1995) Methodology
According to Smith (1995), there are two approaches to designing a chemical process.
The fIrst approach follows the "onion logic". In this logic, the designer starts by
choosing the reactor if the process requires a reactor to transform the feed into a
product. The designer then moves outwards by adding the separation and recycle
systems. This is followed by the heat exchanger network and the utilities, The layers of
the "onion diagram" shown in Figure 2-3 can represent this hierarchy symbolically, For
2-8

a process that does not require a reactor, the design will start with the separation
systems followed by the heat exchanger network and utilities.
The decisions at each layer must be made based on the information available at each
stage of the design. The equipment is added only if the addition can be justified
economically. In this methodology, distillation is recommended as one of the most
commonly used method for separating of homogeneous fluid mixtures in his process
design approach.
Utilities
Figure 2-3 The "onion model" of process design Smith (1995).
Smith (1995) leaves safety, health and the environment to the final stages of design.
Once a group of feasible flowsheets has been developed, he advocates reviewing the
base case designs to optimise the heating and cooling duties for the heat exchanger
network. Recovered heat can be used as an energy source for utilities within the plant,
but where this is insufficient, external utilities are required. This part of the design
problem can be clearly formulated mathematically and optimised subject to the
constraints, cost and profits associated with each unit.
2-9
From the perspective of dairy process design, this methodology is more applicable than
the methodology of Seider et al., (1999), since the "onion logic" remains useful for
systems with few chemical reactions. The emphasis on heat exchanger networks is also
useful, since heat recovery is generally considered to be important in dairy processing.
However, Smith (1995) does not address safety issues in an integrated manner within
the methodology. Product safety is a critical consideration in all food processing
industries, and the primary constraint on feasible flowsheet designs. Failure to include
this requirement in the initial design stages will allow many unfeasible flowsheets to
reach the screening stage (Figure 2-1).
2.2 Review of Methodologies for Conceptual Design
There are various methodologies for conceptual design available. Some methodologies
are described as follow.
2.2.1 Douglas (1988) Methodology
Douglas described the conceptual design of chemical processes by considering the
selection of petrochemical processes because they are the most common. He
emphasised conceptual design because the equipment and structure used in the process
flowsheet are fixed at this stage of the design activity. All other activities depend on the
results of the conceptual design.
Douglas's approach is heuristic, based on experience and understanding. He advocated
that the procedure of chemical process design can be considered in a hierarchical
context, where the process is broken down into a ranking of decisions at different levels.
The design method he proposed follows a top-down approach strategy, with very simple
solutions developed initially, followed by successive layers or levels of detail. This
strategy starts with the design alternative at the highest abstraction level, and then
structural refinements of the design are proposed at lower abstraction levels until a
design is described by unit operations. During this process, the designs that have the
highest expected profitability are refined first, and at every abstraction level, a
numerical model is used to describe the design. Thus, the continuous parameters are
quantified (Gavrila & Iedema, 1996).
2-10
Input information required for the conceptual process design is as follows (Douglas,
1988):
1. The reaction and reaction conditions
2. The desired production rate
3. The desired product purity, or information about the price versus purity
4. The raw materials and/or information about the price versus purity
5. Information of the rate of the reaction and the rate of catalyst deactivation
6. The processing constraints
7. Other plant and site data
8. Physical properties of all components
9. Information concerning the safety, toxicity, and the environmental impact of the
materials involved in the process
10. Cost data for by-products, equipment and utilities.
The hierarchical systematic procedure that Douglas uses to develop a conceptual
process design is described in three levels.
The first level focuses on the process flow diagram with the calculation of the
characteristic sizes of each operation. This enables the costing analysis, e.g. the rate of
evaporation for an evaporator. The second level is the detailed process design, normally
shown as the piping and instrument diagram (P&ID), with associated mass and energy
flows and the specifications for all equipment. The third level consists of the
mechanical design to enable the physical construction of the equipment.
The hierarchical approach advocated by Douglas is relevant to diary processing. It is
particularly useful since it breaks down a complex design problem into manageable
pieces. His methodology still allows heuristics to be used within the design process,
although he focussed on the reactor/reactions in the same manner as Seider et al. (1999).
Douglas' methodology has a disadvantage because his method is very rigorous,
requiring substantial amounts of detailed information. Some of this data may not be
available, or have a considerable amount of uncertainty. The other disadvantage is that
the actual process for generating the candidate flowsheets is not discussed.
2-11

2.2.2 Shigley & Mischke (2001) Methodology
The design methodology of Shigley & Mischke (2001) takes a more holistic approach
than other techniques. They claim that their design procedures enhances an
understanding of the interaction between product and process through:
• A concept generation,
• A concept formulation,
• A concept comparison and evaluation,
• A concept selection.
A design is always subject to certain constraints. Shigley & Mischke have described the
phases of design, beginning with recognising the need and making the decision to do
something about it. After many interactions, the process ends with the presentation of
the plan which will satisfY the need.
They argue that the first stage of design is to establish the need. According to Shigley
& Mischke there is a clear difference between the statement of the need and the
identification of the problem. They argue that a need is a requirement for opportunity
that usually goes unnoticed, until highlighted by somebody or some event. The
difference is that the need is often not apparent until a problem occurs, at which time it
may be much easier to recognise. The reco.gnition of the problem is usually triggered
by a particular adverse circumstance. A process design may be developed in response
to either a need, such as customer request, or a problem such as, the inability to meet
current processing requirements for capacity, quality, functionality or pollution.
It is important to identify the problem along with all relevant constraints and objectives.
Some constraints and requirements are easily quantifiable, such as:
• The processing capacity,
• The product specifications or characteristics,
• The project budget.
However, some other requirements or constraints are more qualitative and difficult to
define explicitly in the design process. Qualitative requirements or constraints can
include:
2-12

• Good controllability and operating flexibility,
• Minimal environmental impact and risk,
• A safe environment for workers,
• A design with good flexibility for new product types and future expansion.
There are two options for process design. The first option is to build on the existing
design. This approach provides the designer with a low risk starting point and a good
chance of identifying a feasible design solution. However, this approach can also
produce sub-optimal designs because it is based on the older superseded technology.
The second option is to start completely from scratch and use several alternatives as the
starting points. Either way, it is important to identify the starting point.
Identify the Space of Design Alternatives
Candidate flowsheets are . identified by establishing the properties and specific
characteristics of the raw material along with an assessment of the constraints on the
design, process, products, and environment. There are multiple iterations or feed back
loops between the phases of the design, the complete process from start to finish is often
outlined as shown in Figure 2-4. These loops may have to be traversed many times
until the concept is generated and the recognition of the need is defined.
This approach is very useful in order to obtain the best results, to increase efficiency,
and to make best use of the integration opportunities at each step of the conceptual
design. Proceeding in this manner, there is an advantage of being able to assess the
operability of a design because a review of the results at each step can be undertaken.
The methodology for conceptual design does not inhibit creativity during the process of
selection of concepts. Shigley and Mischke (2001) argue that the many feed back loops
in their methodology stimulates the emergence of new concepts and encourages the
integration opportunities at each step of the conceptual design. These phases are
unlikely to have emerged by any other means.
Dairy processing still allows heuristics to be used within the design process; heuristics
do not focus on the reactor/reactions in the same manner as the design methodology of
Seider et al. (1999). A disadvantage of this method is that it is very iterative, and may
2-13

be time consuming for a complex design. Another disadvantage is that the actual
process for generating the candidate flowsheets is not discussed .
.. ~I Recognition of need (aim) I
~ Concept generation of raw
~ material physical-chemical properties
~ -
~ Concept formulation of material and f-
~ process-product constraints. '---
~ Synthesis, alternatives and
integrate concept generation. ~
~ - Analysis and optimisation of the r--
~ entire process range
~ I Integration and evaluation I
~ I Methodology J
Figure 2-4 The phases of design of processes arranged from Shigley & Mischke (2001).
2.3 Design Management
The design processes in chemical engineering are difficult to support, particularly the
conceptual designs with respect to tool support in a collaborative design process.
Design management supports the coordination in the dynamics of the design process.
As it is often the case, success depends on a good management as well as a good
technology (Linnhoff, 1994).
Design management is the method to organise the design process better, and it is
gaining popularity within the design community (Baya & Leifer, 1996). Using design
2-14
management as a tool provides an understanding of the information handling behaviour
and helps to facilitate the design process. Design management is also a good tool to
build and support information driven processes. Information management in conceptual
design is the process of capturing and organising design information in such a manner
that it can retrieved and reused later (Baya & Leifer, 1996).
The design process is highly creative and many design alternatives are explored with
both unexpected and planned feed back occurring frequently. Therefore, it is inherently
difficult to manage the design processes (Nagl et ai., 2003). The design management of
multidisciplinary teams provides precise communication, effective use of available
design tools, appropriate application of materials, respect to the legacy of previous
designers to meet user expectations and the environmental constraints (Hales, 2000).
The management system covers products, activities and resources, and their mutual
relationships (Nagl et ai., 2003), in which many fundamental design alternatives are
explored and analysed.
2.3.1 The Management of Design Process
Hales (2000) considers the management of the design process as more than just carrying
out the obvious process design. He defines engineering design as the process of
converting the idea or the market need into the detailed information from which a
product or technical system can be produced. Despite the great advantages in
technology, computational tools, information transmission and human factors, many
designs still do not live up to user expectations or they fail in service for a variety of
reasons. A systematic analysis of the design process usually reveals the causes of the
failure.
Ten critical factors described by Hales are ones observed to have been the primary
contributors to failure in design. They are listed as follows.
1. Defining a problem
2. A working design team
3. The right tools for the job
4. Communicating effectively
5. Getting the concept right
2-15
6. Keeping it simple
7. Making the function clear
8. Tackling safety
9. Selecting materials and parts
10. Details in the design.
Westerberg et al. (1997) also proposes specific approaches that are centred on the
management of the available and derived information for the study and support of
design processes. They were researching how to carry out studies more effectively and
jointly with the industrial partners, and how to identifY the features they needed for
managing the information to study and improve the design processes. In the course of
their study, they made general observations on the effect of different individual
behaviour patterns within the design group and related this to the success of the design
process operations.
2-16

3 General Aspects of Dairy Process Design
3.1 Dairy Process Design
There are several significant differences between petrochemical and dairy processing.
These differences have considerable impact on the overall constraints, the objectives of
a design brief and subsequently the conceptual design process. The main differences
are described in the following sections, along with their design implications.
In the dairy process design, the initial information required is as follows:
1. Information concerning the raw material composition, safety, toxicity and
environmental impact of the material involved in the process
2. Volume of the raw material to be processed
3. Physical properties of all raw material components
4. The desired final products and production rate
5. Desired product purity or information about the prIce versus product
specification
6. The processing and product constraints
7. The waste that may cause environmental damage.
Comparison between petrochemical and dairy processes is shown in Table 3-1.
3-1

Table 3-1 Comparison between the petrochemical and dairy industry process approach.
Petrochemical approach Dairy approach
Impurities can be removed later. Pathogenic organisms have to be removed
initially (e.g., by pasteurisation).
Life time of the plant or of the resources The life time of the plant keeps growing
are limited by the sources. with increased raw material production.
Streams can be recycled any number of Recycling is limited by many constraints.
times. Recycling can increase physical or thermal
damage to the product. Recycling must be
avoided to prevent microbial growth.
The components do not suffer major The raw material must be handled carefully
damage while being handled. to conserve the components' properties.
Processes can run continuously. Some dairy industry processes must be
batch. Most will be semi-continuous.
Long lasting shelf life products. Short shelf life products.
Reaction time is important. Heat treatment holding time is important
because some components are heat
sensitive.
Process are designed to operate at a There are large seasonal changes in milk
constant throughput for long periods. supply volumes throughput during the
season.
Corrosion is an area of great concern, Fouling is a daily concern.
particularly atmospheric corrosion.
Some of the products are used directly, or Consumer food safety is critical.
indirectly as intermediate products by the Unhygienic products are unacceptable.
customer. Low grade products can still be
sold.
Continuous process with limited flexibility Need flexibility to produce products of
in process design. many different specifications.
Feed supply can be stopped. Feed supply from the cows cannot be
stopped and all must be processed.
3-2

3.2 The Perspective of Methodologies for Design Dairy Processes
Although there are many general design methods available, there is little or no evidence
of the availability of a methodology of design in the dairy industry.
A wide range of process synthesis techniques have been described in the literature. The
two most common approaches are based either upon heuristics (Douglas, 1988) or the
optimisation procedures that extract the best design from a superstructure (Fraga &
McKinnon, 1994; Grossman & Kravanja, 1995; Jaksland & Gani, 1996 and Steffens et
a/., 2000a).
3.3 Process Definitions
Many dairy design processes in the form of block diagrams exist in the literature
(Kessler, 1981; Robinson & Tamine, 1986; Bylund, 1995; Chandan 1997; and Walstra
et a/., 1999). They defme the procedure in order to obtain a defined final product.
The process of design involves the modelling of objectives, options and choices after
analysis of the main objectives and constraints in each level of design.
The following items will be defined.
a) The feed
b) The process
c) The product
d) The side product
.. Co-products and by-products
.. Waste products and emissions
e) Throughput
f) The objective of the process
.. Principle objective
.. Other objectives (process and product)
g) Constraints
.. On the product
3-3

., On the process
h) Co-requisites
a) The Feed
A feed is defined for each process. The overall feed will always be raw milk (generally
from cows) that can vary in composition and with a daily feed volume that varies during
the season. Case studies will be presented in Chapter 7 with volumes varying from ten
litres to two millions litres per day (one cow to 100,000 cows approximately).
b) The Process
Processes are normally defined here as a single operation within the plant, e.g.
evaporation of whole milk to produce concentrated whole milk. However, when
operations are integrated, a process might include many unit operations, e.g., production
of whole milk powder from raw milk which includes pasteurisation, evaporation, drying
and other processes. Processes may have a range of scales. A typical process
representation is shown in Figure 3-1. Where A and B are the feed streams, A + and B
are the emiched and depleted streams respectively. B+ may be a co-product or by
product stream and S is a waste stream.
Solvent (mass, energy)
:---------+----- ---: A' Feed: ~I Process I : Product ~ A: : , B-B ,----------t---------,
Co-Products: B+ :S , , ______________ Jr ______________ ,
: Extract (Co-product, waste stream) : L ______________________________ J
Figure 3-1 General process model and main parameters.
c) The Product
A product is the desired principal output from a process, e.g., milk powder IS the
product of a spray drying process.
3-4

d) The side product
A side product is a flow coming out of a linear flowsheet, after producing the main
product. It may be co-products andlor by-products, waste products or emissions.
• Co-Product
A co-product is something regarded as a valuable product in its own right, that can be
sold to customers or processed further. A co-product is the result of the difference
between feed and product, sometimes referred to as "left over" during this design.
There can be more than one co-product. They are the alternative products produced as a
result of the product's manufacture, which can sometimes be produced as a necessary
step in obtaining the product, or simultaneously with the product, or perhaps as a
process further downstream.
• By-product
By-product is something of little value, no value or negative value. When it is not
saleable, it may be used to offset disposal costs. If the by-product has a value, it can
become a co-product. For example, in the past whey was a by-product from cheese
making as it was disposed of, but now it is processed and sold as a co-product.
• Waste products and emissions
A waste product is a material left after the product, co-products and by-product have
been taken out. They can be the result of the clean in place (CIP) process.
Emissions include hot air and noise.
e) Throughput
The amount of material passing through a system from input to output (especially of a
raw material) over a period oftime.
1) The objective of the process
The objective is normally to make a product from a given feed stream with specified
throughput, and generally with minimum cost.
3-5

There are often related objectives of a process.
If casein is made, for example, the fat and the whey must also be processed. A
processing site may include plants for the production of casein, butter, whey protein
concentrate, lactose and milk minerals. With the integration of components in the dairy
processes, virtually every component of milk will be used in an integrated dairy process
design as shown in the following sections.
The casein process, for example, has two objectives as follows:
• The principle objective is to make dry casein from skim milk.
11\ The other objectives (process and product) are to be able to process fat, whey,
lactose, and perhaps milk minerals.
g) Constraints
11\ On the product. The product will be required to meet some specifications.
11\ On the process. An example of this type of constraints on the process is that
temperature must be less than 70°C to avoid denaturation.
h) Co-requisites
They are often utilities which must be available on the processing site to enable to
process the function.
3.4 Art, Science, Technology, Engineering and Process Design III
the Dairy Industry
The distinction between art, science, engineering process design and other aspects of
design and technology is important in this context of design.
Art
The overall activity of dairy design might be considered to be an art. The creative
application of fundamental needs or ideas is used in the development of a design. Dairy
process design is the combination of science, technology and engineering in a creative
way that helps to make process design challenging and fascinating to a chemical
engineer.
3-6

Science
An active research capability exists in scientific areas such as microbiology, dairy
chemistry and product development in the dairy industry.
Science is primarily concerned with the scientific principles underlying the intended
process (Scott et al., 1992).
Technology
Process equipment is defined as a technology if it is not designed only from a
fundamental calculation, but is based on experience or developed by empiricism.
Examples are butter making chums, centrifugal separators, decanters, clarifiers and
leak-proof valves.
The majority of process technology used in the dairy industry is "off-the-shelf' and
supplied by a small number of international equipment suppliers. The industry has little
input to the process design and development for most ofthese technologies (Nicol et al.,
2001).
Engineering
The link between the chemical engineering and dairy process industry is a rewarding
field for the exercise of chemical process engineering, This is because the dairy
industry uses most of the unit operations found in the chemical engineering discipline,
for example, mass and energy balance, heat transfer, fluid flow, evaporation and drying
just to mention a few. There are many challenges including the ever-present need for
hygiene, the need to minimise fat globule damage and the pressure of handling the
perishable raw material that keeps on coming regardless of the plant readiness.
Mechanical engineering design will include aspects related to the strength of the
equipment and the manner in which it is constructed. Process design impacts on this
when there are special requirements such as hygienic design or corrosion resistance of
the material of construction (Jackson, 1985; Garverick, 1994).

Process Design
In the context of the dairy processing industry, a process design is essentially a
collection and sequencing of equipment and methods to transform a defined flow of
feed material into a specified product. The process design has a specified feed material,
product, operations and throughput.
Mechanical and process design will overlap to a small extent for such matters as
hygienic design and selection of materials for corrosion resistance and cleanability
(Vickers, 1979; Fryer, 2001).
3.5 Raw Material Supply and Characteristics
The raw material, milk, has some special features that distinguish it from other feed
materials. Milk is subject to natural variations:
a) Varying supply quantity per day and per season
There is a considerable variation in the milk supply volume through the dairying season
(Walstra & Jenness, 1984). Since the incoming volumes cannot be controlled, a
seasonal incoming volume must be estimated. Economies of scale must be considered
in the context of any changes in milk volumes, and processes must be able to cope with
the peak milk flow (Bloore, 2001).
During the months of lactation, the cows are milked at least once and normally twice
per day. If they are not milked, not only do they not accumulate milk, they may lose the
ability to produce it. In this respect, the dairy industry is similar to other sections of the
food industry in which many foods must be harvested when ready and cannot be kept.
b) Variable composition
The composition of milk for processing varies through the dairying season, particularly
for pasture fed animals. Important aspects of the raw material composition must be
considered in design. The composition of milk changes during the season, e.g., fat and
protein. However, the composition of milk has typical ranges. There may be subtle
differences in the structural elements and physical properties between different lots of
milk as a result of natural variation or changes occurring after the milking. This natural
3-8
variation may have three causes. The first is genetic between cows or between
individuals, the second is the physiological state, in particular the state of lactation, age
of cow and gestation, and the third is environmental, particularly feed, climate and
stress (Walstra & Jenness, 1984).
c) Heat sensitivity
Some components of the milk, especially the proteins, are heat sensitive. This limits the
processing conditions because the protein denaturation occurs above 65°C (Walstra &
Jenness, 1984).
d) Shear sensitivity
The fat globule can be damaged easily by mechanical treatments, pumping and
transporting (Bylund, 1995).
It has been found also that processing conditions like agitation and turbulence might
cause damage to the fat globule membranes, leading to hydrolysis of the fat and the
slight impairment of the flavour (Kaylegian & Lindsay, 1995). The velocities in the
process operations must be controlled to limit the shear forces.
e) Time-enzymic degeneration or degradation
Time is another important issue to consider, from .the reception line to the final product
process. To minimise enzymic degradation, which occurs when the raw and
intermediate product is stored, the storage time and conditions must be taken into
consideration during design. Short residence times are required when dairy products are
stored warm.
j) Susceptibility to microbial growth
Microbial degradation makes milk a perishable material. Unlike petrochemical raw
material and products, milk decays quickly when it leaves the udder and is exposed to
oxygen, light and handling equipment. Therefore, sanitary and product safety requires
regular microbial control and cleaning. Raw milk contains a number of natural bacteria,
which will spoil it if it is not processed within about one day.
3-9

g) Functional Properties
The suitability of certain protein preparations like nutritional quality, flavour, solubility,
gelling, swelling (water holding) and emulsification are dependent on composition,
manufacturing and storage (Walstra & Jenness, 1984).
3.6 Product Safety and Fouling
The control of the microbial content of a product imposes strict constraints on
processing. Milk processing needs to have:
a. Traceability and product history that is available at any time
b. Fixed processing requirements
c. Heat treatment requirements, e.g., pasteurisation
d. Minimal recycle or product hold-up.
Fouling and cleaning in design dairy processes. There is a serious fouling problem of
milk within heat treatment equipment. The growth of fouling reduces the overall heat
transfer coefficient. It also increases the surface area and roughness, which then creates
sites for microbial growth. As a consequence the sterility of the process plant is lost and
the product flow can also be restricted. Therefore, a periodic shut-down of the
equipment for cleaning-in-place (CIP), which results in hours of lost production, is
necessary.
Many studies have been carried out to quantify, control and reduce equipment fouling
(Kastanas et al., 1995). In virtually all types of heat transfer plants, fouling of heat
transfer surfaces is the main cause of progressive decline in efficiency and performance
with time. This phenomenon necessitates frequent cleaning of equipment and is of
considerable importance in the dairy industry (Tissier & Lalande, 1986).
The need to clean equipment adds energy costs to the process. Fouling significantly
affects the economics of the process, requiring capital expenditure on maintenance and
CIP chemicals. In addition to downtime that increases the production cost, product
safety sometimes requires stand-by equipment, used while CIP is taking place, in order
to keep the process line going.
3-10

The most obvious problem with fouling is downtime. This is in clear contrast to
petroleum plants, which can be run for years without cleaning. A typical dairy
processing unit operation requires cleaning after every processing run of 8-12 hours and
in the case of spray driers, every 5-6 weeks (see others in Table 3.2). As a result,
frequent cleaning cycles are often necessary to remove deposits. More start-ups and
shut-downs generally cause additional waste (Kohl brand, 1998; Balannec et al., 2002).
Table 3-2 Typical ruu times before cleaning (Howell, 1998).
Equipment
Centrifuge
Pasteuriser
Evaporator
Spray Drier
Run time before cleaning
8-12 hrs
8-12 hrs
10-14 hrs
5-6 weeks
Production scheduling is very important in dairy industry processing, since run time
lengths are limited by fouling and microbial constraints. These constraints must be
considered when developing process flowsheets.
3.7 Batch, Semi-continuous or Continuous Processing
With the current technology, the distinction between the batch and semi-continuous
processes is quite clear, even though the exact definition of batch and continuous is not.
For food processing, these can be defmed as below:
a) A batch process is normally defined by a volume or mass, in which the product
is held in a fixed volume while it is processed (e.g., in a cheese vat) or
accumulated during processing (e.g., in dead end filtration and silo storage).
b) A continuous process is normally defined by a flow rate where there IS a
continuous feed into the process and a continuous flow of product out of the
process.
c) A semi-continuous process is a continuous process that is interrupted from time
to time, perhaps for cleaning.
3-11

A continuous process can consist of a number of batch or semi-continuous processes.
For example, a cheese plant is made semi-continuous by scheduling a number of batch
cheese vats. Another good example is the spray drying of milk with a single drier fed
by multiple evaporators, in which the drier may operate for up to a month continuously,
but each evaporator runs semi-continuously for about 10 to 15 hours at a time (Bloore,
2001).
The batch or semi-continuous nature of food processing applies a constraint to energy
integration. Start-up and shut-down of processes at different times requires that energy
be stored or that alternative systems be put in place. Also batch or semi-continuous
process adds storage requirements or scheduling needs to the process design.
Design of Batch versus Continuous Processes
Douglas (1988) developed a conceptual design for a continuous process first and then
for a batch process in which it is necessary to make more decisions.
Decisions to be made for a continuous process:
1. Select the process units needed
2. Choose the interconnections among these units
3. Identify the process alternative that must be considered
4. List the dominant design variables
5. Estimate the optimum processing conditions
6. Determine the best process alternative
For a batch process, the following decisions must be made in addition to the above
mentioned:
7. Which units in the flowsheet should be batch and which should be continuous
8. Whether all the processing steps should be carried out in a single vessel, or an
individual vessel for each processing step
9. When it is advantageous to use the parallel batch units to improve the
scheduling of the plant
10. The location and size of intermediate storage that is required.
Malone et al. (1985) suggests that the best approach to design a batch process is to
design a continuous process first. They show that the choice between batch and
continuous processes depends normally on the size of the process design~ because the
batch process alternative would be the first step to take for a small size process.
According to the approach of the Douglas (1988) methodology, it is simpler to screen
the process alternatives and to determine the best process flowsheet.
This strong bias towards continuous processing seen in the chemical industry does not
always suit dairy processes, e.g., in cheese making.
3.8 Other Significant Aspects for Conceptual Dairy Design
In conceptual dairy design, there are other aspects that remain to be considered. The
determinations of these significant aspects are briefly described below.
3.8.1 Environmental Factors in Dairy Process Design
Environmental concerns in the selection of the process design, as well as the unit
operations, are important in dairy process design. An example, of this is the wastewater
from dairy plant processes~ which normally contains fat, milk proteins, lactose, some
lactic acid, minerals, detergents, and sanitisers. Normally, a major fraction of the
pollutants is in a dissolved organic and inorganic form. The wastewater strength and
quality varies even within plants producing the same products (Jones, 1974). The
determination of the significant sources of dairy food plant waste requires an
understanding of processing of dairy products and the unit operation involved in order
to evaluate the pollution potential.
3.8.2 Site Location and Limitation
The proximity of the raw material supply, and the product consumers, will have an
impact on the site location, and will reflect the additional transportation cost
(Bachmann~ 1981).
The site location often has a significant impact on the selection of waste water treatment
facilities. Sites in urban, coastal and rural areas may have very different waste water
solutions. In the urban location they may be restricted by odour, noise or perhaps
3-13

aesthetic regulations. The availability of utilities, e.g., water and electricity, will depend
also on the geographical location.
3.8.3 The Management of Design Process in the Dairy Industry
Hales (2000) stated ten critical factors in the design process (see Section 2.3.1). These
ten critical factors for the managements of the design process are adapted to the dairy
process industry.
Critical Factor 1: Define the objective and the outcomes
The aim of the dairy industry is to make profits for the shareholders (farmers). One
looks for the outcomes, with no unnecessary constraints. In general, the real design
problem is never clearly defined, or the wrong problem is identified. For example, the
farmer needs to make a profit from her or his land that will provide a living; there may
be product choices other than milk.
Once the outcomes have been defined, the criteria for selecting an appropriate concept
must be established in the form of a design specification. Here, all the requirements to
be met by any solution are listed. If the requirements are inaccurate or incomplete then
the design process will be flawed from the start with the introduction of fictitious
constraints. This can result in the concept selected being over constrained and therefore
it will not be an optimum solution to the objective. Deficient design specifications also
result in a huge waste of effort, money, materials and time.
Critical factor 2: Select the most appropriate Dairy Design Team
Dairy design teams generally consist of mechanical, electrical, civil, chemical engineers
(with economics skills), marketing personnel, microbiologists, chemists and food
technologists. Each of them has their functional role in the design team based on their
particular technical expertise and experience.
Critical factor 3: The right tools for the job.
There are a variety of chemical process design methods or approaches discussed in the
literature. There are also a number of different process design software packages
available commercially. The most appropriate technique or tool will depend on the
nature of the design project.
3-14

Care must be taken to focus on the result required. Crosschecks are essential to make
sure that the right approach is taken. Since not all the methods and techniques available
for chemical process design are suitable for dairy processes design; one needs to analyse
and synthesise which tools should be used and why, when and how in respect to the
design project objective.
Critical factor 4: Communicate effectively
Effective communication is as important as the idea during the process design. For
example, a deficient design specification, coupled with inadequate communication of
design from the manufacturer may lead to an unacceptable performance of the machine
and thus inability to fulfil the final product specification required by the customer.
Critical factor 5: Getting the concepts right
Once the objective of milk product has been defined, it is possible to start generating
ideas. This leads to the specific key concepts like the products and process constraints,
utilities, and equipment flexibility.
Hales (2000) described the difference between the invention and intellectual property
terms. An invention is not necessarily a design. This is because there is a fundamental
difference between an inventor having an inspiration on Thursday and a design engineer
producing an acceptable design concept within time, budget and specification
constraints by Thursday.
Critical factor 6: Keep the design simple.
It is important to look for simpler ways of doing the same job in the dairy process.
Complex geometries should be avoided because they are bug traps. Equipment that can
not be easy disassembled should be avoided if possible because it will require cleaning
and perhaps be subject to fouling although, there are many new technologies of compact
and self-cleaning automated equipment
The design concepts must be developed progressively into a practical, reliable and safe
result. A simple design should be developed first with the successive layers of detail to
be added as necessary. Then one looks for ways of stripping away layers of detail until
the simplest way of achieving the goal is found.
3-15
The process insights are the simple representations that allow engineers to discover
better design options. Researchers on short-term memory studies demonstrated that
humans can deal with about seven to eight chunks of information at anyone time.
Really outstanding people might make it to nine. Humans cannot be asked to be
innovative in a space with too many concepts whirling about at the same time
(Westerberg et ai., 1997).
There are specific guidelines available for these phases of the design process. These
guidelines describe factors of particular importance, the first of which is simplicity. The
design should be made as simple as possible by, for example, choosing the number of
milk components to the most important ones. Milk has more than 100,000 different
molecular species but most of these have not been identified. The principal components
are those present in the largest concentration (Walstra & Jenness 1984). Most of the
minor constituents are vitamins, metal ions, and flavour compounds (Fox &
McSweeney, 1998).
Critical Factor 7: Making the functions clear
The clarity in the dairy design requires making sure that the design itself explains how
the things are to be put together, and the function of each operation. This applies for
example, to the function of all cleaning chemicals in the clean-in-place (eIP) room.
The particular issues in the dairy industry need to be made clear since the lack of clarity
in dairy design creates ambiguities and design weaknesses. These may not be
immediately obvious because there can be a tendency to use from the conventional
arrangements instead of the unconventional design.
The design steps need to have a clear function e.g., a dairy evaporator only removes
water but not milk other components.
Critical factor 8: Safety
Safety, for equipment and personal health is an important part of the dairy process
design. For example, a leak in the regeneration section of the pasteurisation process
might not be found immediately so the section must be designed to have a pressure
differential preventing contamination of pasteurised milk.
3-16
Critical Factor 9: Selecting equipment and parts for the process design
A critical factor in the embodiment of the dairy process design is the selection of
equipment and standard parts which can be purchased off the shelf. Some equipment
parts will be standard but many need to be designed individually.
Critical Factor 10: Details in design cannot be ignored: Top-down approach
The design concepts and analysis must be kept simple. Start with the broad concepts
and then work out the detail. Consideration of the constraints in all alternatives will
reveal the essential details in the conceptual design and thus balance a good design
concept.
These ten critical factors are adapted to the dairy process industry, as shown in Figure
3.2.
3-17

10 critical factors in the design
process, Hales (2000)
I 1. Defining the problem with efficient
design specifications.
Application in dairy design
process
1
~ Define the objectives and the ~ without unnecessary constraints.
outcomes
~----~I----~ 1
I... Dairy design team includes mechanical, 2. A working design team where every u,\ civil, electrical engineers as well as
one has a functional role in the team. rV microbiologist, chemists and food
I ~t_e_ch_n_O_lo_g_i_st_S_. ____ -, ______________ ~
3. The right tools for the job t~e tools I. Question constraint; and precedents as to be used depends on the project and U\ the right tools for the job in design of dairy the crosscheck are essential to catch nl processes. errors. 1''----------------..,-----------------
~------~I------~ 1 4: Communicating eff~cti.vely this is notl. Clear and concise communication of the Just a matter of transmission of U\ duties, operation of each unit and process information but also a matter of right nI involved in the dairy process. interpretation. J'
1 I 5. Getting the concept right to meet the ~ P~o~uc~ an acceptable design .~on~ept
design specification. n/ wlthm time, budget and specification J' constraints .
.-------_----1.1__ I 6. Keeping it simple the se~ected I. Keeping the design simple, is there a
concept must be progressively U\ simple way of doing the same job?, avoid develop~d into a practical, reliable, and nI complex geometries which can be bug traps. safe deSign. J,--~. ______ . ______ -, __ ----------........,.----'
I 7. Making the functions clear which
makes sure that the design explains itself. Lack of clarity in design creates ambiguities and weaknesses. operation. ~-----~I--~ J 8. Tackling safety is another important I.
> The functions have to be clear make clear the particular issues in the dairy industry the function of each component and unit
aspect on design, not simply as U\ Safety is critical in dairy industry cleaning add-ons at the end of the project. rV chemicals and CIP room, public health.
~------~I------~ I 9. Selecting materials and parts that
are appropriate materials, process, components to do the job.
I. Selection of the process alternatives is ~) important to meet the specification I' requirements of the final products.
~------~I------~ I 10. Details in design poor detailed
design can ruin a good concept. ~ Details in dairy design process should ~ not be ignored.
'----------------------------~
Figure 3-2 Application of critical factors proposed by Hales (2000) in the design management for dairy industry, with new concepts added by the author.
3-18

3.9 Summary
Several conceptual design methodologies were described in Chapter 2, most of which
were developed in petrochemical industries. The dairy process industry differs from the
petrochemical process industry in several ways. There is variation in volume and
composition of bulk milk arriving at any factory due to seasonal variation, collection
area, genetic variation between breeds and individual animals, physiological (age of the
cow and stage of lactation), and environment (feed, climate and stress). As a result of
these factors, the main components such as protein, fat and lactose vary within typical
ranges. Despite the variations in composition there is a need to have consistent final
products that meet the consumers' needs and specifications. The food industry is
constrained by the need to clean. Also, some processes, by their nature, are batch and
most will be semi-continuous. For these reasons and more, some of the petrochemical
methodologies are not entirely consistent with the specific requirements and objectives
of dairy process design. These differences have considerable impact on the overall
constraints and objectives of the conceptual design process.
The relevant design issues for the dairy process industry, however, are still expressed in
the conceptual design framework of Douglas (1988). Focussing on the reactor as a first
stage is not particularly relevant, but dairy processes may have other operations rather
than reactors, which can be used as a starting point. Although the dairy industry differs
from petrochemicals in some significant ways, there are several aspects of the
conceptual methodologies which are relevant and useful for developing a conceptual
design methodology for the dairy process industry. These methods will be used as a
basis for developing a specified dairy design methodology in subsequent chapters.
3-19

4 Unit Operations in the Dairy Industry from a
Process Point of View
Dairy processing is dominated by the separation and heat transfer processes. Unlike
petrochemical processes, there are only a few reaction operations in dairy processing.
Dairy process design is strongly influenced by certain requirements such as food safety,
minimising protein denaturation by using temperatures less than about 70°C and
minimising mechanical damage of the fat globules. Consequently, the final flow sheet
is dominated by unit operations that can achieve these requirements.
Designs based on existing operations are likely to engender the greatest confidence. In
order to develop a design, the engineer must have a sound fundamental understanding of
existing processes and of the limits and constraints imposed by physical and chemical
properties of the materials processed. A systematic comparison of those physical and
chemical properties will then reveal where existing operations may be improved (Scott
et al., 1992).
The process point of view based on the unit operations described in this chapter aims to
define aspects inherently related to the conceptual dairy process design by defining
different types of constraints in the unit operations, as below:
1. Process constraints
e.g., maximum viscosity to achieve film flow in evaporators
2. Design constraints
e.g., maximum hygienic pump size available
3. Product constraints on the process
e.g., maximum heat treatment for proteins
4. Product constraints on the process operation
e.g., maximum operating time with minimal bacterial growth
5. Other constraints
e.g., maximum environmental emissions
4·1
The product constraints will be discussed in Chapter 5, while constraints relating to
particular unit operations will be discussed in this chapter.
Unit operations are divided into seven main categories for discussion in this chapter:
1. Heat transfer
2. Separation
3. Mixing andlor blending
4. Reaction
5. Storage
6. Packaging
7. Other emerging processes that may be suitable for dairy industry
For pathogen control:
a. High pressure
b. Ultraviolet (UV)
c. Electromagnetic waves
d. Electron and gamma rays
4.1 Heat Transfer Operations
4.1.1 Overview
Heat transfer operations are widely used in most chemical process industries and are an
essential part of the manufacture of dairy products. There are four main uses of heat
transfer in the dairy industry:
1. Heating to destroy pathogens i.e., pasteurisation, thermisation and sterilisation
2. Cooling to prevent bacterial growth
3. Heating or cooling to bring a product to a required processing temperature
4. Heating for separations such as evaporation and drying (see Sections 4.2.3 and
4.2.4).
In the dairy industry, heat transfer takes place in the form of convection, conduction and
radiation, though the first two are the most common (Bylund, 1995).
4-2
General issues of all heat treatments
There are constraints in the process, products and design. An excessive temperature and
time (above 80°C for longer than about 15 seconds for milk) will cause protein damage
or denaturation that can affect product functionality. High temperatures also cause
fouling on heat transfer surfaces, which reduces heat transfer rates and may allow
bacterial growth. All surfaces wetted with milk must be cleaned at least once every day.
A consequence of this is cleaning waste that is produced from the rinsing, caustic wash
and acid wash during the cleaning-in-place (CIP). These cleaning waste effluents
increase costs through chemical costs, product loss and treatment costs.
The energy costs associated with heating and cooling are very significant and every
effort must be made to recover heat or cold wherever possible. A classic application is
in pasteurisation, where energy usage can be reduced if the heated milk exchanges heat
with the cold milk to preheat it (Kessler, 1981).
The consequences of cleaning waste and energy costs are typical of many operations in
that they demonstrate that unit operations cannot be viewed in isolation. Furthermore,
the consequences of cleaning system and energy design choices should be recognised
early in the design process.
There is a variety of choices for the type of heat transfer used. From a design
perspective, the first distinction made can be between direct and indirect heat transfer.
Direct heat transfer involves directly mixing a heating or cooling fluid (e.g., steam, hot
water, or cold water) with the product, while indirect heat transfer involves transferring
heat from one fluid through a barrier to the other fluid.
4.1.2 Direct Heating and Cooling
The product is heated or cooled by direct contact with the heating or cooling medium.
The advantage of this is that the product is brought to the new temperature over a very
short period of time, which for heat sensitive products such as milk may cause less
damage. Further, no heat transfer surfaces are required for direct heat transfer, so much

less fouling occurs. For all direct heating or cooling of product, potable liquids or
vapours will be required.
Direct heat transfer can occur between a variety of different phases in different
configurations:
1. Injection of steam into liquid (direct steam injection)
2. Passing liquid through a steam or vapour chamber (steam infusion or direct contact
preheating)
3. Injection of hot liquid into a low pressure chamber (flash cooling)
4. Mixing of solid product with hot or cold water (e.g., during casein washing, see
Section 5.6.1).
Drying can also be considered as a form of direct contact heat transfer and this is
discussed in Section 4.2.4.
The process of milk sterilisation can use steam infusion or direct steam injection
followed by flash cooling. In steam infusion, milk droplets fall into a chamber of high
pressure steam and the period of the fall matches the desired holding time to achieve
sterilisation.
For direct steam injection, steam is injected into a pipe through which the products flow
and causes rapid heating of about 140°C and 10% to 15% dilution (Grandison & Lewis
1996; Lewis, 1986a). The product is then held, by flowing through a tube, for 2 to 4
seconds to achieve sterilisation. The product can then be passed into a low-pressure
flash vessel, immediately dropping the temperature below 80°C and controlling the heat
treatment to the minimum required. This causes some of the water to evaporate and
pass out as vapour. As a result, the solids content of the product is restored to its
original value. Flash cooling will also remove both desirable and undesirable flavour
components and dissolved gases.
4-4
Direct steam injection is often used to heat water, as the capital cost is much less than
that of a heat exchanger and the energy cost is the same. However, the overall cost and
inefficiency of supplying steam may be more than other processes that produce hot
water directly. If a substantial amount of hot water is required, a dedicated hot water
"boiler" may be a better option than a steam boiler and direct steam injection.
Direct heating and cooling with hot and warm water is effectively used in casein
washing where the requirements for both wash water and product temperature changes
are met coincidentally. Some cheeses, such as Gouda cheese and Cheshire cheese,
involve a step of direct addition of hot water that is used to wash the curd and to change
its temperature. In some processes, Mozzarella cheese is directly heated in a brine bath.
Most brine salted cheeses, e.g., Gouda, are cooled rapidly by immersion in brine,
helping to control the types of bacteria that will grow.
Other forms of direct cooling by the addition of ice or liquid gases could give rapid
cooling but are currently unknown in the industry.
4.1.3 Indirect Heating and Cooling
In the dairy industry, indirect heating and cooling are more common than direct heating
and cooling. The heating or cooling medium and the product are not in direct contact,
but separated by a conducting barrier (normally stainless steel). Heat is transferred from
the medium through the contact surfaces into the product in a variety of ways (Spalding,
1992).
Several types of heat exchangers are available, i.e., plate, tubular (shell and tube, shell
and coil, double tube, triple tube) and scraped surface (Kessler, 1981). In addition, a
heating or cooling jacket is often used to heat or cool a vessel.
Heat exchangers used for dairy products must be able to be cleaned and inspected easily
to ensure that surface fouling is removed. This is possible with some shell and tube
designs but this requirement normally leads to the use of plate heat exchangers or tube
in-tube exchangers. Shell and tube heat exchangers can be used for water heating or
4-5

vapour condensing where there IS no risk of bacterial growth leading to food
contamination.
High viscosity materials often require scraped surface heat exchangers in which the
surface is scraped to ensure mixing of heated or cooled product and to minimise fouling.
These can be used for heating concentrated milk or for cooling viscous products such as
butter and ice-cream.
General indirect heat transfer examples (Kessler, 1981) include:
• Milk cooling after milking on farms by bulk tank coolers or by immersion cooler
units
• Milk pasteurisation
• Preheating of the milk feed to evaporators
• Heating of the air stream to drier chambers
• Temperature control of jacketed cheese vats
• Chilling of paste uri sed milk and intermediate products before storage in silos in
order to control microbial growth
• Feed preheating for centrifugal separators.
Heating media used includes hot product, hot water, steam, hot oil (for air heating) and
hot combustion gases. Cooling media includes liquid refrigerant, cold product, cold
water, chilled water, alcohol brine and glycol solution.
Design Information and Constraints
Heat transfer coefficients for these heat exchangers can be estimated from values found
in textbooks or manufacturers' literature (Walas, 1990; Holman, 1992; Mills 1999),
though for plate heat exchangers the equations are not always openly available so the
designer must rely on supply companies. Typically, the temperature approach (the
temperature difference between the hot stream in and the heated stream out) is in the
range 3 °C to 8 °C for plate heat exchangers and at about 20°C for air heaters.
4-6
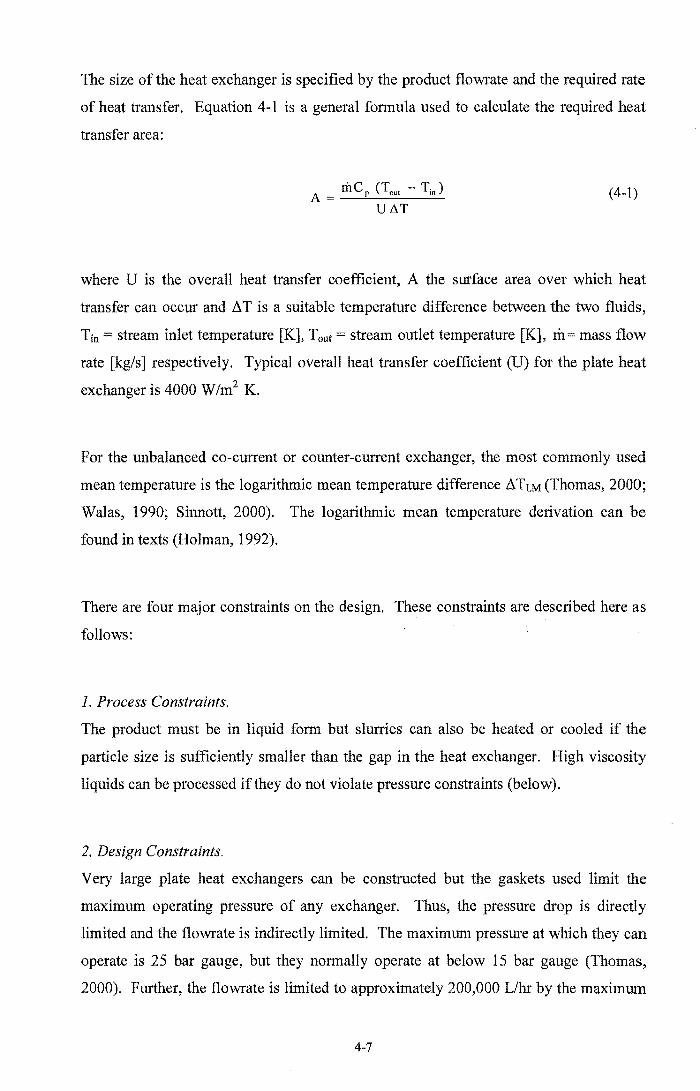
The size of the heat exchanger is specified by the product flowrate and the required rate
of heat transfer. Equation 4-1 is a general formula used to calculate the required heat
transfer area:
(4-1)
where U is the overall heat transfer coefficient, A the surface area over which heat
transfer can occur and ll. T is a suitable temperature difference between the two fluids,
Tin = stream inlet temperature [K], Tout = stream outlet temperature [K], mass flow
rate [kg/s] respectively. Typical overall heat transfer coefficient (U) for the plate heat
exchanger is 4000 W/m2 K.
For the unbalanced co-current or counter-current exchanger, the most commonly used
mean temperature is the logarithmic mean temperature difference ll. TLM (Thomas, 2000;
Walas, 1990; Sinnott, 2000). The logarithmic mean temperature derivation can be
found in texts (Holman, 1992).
There are four major constraints on the design. These constraints are described here as
follows:
1. Process Constraints.
The product must be in liquid form but slurries can also be heated or cooled if the
particle size is sufficiently smaller than the gap in the heat exchanger. High viscosity
liquids can be processed ifthey do not violate pressure constraints (below).
2. Design Constraints.
Very large plate heat exchangers can be constructed but the gaskets used limit the
maximum operating pressure of any exchanger. Thus, the pressure drop is directly
limited and the flowrate is indirectly limited. The maximum pressure at which they can
operate is 25 bar gauge, but they normally operate at below 15 bar gauge (Thomas,
2000). Further, the flowrate is limited to approximately 200,000 Llhr by the maximum
4-7

size of hygienic pump available. The maximum operating temperature is limited to
about 250°C (Sinnott, 2000) due to the perfonnance ofthe available gaskets materials.
Sanitary design requires that materials for the heat exchangers are mostly stainless steel.
3. Product Constraints on the Process Design.
Excessive temperatures above 80°C for longer than about 15 seconds damage the
protein. Similarly, excessive shear forces may damage the fat globules, causing
impairment of the flavour as the fat becomes susceptible to oxidation or lipolysis
(Bylund, 1995).
4. Product Constraints on the Process Operation.
One of the problems is fouling, which can restrict the operating time to about eight
hours.
4.1.4 Heat Treatment for Pathogen Control
Pasteurisation, sterilisation and thennisation are the heat treatments for pathogen control
operations of milk processing. Pasteurisation destroys pathogenic organisms typically
by heating milk to 72°C and holding it for 15 seconds before cooling. Thennisation
uses a lower temperature of about 65°C to extend the keeping time of unpasteurised
milk and is sometimes used before making some hard cheeses. Sterilisation is designed
to destroy all micro-organisms and spores, and to inactivate enzymes (Hinrichs &
Kessler, 1995). All the processes aim to retain as many as possible of the food
organoleptic and nutritive properties of the raw material.
Table 4.1 shows a summary of the combination of temperature and typical holding time
in the heat transfer for pathogenic control in the dairy industry.
4-8

Table 4-1 Heat transfer for pathogenic control (Bylund, 1995).
Process
Thermisation
Pasteurisation (LTLT)
Pasteurisation (HTST)
Pasteurisation of cream etc. (HTST)
Ultra pasteurisation
UHT (flow sterilisation)
Sterilisation in container
L TLT = Low temperature long time.
HTST = High temperature short time.
UHT = Ultra high temperature.
Thermisation
Temperature Holding time
63 - 65°C 15 - 30 seconds
63°C 30 minutes
72 -75°C 15 - 20 seconds
> 80°C 1 - 5 seconds
125 - 138 °C 2 - 4 seconds
135 - 140°C a few seconds
115 -120 °C 20-30 minutes
This heat treatment process is used to extend the storage time of milk by applying a
moderate heat treatment to raw milk at 63°C to 65 °C with an effective holding time of
a minimum of 15 seconds and maximum of 30, seconds, followed by cooling. The
purpose of this thermal treatment is to extend the storage time of cooled milk and for
treatment of milk before making some cheeses. When a short storage period cannot
always be maintained, thermisation can reduce loss of quality (Spreer, 1998).
The treatment to be used also depends on the down-stream processing. If the storage
time of the raw milk needs to be extended before further processing, then thermisation
may be used to inhibit bacterial growth (Thomas, 2000). This technique will arrest the
growth of the heat sensitive micro-organisms but the nutrients of the milk are almost
unchanged (Hinrichs & Kessler, 1995).
4-9
Pasteurisation
In the early days of heat treatment processes, milk was held in batches at 63°C to 66 °C
for 30 minutes (Thomas, 2000; New Zealand Dairy Board, 1996; Kessler, 1981), and
then used for small-scale cheese manufacture. This process is known as the Low
Temperature Long-Time (L TL T) treatment. At the industrial scale, pasteurisation is
achieved by maintaining the temperature at 72°C to 75 °C for 15 to 20 seconds, which
is called High-Temperature Short-Time (HTST) treatment. At higher temperatures, a
shorter time can be used to achieve the same heat treatment. Cream and other viscous
products are typically pasteurised at a temperature 3 °C to 5 °C higher than HTST milk
for 1 to 5 seconds (Bylund, 1995).
The process of pasteurisation was named after Louis Pasteur who discovered that
spoilage organisms could be inactivated in wine by applying heat at temperatures below
its boiling point. The process was later applied to milk and it remains a very important
operation in milk processing.
Pasteurisation is a thermal process applied not only in the dairy industry but in the
processing of other food as well. According to the New Zealand Dairy Board (1996),
the pasteurisation process is defined as:
"A heat treatment process in which every particle of the milk or liquid dairy product
is heated to not less than a specified temperature and held at that temperature for not
less than a specified time, then cooled to 5 °C or less or to the processing
temperature if processing is to commence immediately, with the aim of avoiding
public health hazards arising from pathogenic micro-organisms associated with milk
and of reducing spoilage organisms associated with milk and of reducing spoilage
organisms, consistent with minimal chemical, physical and organoleptic changes in
the product".
In this work, pasteurisation is defined as a heat treatment process designed to kill
pathogenic organisms by heating every particle of milk to a specific temperature for a
4-10

specified period without allowing the recontamination of milk during the heat treatment
process.
The aims a/pasteurisation are:
1. Public health: To kill the unwanted organisms by the use of heat, making the
milk and milk products safe for human consumption by destroying all bacteria
that may be harmful to health (pathogens).
2. Keeping quality: To improve the storage quality of the milk and milk products
by destroying the undesirable enzymes (catalase, alkaline phosphatase, lipase
and peroxidase) and the spoilage bacteria. According to Kessler (1981), the
shelf life of liquid milk can be up to 20 days if the storage temperature is ::; 5 °e.
To ensure the destruction of all pathogenic micro-organisms, the time and temperature
combinations of the pasteurisation process are highly regulated. The minimum
temperature and time requirements for milk pasteurisation are based on the thermal
death time studies done for the most heat resistant pathogens found in milk (Kessler,
1981). As shown in Figure 4-1, the pathogenic micro-organisms are reliably destroyed
under pasteurisation conditions.
4-11

3000
2000
1 000
600
400
200 ...... .!!? Q) 100 E :p 0) 60 r::: :s "0 4()
.r:::
20
10
6
4
2
1
I \. ' tr~/l I I
c:;::J Batch \ ~stermzation heating
\S'~ ,
~ U?K
q...a, -~' H' ~ ~- '.:
\ \ ~~\ ~~ I~I\I\{\" ~ \ Pasteurisation methods
%:
~~\ ~\ ~~ '\l \.. g \' '\ 9.,\ 'I\.~Q' " ~X
Q~~~ \ ~ I Short
~ ~ ~ ~ time heating \ "2.. % U'\S' ~\ -0 ~ ~ =;to ~ 77h ,"-
!;;'~ ~ 'CO 3~'" High temp . o \: ~ .~ ...... y
!8 w..@ $ \ I~:, Heating ~~ I'\: \ 9..' -, ~ a~ '\ ~ UHT -\ ,atlnr -\
J
60 80 100 120 140 160
temperature rC]
Figure 4-1 Temperature-time plots for some changes that occur in milk
(Hinrichs & Kessler, 1995).
For HTST pasteurisation, a plate heat exchanger is most commonly used, though tubular
heat exchangers are also a possibility. The holding sections are normally a section of
pipe long enough to ensure that the fastest particle of milk is held for the minimum
time.
In addition to the general constraints on heat exchangers used for pasteurisation, there
are constraints on the design and operation to ensure that unpasteurised product cannot
bypass or leak into pasteurised product. This can be achieved by designing and
operating the process so that the pasteurised product has a higher pressure, or by using
special leak -proof plates such as the duo plate, or gaskets, round the edges of the plates
and round the holes, forming the boundaries of the channels. They must also have
4-12

control systems to maintain the minimum pasteurisation and holding time, and to divert
the milk from flowing forward to other processes if the required conditions are not met.
The utilities required for pasteurisation are heat supply (steam or hot water above 80
°C), cooling water or chilled water, and electricity. Figure 4.2 is a simplified
representation of the feed, utilities and outlets of the pasteurisation process .
.--------------~----.---~-----
Heat Cooling
Liquid I I ..... L_iq_u_id ____ .... .I Pasteurisation I
Feed IL--_--r __ --r __ --II Pasteurised product
Low grade heat Used cooling water
Figure 4~2 Diagram of the pasteurisation process.
In the heating and cooling process, energy can be saved by using "regeneration" (heat
recovery), which utilises the heat content of the pasteurised milk to warm the incoming
cold milk. Its efficiency may be calculated as follows (Bylund, 1995):
01 • temperature increase in regeneration 10 regeneratwn = -~----------.:::::....----
total temperature increase (4-2)
For example, cold milk, which enters the system at 10 °C, is heated to 65°C by
regeneration and then to a final temperature of 73 °C, will have a regeneration of
87.3%. The plate and tubular heat exchangers usually used for pasteurisation can
achieve heat recovery of over 90% (Hinrichs & Kessler, 1995).
The high degree of heat recovery achieved by regeneration, combined with the need for
very good temperature control, means that heat integration is best designed within the
pasteuriser rather than between the pasteuriser and other processes.
4-13

Sterilisation
Sterilisation refers to complete inactivation of enzyme and destruction of all micro
organisms except for some heat resistant micro-organisms that survive the sterilisation
process (Kessler, 1981). Any surviving micro-organisms are unlikely to grow during
storage and cause product spoilage. Sterilisation can be carried out at various
temperatures and holding times as shown earlier in Table 4.1.
The original form of sterilisation, in-container sterilisation at 115°C to 120 °C for 20 to
30 minutes, is still used, for example for cans of evaporated milk (Bylund, 1995). For
unconcentrated milk, ultra high temperature treatment is usually carried out by plate
heat exchange, direct steam injection, or steam infusion followed by very rapid cooling
and sterile packaging in glass, plastic or cardboard containers.
The milk starts to undergo a browning reaction, with a cooked or caramelised flavour
due to the decomposition of lactose at 115°C to 120 °C for 20 to 30 minutes. This is
known as the Maillard reaction (O'Brien, 1997; Kessler, 1981). Flow sterilisation at
temperatures of 135°C to 140°C for a few seconds, however, produces less
discolouration and flavour change.
The use of Ultra High Temperature (UHT) treatment is preferred to sterilisation and
pasteurisation, whenever a complete elimination of bacteria and spores is required for
long life products.
The advantages of sterilisation is the production of high quality milk with complete
enzyme inactivation (except for some heat resistant lipases and proteases), and
destruction of the whole of the microflora and spore formers (except for some heat
resistant spores) (Kessler, 1981). Further advantages are the reduction of processing
time due to the ultra high temperature short time, and an expected long shelf life greater
than 6 months without refrigeration.
The constraint is the need for sterile conditions from production to packaging. The
packaging requires special attention and materials; see Section 4.7.1.
4-14

Difference between ultra pasteurisation and the UHT process
Both ultra pasteurisation and ultra high temperature (UHT) processes refer to the same
process but with different holding times. Any heat treatment over about 125°C is
called ultra pasteurisation and/or UHT. Mainland Products Ltd, New Zealand runs a
range of temperatures to suit the product being processed. If it is a flavoured product
then a higher temperature will give a higher safety margin for sterilisation and any
flavour-induced changes (Maillard reaction) will be masked by the flavour. The same
kind of situation applies to vitamin-emiched products where heat treatment will destroy
some of the vitamins. Typically, higher levels of vitamins must be added to allow for
this.
White milks contain no additives so are generally easier to heat treat, but the flavour
changes induced will be much more obvious so a suitable temperature and time
combination must be found. Furthermore, certain customers like a particular flavour,
for example, milk processed to UHT standard on an indirect pasteuriser compared to a
direct heating process. The direct heating process heats much more quickly and
produces a much reduced flavour change but certain customers did not like this
"fresher" flavour and complained that the milk tasted "grassy". The indirect heating
process gives a stronger heat treatment flavour, which is more familiar to some
customers (personal communication with Wylie, 2003).
4.2 Separations
Separation of one or more components from a mixture is a requirement for many
operations in the food industry. Initially the term "separation" is used in the general
sense, though later (Section 4.2.2) the more common specific meaning of centrifugal
separation will be discussed. The aim of separation is to achieve the removal of a
specific component or components, including impurities from the raw material, in order
to increase the concentration of the wanted component or components of the products,
which may be the residue, the extracted component or both. One application is the
adjustment of the composition of raw milk to ensure that the final product is consistent
from one batch to the next.
4-15
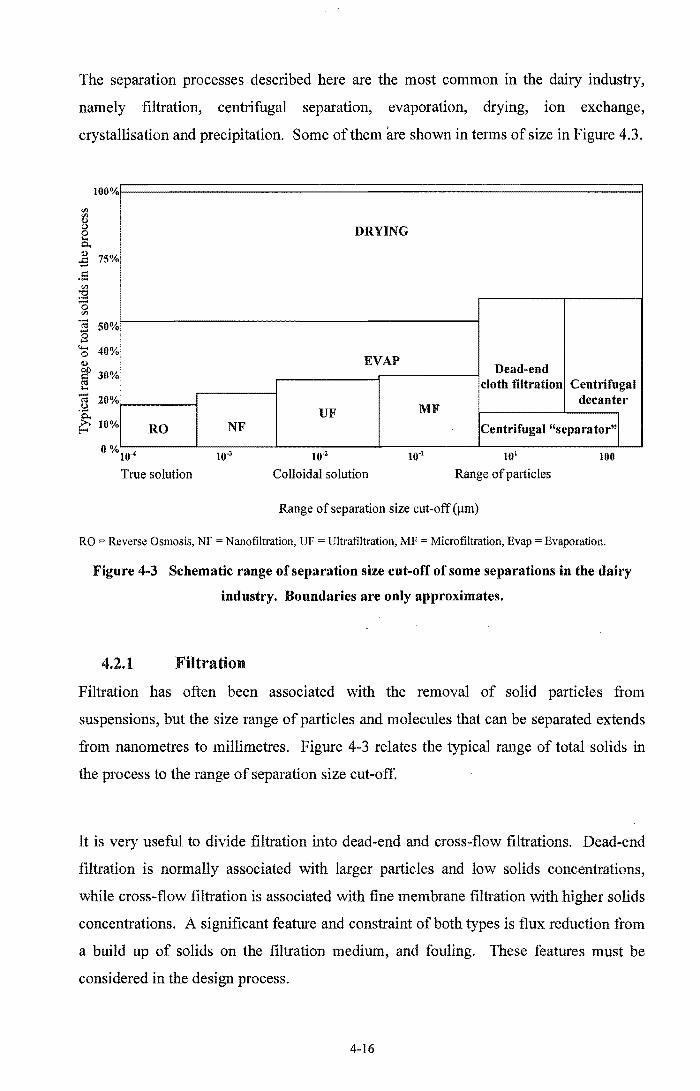
The separation processes described here are the most common in the dairy industry,
namely filtration, centrifugal separation, evaporation, drying, ion exchange,
crystallisation and precipitation. Some of them are shown in terms of size in Figure 4.3.
100
'" ~ o
~ <l:I ;s 75
.51 ~ -o '" ~ 50
'0 40 <l:I
gf 30 e!
20
10
%
0;.
0;"
%
%
%
% RO NF
• o ~\0-4 10"
True solution
DRYING
EVAP
UF
10-2
Colloidal solution
MF
Dead-end cloth filtration
Centrifug
lOt
Range of particles
Range of separation size cut-off (11m)
Centrifugal decanter
..I I
100
RO Reverse Osmosis, NF = Nanofiltration, UF = Ultrafiltration, MF = Microfiltration, Evap Evaporation_
Figure 4-3 Schematic range of separation size cut-off of some separations in the dairy
industry. Boundaries are only approximates.
4.2.1 Filtration
Filtration has often been associated with the removal of solid particles from
suspensions, but the size range of particles and molecules that can be separated extends
from nanometres to millimetres. Figure 4-3 relates the typical range of total solids in
the process to the range of separation size cut-off.
It is very useful to divide filtration into dead-end and cross-flow filtrations. Dead-end
filtration is normally associated with larger particles and low solids concentrations,
while cross-flow filtration is associated with fine membrane filtration with higher solids
concentrations. A significant feature and constraint of both types is flux reduction from
a build up of solids on the filtration medium, and fouling. These features must be
considered in the design process.
4-16
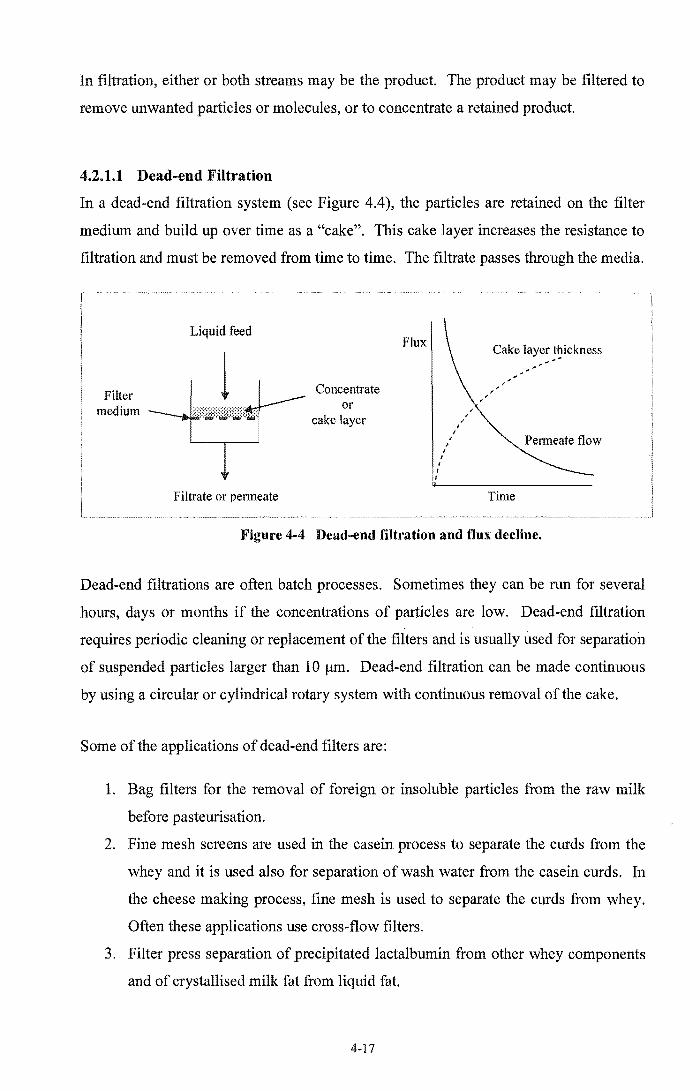
In filtration, either or both streams may be the product. The product may be filtered to
remove unwanted particles or molecules, or to concentrate a retained product.
4.2.1.1 Dead-end Filtration
In a dead-end filtration system (see Figure 4.4), the particles are retained on the filter
medium and build up over time as a "cake". This cake layer increases the resistance to
filtration and must be removed from time to time. The filtrate passes through the media.
Filter medium
Liquid feed
1 J--- Concentrate ,:,:,:,:::,:;:,:::,:,:,:;:::;:::' '.' or ....................................... k I
.. _· .............. 1 ca e ayer
Filtrate or permeate
Flux Cake layer thickness ;-
Time
Figure 4-4 Dead-end filtration and flux decline.
Dead-end filtrations are often batch processes. Sometimes they can be run for several
hours, days or months if the concentrations of particles. are low. Dead-end filtration
requires periodic cleaning or replacement of the filters and is usually used for separation
of suspended particles larger than 10 ~m. Dead-end filtration can be made continuous
by using a circular or cylindrical rotary system with continuous removal of the cake.
Some of the applications of dead-end filters are:
1. Bag filters for the removal of foreign or insoluble particles from the raw milk
before pasteurisation.
2. Fine mesh screens are used in the casein process to separate the curds from the
whey and it is used also for separation of wash water from the casein curds. In
the cheese making process, fine mesh is used to separate the curds from whey.
Often these applications use cross-flow filters.
3. Filter press separation of precipitated lactalbumin from other whey components
and of crystallised milk fat from liquid fat.
4-17

4. Air filters for the removal of dust and insects from dryer feed air.
5. Sintered stainless steel steam filters for the removal of rust or metal particles
from steam.
4.2.1.2 Cross-flow Filtration
Cross-flow filtration is often associated with membrane filtration but a common
exception is the use of screens for the separation of whey or wash water from casein or
cheese curd as shown in Figure 4-5.
Feed slurry
", 1 , , , , , , , , , , , , , , , , ,
1 """'" Wash water or whey
Figure 4-5 Cross-flow filtration of casein or cheese curd.
For the remainder of this section, membrane-based cross-flow filtration will be
considered. A membrane is a physical barrier between two liquid systems. In over 99%
of the cases of current industrial interest, the membrane is made from a polymer. This
membrane-based separation process enables the separation by selectively passing one or
more components of a stream through a membrane while retarding the passage of one or
more other components (She, 1998). Normally the main feed under pressure is forced
to flow across, parallel to, the membrane surface where the membrane rejects (retains)
the large components (Figure 4-6). The retained material exits from the process,
helping to reduce the contaminant build-up and the fouling on the membrane so that the
cake layer remains relatively thin and the resistance to filtration remains low. To a
certain extent the process is self-cleaning. This allows relatively high fluxes to be
maintained over long periods of time (Mannapperuma, 1997). However, the membrane
still tends to become blocked and this then causes reduced throughput and bacterial
growth. Cross-flow filtration is mostly used in semi-continuous medium and large scale
systems. In the pharmaceutical industry, batch ultrafiltration is very common.
4-18
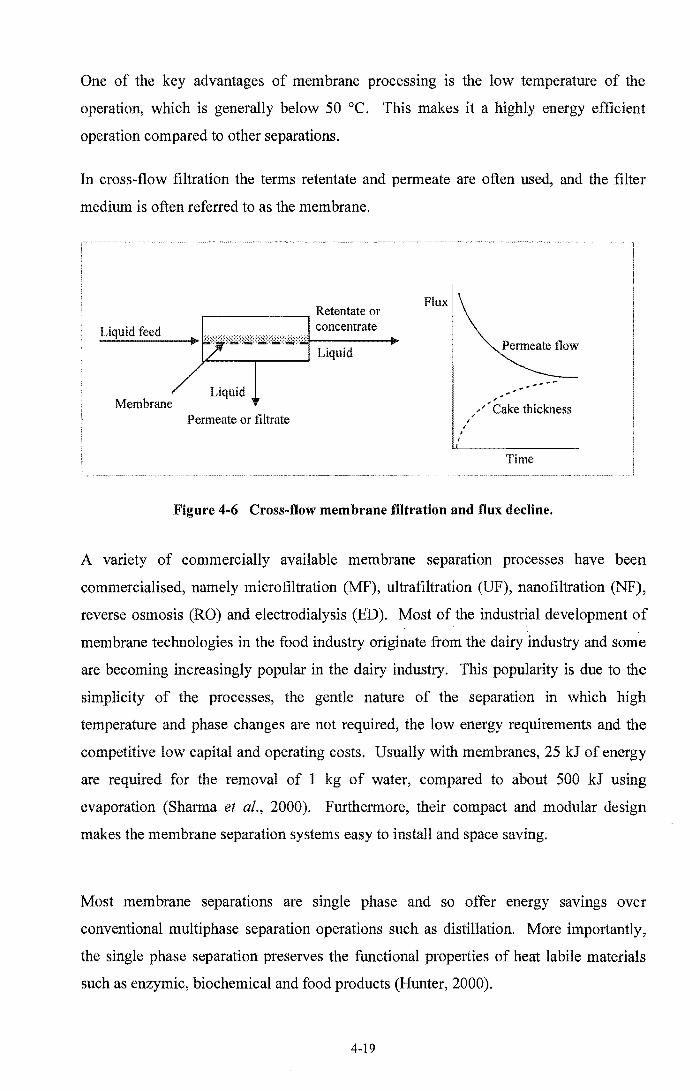
One of the key advantages of membrane processing is the low temperature of the
operation, which is generally below 50 °e. This makes it a highly energy efficient
operation compared to other separations.
In cross-flow filtration the terms retentate and permeate are often used, and the filter
medium is often referred to as the membrane.
Membrane
,--____ ----, Retentate or concentrate
~ __ .---_----I Liquid
Liquid
Permeate or filtrate
Flux
I I
/ , , / Cake thickness
Time
Figure 4-6 Cross-flow membrane filtration and flux decline.
A variety of commercially available membrane separation processes have been
commercialised, namely microfiltration (NIF), ultrafiltration (UF), nanofiltration (NF),
reverse osmosis (RO) and electrodialysis (ED). Most of the industrial development of
membrane technologies in the food industry originate from the dairy industry and some
are becoming increasingly popular in the dairy industry. This popularity is due to the
simplicity of the processes, the gentle nature of the separation in which high
temperature and phase changes are not required, the low energy requirements and the
competitive low capital and operating costs. Usually with membranes, 25 kJ of energy
are required for the removal of 1 kg of water, compared to about 500 kJ using
evaporation (Sharma et al., 2000). Furthermore, their compact and modular design
makes the membrane separation systems easy to install and space saving.
Most membrane separations are single phase and so offer energy savings over
conventional multiphase separation operations such as distillation. More importantly,
the single phase separation preserves the functional properties of heat labile materials
such as enzymic, biochemical and food products (Hunter, 2000).
4-19

In general, the objective of membrane filtration is the separation of large particles or
molecules from smaller particles or molecules by filtration based on particle size or
molecular size. This separation can be for the purification of one or both streams or for
the concentration of the retentate stream. This provides a unique opportunity to separate
components in liquid systems without phase change or physical and chemical change to
the components (Humphrey & Keller II, 1997).
General examples are:
• Sterile filtration and purification (e.g., demineralised water by RO)
• Concentration and/or pre-concentration. For example, milk concentration, whey
protein concentration by removing water and whey permeate
• Diafiltration. The desalination of a solution by the addition of a pure solvent
(water). Salts and lactose are extracted during the separation process (Spreer,
1998)
• Fractionation. The separation of micro molecules, from macro molecules and
small compounds (e.g., salts) in solutions.
The design steps for an empirical ultrafiltration plant (She, 1998) are the same for most
membrane filtration process designs and some ofthose are:
By:
Selection of the membranes
The configuration of the plant.
To achieve:
The required process throughput
The required purity of the different components in retentate or permeate.
While:
Minimise the total cost
Optimise the controllability of the plant.
A variety of membrane systems are available for use in the recovery of resources and
each has its own advantages and disadvantages.
There are numerous constraints on the process:
• The product must remain liquid
4-20

• The concentration is limited by the osmotic pressure difference across the
membrane or retentate viscosity
• The maximum trans-membrane and cross-membrane pressure drops must be
within those specified by the membrane manufacturer
• Standard membranes must be used wherever possible to ensure the availability
of replacement
• The run lengths are limited to about eight hours, or perhaps 16 hours for cold
processes, because of the possible bacterial growth.
A pre-requisite is that the particles, that may foul the membrane, such as cheese or
casein fines, should be removed.
The utilities required for this process are electricity and demineralised water.
Decisions Factors in Membrane Separation Design
In general, the following factors affect the performance and efficiency in any membrane
separation when designing.
a) The temperature at which the plant should be operated. The temperature is one of the
major influences on viscosity. Viscosity has significant effect on the permeate flux
because permeate flux is inversely proportional to the permeate viscosity (She,
1998). It is mostly recommended to increase temperature as much as possible simply
because the flux increases with temperature (Wagner, 2001). A larger area is
required at the low temperature but microbial quality is better and the CIP costs are
lower as longer run times are possible. Temperature is inversely proportional to the
permeate viscosity.
b) Feed stream chemical composition. Suspended solids represent a potential problem.
Certain chemicals can degrade the polymer membrane or its supports (this is a
problem of CIP chemical selection).
c) Membrane area. The permeation rate is proportional to the membrane area.
d) The characteristics of the membrane surface also need to be taken into consideration.
These include hydrophobic, hydrophilic membrane surfaces, modified surface charge
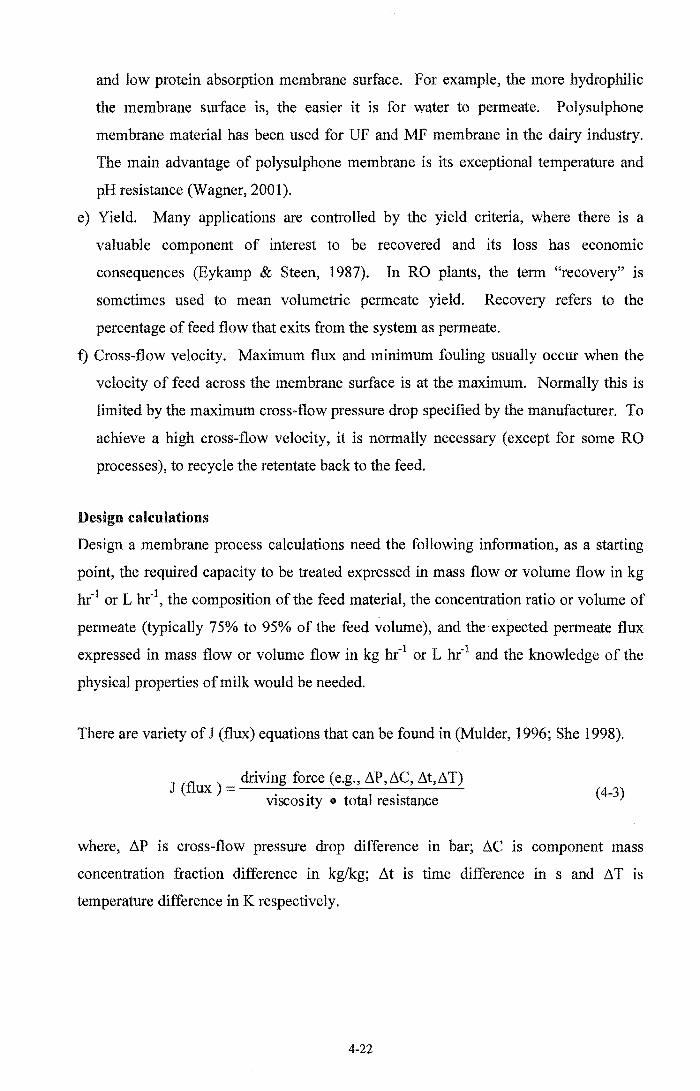
and low protein absorption membrane surface. For example, the more hydrophilic
the membrane surface is, the easier it is for water to permeate. Polysulphone
membrane material has been used for UF and MF membrane in the dairy industry.
The main advantage of polysulphone membrane is its exceptional temperature and
pH resistance (Wagner, 2001).
e) Yield. Many applications are controlled by the yield criteria, where there is a
valuable component of interest to be recovered and its loss has economic
consequences (Eykarnp & Steen, 1987). In RO plants, the term "recovery" is
sometimes used to mean volumetric permeate yield. Recovery refers to the
percentage of feed flow that exits from the system as permeate.
f) Cross-flow velocity. Maximum flux and minimum fouling usually occur when the
velocity of feed across the membrane surface is at the maximum. Normally this is
limited by the maximum cross-flow pressure drop specified by the manufacturer. To
achieve a high cross-flow velocity, it is normally necessary (except for some RO
processes), to recycle the retentate back to the feed.
Design calculations
Design a membrane process calculations need the following information, as a starting
point, the required capacity to be treated expressed in mass flow or volume flow in kg
hr- l or L hr"l, the composition of the feed material, the concentration ratio or volume of
permeate (typically 75% to 95% of the feed volume), and the expected permeate flux
expressed in mass flow or volume flow in kg hr-l or L hr- l and the knowledge of the
physical properties of milk would be needed.
There are variety of J (flux) equations that can be found in (Mulder, 1996; She 1998).
J (flux) = drivi~g fo~ce (e.g., AP,~C, Llt,LlT) VISCOS lty • total reSIstance (4-3)
where, LlP is cross-flow pressure drop difference in bar; LlC is component mass
concentration fraction difference in kg/kg; Llt is time difference in sand Ll T is
temperature difference in K respectively.
4-22

For designing the flux, if no flux data is available, a guess must be made. If in doubt, a
low flux value should be used (Wagner, 2001). Below are the recommended ranges
from Wagner (2001) and the values considered in this thesis which are in brackets.
JRO 15 to 25 L m-2 h-l (21 L m-2 h-I)
JNF 20 to 30 L m-2 h-1 (25 L m-2 h- l)
JUF = 25 to 50 L m-2 h-1 (30 L m-2 h- l)
JMF =There is not a general rule (13 L m-2 hoi)
Classification of Cross-Flow Membrane Separations and Their Applications
A number of different types of pressure driven membrane separation technology have
been employed in the dairy process industry, classified into five main categories. These
five main categories refer to the size of the pores in the membrane filter medium. Each
one serves a range of specific separation functions in various sectors of the food
industry, especially in the dairy industry.
Table 4-2 gives some examples of membrane separation processes used in the dairy
industry.
4-23
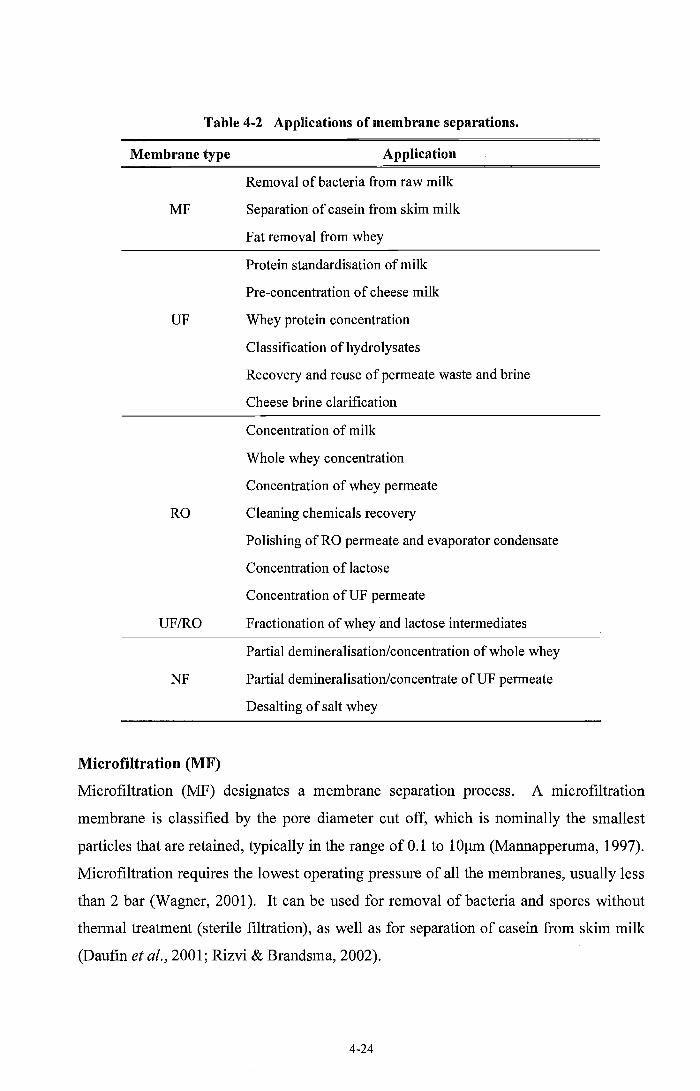
Table 4-2 Applications of membrane separations.
Membrane type Application
Removal of bacteria from raw milk
MF Separation of casein from skim milk
Fat removal from whey
Protein standardisation of milk
Pre-concentration of cheese milk
UF Whey protein concentration
Classification of hydrolysates
Recovery and reuse of permeate waste and brine
Cheese brine clarification
Concentration of milk
Whole whey concentration
Concentration of whey permeate
RO Cleaning chemicals recovery
UFIRO
Polishing of RO permeate and evaporator condensate
Concentration of lactose
Concentration of UP permeate
Fractionation of whey and lactose intermediates
Partial demineralisationlconcentration of whole whey
NF Partial demineralisationlconcentrate of UP permeate
Desalting of salt whey
Microfiltration (MF)
Microfiltration (MF) designates a membrane separation process. A micro filtration
membrane is classified by the pore diameter cut off, which is nominally the smallest
particles that are retained, typically in the range of 0.1 to lOllm (Mannapperuma, 1997).
Microfiltration requires the lowest operating pressure of all the membranes, usually less
than 2 bar (Wagner, 2001). It can be used for removal of bacteria and spores without
thermal treatment (sterile filtration), as well as for separation of casein from skim milk
(Daufin et al., 2001; Rizvi & Brandsma, 2002).
4-24

Microfiltering milk can improve the cheese yield and product consistency by
concentrating the whole milk into the cheese milk (Bylund, 1995; Nordmark, 2002).
This is because the retentate is concentrated in casein protein, a key component of
cheese, while the permeate contains a "clean" source of whey protein and lactose that
contains none of the enzymes and cultures used during cheese manufacture.
Ultrafiltration (UF)
Ultrafiltration (UF) is used for the separation of large molecules or macromolecules
from a liquid phase. In the dairy industry, such large molecules are mainly proteins but
UF may also trap enzymes and micro-organisms (Eykamp & Steen, 1987; Bylund,
1995; Wagner, 2001). A transmembrane pressure difference in the range of 1 to 10 bar
drives ultrafiltration (Bylund, 1995).
Ideally, all the membrane pores would be of the same size, but this does not occur in
practice. The molecular weight cut off is an indirect measure of the pore size (She,
1998). The molecular weight cut off is the molecular weight of the smallest molecule,
90% of which is retained by the membrane. The molecular weight cut off for
ultrafiltration ranges from 1000 to 500000 (Mannapperuma, 1997). Protein and fat
molecules are retained while lactose, water, and minerals pass through the membrane.
Figure 4-7 is a representation of the ultrafiltration membrane separation where
diafiltration water (DF) is often employed to enhance the separation by washing out
more of the permeable components (Winchester, 1996). For example, demineralised
water is used to reduce the lactose and ash content to the desired level in the retentate.
Diafiltration water
Liquid
Permeate or filtrate
Figure 4-7 Schematic representation of ultrafiltration membrane separation with
diafiltration (it also applies to nanofiltration and microfiItration).
4-25

In the dairy industry, ultrafiltration is extensively used. Uses include the protein
standardisation of milk, the pre-concentration of cheese milk where whey proteins are
entrapped and hence there are higher yields and higher fat recovery. Subsequently,
there is less volume to process. Danish feta cheese is produced in this way. UF is also
used for the classification of hydrolysates and the separation of whey protein from whey
to produce whey protein concentrate (WPC) and valuable co-products. Ultrafiltration is
used in the production of whey protein concentrate (WPC) to purify and concentrate
whey from 0.6% protein in the feed to 80% protein in the product, and in milk protein
concentrate (MPC) to purify and concentrate casein and whey protein from 3.5% in
skim milk to 85% in the product.
Nanofiltration (NF)
Nanofiltration (NF) is an area of increasing opportunities in the dairy industry. It
retains the solute molecules ranging from 100 to 1000 in molecular mass
(Mannapperuma, 1997).
Nanofiltration is used on an industrial scale to separate mixtures of proteins and
peptides on the basis of molecular weight. It is also used to achieve the mineral
reduction of whey, purification and demineralisation of whey and lactose and
conversion of salt whey. It is an alternative to dectrodialysis. Nanofiltration uses
operating pressures of 5 to 35 bar (Wagner, 2001; Mannapperuma, 1997). Diafiltration
water can also be used with nanofiltration to improve the purity of the retentate product
such as the desalting of salty cheese whey (Field, 1996).
Nanofiltration was recently shown to be more effective than microfiltration,
ultrafiltration, decantation and centrifugation for the regeneration of an industrial
alkaline solution (Dresch et al., 1999). Nanofiltration is a cost effective alternative to
evaporation for pre-concentration of whey up to 18% to 22% solids and at the same
time removes up to 40% of the whey minerals (de Lataillade, 2003).
4·26
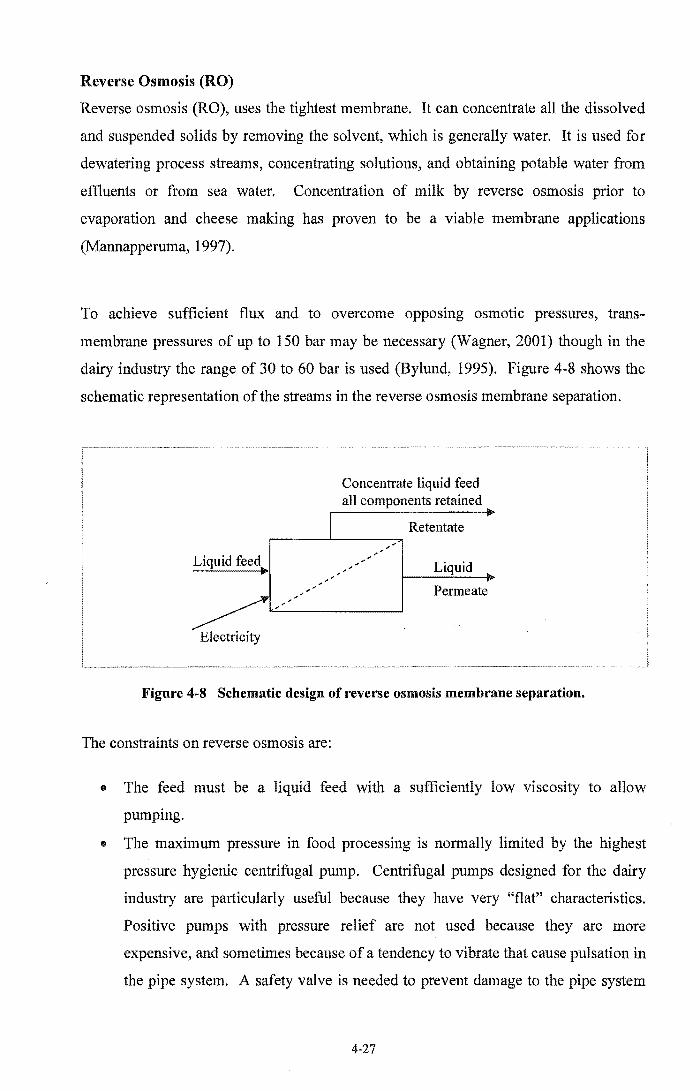
Reverse Osmosis (RO)
Reverse osmosis (RO), uses the tightest membrane. It can concentrate all the dissolved
and suspended solids by removing the solvent, which is generally water. It is used for
dewatering process streams, concentrating solutions, and obtaining potable water from
effluents or from sea water. Concentration of milk by reverse osmosis prior to
evaporation and cheese making has proven to be a viable membrane applications
(Mannapperuma, 1997).
To achieve sufficient flux and to overcome opposing osmotic pressures, trans
membrane pressures of up to 150 bar may be necessary (Wagner, 2001) though in the
dairy industry the range of 30 to 60 bar is used (Bylund, 1995). Figure 4-8 shows the
schematic representation of the streams in the reverse osmosis membrane separation.
Liquid feed ..
Electricity
Concentrate liquid feed all components retained
Retentate
Liquid
Permeate
Figure 4-8 Schematic design of reverse osmosis membrane separation.
The constraints on reverse osmosis are:
• The feed must be a liquid feed with a sufficiently low viscosity to allow
pumpmg.
• The maximum pressure in food processing is normally limited by the highest
pressure hygienic centrifugal pump. Centrifugal pumps designed for the dairy
industry are particularly useful because they have very "flat" characteristics.
Positive pumps with pressure relief are not used because they are more
expensive, and sometimes because of a tendency to vibrate that cause pulsation in
the pipe system. A safety valve is needed to prevent damage to the pipe system
4-27

and the membranes. Positive displacement pumps should be avoided if not
strictly necessary (Wagner, 2001)
• The osmotic pressures must be sufficiently lower than the trans-membrane
pressure. The osmotic pressure of the retentate is limited to about 30 bar; this
typically limits the retentate concentration to about 15% for lactose and 25% for
milk total solids
• The particle size should be less than 0.1 mm only, though preferably there should
be none.
The required utility is electricity.
The economics are dominated by the initial cost of membranes and then by their
replacement at intervals of about 2 years (Morison & She, 2003). The cost of electrical
energy can also be high due the use of high pressure pumps (Eykamp & Steen, 1987).
Reverse osmosis gives options for process integration. It provides clean water while
concentrating a product or waste stream, for example:
• concentration of milk, whey, whey permeate and lactose solution with
production of clean water
ED recovery of water from effluent while reducing effluent volumes. There can be
some leakage so permeate is not pure water but can be used for rinsing and with
further treatment can be used as potable water. An example is effluent reduction
when whey is recovered from casein wash water.
Electrodialysis Membrane Separation (ED)
The driving force for the electrodialysis membrane separation process is an electric
field. The ions move in an aqueous solution. Ions of one charge can be removed from
solution by means of synthetic polymer membrane containing ion exchange groups. For
example, the anion exchange membranes carry cationic groups which repel cations and
are permeable only to anions. Similarly, the cation exchange membranes carry anion
groups which repel anions and are permeable to cations only. The anions and cations
will migrate until they come to a selectively impermeable barrier. They will then be
discharged from the cell (Howell, 1990; Glover, 1986). A schematic representation of
4-28
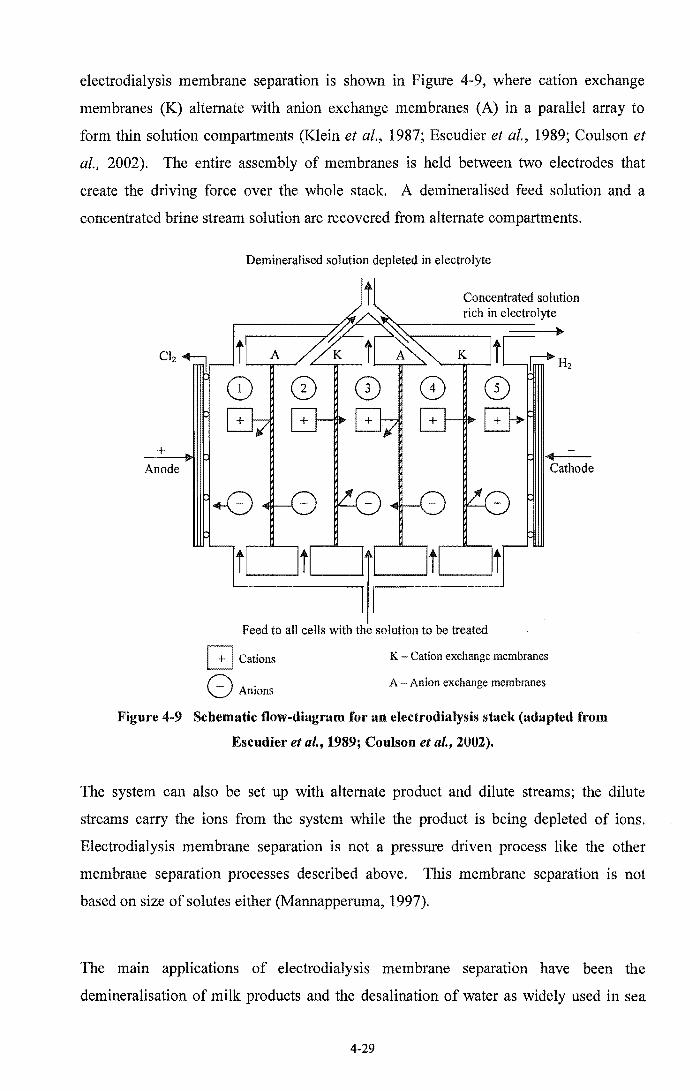
electrodialysis membrane separation is shown in Figure 4-9, where cation exchange
membranes (K) alternate with anion exchange membranes (A) in a parallel array to
form thin solution compartments (Klein et al., 1987; Escudier et ai., 1989; Coulson et
al., 2002). The entire assembly of membranes is held between two electrodes that
create the driving force over the whole stack. A demineralised feed solution and a
concentrated brine stream solution are recovered from alternate compartments.
+ Anode
Demineralised solution depleted in electrolyte
Cations
8 Anions
Concentrated solution rich in electrolyte
Cathode
K Cation exchange membranes
A Anion exchange membranes
Figure 4-9 Schematic flow-diagram for an electrodialysis stack (adapted from
Escudier et al., 1989; Coulson et al., 2002).
The system can also be set up with alternate product and dilute streams; the dilute
streams carry the ions from the system while the product is being depleted of ions.
Electrodialysis membrane separation is not a pressure driven process like the other
membrane separation processes described above. This membrane separation is not
based on size of solutes either (Mannapperuma, 1997).
The main applications of electrodialysis membrane separation have been the
demineralisation of milk products and the desalination of water as widely used in sea
4-29

water desalination (Kessler, 1981; Andres et al., 1995; Mannaperuma, 1997). Some
products like baby food and special diets for adults require milk demineralisation
(Kessler 1981).
Electrodialysis (ED) and ion exchange (IX) processes are used in the demineralisation
of whey and whey protein concentrates, where the salts have negative effects on the
functionality, the organoleptic properties and the value of the final products, most of
which are used in children's foods. ED and IX are sometimes combined in the
manufacture of these kinds of products in the dairy industries. Electrodialysis is used
first in order to demineralise until 65% to 75%, after which ion exchange is used to
remove the remainder minerals. This way of operating avoids the quick depletion of IX
columns. Its disadvantage is that the removal of chloride, sodium and potassium ions
are accomplished by partial elimination of other desirable ions such as calcium, which
must be added after the ED step (Andres et al., 1995).
Electrodialysis can be used with nanofiltration as an alternative to ion exchange in the
desalting of cheese whey (Mannapperuma, 1997). Not only salt solutions may be
desalted and concentrated, but also the acids. More recently, ultrafiltration, reverse
osmosis and nanofiltration have been used in preference to electrodialysis for similar
applications. For example, UF (Morison,2003, personal communication) and NF
(Wagner, 2001) have been used for desalting salt cheese whey.
Environmental Applications of Membrane Separation
Membrane separations offer opportunities for reduction III effluents streams by
concentration of effluent or by waste minimisation. Membranes can be used for water
recovery since the discharge of millions of litres per day are typical in the dairy
industry. There are tight environmental constraints on the allowable quantity and
quality of water discharged to land or waterways. The minimisation of volume and
suspended solids can be critical to the economics of projects. Even a low grade and
relatively low value by-product can be less of a cost than a dilute waste stream. Water
recovery and production of by-products are the challenges for a process design
methodology.
4-30
Examples of opportunities include:
• RO concentration of effluent while producing clean water. This can reduce the
liquid load and storage requirements in effluent treatment or disposal systems.
Ell RO concentration of casein wash water producing a valuable animal feed and
demineralised water
• RO concentration of any milk based stream to reduce evaporation energy
requirements while producing demineralised water
• NF or UF removal of solids from used cleaning solutions to enable chemical
reuse.
The water produced from RO plants is clean enough to be used directly in cleaning
systems, but not for the final rinse.
4.2.2 Centrifugal Separations
Centrifugal separation is a process that enhances settling by applying centrifugal
acceleration. It enables the slow batch process of gravity separation to be replaced by a
much faster continuous process. High centrifugal forces are applied. For example, a
separator that is used for decreaming rotates at 6000 rpm to 7000 rpm (Spreer, 1998).
It is used in the dairy industry for the separation of fat from milk and whey, for removal
of solid contaminants from milk, and for the separation of slurries such as casein curds
and whey.
Both gravity and centrifugal separation processes are governed by Stoke's law which
for gravitation settling is:
where:
Vg particle settling or flotation velocity [m S-l]
d particle diameter [m]
Pp particle density [kg m-3]
PI density of the continuous phase [kg m-3]
4-31
(4-4)

a == acceleration from gravity or centrifugal action [m S"2]
11 = viscosity of the continuous phase [kg m"Is"I]
From the equation, it is clear that the particle sedimentation velocity increases by:
• Increasing the particle diameter
• Decreasing the viscosity of the continuous phase
• Increasing the difference in density between the two phases
• Increasing a.
Centrifugal separations according to physical conditions
The most common liquid-liquid separation is that of fat, as cream, from whole milk. Fat
globules have a wide size distribution and the small globules move slowly and are
difficult to separate. In practice separation of fat globules less than approximately 1 ~m
is difficult under normal conditions. In commercial operations, the milk serum phase
(skimmed milk) usually has a fat content in the range of 0.04% to 0.06% (Lewis, 1986b;
Towler, 1986), though Bylund (1995) gives 0.09% fat content.
Liquid-solid separation can be achieved using a clarifier, decanter, filter-screening
centrifuge or hydrocyclone. 'Clarifier' is the term used to describe a centrifugal
separator with a vertical axis and which is designed to remove small fractions of
particles. The solids are discharged as a slurry. For example, clarifiers are used to
remove the cheese fines from the whey and foreign material from raw milk.
Bactofugation (e.g., Bactofuge offered by Tetra Pak) is used by many companies such
as a United States specialty cheesemaker. Bactofugation is a mechanical reduction of
bacteria. Bactofuge is installed in series with the centrifugal separator, either
downstream or upstream of it and the same temperature is often chosen, i.e. typically 60
°C to 63 °C (Bylund, 1995). A Bactofuge is an example of a clarifier used for removal
of microbes based on their higher density, specially for spore-forming cells or spores, as
they have higher densities. It enables almost complete separation of this group of
micro-organisms (Spreer, 1998). It is also used now to improve the bacteriological
quality of milk intended for other products like cheese, milk powder and whey for baby
food.
4-32
'Decanter' is the term used to describe a centrifugal separator with a horizontal axis,
which is designed to separate slurries containing a high fraction of solid material. The
solids are normally discharged as a "dry" material. Applications include separation of
lactose crystals from "mother liquor" and separation of casein curds from wash water.
The decanters used in the dairy industry are the decanting centrifuge or the conveyor
bowl centrifuge.
Hydrocyclones rely on the rotation of the fluid to produce centrifugal acceleration
which separates solid particles. The fluid viscosity must be low enough, and density
difference high enough to allow separation with relatively low acceleration.
Centrifugal liquid-gas separation uses hydrocyclones and deaerators. Applications
include the separation of air from the incoming whole milk by a de aerator with
tangential feed, and separation of vapour from concentrate in a milk evaporator. In this
second application the vessels are normally known simply as "separators".
Centrifugal gas-solid separation is carried out in cyclones, a typical example being the
separation of air from milk powder after spray drying.
4.2.3 Evaporation
Evaporation is the removal of solvent in the form of vapour from a solution or slurry.
For the majority of applications, the solvent is water. Evaporation often overlaps the
operations of distillation, drying and crystallisation (Minton, 1986). The main objective
of evaporation in the dairy industry is to remove water in order to increase the solids
content of the liquid milk products containing dissolved, emulsified or suspended
constituents.
Evaporation finds wide applications in the dairy industry, such as to concentrate milk,
whey proteins, and lactose prior to drying. Typical applications of evaporation are to:
1. Reduce the bulk volume for storage or transport
2. Improve the shelf life
4·33

3. Change the product chemically or physically into a form more suitable for some
end uses
4. Increase the product viscosity
5. Minimise the drying energy requirement. From the point of view of expenditure
of energy, it is more economical to dry the previously concentrated products
6. Concentrate for a subsequent crystallisation process, e.g., in lactose production
7. Concentrate to reduce volumetric flow, e.g., for a subsequent ion exchange
process.
Table 4-3 also shows the moisture content for evaporated milk with two different fat
compositions and for milk products like skim milk, buttermilk and whey which are
going to be subsequently dried to produce milk powders (Kessler, 1981; Hall &
Hedrick, 1971). A moisture content of 50% to 60% is needed for milk products which
are going to be subsequently dried to produce milk powder.
Table 4-3 The final moisture content of some milk products after evaporation
(Kessler, 1981).
Totals Products moisture content
Product solid
Before After TS%
Evaporated milk 10% fat 87% 67% 33%
Evaporated milk 7.5% fat 87% 75% 25%
Whole milk 87% 50-60% 50-40%
Skim milk 91% 50-60% 50-40%
Buttermilk 90% 50-60% 50-40%
Whey 94% 50-60% 50-40%
For many years now the tubular falling film evaporator has been the main type of
evaporator installed in the dairy industry. These and other common types of
evaporators have been described by several authors (e.g., Minton, 1986; McCabe et ai.,
1993).
4-34
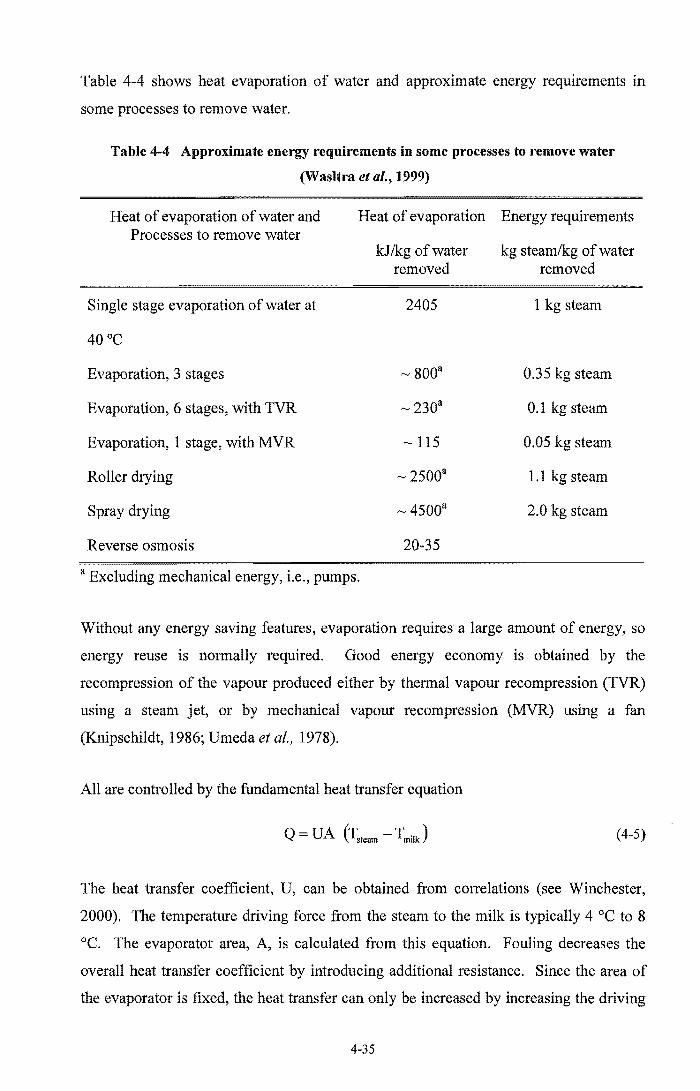
Table 4-4 shows heat evaporation of water and approximate energy requirements in
some processes to remove water.
Table 4-4 Approximate energy requirements in some processes to remove water
(Wasltra et al., 1999)
Heat of evaporation of water and Processes to remove water
Heat of evaporation Energy requirements
Single stage evaporation of water at
Evaporation, 3 stages
Evaporation, 6 stages, with TVR
Evaporation, 1 stage, with MVR
Roller drying
Spray drying
Reverse osmosis
a Excluding mechanical energy, Le., pumps.
kJlkg of water removed
2405
~ 800a
~230a
~ 115
~ 2500a
~ 4500a
20-35
kg steam/kg of water removed
1 kg steam
0.3 5 kg steam
0.1 kg steam
0.05 kg steam
1.1 kg steam
2.0 kg steam
Without any energy saving features, evaporation requires a large amount of energy, so
energy reuse is normally required. Good energy economy is obtained by the
recompression of the vapour produced either by thermal vapour recompression (TVR)
using a steam jet, or by mechanical vapour recompression (MVR) using a fan
(Knipschildt, 1986; Vmeda et al., 1978).
All are controlled by the fundamental heat transfer equation
Q = VA (Tsteam - Tmilk ) (4-5)
The heat transfer coefficient, V, can be obtained from correlations (see Winchester,
2000). The temperature driving force from the steam to the milk is typically 4 °C to 8
°C. The evaporator area, A, is calculated from this equation. Fouling decreases the
overall heat transfer coefficient by introducing additional resistance. Since the area of
the evaporator is fixed, the heat transfer can only be increased by increasing the driving
4-35

force, so the steam temperature must be increased. This however tends to increase the
rate of fouling.
Design Specifications
The evaporator must be designed to increase the total solids (TS) of a specified feed to a
specified product concentration at a specified throughput. The evaporator must have
sufficient surface area to achieve the required amount of evaporation. The final total
solids content achieved must meet the specifications of the following process step or of
the product. In cases where drying follows, high total solid contents are desirable to
maximise energy efficiency, and to give the desired particle characteristics.
Based on the conservation of mass
(4-6)
or
(4-7)
and
. . (1 xfeed: mevap = mfeed . --
. X cone
(4-8)
Where rids mass flow rate of the solution in kg S·l and x is mass fraction. The
evaporation mass flow rate is the difference of the feed and the concentrate flow rates.
Constraints on operation and design of evaporators
It could be said that the design of evaporators is driven by the constraints as much as the
design specification. A number of constraints are given below, grouped into different
types. The constraints naturally lead to the practical requirements that the process
should be continuous.
The flow rate through each tube must be above the minimum flow rate that is required
to completely wet the tube, otherwise, low heat rates of heat transfer and excess fouling
will occur (Paramalingam et ai., 2001).
4-36

Constraints of the product on the evaporation process
• Residence time must be minimised because of the potential thermal damage of
milk
• The temperature should be kept below approximately 70 DC as the protein can be
damaged (denatured) by higher temperatures and rapid fouling then occurs
(Winchester, 2000)
• Fouling typically prevents the evaporation from running for more than about 20
hours continuously
• Areas of liquid hold-up must be avoided as bacteria can grow at most of the
temperatures that exist in an evaporator
• Product cannot be recycled as this can increase bacterial growth.
The constraints of the process on the product
• One important operational constraint is falling film breakdown (Winchester,
2000). Film breakdown is the condition where a thin liquid film fails to wet
completely the falling film evaporator surface. This is usually exhibited by the
formation of dry spots in the flow (Bohn & Davis, 1993). These dry spots break
down into a series of rivulets in which the full upstream flow is conveyed into
thin fingers of liquid (Ponter et al., 1967; Trela, 1994; El-Genk & Saber, 2001).
The result is reduction of contact area and mass transfer, and thus reduces
evaporator efficiency (Kessler, 1981; Hoke & Chen, 1992). This constraint of
the process on the product has been the object of many investigations (Hartley &
Murgatroyd, 1964; Lyu & Mudawar, 1991; Penn et al., 2001; Michalski &
Briard, 2003).
• The feed must be liquid with a sufficiently low viscosity to allow pumping.
The utilities required for evaporators are stearn, electricity and cooling water but the
amounts of each is very dependent of the type of evaporator chosen.
Although evaporation is a very efficient operation due to the heat recovery in multi
effects evaporators, it is not as energy efficient as membrane processes. In some cases a
combination of membrane separation followed by evaporation can be capital and energy
4-37

efficient. Given the large amounts of energy and water used or generated, evaporation
is a good candidate for heat integration, heat recovery and water (condensate) recovery.
4.2.4 Drying
Drying or dehydration is one of the major processes for food preservation used
worldwide for centuries. Drying is the removal of water or other volatile liquids from a
liquid, slurry or wet solid. The removal of liquid by thermal drying could be more
costly than by mechanical separation techniques (Sinnott, 2000). The drying process
influences the quality of the final product (Crapiste & Rotstein; 1997; Walas, 1990).
Drying has the highest energy requirements per ton of finished product of all commonly
used dairy processes (Knipschildt, 1986).
There are several reasons for converting liquid food products (e.g., milk) into powders.
The three most important reasons are:
1. The removal of the medium (water) that promotes the growth of pathogens produces
a durable product (Le., improved shelflife).
2. Reduction in weight and volume lower the cost oftransportation and storage.
3. The product needs to be changed chemically or physically into a form more suitable
for some end uses.
Types of Drying in the Dairy Industry
Two drying methods are used more frequently than others in the dairy industry. The
first method is spray drying. The air temperature that spray driers require is in the range
of 150°C to 200 °C (Kessler, 1981). The second method is fluidised bed drying. In a
fluidised bed drier, the solid particles are maintained suspended against gravity in an
upwards-flowing air stream. A fluidised bed drier can be connected to the bottom of the
spray drying chamber and can be vibrated by a motor to convey the powder along the
length of the drier (Bylund, 1995). There may also be a horizontal component in the
airflow to convey the milk material through the drier (Earle, 1983). Fluidised bed
drying uses steam, hot air and cold air. The air temperature that these driers require is
in the range of 50°C to 130 °C (Kessler, 1981).
4-38

Spray driers convert liquid feed to solid product, generally in two stages. They are fed
with liquid with 45% to 50% total solids content (TS) and dry this to about 93% TS.
Then the fluidised bed drier takes the solid feed and dries this to the final dried product
containing perhaps 96% TS.
From the energy point of view driers are less energy efficient than evaporators (Earle,
1983). In situations where the moisture has been significantly reduced, fluidised bed
driers become more efficient than spray driers in removing the remaining moisture. In
addition the capital and maintenance cost are low because of their simple design with
few moving parts (Crapiste & Rotstein, 1997).
Spray Drying
This process involves the pumping of feed to a rotary or pressure atomiser thus
converting the liquid into a spray of droplets. The droplets are directed into a controlled
flow of hot drying air, and rapid moisture evaporation from each droplet occurs. As
moisture is removed, each droplet forms a particle. High viscosity milk concentrates
seem to have several detrimental impacts on the operation of the spray drier. The spray
particles from the spray drier nozzles are larger, causing larger powder particle sizes.
The particle evaporation mass transfer and heat transfer coefficient are low and these
cause the spray particles to have a higher moisture ·content~
There are four stages involved in spray drying:
1. Atomisation. The objectives of the atomisation are to form spray droplets with a
consistent size distribution but with a sufficiently wide range to give high bulk density
with a low proportion of fines. Uniform particles provide superior instantising
products, reduced product losses and less over-drying and under-drying.
A consistent feed viscosity, and hence total solids content, is required to give consistent
atomisation and particle properties. Total solids content should be high, for energy
efficiency and because low feed viscosity gives fine powder with an undesirable low
bulk density.

2. Hot air contact. There are three forms to hot air contact, co-current flows, counter
current flows and mixed flows (Kessler, 1981). For spray drying of milk powders co
current flow is always used as this leads to lower product temperatures. The air for
drying is filtered and heated before it contacts the atomised product (Hall & Hedrick,
1971).
3. Evaporation. Only a short period of time is necessary to complete the removal of
moisture and for the particle to acquire its final shape and structure. Typical residence
times are 5 to 10 seconds.
4. Product recovery. This involves the separation and recovery of the dry milk
particles from the drying air leaving the chamber. The powder is recovered from the
base of the drying chamber and from the associated collectors such as cyclones (Zhao,
1999) or bag filters.
All of these four main process stages have an effect on the final properties of the
product, such as the mean particle size, bulk density, "flowability" and visual
appearance (colour).
Design calculations
Design calculations need the following information, as a starting point, the required
capacity expressed in mass flow in kg hr- l or volume flow in L hr- l, the composition of
the feed material, the required total solids content for the product, product specification
and the knowledge of the physical properties of milk would be needed. Drying is
basically a heat exchange operation and rate of transfer follows the normal type of
equations.
Energy efficiency of spray driers
The moist air from the spray dried cannot be reused. So, it is discharged to the
atmosphere. One measure of the energy efficiency of a drier is given by equation 4-9
(Winchester, 2000).
4-40
(4-9)
where:
Tin = temperature of hot inlet air caC)
Tout = temperature of discharged air from spray drier caC)
T amb = temperature of ambient air entering the spray drier (0C)
A typical spray drier working with milk will use steam heated air of approximate 200°C
and will discharge the air at 60°C with an ambient temperature of25 °C (Winchester,
2000).
Computational fluid dynamics (CFD) has become a real design tool that can provide a
description of the patterns of flow and droplet movement in the drying chamber. This
helps the understanding of air flow and the interaction with the atomised droplets.
Considerable work has been performed recently in computational fluid dynamics, which
enables considerable insights into the detailed design of spray drying chambers by
Oakley & Bahu (1993). Particular applications include tighter design of spray driers
and reducing operational problems, such as wall deposition. Langrish & Fletcher
(2001) have reviewed particular issues in the use of spray drying for food ingredients.
These include aroma loss, thermal degradation and particle stickiness. They have
demonstrated that CFD techniques give useful predictions of the deposition of particles
on walls and have used this knowledge to design preventative measures.
One of the problems of spray drying is powder adhesion on the walls and roof of the
spray drier. These deposits are unwanted because they become burnt, thus degrading
the powder quality. Then they must be removed by washing, which causes down-time
and production of effluent. Fires and explosions are the main hazards in a drying
operation (Crapiste & Rotstein, 1997). Wall depositions not only reduce quality and
yield, but it may also pose a potential fire risk and compromise hygiene requirements
(Langrish & Fletcher, 2001). Overheating of the spray drier particles appears to be the
cause of the product milk powder burning (Winchester, 2000). Various design ideas
have been introduced over the years to prevent or remove deposit formation, like
brooms, secondary air flows, and scrapers. In spray driers, the particle motion is highly
4-41

complex as millions of particles move in a local environment of continually changing
temperature and humidity. Often designing flexibility into the spray or air flow
direction enables subsequent adjustment to minimise wall adhesion.
Others Types of Drying
Others types of drying that could be used in dairy processing are freeze drying and
roller drying. Freeze drying concentration involves freezing the product followed by
sublimation of water vapour under a high vacuum. Suitable temperatures and pressures
must be established in the drier to ensure that sublimation occurs (Earle, 1983). In
freeze drying there is no heating damage. The food structure is better maintained under
these conditions but this process has not been developed for large scale processing
(Varnam & Sutherland, 1994; Garcia et at., 1999).
Roller drying involves spreading the feed over the surface of a heated roller. The roller
rotates and after less than a single rotation, the water in the milk evaporates and dried
milk falls or is scraped off from the roller and is ground into flakes. It is not popular
because of its relatively small scale, the mechanical complexity and the form of the
product. Roller drying can only be used for liquid products, which can either have a
low viscosity or be highly viscous to paste-like (Kessler, 1981). A large part of roller
dried whole milk powder is destined for chocolate manufacture because milk fat is
generally added to milk chocolate in the form of crumb (Kaylegian & Lindsay, 1995).
4.2.5 Ion Exchange
Ion exchange is a low temperature separation process in which specific ions are
adsorbed from solution onto ion exchange resins. It is typically a high cost separation
reserved for high value products. For this economic reason, it is not often used in the
dairy industry (Kessler, 1981). It is a very well known demineralisation technology. It
has the ability to remove almost all of the ions in whey and permeate (Hoppe &
Higgins, 1992) and can also be used to separate charged proteins from solution.
Ion exchange of whey protein concentrates are being used commercially to produce low
fat products known as whey protein isolates (Etzel, 1995; University of Guelph, 2003).
Ion exchange is also used for the removal of calcium from milk (Holsinger, 1997). The
4-42

calcium phosphate crystals recovered by this process can be marketed as milk minerals
(de Lataillade, 2003). The most important applications are the softening (calcium
removal) of water, industrial process water de mineralisation for boiler feed water and
other process water, material recovery from industrial waste water and whey protein
fractionation. An extensive history of ion exchange treatment exists in the metal
industry (recovery of precious minerals, e.g., gold, uranium, copper and silver),
recovery of common metals and heavy metal removal (Dietz, 1996; Wankat, 1990).
Ion exchange is used for whey protein fractionation. An example of whey protein
fractionation is the isolation of ~-lactoglobulin and a-lactalbumin by eluting from a
cation exchanger and using different pH values for eluting the proteins as separate
fractions without using salt elution (Etzel, 1999). Methods of separating and recovering
proteins from a protein solution with the preselected ion exchanger have been described
(Ayers et ai., 2003).
An appropriate resin must be selected for the process. Resins are normally classified as
cation resins (used to remove cations from solution) or anion resins (used to remove
anions). Cation resins will typically exchange H+ or Na+ ions for the divalent cations
Ca2+, Mg2+ or similar ions while anion resins typically exchange OH- ions for anions
like cr.
Ion exchange resins are insoluble polymers and they are usually packed into beds
through which the liquid flows. After the resin has been "exhausted" it must be
regenerated by adding an appropriate high concentration solution. The two-stage nature
of this process requires that ion-exchange almost always be a batch process.
The first ion exchangers used natural zeolites. The first known ion exchanger occurred
in inanimate soils, sands and rocks and in living organisms (Helfferich, 1962). The
popularity of ion exchangers has grown over the last few decades and many synthetic
ion exchangers have been developed (Ruthven, 1997; Bolto & Pawlowski, 1987). The
more common are synthetic zeolites and polymeric ion exchangers (Jorgensen, 2002).
4-43

Today the ion exchanger is firmly established as an unit operation and is an extremely
valuable supplement to other procedures such as filtration, distillation and adsorption.
4.2.6 Crystallisation
Crystallisation is employed heavily as a separation process in the chemical industry,
particularly where salt are recovered from aqueous media and also used to recover
product, to refine intermediate chemicals and to remove undesirable salts (Moyers &
Rousseau, 1987; Wankat, 1990). Crystallisation is one of the oldest of unit operations
and is used to produce sodium chloride and sucrose. It can be used as a purifying
process and of providing crystalline materials in a desire size range (Coulson et aZ.,
2002).
Crystallisation is a crystal solidification of some components from a vapour, solution or
molten solid (Perry et al., 1998). In the dairy industry, crystallisation takes place in the
liquid solutions and in the molten solid, though only crystallisation in the liquid
solutions in considered here.
A well formed crystal itself is nearly pure, but it retains "mother liquor" when removed
from the slurry. The impurities of the crystallisation process need to be washed out
using clean solvent water. In practice, much of the retained mother liquor is separated
from the crystal by filtration or centrifuging (McCabe et al.} 1993). Crystallisation is
rarely the last stage in a process and solvent separation, washing and drying stages are
usually required (Coulson et al.} 2002). For example, crystallisation is used for the
production oflactose crystals (Holsinger, 1997).
Crystallisation requires much less energy for separation than distillation or other
commonly used methods of purification (Coulson et al., 2002). In addition,
crystallisation can be carried at low temperatures and on a scale, which varies from a
few grams up to many tons per day (Perry et al., 1998).
4-44

Crystallisation Constraints
.. Crystallisation is a slow process
.. Feed must be completely dissolved
.. Mother liquor adheres to the crystals and requires washing to purify the product.
4.2.7 Precipitation
Precipitation is a separation in which a solid substance is produced in a liquid solution
by forming an insoluble product. Woods (1994) considers protein precipitation as a
coagulation process, but the term used in this study is a precipitation process.
Examples in the dairy industry include precipitation of calcium phosphate by increasing
the pH above about 7.4, precipitation of alpha-lactalbumin by heating, and precipitation
of casein by acid or enzyme treatment.
Casein is precipitated either by acids reducing the pH to about 4.7 or by cleaving part of
the protein with an enzyme while the whey proteins remains in solution, in both cases
allowing casein molecules to coagulate.
4.2.8 Reverse Micellar Separation
Reversed micellar methods offer the potential for continuous extraction of specific
proteins from an aqueous mixture, thus achieving simultaneous concentration and
purification of specific proteins in an efficient manner. This method uses reverse
micellar solvents to achieve protein specific isolations of a-lactalbumin (a-LB) and
immunoglobulin (IgB) due to the charge-charge interactions, the hydrophobic effects
and the size of the protein relative to the droplets. The reverse micellar solvent contains
small droplets of water that are stabilised within an organic solvent by a surfactant.
Because the protein molecules often move from an original water phase into these
small-encapsulated water droplets, reverse micellar extraction is an attractive approach
for separating proteins from an aqueous solution.
California Dairy Food Research Laboratory Center in Davis has successfully separated
~-lactoglobulin (~-LG), a-lactalbumin (a-LB) and immunoglobulin (1gB) using reverse
4-45

micellar droplet phase technology making use of charge-charge interactions and
hydrophobic effects and the size of the protein relative to the droplet (Dairy
Management Inc., 2000).
~-LG and a-LB have desirable functional properties when used as food ingredients,
including the ability to stabilise food emulsions and foams, not to mention the ability to
create protein-based gels. Both of these proteins, as well as 19B, are valuable for their
nutritional qualities and for their possible development into pharmaceutical products
(Dairy Management Inc., 2000).
However despite many years of research, reverse micelle separation IS not used
commercially.
4.3 Mixing or Blending
Blending refers to the intermingling of miscible fluids to produce some degree of
uniformity. Mixing involves the production of uniformity between materials that may
or may not be miscible. Mixing and blending are synonymous for miscible liquids.
Agitation is the most general term, involving the production of fluid motion for
blending, mixing, heat transfer, and mass transfer (Stephenson & Blackburn, 1998;
Rielly, 1997).
Mixing or blending can be defined as "the operation of combining liquid components of
different viscosities and or densities to produce an end product with uniform properties
throughout, such that the final product will not separate into component phases with
time" (McDonough, 1992). Regardless of the type of blending applications, this
process requires an understanding of the characteristics of the material, the starting
conditions, the blend time that the process requires, the tank dimensions and the
required degree of uniformity. Miscible liquids are blended in the relatively small
process vessels by centrally mounted propeller or turbine impellers, or by side-entering
propellers in large vessels, and by jet mixers (McCabe et ai., 1993).
4-46

Mixing is used for combining different products or for the addition of some ingredients
such as vitamins, flavours, fruits and others to enhance the nutritional value of products.
There are several mixing process applications in the dairy industry. For example,
traditionally the milk fat component is standardised by separating the fat from the milk.
The fat is added back at a controlled rate to give a specific fat content in the product.
Protein may also be standardised where the specifications allow, by adding lactose to
reduce the protein: lactose ratio prior to fat addition. Mixing can be done in-line or by
batch mixing in tanks designed to suit the specific application.
There are specifically designed processes with mixed fats products where vegetable or
other animal fats replace the milk fats. Consistency is improved by adding vegetable
fats because the melting point is reduced and very good spreadability is achieved at
refrigerator temperature (Spreer, 1998).
There are two major types of blending and they are:
1. Wet blending. At least one of the components must be liquid or contain high
moisture, for example, the standardisation process described in Section 6.2.3.
This can include dissolution of powders in liquid, or mixing to produce a solid
liquid slurry.
2. Dry blending. All of the ingredients are'dry and must be miscible to obtain
uniformity. Generally, solid-solid mixing is referred to as 'dry blending' in the
dairy industry, for example, the blending of dry powders for the formulation of
baby food.
4.4 Homogenisation as a Special Case of Size Reduction
Size reduction operation such as solid grinding, liquid emulsion, colloid mill and
homogenisation are size reduction operations.
In homogenisation, the milk is exposed to a short period of intense input of mechanical
energy, which breaks the milk fat globules into small globules and disperses them
4-47
through the milk. As a result, a homogenous dispersion of fine fat globules throughout
the milk is achieved. This process operation prevents the formation of a layer of cream
at the top of the milk if the milk is left to stand. The objective is to reduce the size of fat
globules.
Homogenisation is also done with other purposes, for example, to improve flavour, to
increase viscosity, to give a stable gel in yoghurt and to reduce fat separation in ice
cream during freezing (Kessler, 1981).
The homogeniser process technology can be purchased off-the-self from a supplier
rather than designed by the process designer.
4.5 Reaction
Reactions in the dairy industry include:
ED Fermentation of lactose to produce lactic acid
• Enzyme hydrolysis in cheese and rennet casein manufacture
• Enzyme hydrolysis of proteins to produce hydrolysed protein
• Hydrolysis of protein as part of cheese ageing
• Hydrolysis of lactose
• Solubilisation of casein with hydroxides.
Fermentation is the oldest method for preserving milk and it developed independently in
different parts of the world. The responsible micro-organisms differ and the differences
are reflected in the types of cultured milk that they produce (Walstra & Jenness, 1984).
Lactic acid aids in cheese curd formation by reducing the electrical charge on the
protein, acts as a preservative in cheese, butter and yogurts by reducing pH to a level
that prevents unwanted bacterial growth, and contributes to acid flavour of cheese
(McSweeney et ai., 1997). The reaction is also used for lactic acid casein production in
which the pH is reduced to the isoelectric point of casein (PH 4.7), i.e., reducing the
electrical charge to zero, and enabling coagulation (Walstra & Jenness, 1984) and
precipitation of the casein.
4-48

The most important reaction in the dairy industry is of the milk proteins, which involves
destabilisation of the protein micelles. In some cases, these are technologically
desirable reactions, such as formation of a gel either when the pH of the milk is reduced
(e.g., manufacture of fermented milks and acid-set cheese), or when K-casein undergoes
selective proteolysis (e.g., manufacture of cheddar cheese). Other enzymes continue
flavour development during ageing.
Sodium, calcium and ammonium caseinate are produced by the reaction of acid casein
with the corresponding hydroxide, producing a soluble casein-based product that is
usually spray dried.
4.6 Storage
Storage is required in many parts of the process. The combination of temperature and
holding times in the storage is very important. Low temperatures «10 DC) are required
to ensure minimal bacterial growth; between 10 DC and about 60 DC bacteria will grow
in storage facilities. Above 60 DC inactivation of bacteria will occur but also proteins
and enzymes will be denatured.
Milk is stored in tanks of different capacities, these can be any size (up to 500 m3). If
the tanks are placed outdoors they could be insulated if required.
Storage can be classified in three useful categories:
1 At the initial point of the production line
At the end of the season when milk production is lower, the milk is collected from the
farm on alternate days or even less often. This will involve holding milk until sufficient
milk has been collected to carry out an economical process run. The longer storage time
must be considered in the process design because the milk will be older when it is
processed. Quality issues may arise if the storage times and the temperature are not
controlled carefully.
4-49
Milk storage before processing is also required while waiting for routine laboratory tests
for bacteria, antibiotics or composition.
2 Storage within the processing operations
Storage is sometimes required as part of the process operation. For example, a buffer
tank needs to compensate for temporary stoppages in the production or in the packing
line. Also storage is required when processes do not overlap because of different
processing capacities.
3 At the end of the production line
Some products for the export market have to be stored until the shipping volume has
been reached. At this stage the product is normally in a suitable form to enable it to be
stored easily without microbiological problems.
Limitation in storage times
During the storage, the fat and protein in milk may undergo chemical changes in three
ways. The first two are oxidation and lipolysis that degrade the flavours, principally in
milk and butter (Bylund, 1995). Another chemical change is age thickening where the
viscosity of milk concentrates increases as they are held (Winchester, 2000). Therefore,
storage times should be minimised.
4.7 Packaging
Food preservation relies on the process operations designed to stabilise the food
material against food degradation. Influences such as micro-organism spoilage,
interaction with components in the environment such as oxygen, gain and loss of water,
and protection from high or low temperatures cause food quality loss.
In addition, selecting appropriate packaging operations with the preservation and
manufacturing systems are integral components of food process engineering in modem
food distribution and marketing (rung & Britt, 1995). Only those packaging materials
4-50
that are hygienically satisfactory can be used for milk and dairy products. Returnable
packages, e.g. glass containers, can be reused if they can be cleaned adequately
(Kessler, 1981).
The most basic function of packaging is to preserve and protect the product. From a
design point of view, packaging is the protection of the quality in the forms of physical,
mechanical and microbiological protection from contaminants, for the purpose of safe
consumption and intended shelf life use of the product.
The objectives of packaging are the portioning of the products into units that are easy to
handle during storage, transport, and consumption, guaranteeing a certain amount of
product, and transferring information about the product and its origin (Walstra et al.,
1999).
Fresh products, like butter (especially), cheese, frozen cream, ice cream, must be packed
as quickly as possible to avoid breakdown of the structure or contamination by the
ambient air. Newly packed butter needs cold storage facilities to maintain the
temperature below 5 °C (Bylund, 1995; Wilbey, 1986).
Butter is coated on the product side with wax paper or plastic, since oxidation is the
main cause of spoilage. The packing material must be impermeable to odours, since
butter easily takes foreign odours (Kessler, 1981). Many packing materials are used in
the retail market, such as boxes made of wood, cardboard or plastic, as well as metal
cans.
4.7.1 Product Characteristics on Packaging
It is very important to study the characteristics of the products because they will have a
fundamental impact on packaging. There are varieties of packaging materials such as
glass, plastic coated aluminium foil, cellulose, polythene, and polyester. Only
packaging materials which are hygienically satisfactory, non-toxic and chemically inert
with the product can be used for milk and dairy products.
4-51
Secure packaging for milk powder is essential as virtually all dried dairy products are
hygroscopic and will absorb moisture quickly if the bag is improperly sealed. The high
protein content also requires attention to storage temperature, humidity, and light,
because when protein is exposed to light it destroys some essential vitamins and the
amino acid methionine (milk protein component) is degraded to methional giving a
particular off-flavour called sunlight flavour. Therefore, opaque packages such as
plastic and paperboard give good protection under normal conditions (Bylund, 1995).
Fat based products must be protected from light and oxygen to prevent oxidation. Dried
whole milk product packaging must be impermeable to water, light and oxygen in order
to prevent the oxidative changes or rancidity. Anhydrous milk fat (AMP), and whole
milk powders are often packed in an atmosphere of inert gases e.g., N2, CO2 or a
mixture. The residual oxygen content should be less than 3% (Kessler, 1981).
UHT products require sterile packaging and packing equipment. All post-process
handling of products must be within the sterile environment (Bylund, 1995). There are
several different package forms used in aseptic processing: cans, paperboard, plastic,
foil, plastic laminates, flexible pouches, thermoformed plastic containers, flow moulded
containers, and bag in box (Spreer, 1998). There are also wide ranges of hand held
containers called bulk totes. These totes are in many styles and options such as attached
or detached lids, stack only, nest only or stack and nest to suit the application.
Dried milk products are generally packed when the moisture content is less than about
4% to ensure a satisfactory shelf life (Kessler, 1981). Dried products which are rich in
fat should be packaged in materials that are impermeable to light and oxygen to prevent
oxidative changes.
Plastics have expanded the packaging industry to very sophisticated levels because of
many positive features within their range of versatile properties. Plastic containers are
lightweight, which reduces transportation costs, transparent and flexible to almost any
requirement, squeezable and moldable in complex shapes, easily coloured and printed,
sterilizable, reusable and recyclable. In addition, plastics are economically competitive
4-52
III cost with paper, wood, glass, steel and aluminium (Hernandez, 1997). Non
returnable plastics bottles for liquid milk, UHT milk, cream and ice cream have been
introduced for packaging operations.
4.8 Other Emerging Processes for Pathogen Control
There are many other emerging processes to be considered in chemical engineering.
These emerging technologies are generating much interest in the food industry. The
growing demand for safe "fresh products", if possible with longer shelf life, is
influencing the development of industries that process the food products. These new
processes tend to use non-thermal preservation treatments.
Emerging processes for pathogen control that may be suitable for the dairy industry
include high hydrostatic pressure, ultraviolet light, electromagnetic radiation, electron
and gamma rays, ultrasounds and the application of chemical and biological agents such
as carbon dioxide (Juriaanse, 1999; Geciova et al., 2002). These are not discussed any
further than mentioned below, in this study.
4.8.1 High Pressure
One non-thermal technique that has particular potential is high hydrostatic pressure. An
advantage of this new technology is that food quality such as flavours and vitamins are
unaffected or only minimally altered. High pressure with temperature and time can be
applied for treatment of fresh cheese to inactivate or reduce pathogenic and spoilage
micro-organisms and so to increase its shelf life and maintain its organoleptic
acceptance. (Trujillo et al., 2002). High pressure affects not just the microbiology of
food, but also the chemical and physical properties. For example, whey protein has
poor foaming properties, but high pressure treatment of ~-lactoglobulin in whey
improves the foaming properties by making it far more surface active and improving
foam stability (Buchanan & Paterson, 2002). This could have application in, for
example, making cappuccino coffee, where milk which foams would be considered
desirable.
4-53

A practical application of high pressure is for the acceleration of cheese ripening
because the cheese storage for ripening can be expensive (Trujillo et ai., 2000; Trujillo,
2002; Buchanan & Paterson, 2002). It is also claimed that thicker, or creamier yoghurts
can be made with high pressure-treated milk (Buchanan & Paterson, 2002).
High pressure application on milk and dairy products has recently increased (Geciova et
ai., 2002). Pressures between 300 and 600 MPa have been shown to be a promising
effective method in dairy products.
4.8.2 Ultraviolet Light
The use of ultraviolet light for water sterilisation has the advantage that it introduces no
additional materials and does not change the chemical composition of the fluid.
However the process has not been used widely because of the operation and
maintenance problems linked to quartz tubes which separate the source from the water.
Ultraviolet Technology Inc. (UTI) claims to have overcome this problem by using
fluorocarbon tubes to contain the water during sterilisation. The fluorocarbon tubes are
chemically inert, non-wetting, and resistant to fouling. Some commercial installations
have been in continuous operation on turbid seawater for over three years without any
need for cleaning (Cruver & Jhawar, 1980; Howell, 1990).
Ultraviolet rays do not penetrate deeply into the irradiated body and will be only
suitable for the irradiation of premises (e.g. in cheese ripening rooms), and surface
irradiation of hard cheese, for sterilising air and water in relatively thin films, tanks and
other equipment (Kessler, 1981). Ultraviolet light is also use for sterilisation of medical
and biomedical products (Hernandez, 1997).
4.8.3 Electromagnetic Radiation
Energy in the form of electromagnetic radiation at microwave frequencies is coupled
directly to food so that energy absorption and hence heating take place throughout the
food. Therefore, conduction is not the primary mode of heating and the heating rate
becomes more rapid (Sharma et ai., 2000).
4-54

When these high-frequency electric fields are applied to foods, the electric dipoles of
water molecules are excited into rapid oscillation and some of this energy is converted
into heat. The practical efficiency of the microwave heating depends on the depth to
which the microwaves penetrate into the material. Commercial microwave heating uses
frequencies in the region of 900 MHz. However, for safety reasons domestic
microwaves use 2450 MHz at which the penetration depth is low (commonly in the
order of 10 mm) but, which can lead to overheating at the surface (Sieber et al., 1996).
Thicker food products will still rely on conduction to complete the heating process.
Therefore, the geometry of the products is an important consideration in designing
microwavable foods (Sharma et al., 2000). Domestic microwaves do not give safe and
uniform heating of the total product (Sieber et ai., 1996). For example, microbial
contamination that needs to be destroyed by 30 minutes in the oven may survive
reheating in the microwave (Fryer, 1997).
4.8.4 Electron and Gamma Rays
Electron beams and gamma rays have an ionizing effect. Studies on the inactivation of
micro-organisms showed that doses of electron and gamma rays reduce micro
organisms (Ito & Islam, 1994). The more ions are produced per unit distance travelled,
the greater is the density of ionisation. But, the loss in energy that occurs increases
correspondingly and the depth of penetration of th~ radiation decreases (Kessler, 1981).
Gamma rays possess a lower ionisation density and therefore have a deeper penetration
than the electron beam radiation, which has a high ionisation density (Kessler, 1981).
Table 4-5 shows that electron beams are more suitable for flat thin pathways.
Table 4-5 Penetration ofr-rays and electron beams in water (Kessler, 1981)
Radiation Energy in MeV Penetration (cm)
CQ - 60 1.1and1.3y ~ 10
Cs• 137 0.66 'Y ~ 7.5
electrons 1 ~ 0.5
electrons 3 ~ 1.5
'Y Penetration of gamma rays and electron beams in water.
4-55
These processes are not yet widely applied. Their main disadvantages are their low
inactivation effect, high costs and legal barriers (Spreer, 1998). In addition, consumer
acceptance of any form of radiation is often low.
4.9 Mass Balances in Dairy Processes
Mass balances for a process design are very important because they can be used to
determine the process stream flows and compositions. There are three types of mass
balances used in this research. The first is the initial approximate mass balance that is
required in the initial process design to aid the overall flow evaluation from the feed to a
final product flowsheeting calculation. The second is the component mass balance to
calculate the enrichment or depletion of the milk components according to the feed and
product specifications. The third is the mass balances around an individual process
operation.
The overall mass balance is very often determined by the inlet flowrate of milk, which
because of seasonal variation, cannot always be controlled. Generally the design must
be based on the peak supply of milk.
A mass balance for the annual production of products needs to be based on the sum of
predicted daily flows. In New Zealand a rule-of-thumb states that the annual production
equals 185 days production at the peak daily supply.
The exact composition of raw milk does not need to be known as it varies during the
year and from farm to farm. A typical value and a range are more useful. If the design
calculations are well laid out on a spreadsheet, the impact of variations can be easily
determined.
There are losses from each process arising from flushing at start up and shut down and
from accumulation of product within the process. They are typically average 1% to 2%
of the total feed flows.
4-56

Morison (1997a, 1997b) has defined mass balance for some milk process separations in
terms of input and output streams of milk components. The following mass balances
are based on those systems of equations also published by Morison. A system of
equations can be defined for the dairy process product as shown in the following
equations:
Nomenclature
Fj Flow rate of stream j [kg hr"l]
xj,i Mass fraction of component i in streamj
n Number of components
m Number of streams
1. The overall mass balance
(4-10)
2. The component mass balances in an aqueous system
x=l ~x" J,n £..J J,t i=l,n-l
for each stream j == 1, m (4-11)
3. The component mass balance over the process for each component
i == 1, n-1 (4-12)
4.9.1 Guide to Mass Balance Rules
The mass balance rules can be developed by considering the functions of the process
units, and by making use of any constraints on the stream flows and compositions that
arise from consideration of product specification, product safety and equipment design
limitations.
To obtain mass balances in dairy processes some specialised knowledge and
relationships need to be used.
4-57

Order of calculation
1. Find the limiting milk component by:
Given feed flow of components and the product composition, find which
components can have zero depletion while separating others out. For example,
for production of cottage cheese, casein is a limiting component.
Hence find the maximum product flowrate.
2. From the product specification and product flowrate, calculate the feed
composition required.
Add in knowledge (Morison, 2003 personal communication) of process yields as
given in Section 4.9.3.
3. Add processing constraints imposed by the process or equipment.
4.9.2 Mass Balance Guidelines for Different Unit Operations
Suggested techniques for obtaining mass balances within some of the more common
unit operations are given below.
Microfiltration, Ultrafiltration and Nanofiltration
The following flow rate balance and solute balance can be obtained for a MF, UF and
NF process operations.
There are two parameters that characterised a successful membrane process. One is the
selectivity of the chosen membrane and the other is the flow through the membrane
(Mulder, 1996), these are described below.
1. The selectivity of a chosen membrane is the amount of solute retain by the
membrane, this is called also retention and is defined by the retention coefficient R.
4-58
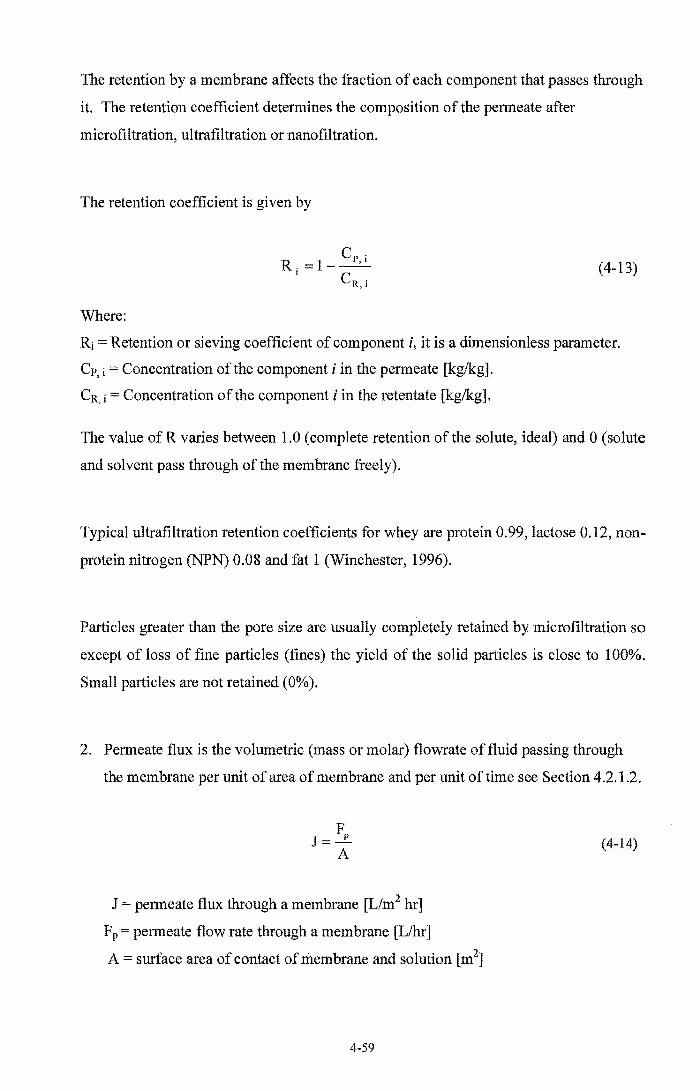
The retention by a membrane affects the fraction of each component that passes through
it. The retention coefficient determines the composition of the permeate after
microfiltration, ultrafiltration or nanofiltration.
The retention coefficient is given by
Where:
Cpo R. =1--,-1
1 CR' ,1
(4-13)
Rj = Retention or sieving coefficient of component i, it is a dimensionless parameter.
Cp, i = Concentration of the component i in the permeate [kglkg].
CR, i = Concentration of the component i in the retentate [kglkg].
The value ofR varies between 1.0 (complete retention of the solute, ideal) and 0 (solute
and solvent pass through of the membrane freely).
Typical ultrafiltration retention coefficients for whey are protein 0.99, lactose 0.12, non
protein nitrogen (NPN) 0.08 and fat 1 (Winchester, 1996).
Particles greater than the pore size are usually completely retained by microfiltration so
except of loss of fine particles (fines) the yield of the solid particles is close to 100%.
Small particles are not retained (0%).
2. Permeate flux is the volumetric (mass or molar) flowrate of fluid passing through
the membrane per unit of area of membrane and per unit of time see Section 4.2.1.2.
J = permeate flux through a membrane [Llm2 hr]
Fp = permeate flow rate through a membrane [Llhr]
A = surface area of contact of membrane and solution [m2]
4-59
(4-14)

Reverse osmosis
Only water passes through the membrane. So the retention coefficient is practically 1.0.
However, some leakage of small components can occur.
Electrodialysis, dialysis and ion exchange
Detailed knowledge is required of component separation for a mass balance. For
example, the ion binding characteristics are required.
Homogenisation
There is no change in composition.
Evaporation, spray drier, roller drier, fluidised bed drier and freeze drier
There is only water removal.
Screen filtration
In screen filtration liquid phase composition is unchanged and the solid material is
lOO% retained.
Centrifugal Separation
When centrifugal separation is used for fat removal from milk the minimum amount of
minimum milk fat in the skim milk is in the range of 0.04% to 0.10%. The amount of
fat in the skim milk depends on the fat globule size distribution, and the milk
temperature (Morison, 1997a). The maximum fat fraction from a centrifugal separation
when fed with whole milk is about 42%. Higher fat fractions can be obtained only if the
fat fraction in the skim milk rises about the minimum.
Some separations have a "de sludge" to remove solid material from the separator bowl.
The effect of this on the mass balance can be assumed to be negligible.
4-60
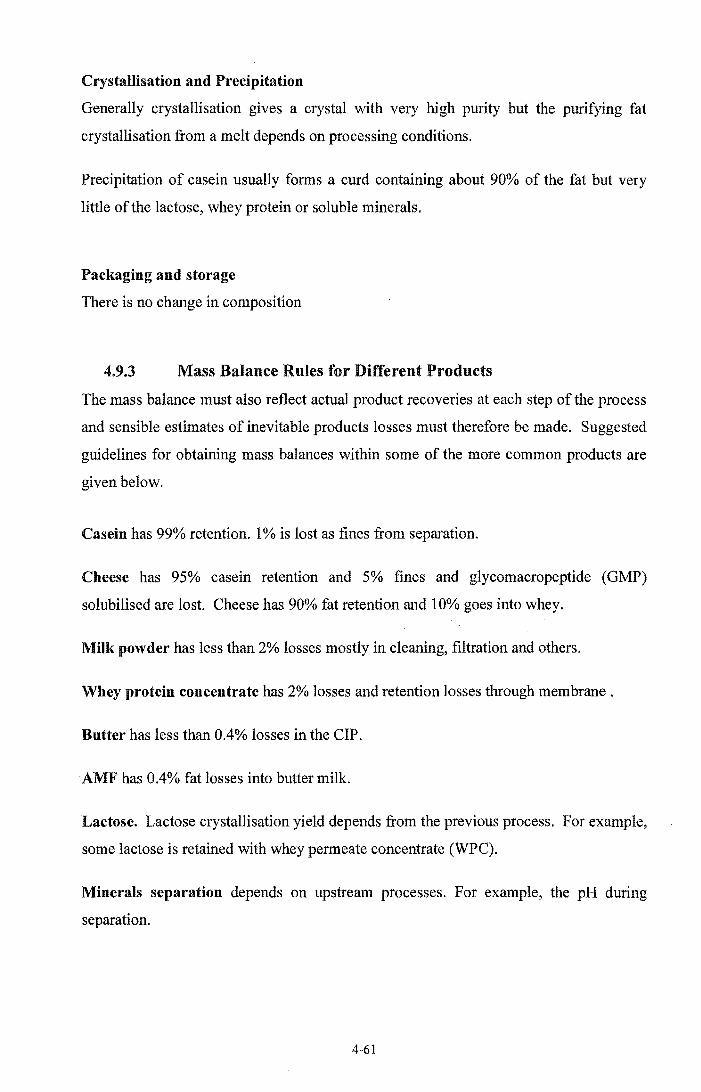
Crystallisation and Precipitation
Generally crystallisation gives a crystal with very high purity but the purifying fat
crystallisation from a melt depends on processing conditions.
Precipitation of casein usually forms a curd containing about 90% of the fat but very
little of the lactose, whey protein or soluble minerals.
Packaging and storage
There is no change in composition
4.9.3 Mass Balance Rules for Different Products
The mass balance must also reflect actual product recoveries at each step of the process
and sensible estimates of inevitable products losses must therefore be made. Suggested
guidelines for obtaining mass balances within some of the more common products are
given below.
Casein has 99% retention. I % is lost as fines from separation.
Cheese has 95% casein retention and 5% fines and glycomacropeptide (GMP)
solubilised are lost. Cheese has 90% fat retention and 10% goes into whey.
Milk powder has less than 2% losses mostly in cleaning, filtration and others.
Whey protein concentrate has 2% losses and retention losses through membrane.
Butter has less than 0.4% losses in the CIP.
AMF has 0.4% fat losses into butter milk.
Lactose. Lactose crystallisation yield depends from the previous process. For example,
some lactose is retained with whey permeate concentrate (WPC).
Minerals separation depends on upstream processes. For example, the pH during
separation.
4-61

4.10 Economic Analysis in Dairy Processes
Preparation of an accurate mass balance is essential for an assessment of economic
viability. For this, the composition of feed and the final product must be known.
Economics are clearly important to be able to make realistic estimates of the process
economics during the design and development stages; it is used in determining the
viability of a process or product (Pyle, 1997). In this methodology a rough economic
estimate needs to be calculated initially when the product is chosen. After that it can be
recalculated whenever the designer considers making an alternative choice.
If a process is to be assessed for its viability during the conceptual design phase it will
be necessary to estimate the capital and operating costs. Capital cost will depend on the
detail design and configuration of the equipment. Detailed estimation is highly
specialised job (Pyle, 1997). Operating cost depends on the mass and energy balances,
which gives unit costs. They will also include other costs such as labour and it may be
necessary to estimate the selling prices for any product and co-product.
When selecting the key process or adding a' process to the flowsheet, the economics of
the process must be checked. The procedures of estimating capital costs can be found in
Gerrard (2000), Jebson & Fincham (1994) and Peters & Timmerhaus (1981). If the
process is grossly uneconomic it will be rejected but to allow innovation marginally
uneconomic processes will be retained.
4-62

5 Dairy Industry Processes from a Product
Point of View
5.1 Dairy Products
Prior to developing a conceptual design framework, it is necessary to consider the
products that are most commonly encountered in modem dairy manufacturing
operations. This chapter reviews the typical production methods for selected product
types, examining the key aspects, the constraints and limitations for the design. This
will help the designer to conceptualise the development of schematic flowsheet in each
case. The key aspects, constraints and limitations that are reviewed will affect the
flowsheet design and integration of the process.
This chapter intends to serve as a reference for different product processes in the dairy
industry from the design point of view. The list of dairy products is almost endless. It
has become necessary to study product and processes in the dairy industry. The
products have been selected to illustrate their importance in relevant aspects of design.
The selection of information focuses on the schematic· process flowsheets from the
design point of view. During the product processing description some general aspects
are recalled to provide the designer with a basis of understanding of what happens
during processing dairy products from the raw milk feed to the packaging. Some
general aspects of processing are also discussed. Some other aspects are presented to
the extent necessary for understanding the technology.
The development of a range of products is important for diversifying the branded
products that help to insulate the dairy industry from the fluctuations of international
dairy commodity prices and thereby provide a more attractive environment for long~
term investment in the industry.
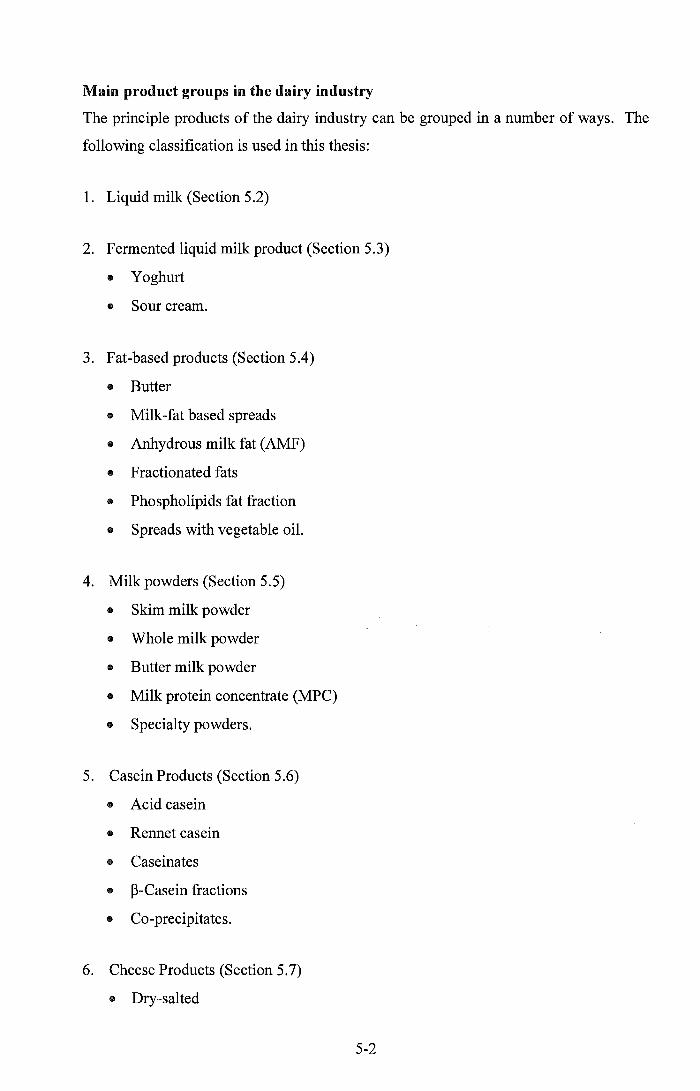
Main product groups in the dairy industry
The principle products of the dairy industry can be grouped in a number of ways. The
following classification is used in this thesis:
1. Liquid milk (Section 5.2)
2. Fermented liquid milk product (Section 5.3)
• Yoghurt
• Sour cream.
3. Fat-based products (Section 5.4)
• Butter
• Milk-fat based spreads
(I Anhydrous milk fat (AMF)
(I Fractionated fats
• Phospholipids fat fraction
• Spreads with vegetable oil.
4. Milk powders (Section 5.5)
• Skim milk powder
• Whole milk powder
• Butter milk powder
• Milk protein concentrate (MPC)
• Specialty powders.
5. Casein Products (Section 5.6)
• Acid casein
• Rennet casein
• Caseinates
CD p-Casein fractions
CD Co-precipitates.
6. Cheese Products (Section 5.7)
CD Dry-salted
5-2
• Brine-salted
• Specialty cheeses.
7. Whey products (Section 5.8)
• Whey powder
• Whey protein concentrate
• Whey protein isolate
• a-Lactalbumim
• Lactoferrin
• Whey cheese
• Whey hydrolysates
• Whey protein fractions.
8. Lactose Products (Section 5.9)
• Ethanol
" Hydrolysed lactose
It Lactic acid.
The manufacture of all products is subjected to regulations to ensure product safety
using good hygienic practices and Hazards Analysis Critical Control Point (HACCP)
systems. These systems were established by the food industry to produce safe products
through anticipation and prevention of problems (Chandan, 1997; Ramirez-Vela &
Martin-Fernandez, 2003). Such requirements have considerable impact on the
processing operations and production methods. Most regulations require that
pasteurisation be used as a pathogen control step in the production of nearly all dairy
products. In this thesis, no assumption is made that pasteurisation is the only method of
achieving pathogen control. Details of typical pathogen control methods are presented
in each product category.
A classification of the principal components of milk with approximate percentages of
contents is given in Table 5-1.
5-3

Table 5-1 Components of milk (Walstra & Jenness, 1984).
Component Typical mass fraction % Range %
Fat 3.9 2.4-5.5
Casein protein 2.6 1.7-3.5
Whey protein 0.65 0.6-0.9
Lactose 4.6 3.8-5.3
Minerals 0.65 0.53-0.80
Water 87.3 85.5-88.7
Miscellaneous 0.3
5.2 Production of Liquid Milk
Liquid milk is typically a consumer item but may be used as an ingredient in some
baking products. The majority of the liquid milk types have a limited shelf life of only a
few days (up to about ten days in New Zealand) and are designed for the local consumer
market. The exception is ultra heat treated (URT) milk, which has extremely low
microbiological content and is often called commercially sterile. It may contain
thermophilic spores and has a shelf life of several months (up to about nine months in
New Zealand).
Liquid milk can be classified in different ways, for example:
a) By fat content:
• Whole milk with natural fat content of 3.5% to 4.5%
" Mixed milk or standardised milk with fat content of 1.0% to 3.5%
" Skim milk or fat-free milk with a fat content of < 0.05% to 1.0%
• Cream with a fat content of about 41 % and related liquid products.
b) By heat treatment methods:
" Pasteurised milk
• Ultra heat treated milk (sterilised milk)
• Can sterilised milk.
c) By modification of the composition of the milk by addition, modification or removal
of components:
5-4
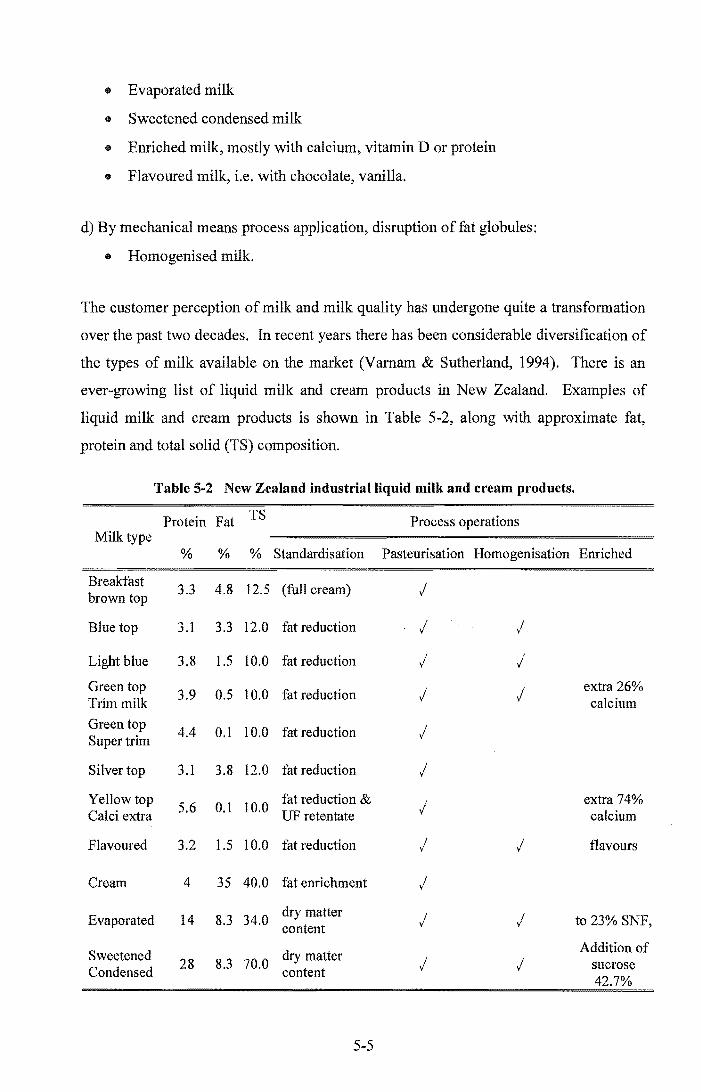
• Evaporated milk
• Sweetened condensed milk
• Enriched milk, mostly with calcium, vitamin D or protein
/I Flavoured milk, i.e. with chocolate, vanilla.
d) By mechanical means process application, disruption of fat globules:
/I Homogenised milk.
The customer perception of milk and milk quality has undergone quite a transformation
over the past two decades. In recent years there has been considerable diversification of
the types of milk available on the market (Varnam & Sutherland, 1994). There is an
ever-growing list of liquid milk and cream products in New Zealand. Examples of
liquid milk and cream products is shown in Table 5-2, along with approximate fat,
protein and total solid (TS) composition.
Table 5-2 New Zealand industrial liquid milk and cream products.
Protein Fat TS Process operations Milk type
% % % Standardisation Pasteurisation Homogenisation Enriched
Breakfast 3.3 4.8 12.5 (full cream) .;
brown top
Blue top 3.1 3.3 12.0 fat reduction .; l
Light blue 3.8 1.5 10.0 fat reduction .; .; Green top
3.9 0.5 10.0 fat reduction .; .; extra 26% Trim milk calcium
Green top 4.4 0.1 10.0 fat reduction .;
Super trim
Silver top 3.1 3.8 12.0 fat reduction .; Yellow top
5.6 0.1 10.0 fat reduction & .; extra 74%
Calci extra UF retentate calcium
Flavoured 3.2 1.5 10.0 fat reduction .; .; flavours
Cream 4 35 40.0 fat enrichment .;
Evaporated 14 8.3 34.0 dry matter .; .; to 23% SNF, content
Sweetened dry matter Addition of
28 8.3 70.0 .; .; Condensed content
sucrose
5-5

5.2.1 Liquid Milk Process
There is generally little difference between the different liquid milk types. The
simplified diagram presented in Figure 5-1 shows a schematic representation of the
liquid milk process, with the fundamental process operations from a design point of
view.
Additives
l Milk storage
Liquid Pathogen 1----'
Composition Packaging r--+ Liquid milk control control I---JI.
tank Feed , , , , ...
Co-products I
Figure 5-1 Schematic tlowsheet ofliquid milk production.
The production of liquid milk originally was part of the home farm economy.
Gradually, it became a different operation in small-scale local production and later in
large industrial production.
1. Small-scale local production
In some less mechanised or developed agricultural· systems, such as those found in the
Andes, milk is purchased directly from the farmer and is heated to its boiling point as a
means of pathogen control. In quantities of twenty Htres to 5000 Htres per day, this milk
can be sold directly to households in accordance with the number of family members.
This type of delivery system is limited by the size of the farm and the population in the
vicinity. In the developing countries, milk is consumed generally as whole milk or
naturally skimmed milk and the cream is used directly as spreading cream.
2. Large industrial scale production
The need for milk to be kept at a temperature lower than 6 °C has prompted dairy
factories to set up and maintain a farm-gate to home refrigerator chill chain (Spreer,
1998). In New Zealand, the aim is to keep the milk below 4 °C after pasteurisation.
5-6

Milk processed in an industrial scale operation is heat treated (Section 4.1.4) to destroy
the harmful bacteria before it can be commercially distributed. The centrifugal
clarification based process of bactofugation (Section 4.2.2) and microfiltration based
bactocatch (Section 4.2.1.2) are used also to control pathogens.
To meet the demand for a liquid milk that is stable for extended periods at room
temperature, ultra heat treated milk was developed (UHT), where the milk is subjected
to much stricter microbial limits. Aseptic packaging is a critical control point for UHT,
as described in Section 4.7.
The composition of raw milk is not constant during the season. Some form of
composition control ("standardisation") is required to keep the product consistent from
one batch to the next. In addition, because of the market demands, many of the
products have compositions standardised to customer preferences. Typically, the fat
content is reduced. Composition control includes centrifugal separation (Section 4.2.2)
to separate cream from skim milk, ultrafiltration (Section 4.2.1.2) to produce protein
enriched and protein depleted streams, recombination of any separated streams, and the
addition of flavours or vitamins depending on the product type.
Homogenisation (Section 4.4) can be loosely considered as a composition control
process as it changes the fat globule size, prevents the "creaming" in milk and thus
gives better keeping qualities. Homogenisation is a requirement for UHT with its
longer shelf life (Spreer, 1998).
5.2.2 Production Requirement and Constraints
Other than the requirements mentioned above, or those required by regulation, there are
no specific constraints.
On a small scale, there are few co-requisites because the production is simple, does not
require many utilities and does not produce co-products.
Large-scale production typically requires an energy source of at least 80°C and
electricity. Unless the market is perfectly balanced, there is likely to be a need for a
process to take excess cream. A local butter or A:rvlF factory would fill this need.
5-7
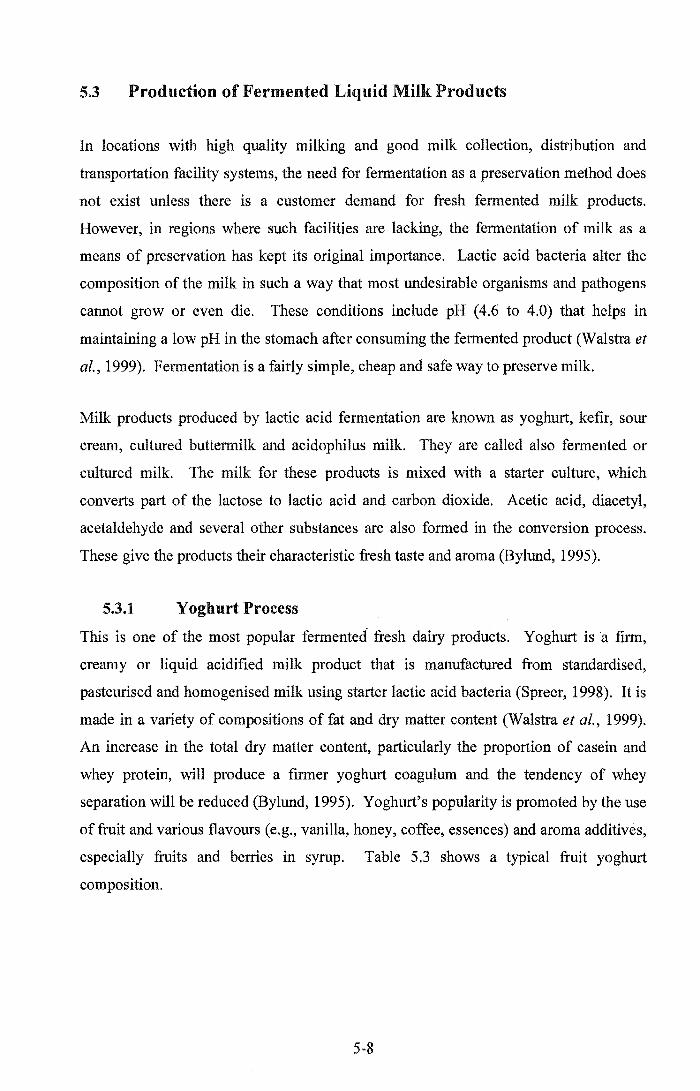
5.3 Production of Fermented Liquid Milk Products
In locations with high quality milking and good milk collection, distribution and
transportation facility systems, the need for fermentation as a preservation method does
not exist unless there is a customer demand for fresh fermented milk products.
However, in regions where such facilities are lacking, the fermentation of milk as a
means of preservation has kept its original importance. Lactic acid bacteria alter the
composition of the milk in such a way that most undesirable organisms and pathogens
cannot grow or even die. These conditions include pH (4.6 to 4.0) that helps in
maintaining a low pH in the stomach after consuming the fermented product (Walstra et
ai., 1999). Fermentation is a fairly simple, cheap and safe way to preserve milk.
Milk products produced by lactic acid fermentation are known as yoghurt, kefir, sour
cream, cultured buttermilk and acidophilus milk. They are called also fermented or
cultured milk. The milk for these products is mixed with a starter culture, which
converts part of the lactose to lactic acid and carbon dioxide. Acetic acid, diacetyl,
acetaldehyde and several other substances are also formed in the conversion process.
These give the products their characteristic fresh taste and aroma (Bylund, 1995).
5.3.1 Y ogburt Process
This is one of the most popular fermented' fresh dairy products. Yoghurt is a firm,
creamy or liquid acidified milk product that is manufactured from standardised,
pasteurised and homogenised milk using starter lactic acid bacteria (Spreer, 1998). It is
made in a variety of compositions of fat and dry matter content (Walstra et al., 1999).
An increase in the total dry matter content, particularly the proportion of casein and
whey protein, will produce a firmer yoghurt coagulum and the tendency of whey
separation will be reduced (Bylund, 1995). Yoghurt's popUlarity is promoted by the use
of fruit and various flavours (e.g., vanilla, honey, coffee, essences) and aroma additives,
especially fruits and berries in syrup. Table 5.3 shows a typical fruit yoghurt
composition.
5-8

Table 5-3 Typical fruit yoghurt compositiou (Bylund, 1995).
Component w/w%
Fat 0.5 - 3.0
Lactose 3.0 4.5
Milk solids non fat (MSNF) 11.0 -13.0
Stabiliser (if used) 0.3 0.5
Fruit 12.0 18.0
Production of Yoghurt
The milk is clarified, and separated into cream and skim milk, and then standardised for
composition control to achieve the desired fat content. It is pasteurised to produce a
relatively sterile product. To enhance the viscosity and texture of the yoghurt, the milk
is homogenised at a temperature of about 65 DC and at a pressure of about 200 bar
(Vamam & Sutherland, 1994; Kessler, 1981). Homogenisation of milk prevents
creaming of the fat during the incubation period, ensures a uniform distribution of the
milk fat, stabilizers and other added ingredients, and increases the stability to the
yoghurt (Vamam & Sutherland, 1994). The milk is brought to the incubation
temperature and the yoghurt culture (consisting of acid lactic bacteria) is added to it
(Kessler, 1981). The starter culture produce lactic acid that lowers the pH and
coagulates the casein proteins. The gel (coagulum) is formed at this stage. After that, it
is cooled to a temperature of 38 DC to 45 DC (the optimum growth in the culture).
During gel formation, the milk must remain stationary (see Figure 5-2). The pH is
monitored until it has reached 4.4 to 4.6 and at this time, it is cooled and fruit or flavour
is added and the product is stored at refrigerator temperature (Bylund, 1995; Walstra et
al., 1999).
Culture I
1 Milk. Composition
~ Homogenisation
~ Inoculation &
-+ Chilling & Yoghurt
control & Pathogen control Incubation Packing
Figure 5-2 Schematic flowsheet of yoghurt production.
5-9

Yoghurt has a short shelf life at temperatures over 10 °C, and lasts for only for 2 to 3
weeks at a refrigerator temperature without a significant loss of quality (Kessler, 1981),
which makes it a product suitable only for local markets.
In order to extend the shelf life of the yoghurt the plant can be run in an aseptic mode
and the process requires hygienic installation and filling facilities (Bylund, 1995;
Spreer, 1998).
The nutritional value of yoghurt is also enhanced by raising the non-fat solids content
by the addition of milk powder, evaporation under vacuum or water removal by
ultrafiltration membrane (Robinson & Tamime, 1986). The air content of the milk used
to make cultured milk products should be as low as possible because dispersed air
causes incrustation on heating surfaces (e.g., in pasteurisers) and reduction of the
stability of the yoghurt (i.e., expulsion of whey). If incoming air is unavoidable e.g.,
when adding milk powder, then de aeration (see Section 4.2.2) should be included as
part of the process (Bylund, 1995; Spreer, 1998).
5.3.2 Sour Cream Process
Sour cream is also known as a cultured cream. It is a fermented milk product
manufactured using Streptococcus lactic subspecies as the starter cultures. Sour cream,
like other cultured products, has a limited shelf life. Sour cream is HTST pasteurised
(see Section 4.1.4 on Table 4-1 cream pasteurisation). In the event of extended storage,
enzymes from the lactic-acid bacteria (which break down the p-lactoglobulin) become
active and the sour cream becomes bitter. It also loses its flavour due to the diffusion of
carbon dioxide and other aromatic substances through the packaging (Bylund, 1995).
Production of Sour Cream
The fat content of the cream is standardised to between 12% to 30% depending on the
required properties of the final product. The standardised cream is then heated to 75°C
to 80 °C before the homogenisation takes place at high pressure and temperature more
than 130 bar and at to 60°C to improve the texture (Vamam & Sutherland, 1994), then
it is cooled to 20°C to 25 °C before addition of starter culture. The starter culture is
added to between 1-2 %, fermentation proceeding for few hours at 25°C. The
fermentation is stopped when the pH has reached 4.5 pH by cooling and storage at 5°C
5-10
to increase the storage life. The homogenisation is preferably at a low temperature to
promote the formation of a homogenisation cluster. Figure 5-3 shows a schematic sour
cream flowsheet.
--:;';';=---fil'I Composition
control Pathogen control
Culture
Inoculation &
Fermentation
Figure 5-3 Schematic sour cream production flowsheet.
The inoculation and fermentation conditions are similar to those for yoghurt. The
fermentation stops at 4.5 pH and then the cream is cooled, gently stirred and packed.
The consistency of cultured cream can be adversely affected by post-fermentation
handling (Varnam & Sutherland, 1994). Sometimes inoculation and fermentation take
place in the final retail pack (Spreer, 1998).
5.3.3 Production Requirements and Constraints
Culture preparation must be done under aseptic conditions in order to avoid
contamination and bacteriophage infection (Spreer, 1998; Bylund, 1995). Cultivation of
starter culture must be done on an enclosed production line until the culture product is
packed.
5.4 Production of Fat-based Products
Milk fat exists as small globules dispersed in the milk serum. Milk fat globules have an
inner core, composed of 98% triglycerides, which is surrounded by a lipid membrane
composed primarily of phospholipids. The milk fat globule membrane is a layered
structure that has an inner layer of high-melting triglycerides, followed by a layer of
polypeptides, which are interspersed in a lipid continuum of phospholipids and
cholesterol (Kaylegian & Lindsay, 1995). The membrane contains a variety of
compounds including phospholipids, lipoproteins, glycerides, cerebrosides, copper, iron
5-11

cholesterol, trace elements, bound water, vitamins A, D, E and K (Bylund, 1995;
Walstra, et ai., 1999). Milk fat globules range in diameter from 0.2 f!m to 20 J-lm
although small globules (less than IJ-lm) are the most abundant, but account for only a
small percentage of the total lipid (Bylund, 1995; Kaylegian & Lindsay, 1995).
Milk fat can be incorporated into commercial prepared foods through the use of
anhydrous milk fat, butter and cream dairy products. The choice of milk fat ingredients
usually depends on the need of final application. Typical analyses of these product are
presented in Table 5-4.
Table 5-4 Composition of some products containing milk fat (Kaylegian & Lindsay, 1995).
Ingredient Milk fat (%) Water (%) Solids non-fat (%)
Butter 81.1 15.9 3.0
Butter oil 99.3 0.5 0.2
Anhydrous milk fat 99.8 0.1 0.1
Heavy whipping cream 37.0 57.7 5.3
Light whipping cream 30.9 63.5 5.6
Light cream 19.3 73.7 7.0
Half and half 11.5- 80.6 7.9
Liquid whole milk 3.3 88.5 8.2
Dried whole milk 26.7 2.5 70.8
Evaporated milk 7.6 74.0 18.4
Sweetened condensed milk 8.7 27.1 64.2
Butter and other milk fat-based products like anhydrous milk fat are important for their
nutritional value, they are a source of fat soluble vitamins such as A, B, E, K, for the
functional properties such as the flavour and for their rheological properties of dairy
products and foods in which they are used (Fox & McSweeney, 1998). While the value
of milk fat is less than the milk proteins, it is still significantly more valuable than
vegetable oils.
5-12

Milk fat product is particularly valued not only due to its desirable flavour, but also
because of its influence on a pleasant mouthfeel (McSweeney et aI., 1997), and hence
its ability to make much of the food palatable (Chandan, 1997). The palatability of the
dairy fats is due to the large number of lipids of small molecular size (Varnam &
Sutherland, 1994). The major flavour compounds include short chain fatty acids
(Chandan, 1997).
The fat content, moisture content and the state of crystallisation of butter affect its
texture. Milk fat consists of many different triglycerides that do not form pure crystals
but tend to crystallise in groups of similar size and structure. The melting points of pure
triglycerides in milk range from -30°C to 72°C (Walstra et al., 1999). The presence of
mixed crystals means that the melting points of milk fat are different from those of the
individual pure triglycerides, giving a reduced overall melting range from - 40°C to 37
°C; the milk fat final melting point is usually about 37°C (Walstra & Jenness, 1984).
One intriguing property of a pure triglyceride is that it has multiple melting points due
to three distinct crystal forms (polymorphism); the proportions of each crystal form
depend on the method of crystallisation (Spreer, 1998). Thus, both the polymorphic
forms and the composition of the mixed crystals influence the butter texture.
Seasonal changes in milk composition may affect the hardness of milk fat. Feed
composition can affect the fat content of milk, especially its fat composition (Walstra et
ai., 1999). Milk fat tends to be softer during the spring months when cattle are fresh
pasture fed in some countries; in New Zealand, cows are pasture fed all year around but
variations such as state of lactation and weather still affect fat composition.
The minor components (see Table 5-5) are important to the nutrition and function of
milk fat. The phospholipids provide the emulsifying properties. ~-carotene provides
the distinctive yellow colour of milk fat. There are also concentrations of the fat
soluble vitamins such as vitamin A and vitamin E (Fox & McSweeney, 1998).
5-13

Table 5-5 Average lipid composition of milk (based on Walstra et al., 1999; Fox &
McSeeney, 1998; Varnam & Sutherland, 1994; Wasltra & Jenness, 1984).
Lipid % in milk fat (w/w)
Triacylglycerols 97-98
Diacylglycerols 0.3-0.6
Monoacylglycerols 0.02-0.04
Free fatty acids 0.1-0.4
Free sterols 0.2-1.0
Sterol esters Trace amounts only
VitaminE Trace amounts only
Carotenoids and vitamin A 0.002
Phospholipids 0.2-1.0
Hydrocarbons Trace amounts only
The fat globules are highly prone to lipolysis unless inactivation by high-temperature
pasteurisation of lipases is complete (Vamam & Sutherland, 1994; Bylund, 1995).
The rupture of the milk fat globule membrane in areas of high shear can have a negative
influence in milk fats. It makes them susceptible to fat degradation (Spreer, 1998). A
variety of physical defects in milk, and especially in cream, are caused by rupture of
milk fat globule membranes. For example, oiling off, cream plug and age thickening
due to a high level of free fat. Once the milk fat globule membrane has been broken the
fat is exposed to the lipase enzymes. Lipase enzymes breakdown fat molecules into
glycerol and free fatty acids causing undesirable flavour changes.
5.4.1 Cream Process
All fat-based products involve an initial step of cream separation that is currently done
by centrifugal separation (Section 4.2.2) using the difference in densities between the fat
globules (930 kg/m3 at 15.5 °C) and the other aqueous components (1030 kg/m3 at 15.5
°C) (known as serum). In normal practice, cream with a fat content of about 41 % can be
obtained while still achieving good skimming of the milk. Higher fat contents can be
achieved by slowing the cream off-take flow. This increases the residence time in the
separator, but the skim milk fat content can also become higher.
Cream for consumption as a liquid can be standardised by blending with the skim milk
to achieve a range in fat contents. Cream, or the whole milk that it is separated from,
5-14

must undergo a pathogen control step, which is nearly always a pasteurisation.
Membrane based processes cannot be used because the size of fat globules are similar
sizes to those of pathogen organisms. Some regulations require that if cream is
transported from one site to another, the pathogen control step must be after transport.
Some traditional creams, such as Devon clotted cream, are produced by gravity
separation from a batch, with or without heating.
5.4.2 Butter Process
Butter is made from cream by any process that causes a phase inversion. Cream is an
emulsion of fat globules in a continuous aqueous phase (oil-in-water) while butter is a
emulsion of droplets of milk serum (water, protein, lactose, and possibly salt) in a
continuous phase of semi crystalline milk fat (water-in-oil emulsion).
Butter was originally made on the farm for household use (FarraH, 1952). A manually
operated butter churn was used to break the fat globules followed by the discharge of
buttermilk until the required moisture content and structure were achieved (Bylund,
1995). Buttermilk is a co-product of butter production from sweet or fermented cream;
buttermilk fat content is about 0.5% and it contains higher levels of membrane
compounds of fat globules, especially phospholipids.
Butter is mainly a consumer item and contains important fat-soluble vitamins, especially
vitamin A (Spreer, 1998). It may be also used as an ingredient, for example, in some
baking recipes.
There are two commercial butter making processes used in New Zealand: the Fritz
process developed from the traditional churning process of crystallised cream and the
Ammix process where fresh milk fat is mixed with cream, skim milk and salt and shock
cooled to give rapid crystallisation.
5.4.2.1 Fritz Butter Process
W. Fritz introduced the Fritz butter process technology developed from the traditional
cream churning process, in 1940. He developed a continuous butter making process
which was later further developed by Eisenreich (Kessler, 1981).
5-15

Cream is vacuum-pasteurised, usually at 95°C or higher, normally without any holding
time, and steam-stripped to reduce some of the undesirable flavours (Bylund, 1995).
After that, the cream is cooled causing some of the fat to crystallise, thus providing
some rigidity to the fat globules for optimum butter making. This is followed by phase
inversion that occurs during the churning of cream. Under intense agitation, some of the
membranes break, which releases fat that binds other globules. This forms butter
granules that are too large to remain in suspension. The fat thus separates and the
buttermilk (largely serum) is released and drained off until a stable water-in-fat
emulsion is obtained.
The next step is called working (or kneading), that is the process of crushing the
remaining fat globules and liberating additional free fat. The emulsion breaks and
additional milk fat is freed which becomes part of the continuous phase of the butter
released by this process, giving the homogeneous structure that is characteristic of
butter. This concentration process raises the fat content of the butter to the final level of
between 80% and 84% fat. (Kessler, 1981; Chandan, 1997 & Wasltra et ai., 1999). Salt
may also be added. The final working is under vacuum, which removes air to give a
smooth even texture. Packing machines then pack the butter (Section 4.7). Figure 5-4
illustrates the main operations in this butter making process: pathogen control, fat
concentration, crystallisation, phase inversion and working to the formation of a stable
water-in-oil emulsion.
Milk Fat 3.9 % Pathogen ---. Concentration 4 Crystallisation ~
Phase inversion control
I-Feed 40 % fat & working
t t Skim milk Buttermilk
Packing
Butter
Figure 5-4 Schematic flowsheet of Fritz butter production.
5-16

Table 5-6 shows a typical butter composition.
Table 5-6 Typical butter composition (based on Walstra et al., 1999; Chandan, 1997).
Major Components Salted butter (%) Unsalted (%)
Milk fat 81.4 82.8
Moisture 15.7 15.7
Non fat milk solids 1.4 1.5
Salt 1.5 0.0
5.4.2.2 Ammix Butter Process
In the Ammix butter process, skim milk, anhydrous milk fat (AMF), cream and salt or
flavourings are mixed in appropriate proportions and shock-cooled in a scraped-surface
heat exchanger where crystallisation occurs in a matter of minutes, rather than hours as
required by the Fritz process (Cant et ai., 1998). The semi-solid butter is worked in a
"pin worker" to destroy some of the crystal structures to give a softer product. The
process is considered to be more flexible than the Fritz process. This process is also
called the modem chum (Fox & McSweeney, 1998).
Variations of the Ammix process are used to make a wide range of functional milk fat
products that cannot be made by the Fritz process. These include the spreadable butter
(which spreads from the refrigerator), tropical butter (which does not oil off at high
ambient temperatures), low fat spreads, bakery ingredients such as special butters for
pastry and cakes (where the butter needs to remain plastic and fold easily without
tearing the laminating steps), vegetable oil blends, including fat mixtures and blended
table spreads (Chandan, 1997). Other spreads are described in Section 5.4.6.
Figure 5-5 shows the Ammix butter production flowsheet.
5-17

Skim milk
AMP
Cream
Salt
Mix and chill f---iD>I
Scraped-surface heat exchanger
& "pin worker"
Figure 5-5 Schematic flowsheet of Ammix butter production.
5.4.3 Anhydrous Milk Fat (AMF) Process
Butter
Anhydrous milk fat (AMF) was originally produced in Australia during World War II
by melting butter and purifying it by subsequent treatment in centrifugal separators
(Fjaervoll, 1970; AI-Tahiri, 1987). Jensen and Nielsen (1982) stated that AMF is used
as a major source of fat for the recombination of milk and milk products because of its
good keeping quality, as it remains edible for months at room temperature (White,
1953; AI-Tahiri, 1987).
Anhydrous milk fat, also called clarified butter, butter oil or ghee, can be stored at
temperatures less than 10°C for several months without deterioration. Anhydrous milk
fat should have a minimum fat content of 99.8%; the prefix anhydrous being applied
where the moisture content is less than 0.2% (Varnam & Sutherland, 1994). Anhydrous
milk fat is excellent for transporting and storage as it requires less space than butter,
which used to be the traditional way of storing butterfat (Bylund, 1995).
AMF is not normally consumed directly but is used for cooking and as an ingredient,
e.g. in products such as chocolate and pastries. The advantages of using anhydrous milk
fat or butter-oil are no splattering or burning during sauteing, increased puff for pastries
and pie shells, aroma and flavour enhancement in bakery items, control of fat bloom in
chocolate candy and ease of melting, pumping and mixing with other food ingredients
(Chandan, 1997). AMF is also recombined with skim milk powder and water to be used
as a substitute for fresh fluid milk (AI-Tahiri, 1987), especially in countries with an
insufficient supply of fresh milk.
5-18
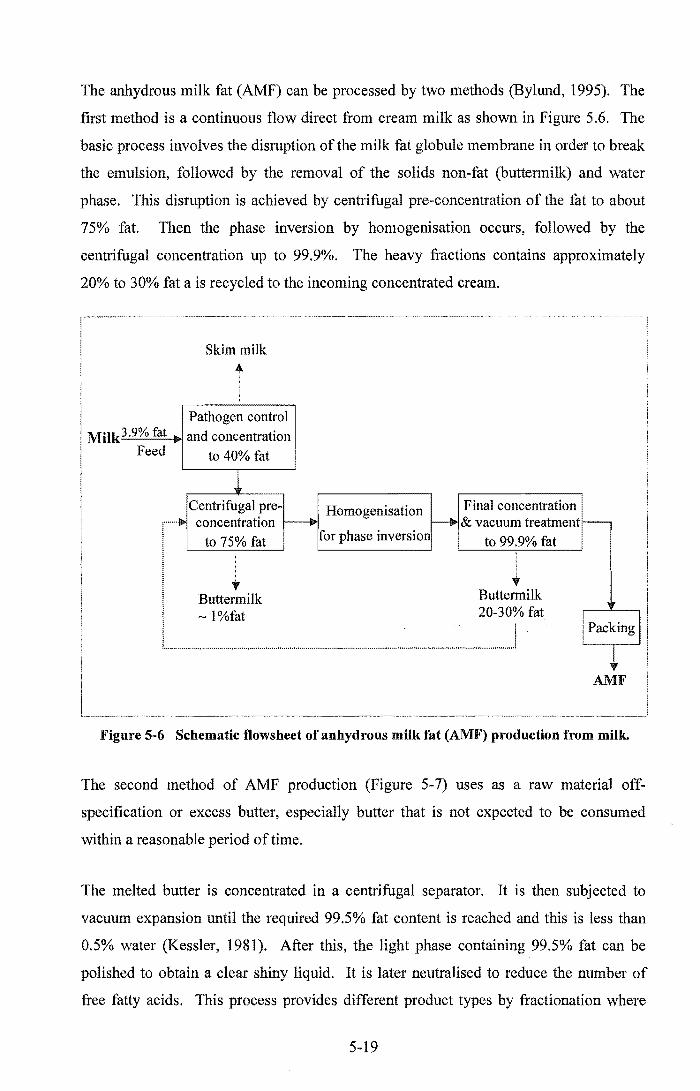
The anhydrous milk fat (AMF) can be processed by two methods (Bylund, 1995). The
first method is a continuous flow direct from cream milk as shown in Figure 5.6. The
basic process involves the disruption of the milk fat globule membrane in order to break
the emulsion, followed by the removal of the solids non-fat (buttermilk) and water
phase. This disruption is achieved by centrifugal pre-concentration of the fat to about
75% fat. Then the phase inversion by homogenisation occurs, followed by the
centrifugal concentration up to 99.9%. The heavy fractions contains approximately
20% to 30% fat a is recycled to the incoming concentrated cream.
Milk3.9%fat Feed
!', .....
! i ~ ~
! :
~ l
Skim milk .... , , i ,
Pathogen control
and concentration to 40% fat
Centrifugal preconcentration
to 75% fat , . : . t
Buttermilk ~ l%fat
Homogenisation
for phase inversio
Final concentration & vacuum treatment
to 99.9% fat
~ Buttermilk 20-30% fat
t .................................................................................................................... , ....... , ............... , .... ,,, .......................... ,;
AMF
Figure 5-6 Schematic flowsheet of anhydrous milk fat (AMF) production from milk.
The second method of AMF production (Figure 5-7) uses as a raw material off
specification or excess butter, especially butter that is not expected to be consumed
within a reasonable period of time.
The melted butter is concentrated in a centrifugal separator. It is then subjected to
vacuum expansion until the required 99.5% fat content is reached and this is less than
0.5% water (Kessler, 1981). After this, the light phase containing 99.5% fat can be
polished to obtain a clear shiny liquid. It is later neutralised to reduce the number of
free fatty acids. This process provides different product types by fractionation where
5-19

the oil is separated into high and low melting fats. Each of them has different properties
that enable them to be used in a variety of products. Finally, it is packed in the absence
of air (see Section 4.7.1).
Excess or off-spec. butter Melting & holding
butter of ~ 80% fat , , , t
Buttermilk ~ 0.6 - 0.8 %Fat
----JI> Centrifugal concentration &
Vacuum treatment r---+ Packing
,. I t Water and salt AMF
Figure 5-7 Schematic flowsheet of anhydrous milk fat (AMF) production from butter.
5.4.4 Fractionated Milk Fat Process
The most common modification of milk fat is fractionation (Wasltra et al., 1999).
Fractionation of milk fat to create ingredients with specific functional properties has
received considerable attention around the world (Kaylegian & Lindsay, 1995).
The technologies used to fractionate milk fat are crystallisation from melted milk fat,
crystallisation from solvent solution, fractionation by short-path distillation and
fractionation by supercritical fluid extraction. The most common method· for the
commercial production of milk fraction is crystallisation from melted milk fat. This
method involves a relatively simple physical process and does not employ additives so
the product retains its natural image and designation. Milk fat can be separated into
different groups of triglycerides with different melting point ranges. A typical process
is freeze fractionation from the melt. Anhydrous milk fat is heated to above 40°C until
it is fully molten, and is then cooled slowly to about 29 °C causing the first crystals of
the high melting point triglycerides to form. The triglycerides are then separated by
dead end filtration (Section 4.2.1) to give a hard fraction and a soft fraction. The
crystallisation is slow and by gradual cooling there is more selectivity and the crystals
tend to be purer and larger (Bylund, 1995). Fractionation by supercritical fluid (Le.,
carbon dioxide) does not employ additives either, but requires a high capital investment,
and separates fractions based on molecular weight rather than on melting point. The
crystallisation from solvent solution has a concern associated with potential residual
5-20

solvent, flavour change, and the hazards and also cost involved with operating a solvent
recovery system (Kaylegian & Lindsay, 1995).
Crystallisation of molten fat in an organic solvent (e.g., acetone) provides a means of
producing fats and oils with cleaner, sharper defined melting characteristics for use in
other applications, but solvent may not be acceptable for use with foods (Fox &
McSweeney, 1998).
Over 850 milk fat fractions have been reported in the literature and have been produced
by a variety of fractionation methods and processing conditions. These milk fat
fractions exhibit a wide range of chemical and physical properties, and consequently
they exhibit wide range functionalities (Kaylegian & Lindsay, 1995). Over 600 of the
milk fractions have been characterised for melting behaviour. To facilitate the
discussion of the functionality of milk fat and milk fat fractions in food products, these
melting categories include as follows (Kaylegian & Lindsay, 1995).
" Very high melting milk fat fractions (Melting point> 45°C)
e High-melting milk fat fractions (Melting point between 35°C and 45 °C)
" Middle-melting milk fat fractions (Melting point between 25°C and 35 °C)
" Low-melting milk fat fractions (Melting point between 10°C and 25 °C)
.. Very low melting milk fat fractions (Melting point, less than 10°C)
Milk fat can also be modified chemically by hydrogenation using H2 with a catalyst at
high temperature, decreasing the number of double bonds and thereby increasing the
high melting proportions of a fat. This process is often called hardening (Walstra et al.,
1999), but the product can no longer be called milk fat.
Fractionation of milk fat shows potential for the development of novel ingredients with
varied functional properties for use in a wide range of food products. Processes such as
melt crystallisation and short path distillation are some of the processing that offers a
feasible approach to customised fractionation of milk fat.
5-21

5.4.5 Phospholipids Fat Fractions Process
Phospholipids are enclosed in the multilayered chemical complex of the fat membrane.
They consist mostly of lecithin, which is thought to have a positive effect on the
nervous system (Spreer, 1998). Although phospholipids represent less than 1 % of total
lipids, they play a particular role, being present mainly in the milk fat globule
membrane. They represent a considerable proportion of the total lipids of buttermilk
and skim milk. Very high level of phospholipids in milk may indicate the presence of
mammary cell membranes (Fox & McSweeney, 1998).
Phospholipids have many applications in the pharmaceutical, food, cosmetic and other
industries (Ogino et at., 2002).
5.4.6 Spreads with Vegetable Oils Process
The manufacture of vegetable oil spreads is done generally by the Ammix process.
Skim milk, anhydrous milk fat (soft and hard fractions), cream and salt, flavourings and
vegetable oils are mixed in the appropriate proportions and shock-cooled in a scraped
surface heat exchanger to crystallise (see Figure 5-8). Then, the semi-solid butter is
worked in a "pin worker" to destroy some of the crystal structures to give a softer
product. Vegetable oils can be added to replace 5% to 25% of the milk fat (Spreer,
1998). The texture and consistency of the spreads is improved by the increased
percentage of vegetable oils, which reduces the melting point and leads to a very good
spreadability at refrigerator temperatures (Kaylegian & Lindsay, 1995). The commonly
used vegetable oils are soy oil, sunflower oil, and olive oil (Spreer, 1998; Walstra et at.,
1999).
AMFh d d 'fifr l' ar an so ac IOns
Vegetable oil
~ Skim milk, Preparation of the
~ Dosing & blending ---. Cooling, kneading
Salt aqueous phase of the phases & filtering
~ I Packing I
t Spreads with vegetable oil
Figure 5-8 Schematic diagram representation of spreads with vegetable oil.
5-22

Adding stabilizers and emulsifiers, and increasing the protein content to 5% to 7%, can
reduce the total fat content to less than 40%. The raw materials are selected according
to the specification of the final product. Blend of milk fat with vegetable oils is mainly
used in margarine manufacture. One of the most important concerns in the blending of
fats is that the crystallisation properties of the glycerides in the mixture remain
compatible. Incompatible glycerides in fats can cause retardation or complete lack of
crystallisation (Kaylegian & Lindsay, 1995).
5.4.7 Production Requirements and Constraints
High shear and turbulence should be avoided in the production of fat based products,
especially within the pipelines and the pumps. This is because they can cause strong
degradation of the membrane and separation of free fat from the fat globules can take
place (Spreer, 1998). Furthermore, the free fat is strongly attached to the walls of the
containing product. This makes the fat separation more difficult to separate fat during
and thus leads to fat losses (Spreer, 1998). Therefore, the mechanical stress when
transferring and storing the fat-based products has to be as low as possible.
The fat globule damage may be determined by measuring the level of free fat present
(McSweeney et al.) 1997). AI-Tahiri (1987) reported that increasing the level of free
fatty acids in AMF caused a significant decrease in the acceptability of the recombined
milk. AI-Tahiri's results showed that the lipolysed flavour of the recombined milk
could be detected by a sharp smell and a strong soapy taste.
Fat-based products are subject to oxidation that causes rancid and oxidised flavours.
Nitrogen blanketing can be used to prevent oxidation. The product should be packed in
oxygen free conditions using the nitrogen gas in order to have a good stability to fat
oxidation such as AMF (AI-Tahiri, 1987). All process steps must minimise the
potential of mixing the fat with air, light-induced to reduce lipid oxidation.
5-23

5.5 Production of Milk Powders
Milk powder is a long-life product, which can be easily transported, stored and handled
as it has a mass and volume about one tenth of the original liquid milk. This product is
especially suited to export. It is normally reconstituted to a liquid for consumption but
is also commonly used as an ingredient for other foods such as ice cream and chocolate.
Liquid milk contains approximately 87% of water, while skimmed milk, buttermilk and
whey contain 91%,90% and 94% water respectively (Kessler, 1981). The moisture
content is nearly always reported on total mass (wet) basis. This section focuses on the
production of dried powder products from a liquid feed. Caseinate powder, which could
be discussed here, are discussed separately with casein in Section 5.6. The acronyms
below will be used in this chapter and Chapter 7.
The most common spray drier powders produced for a variety of uses are:
Skim milk powders (SMP)
Instant skim milk powders (ISMP)
Whole milk powders (WMP)
Agglomerate whole milk powders (AWMP)
Instant whole milk powders (IWMP)
Buttermilk powders (BMP)
Milk protein concentrates (MPC)
Whey powders (WP)
Whey protein concentrates (WPC)
Caseinate powders (CSTP)
Cheese powders (CRP)
Cream powders (CRMP)
Lactose powders (LACP)
5.5.1 Milk Powder Process
Milk powder processing is essentially identical regardless of the product type. This can
be generalised into four main stages: pathogen and composition control (milk
treatment), water removal, powder handling, and packing, as shown in Figure 5-9.
5-24

Energy
1 Feed Pathogen and
Powder Powder Composition Water removal
handling ---. Packing
control
~ Milk Powder
Figure 5-9 Generalised schematic flowsheet of powder production.
Typically evaporation and spray drying are used for the water removing step giving the
process shown in Figure 5-10. The most common form of evaporator now used in the
New Zealand dairy industry is the multiple effect falling film evaporator, either with
thermal vapour recompression (TVR) or mechanical vapour recompression (MVR) (see
Section 4.2.3). Other water removal steps such as reverse osmosis (described in Section
4.2.1) are also feasible to remove part ofthe moisture content.
Raw milk
Liquid feed
Skim milk
l-----~Pathogeri control
Cream
Excess cream
Evaporation
Blending and Packing
Milk powder
Figure 5-10 Schematic typical flowsheet of whole milk production.
5-25

Each powder has a slightly different composition and/or set of processes as shown in
Table 5-7.
Table 5-7 Process operations ofthe most common powder products.
Process operations Milk powder products
SMP ISMP WMP AWMP IWMP
Separation j j j j j
Protein standardisation j j
Protein and fat standardisation j j j
Vitamin addition j j j
Preheating and pasteurisation j j j j j
Evaporation j j j j j
Homogenisation j j j
Concentrate heating j j j j j
Atomisation and drying j j j j j
Classification and agglomeration j j j
Powder cooling j j j j j
Sifting j j j j j
Blending j j
Gassing or gas flushing and packing j j j
Packing j j j j j
5.5.2 Production Requirements and Constraints
One of the main drivers in the selection of process components is the high-energy
consumption required to remove water from milk, especially when it involves the phase
change of evaporation. Spray drying (described in Section 4.2.4) is currently used in
producing milk powder. Water is normally removed from the milk by evaporation,
which takes the solids concentration up to the maximum feasible for this process.
A constraint on the operation of water removal steps is the heat-sensitivity of milk
products, so the product temperature must be kept below about 70°C with short
residence times.
Economics encourage the use of continuous processes but no such constraint is imposed
by specific requirements of the product.
5-26
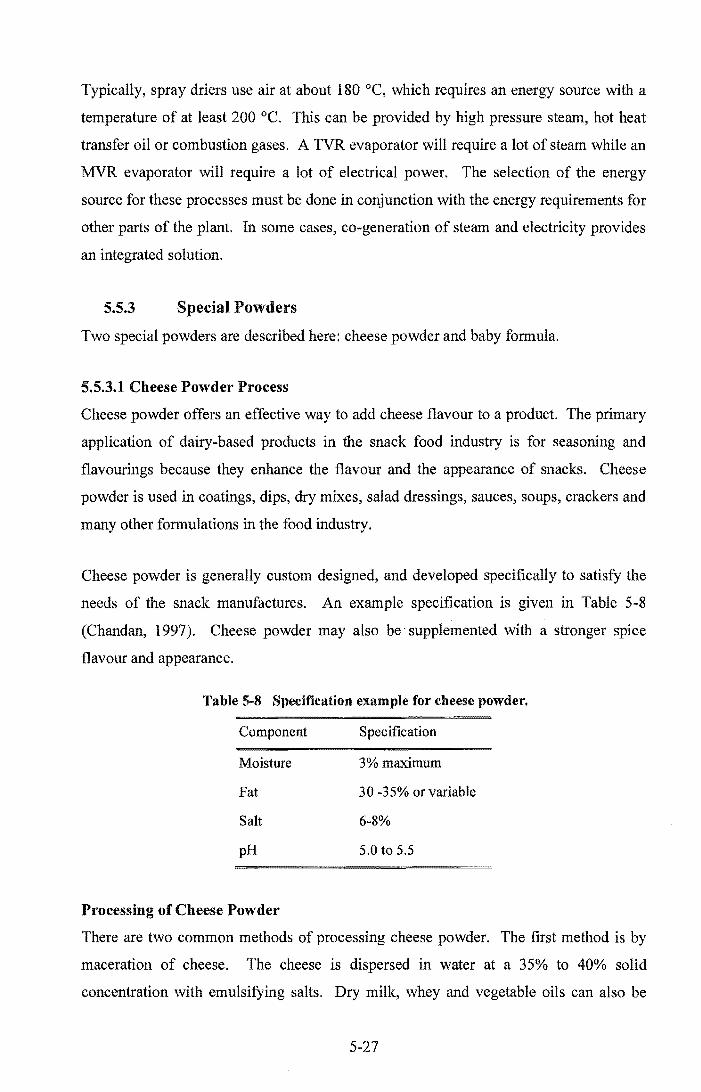
Typically, spray driers use air at about 180°C, which requires an energy source with a
temperature of at least 200 °C. This can be provided by high pressure steam, hot heat
transfer oil or combustion gases. A TVR evaporator will require a lot of steam while an
MVR evaporator will require a lot of electrical power. The selection of the energy
source for these processes must be done in conjunction with the energy requirements for
other parts of the plant. In some cases, co-generation of steam and electricity provides
an integrated solution.
5.5.3 Special Powders
Two special powders are described here: cheese powder and baby formula.
5.5.3.1 Cheese Powder Process
Cheese powder offers an effective way to add cheese flavour to a product. The primary
application of dairy-based products in the snack food industry is for seasoning and
flavourings because they enhance the flavour and the appearance of snacks. Cheese
powder is used in coatings, dips, dry mixes, salad dressings, sauces, soups, crackers and
many other formulations in the food industry.
Cheese powder is generally custom designed, and developed specifically to satisfy the
needs of the snack manufactures. An example specification is given in Table 5-8
(Chandan, 1997). Cheese powder may also be' supplemented with a stronger spice
flavour and appearance.
Table 5-8 Specification example for cheese powder.
Component Specification
Moisture 3% maximum
Fat 30 -35% or variable
Salt 6-8%
pH 5.0 to 5.5
Processing of Cheese Powder
There are two common methods of processing cheese powder. The first method is by
maceration of cheese. The cheese is dispersed in water at a 35% to 40% solid
concentration with emulsifying salts. Dry milk, whey and vegetable oils can also be
5-27

added. It is then homogenised and the concentrate is spray dried by atomising it in a hot
air stream. Cheese powder collected in this way is expensive compared to the original
dried cheese blends, which are just dehydrated cheese. For example, hard Italian
parmesan cheese is dried after grating in tray or belt dryers to reduce moisture to less
than 6%. After cooling, this cheese is ground and packaged.
The second method of cheese processing involves the treatment of raw cheese curd with
specific lipases and proteases along with fermentation by a cheese culture. The cheese
paste is then heated to stop the reaction before being cooled. It is called enzyme
modified cheese and can be sold as a paste or blended as in the first method, and spray
dried into a cheese powder product.
5.5.3.2 Baby Formula Process
Infant formula based on cows' milk has a composition and nutritive value designed to
simulate human milk. The protein and fat composition of cow's milk is modified to
make it similar to that of human milk (Chandan, 1997). Commercially available infant
formulas are produced to meet nutritional requirements of infants. Other additives may
be included e.g., vitamins and whey protein isolates in different proportions (Ahmed et
al., 1998).
Quality control is very rigorous with regard to microbial populations, pesticide levels,
mineral content and vitamin concentrations (Chandan, 1997). Baby foods are normally
formulated from non-fat milk solids, demineralised whey, vegetable oils, lactose and
com syrup solids and/or sucrose. These formulations are wet blended and homogenised
before spray drying.
There are major qualitative and quantitative differences in protein, lactose, and mineral
(ash) content between cow and human milk as shown in Table 5-9 (Bylund, 1995).
Milk is the only food for young mammals during the first period of their lives. The
substances in milk provide the infant with both energy and building materials necessary
for growth.
5-28

Table 5-9 Quantitative composition of cow and human milk (Bylund, 1995).
Milk Protein total % Casein % Whey protein % Fat % Lactose % Ash %
Cow 3.5 2.8 0.7 3.7 4.8 0.7
Human 1.2 0.5 0.7 3.8 7.0 0.2
The conversion of cow's milk into infant formula generally involves the following
(Bylund, 1995; Chandan, 1997):
1. Reducing the minerals, especially the sodium content
2. Reducing the protein level
3. Reducing the casein to whey protein ratio
4. Increasing the lactose content
5. Increasing the vitamin levels
6. Replacing the milk fat with vegetable oil to simulate the fatty acid profile of
human milk.
Baby foods are available either in powder, concentrated or ready-to-feed liquid formula
(see Figure 5-11).
Pathogen control & Composition
control
Ingredients
Blend (emulsifiers, stabiliser, whey,
vitamins, minerals, vegetable oils),
Homogenisation
Packaging in bottles
Spray drying
Figure 5-11 Schematic flowsheet of infant formula production.
5-29
Liquid infant formula

5.6 Production of Casein
The proteins in milk can be broadly classified into two groups, the casein proteins (2.8%
of milk) and whey proteins (0.75% of milk). Casein is the protein precipitated from the
skim milk by acids or enzymes while the whey protein remains in solution (Hynd, 1975;
New Zealand Institute of Chemistry, 1998). All the amino acids that are essential for
humans are present in casein in high proportions, with the possible exception of cysteine
which is present only in low concentrations (Fox & McSweeney, 1998). Casein may be
considered a highly nutritious protein. Casein is a principal component of ordinary
cheese but is also separated as a pure protein.
The manufacture of casein from skim milk requires the casein to be separated from the
whey components, namely, lactose, whey proteins, fat, minerals and other minor
organic components (Hobman, 1978).
Table 5-10 shows that casein proteins are the major milk proteins, constituting 80% of
the total milk proteins. Casein proteins are made up of many hundreds of individual
amino acids, some of which may have a positive or negative charge (Southward, 1998;
Walstra and Jenness, 1984). The amino acid types and their order in the protein
molecule determine the nature of the protein. Any change in type or position may result
in a protein with different properties. The number of combinations of the 18 amino
acids present in milk protein in a chain containing 100 - 200 amino acids creates almost
unlimited numbers of proteins with different properties (Bylund, 1995).
Table 5-10 Concentration of milk proteins (Walstra & Jenness, 1984).
Protein
Casein Alpha Beta
Kappa Others Total
p. Lactoglobulin n- Lactalbumin
Immunoglobulin Others Total
Number of amino acids
406 209 169
162 123 100
5-30
Amount oftotal proteins (w/w)
38.6% 28.4% 10.1% 2.9% 80%
9.8% 3.7% 2.1% 4.4% 20%

Until the 1960s the major uses of casein were in technical, non-food applications such
as adhesives for wood, in paper coating for high quality printing paper, leather finishing
and in synthetic fibres, as well as plastics for buttons, buckles, photo resist etc.
(Southward 1986; Muller, 1971). Nowadays, casein is used as an ingredient in foods to
enhance their functional properties, such as whipping and foaming, water binding and
thickening, emulsification and texture, and to improve their nutrition, including weight
loss and weight gain beverages and to make imitation cheese (Southward & Walker
1980).
5.6.1 Casein Process
Skim milk is the raw material that has previously been separated from whole milk and
has been through a pathogen control step. Cream is the co-product from the initial
separation. The casein protein is precipitated to form a coagulum, it is heated (cooked),
then the curd is separated from the whey and is washed several times with water prior to
mechanical dewatering (Southward & Walker, 1980). The casein-making process is
shown in Figure 5-12. Three types of casein are produced and named in accordance
with the coagulating agent employed, namely lactic acid casein, mineral acid casein and
rennet casein.
Whole milk ---~
Mineral acid
Hot and cool Water water air
"\ I Cooking
Separation
Skim milk Lactic acid 1-----+1
Washing Drying Milling Sieving
Raw material
Rennet
Precipitation by coagulating agent
Blending
...... ;t. ..... l Whey l .. "'., ........ .
Whey removal
.. ... '11( ......
1 Water 1 ........ , .....
Water removal
casein
Drying
Figure 5-12 Generalised flowsheet of mineral acid, lactic acid and rennet casein
production.
5-31

The properties of different types of acid casem are very similar and for most
applications, the acid casein can be used interchangeably, although lactic acid casein is
perceived to be more natural in some markets. Acid casein and rennet casein have the
co-product whey that is generally classified as acid whey or sweet whey (neutral pH).
Mineral Acid Casein Production
For the precipitation of mineral acid casein, warm pasteurised skim milk at a pH of 6.7
is mixed with dilute hydrochloric or sulphuric acid to reduce the pH to approximately
4.7. The casein is precipitated as individual particles in a liquid serum (whey), unlike
the gel/coagulum formed in lactic acid casein manufacture (Southward, 1998). The
acidified milk mixture is then heated, held in a tubular flow device or vat and processed
in the standard manner described below.
In Australia and Europe, the most common precipitant for acid casein is hydrochloric
acid, which is a by-product of the chemical industry and hence is relatively cheap. In
New Zealand, however, sulphuric acid is relatively cheap, because it is produced in
comparatively large quantities by the fertiliser industry for use in the manufacture of
superphosphate (Southward, 1998). Consequently, mineral acid casein is precipitated
using sulphuric acid in New Zealand.
Lactic Acid Casein Production
For the traditional manufacture of lactic acid casein, skim milk is first pasteurised at 72
°C for 15 seconds. It is then cooled to a setting temperature of 22°C to 26 °C and
inoculated with several strains of lactic acid producing bacteria known as the starter
bacteria. The milk is then held without agitation in silos for a period of about 16 hours
while the bacteria tum some of the lactose in the milk into lactic acid (Southward,
1998). This reduces the pH to about 4.7, causing the coagulation of casein.
The coagulum is then heated to a temperature of about 50 DC, and followed by a brief
period of residence in a cooking line and "acidulation vat".
5-32
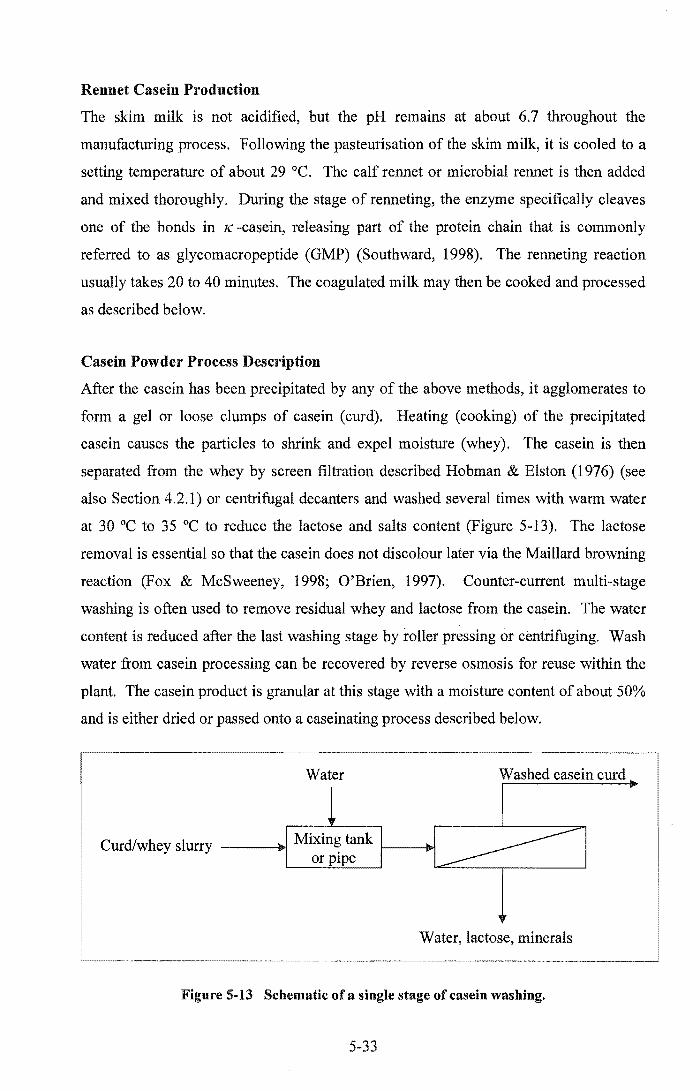
Rennet Casein Production
The skim milk is not acidified, but the pH remains at about 6.7 throughout the
manufacturing process. Following the pasteurisation of the skim milk, it is cooled to a
setting temperature of about 29°C. The calf rennet or microbial rennet is then added
and mixed thoroughly. During the stage of renneting, the enzyme specifically cleaves
one of the bonds in K -casein, releasing part of the protein chain that is commonly
referred to as glycomacropeptide (GMP) (Southward, 1998). The renneting reaction
usually takes 20 to 40 minutes. The coagulated milk may then be cooked and processed
as described below.
Casein Powder Process Description
After the casein has been precipitated by any of the above methods, it agglomerates to
form a gel or loose clumps of casein (curd). Heating (cooking) of the precipitated
casein causes the particles to shrink and expel moisture (whey). The casein is then
separated from the whey by screen filtration described Hobman & Elston (1976) (see
also Section 4.2.1) or centrifugal decanters and washed several times with warm water
at 30°C to 35 °C to reduce the lactose and salts content (Figure 5-13). The lactose
removal is essential so that the casein does not discolour later via the Maillard browning
reaction (Fox & McSweeney, 1998; O'Brien, 1997). Counter-current multi-stage
washing is often used to remove residual whey and lactose from the casein. The water
content is reduced after the last washing stage by roller pressing or centrifuging. Wash
water from casein processing can be recovered by reverse osmosis for reuse within the
plant. The casein product is granular at this stage with a moisture content of about 50%
and is either dried or passed onto a caseinating process described below.
Washed casein curd 110
I Curd/whey slurry ---+1 Mixing tank J-----JIi>t
or pipe
Water, lactose, minerals
Figure 5-13 Schematic of a single stage of casein washing.
5-33

Vibrating fluidised bed driers, with one or more decks, and pneumatic-conveying ring
driers have been found suitable for drying casein to its equilibrium moisture content of
8% to 12% (Bylund, 1995; Kessler, 1981). The dry processing stage includes moisture
equilibration, size control and blending and packing. The warm and unmilled casein
from the dryer is normally cooled (perhaps by air conveying) and circulated to ensure
that moisture is well distributed within and between particles. It is then milled, sifted
(to separate different particle sizes) and blended (to ensure uniformity). The casein is
finally packed. Washing and drying casein involve moisture equilibration; size control,
blending according of the client requirements. Figure 5-14 shows the casein powder
flowsheet.
~-
Coagulating Heat,
ar electricity Hot air
1 Skim milk Pathogen Casein protein Curd Curd washing, Curd
control f-+ coagulation f-+ production ~ decanting r+ Drying I---
~ l l Whey, lactose, Water Water
minerals ~
I Milling, I Sieving
1 I pact I
Casein powder
Figure 5-14 Schematic flowsheet of casein powder production.
5.6.2 Caseinate Process
Caseinates are water-soluble derivatives of acid caseins, produced by the reaction of
either fresh acid casein curd or dried acid casein with alkalis. The most common alkali
used is sodium hydroxide solution but calcium, potassium and ammonium hydroxides
are also used. (Southward, 1998; Muller, 1971) The usual amount of sodium hydroxide
needed is about 1% (w/w) of the casein solids. Dried acid casein curd is milled and
mixed with the alkali using high shear.
5-34

In the manufacture of sodium caseinate from fresh casein curd, it is essential to
dissolved the casein completely. Casein curd is mixed with water and suspensions of
casein in water are disintegrated in a colloid milL Sodium hydroxide is then added to
the slurry, which is subsequently heated and agitated to effect conversion into sodium
caseinate solution (Muller, 1971). Casein reacts readily with sodium hydroxide to
produce sodium caseinate (Towler, 1976). The resulting solution is generally spray
dried to produce a caseinate powder with a moisture content of 3% to 6% (see Figure 5-
15).
Water Dilute alkali Heat Hot air
Acid casein curd
or Wet mill Dissolving Drying Caseinate Dry acid mixing r----+ Agitating Blending
casem
Figure 5-15 Schematic flow sheet of caseinate production.
Caseinate solutions have a high viscosity, so it is difficult to achieve a total solids
content of more than 20%. The high-energy requirements of spray drying mean that a
high total solids content is desirable and thus the viscosity needs to be taken to the
practically allowed maximum. The design needs to take into account the difficulty of
mixing and pumping. A high temperature (up to 95°C) is used during the later
dissolving stages to reduce the viscosity of the sodium caseinate solution and to increase
the reaction rate.
Sodium caseinate is easily dissolved in water and is used in many ways in the food
industry in confectionery, pasta products and meat products (Spreer, 1995).
Ammonium caseinate can be used in the preparation of "photo resist materials", i.e.,
solutions with photographic compounds.
5-35

5.6.2.1 p-Casein Fraction Process
There is an enormous interest in developing techniques for the fractionation of caseins
on an industrial scale for special applications, e.g., ~-casein has very high surface
activity and may find special applications as an emulsifier or foaming agent. Human
milk contains ~-casein but only at a low level. Hence, the ~-casein depleted product
from cows' milk is an attractive ingredient for milk-based baby food formula (Fox &
McSweeney, 1998).
The ~-casein is the most hydrophobic of the caseins. Up to 80% of the ~-casein may be
recovered from milk or dilute sodium caseinate solution by (loose) ultrafiltration at 2 °C
and the ~-casein may be recovered from the permeate by (tight) ultrafiltration at 40°C
(pearce, 1992; Fox & McSweeney, 1998) (see Figure 5-16).
Milk or Sodium caseinate
Phospholipoproteins UsI,Us2, K-caseins
Retentate
UF
Permeate Permeate
~-casein enriched
~-casein emiched
Water p-enriched casein fractions
Figure 5-16 Schematic p-casein enriched fractions flowsheet.
The fractionation of ~-casein also can be achieved by different methods such as ion
exchange adsorption, selective precipitation with CaCh (Fox & McSweeney 1998).
5-36
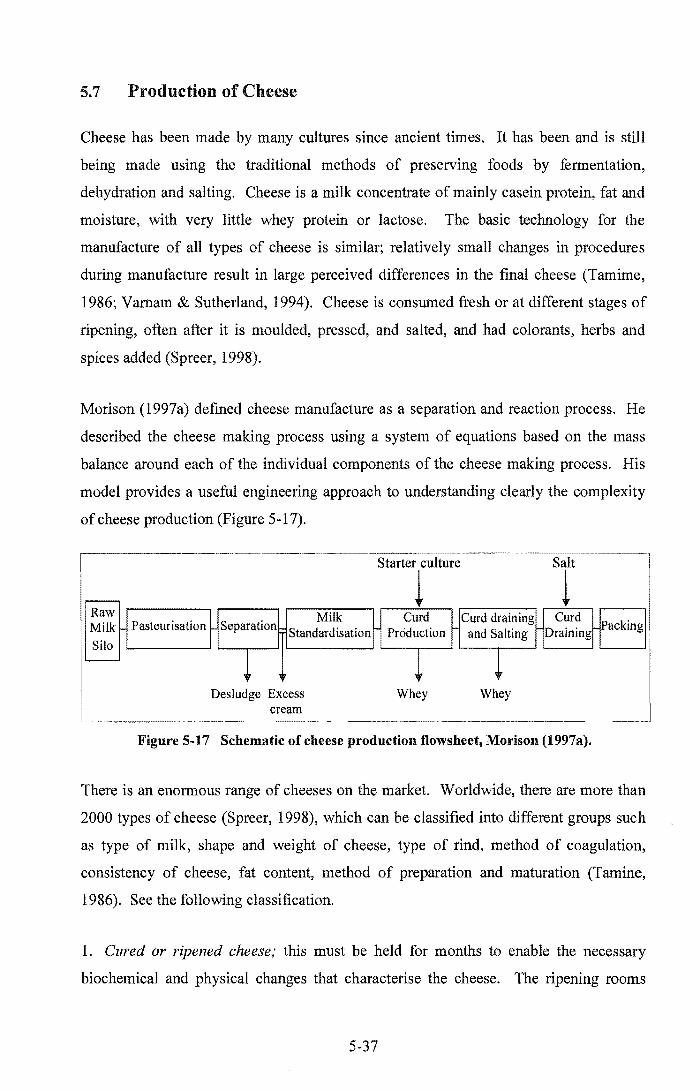
5.7 Production of Cheese
Cheese has been made by many cultures since ancient times. It has been and is still
being made using the traditional methods of preserving foods by fermentation,
dehydration and salting. Cheese is a milk concentrate of mainly casein protein, fat and
moisture, with very little whey protein or lactose. The basic technology for the
manufacture of all types of cheese is similar; relatively small changes in procedures
during manufacture result in large perceived differences in the final cheese (Tamime,
1986; Vamam & Sutherland, 1994). Cheese is consumed fresh or at different stages of
ripening, often after it is moulded, pressed, and salted, and had colorants, herbs and
spices added (Spreer, 1998).
Morison (1997a) defined cheese manufacture as a separation and reaction process. He
described the cheese making process using a system of equations based on the mass
balance around each of the individual components of the cheese making process. His
model provides a useful engineering approach to understanding clearly the complexity
of cheese production (Figure 5-17).
Starter culture Salt
- 1 t Raw Milk Curd Curd draining Curd
Packing Milk n Standardisation Production and Salting Draining
- ~ t ~ Desludge Excess Whey Whey
cream
Figure 5-17 Schematic of cheese productiou flowsheet, Morisou (1997a).
There is an enormous range of cheeses on the market. Worldwide, there are more than
2000 types of cheese (Spreer, 1998), which can be classified into different groups such
as type of milk, shape and weight of cheese, type of rind, method of coagulation,
consistency of cheese, fat content, method of preparation and maturation (Tamine,
1986). See the following classification.
1. Cured or ripened cheese; this must be held for months to enable the necessary
biochemical and physical changes that characterise the cheese. The ripening rooms
5-37

must have the temperature and humidity appropriate for each type of cheese, and
ripening time is needed (Kessler, 1981). Different regions of the world have evolved
varieties of cheese types some of them are shown in Table 5-11. This table gives also
average values for storage temperature conditions and ripening storage time of some
extra hard, hard, semi-hard and semi-soft cheeses.
2. Mould cured or mould-ripened cheese; the curing has been accomplished primarily
by the development of characteristic mould growth throughout the interior andlor on the
cheese surface (Shaw, 1986).
3. Uncured, unripened or fresh cheese; the manufacture is similar to that of rennet
cheese, but it has a high degree of acidity and it is not subjected to a proteolytic ripening
process (Spreer, 1998). This cheese is ready for consumption shortly after manufacture.
All cheese, apart from fresh cheese goes through a series of microbiological,
biochemical and physical processes cycle called ripening (Bylund, 1995). Ripening is
caused by bacteria or by yeast and/or moulds and their enzymes (Kessler, 1981).
Ripening varies widely between hard, medium-soft and soft cheeses and even within
these groups.
Table 5-11 Origin ofthe main cheese types in the world (Bylund, 1995; Kessler, 1981).
Type Country Fat on Moisture Ripening Temp. of Texture of origin dry % in fat storage ripening
basis free basis time
Parmesan I 35+% ~ 40% 1-2 years 10-15°C Extra hard Grana I 35+% ~ 41% 1-2 years 10-15°C Extra hard Emmenthal CH 45+% ~ 52% 9 months 12-18°C Hard Gruyere F 45+% ~ 52.5% 9 months 12-18°C Hard Cheddar UK 50+% ~ 55% 4-12 months 4-8°C Hard/Semi-hard Gouda NL 45+% ~ 57% 2-12 months 12-15°C Semi-hard Tilsiter D 45+% ~ 57% 2-3 weeks 10-12°C Semi-hard Havarti DK 45+% ~ 59% 2-12 months 12-15°C Semi-hard Blue DK,F,S 50+% ~ 61% 5-8 weeks 9-12°C Semi-hard or cheese Semi-soft Brie F 45+% ;::;; 68% 5-8 weeks 9-12°C Semi-soft
USA > 10% < 69% Soft
I-Italy, CH-Switzerland, UK-United Kingdom, NL-Netherlands, D-Germany, DK
Denmark, F-France, S-Spain, USA- United States of America.
5-38

5.7.1 Cheese Making Process
Cheese making involves a number of main stages that are commonly used in most types
of cheese. There should first be a pathogen control step (normally pasteurisation), not
only for food safety but also to enable the added cheese starter bacteria to grow without
competition. Separation is required to produce the skim milk and cream streams, which
are later recombined to obtain a process feed with a standardised fat content.
Standardisation of the protein content or protein to fat ratio is also possible by adding a
protein enriched stream (perhaps produced by UF, Section 4.2.1.2). The rennet and the
starter culture are mixed into the standardised milk in a vat, causing the milk to set and
the pH to drop. Once set, the coagulum is cut and heated to form the curd (Vickers,
1968). The whey is separated from the curds either by draining it from the vat or by
pumping the curd/whey slurry onto the draining belts or into moulds. All the cheese
making process steps up to this point are common for all cheeses. The method of
salting depends on the cheese type. Salting can be achieved by adding salt to the whey,
to the curd, or onto the rind, placing the cheese in brine, or in whey and brine (Kessler,
1981). In brine salting, the cheese is placed in a container with brine, Le., any system at
about 12°C to 14 °C (Bylund, 1995). The curd can be salted and mixed in the vat or on
a belt (dry salt). The curd is then formed into blocks of standard weight before it is
packed. Excessive handling particularly during vat filling, cutting the curd and
pumping operations will result in increased fat and casein losses in the whey (Phelan,
1981; Chapman, 1981; Callanan, 1991). A typical dry salt cheese making process IS
shown in Figure 5-18.
If cheese-making is considered purely as a chemical and physical process, the flowsheet
can be represented conceptually (dry salted cheeses) as shown in Figure 5.18, where a
primary liquid feed stream (milk) is processed via a number of operations to obtain a
solid product with specified functionality for a customer. Warm water is used only for
some cheeses.
The moisture content of the cheese serves to distinguish various categories, such as the
hard (low-moisture), semi hard and soft cheeses. Each category is further distinguished
by a number of characteristics, such as the structure (texture, body), flavour and
appearance, which depend on the choice of bacteria and technique employed. The
moisture level depends on the operating conditions used. The moisture content of
5-39

cheese is a significant factor in the production quality and profitability of a cheese
making process, as it is the cheapest components of cheese, higher moisture should
yield higher profits.
Seasonal variation in the composition of milk protein can have a significant influence
on the cheese yield, and also the percentage of fat recovery varies between 85% and
93% depending on the system used (Phelan, 1981; Callanan, 1991).
Starter culture Coagulating Warm Salt
Milk ~
Liquid feed Stream
Pathogen and composition control
agent water
Reaction Cheese curd
I I I I I I I I I I I I I I I
V V V
Raw whey Wash water Cheese fines
Reaction Phase separation
Block forming
I I Solid I I product I I
V
Raw salt whey Cheese
Packaging
Figure 5-18 Conceptual representation of dry salt cheese production.
5.7.2 Production Requirements and Constraints
Pathogen control (pasteurisation) of the liquid feed may be required for health reasons
and often in order to satisfy local regulations. The product quality can be measured by
five variables in order to determine how well the cheese conforms to the specification
(Jones, 1999). These are pH, salt, moisture, fat and sensory evaluation.
Sodium chloride is added for three distinct purposes. Firstly, the salt influences
processes which affects acid development by inhibiting the action of the starter and
many of the characteristics of the cheese (Spreer, 1998). Secondly, salt improves the
consistency of the cheese. Finally, it also improves the flavour. Manufacture and
5-40
maturation of cheese seems to be impossible without lactic bacteria. Growth of most of
the lactic bacteria is also slowed if not stopped by the addition of salt (Walstra et at.,
1999).
5.8 Production of Whey Protein Products
For a long time, whey was regarded as no more than a waste product of conventional
cheese making. Now however, it is used as a co-product with valuable nutrients and of
economic importance in the efficient utilisation of the raw material (milk). In recent
years, utilising whey derived ingredients such as whey proteins for functionality and
nutritional value has made whey a profitable resource.
Whey protein in general, and a-lactalbumin in particular, has very high nutritional
value. Whey protein is the milk serum protein that is produced after the separation of
casein and fat during the manufacture of cheese and also after the casein is coagulated
by acid. Sweet whey, which is rennet whey can be distinguished from acid whey, which
is a result of acid coagulation (Spreer, 1998; Zadow, 1986) (see Section 5.6.2).
Production of cheese leaves about 85% of the milk volume as whey, which contains
whey proteins, lactose, salts in solution and water.
Whey proteins can be recovered from the whey by salting out, dialysis or ultrafiltration
(Fox & McSweeney, 1998). Whey can also be recovered by heat precipitation at 37 °c
or salting-out method, where saturation with NaCI at 37 °C precipitates not just the
casein but also the immunoglobulins because the immunoglobulins are among the most
heat-sensitive components of the whey proteins (Fox & McSweeney, 1998). The
majority of whey proteins remain soluble, provided they are undenatured.
Whey concentration by RO (which reduces transport costs) and whey fractionation by
UF (which produces a whey protein concentrate which is a valuable co-product) have
become the largest membrane applications in the food industry today (Mannapperuma,
1997; Hobman, 1992).
5-41

Deproteinated whey or serum derived from the whey plant, whey from the production of
cheese and whey from the production of casein are a potential source of lactose for
lactose powder and non-alcoholic beverages (Short, 1978).
Cheese fines (casein and fat residues) and lipid residue often interfere with the
membrane separation processes and impair the functionality of whey protein products
(Korhonen et al.) 1998). Methods based on centrifugal separation, heat treatment or
microfiltration have been developed to remove fines and lipids from whey.
The applications for whey products are increasing with more advanced separation
techniques. Rather than dealing with all the variety of whey applications, here only the
manufacture of whey powder, whey protein concentrate, whey protein isolate,
lactoferrin and a-lactalbumin will be described, although the manufacture of individual
ingredients will also be cited.
5.S.1 Whey Products Processes
The raw material for whey protein or whey protein concentrate is sweet whey or acid
whey. There are two basic issues that become evident in both processes. One of these
issues is the high water content of whey about 93.4% wt (Rudd et al., 1973) and the
other is its very short life because of high bacterial levels.
Processing whey has long been a problem, especially as the cheese industry has grown.
Initially, in a small-scale cheese production, the whey was used to feed animals, in what
could be termed a by-product and animal integration. Then, as cheese production
increased, the disposal of large volumes of whey took the next alternative of integration,
which was the land disposal for crops production and pasture. This also became a
problem when the cost of widespread application was high. The land can be also
constrained by disposal regulations in order to maintain a clean environment. Thus, the
opportunities of whey processing appear as an alternative to effluent treatment (see
Figure 5-19). The initial cost of whey processes were initially high but with the
advancement of technology, whey products have become very important alternative co
products that generate high revenue. Although whey mostly consists of water, it also
contains many of milk's nutrients (Archer, 1998). Fractions of whey are designated as
a-fraction, the aggregate phase, and the ~-fraction, the soluble phase (Pearce, 1992;
5-42

Varnam & Sutherland, 1994), as shown in Figure 5-19. However, some processes for
manufacturing these whey-based products for food and non-food uses are economically
feasible only for larger sized processing operations, with an adequate supply of
consistently high-quality whey, and adequate market demand for the products (Morr,
1992; Jelen, 1992).
Whey protein Concentrate
(WPC)
~ ~
~ Processing
l
Whey cream cheese
l l
Whey
.}
~ Land disposal
Demineralised whey powder
l Direct animal "''-'''',",UJll;;.
Whey fractions
Lactose Whey protein isolates (WPI)
Minerals a-Fractions ~-Fractions
~ Ethanol a-Lactalbumin
Phospholipoproteins
Lactoferrin
Bovine serum albumin (BSA)
Inmunoglobulins
Enzymes
~ ~-Lactoglobulin
Figure 5-19 Schematic representation of some whey use opportunities.
5.8.2 Whey Protein Concentrate (WPC) Process
Whey protein concentrates are products derived from whey by removing the curd fmes
(casein and fat residues), minerals, lactose, and water. Whey is recovered from cheese
or casein manufacture operation it is inevitable that low levels of "curd" fmes are
present in the whey, which has a serious risk of blocking heat exchanger channels, and
ultrafiltration and reverse osmosis membranes (Pearce, 1992; Matthews, 1984).
Therefore, clarification of raw milk is achieved by either combination of settling,
screening and centrifugation.
5-43
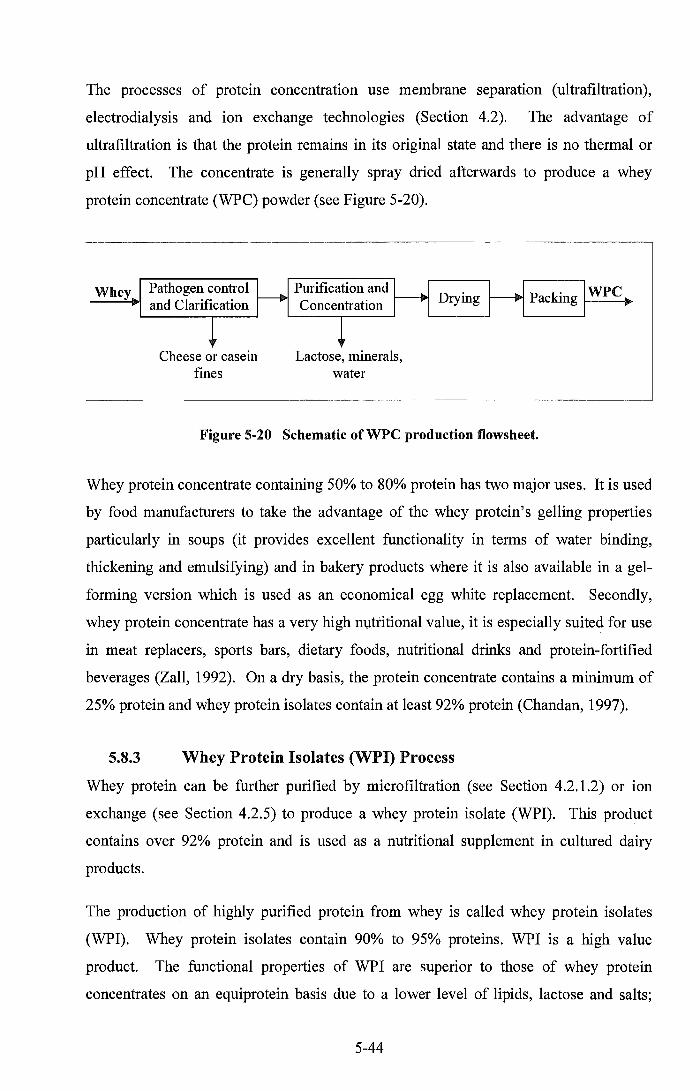
The processes of protein concentration use membrane separation (ultrafiltration),
electrodialysis and ion exchange technologies (Section 4.2). The advantage of
ultrafiltration is that the protein remains in its original state and there is no thermal or
pH effect. The concentrate is generally spray dried afterwards to produce a whey
protein concentrate (WPC) powder (see Figure 5-20).
Whey Pathogen control and Clarification
Cheese or casein fines
Purification and Concentration
Lactose, minerals, water
Figure 5-20 Schematic ofWPC production flowsheet.
Whey protein concentrate containing 50% to 80% protein has two major uses. It is used
by food manufacturers to take the advantage of the whey protein's gelling properties
particularly in soups (it provides excellent functionality in terms of water binding,
thickening and emulsifying) and in bakery products where it is also available in a gel
forming version which is used as an economical egg white replacement. Secondly,
whey protein concentrate has a very high nutritional value, it is especially suited for use
in meat replacers, sports bars, dietary foods, nutritional drinks and protein-fortified
beverages (Zall, 1992). On a dry basis, the protein concentrate contains a minimum of
25% protein and whey protein isolates contain at least 92% protein (Chandan, 1997).
5.8.3 Whey Protein Isolates (WPI) Process
Whey protein can be further purified by micro filtration (see Section 4.2.1.2) or ion
exchange (see Section 4.2.5) to produce a whey protein isolate (WPI). This product
contains over 92% protein and is used as a nutritional supplement in cultured dairy
products.
The production of highly purified protein from whey is called whey protein isolates
(WPI). Whey protein isolates contain 90% to 95% proteins. WPI is a high value
product. The functional properties of WPI are superior to those of whey protein
concentrates on an equiprotein basis due to a lower level of lipids, lactose and salts;
5-44
their production is limited by higher production costs (Fox & McSweeney, 1998). The
functional properties include foam stability and total solubility over a range of pH's
producing a clear solution compared with the turbidity that occurs with fat containing
milk products. When WPI is whipped, it forms a foam which is equivalent to that
produced by fresh egg white both in its foam volume and stability (Palmer, 1977).
The process of whey protein isolates involves the isolation of protein from solution by
means of ion exchange resins, which offers an effective method for the production of
whey protein isolates (Palmer, 1977; Herve, 1974; Jones, 1974; Ayers et al., 2003).
These ion exchangers have the ability to selectively adsorb, great quantities of high
molecular weight materials, in particular proteins from solution (Palmer, 1977). Protein
may be recovered from the resin when this is exhausted by regenerating the bed (Grant,
1974).
The ~-lactoglobulin is a major protein in cows' milk, it represents about 50% of total
whey protein and 12% of the total protein in milk (Fox & McSweeney). A number of
methods have been developed for the separation of a-lactalbumin fractions and ~
lactoglobulin fractions (Etzel, 1999; Kuwata & Ohtomo, 1989).
The whey protein isolates can be also processed from whey by using ion exchange
chromatography, and precipitation using FeCh or polyphosphates (Fox & McSweeney,
1998).
5.8.4 Special Whey Proteins
Whey proteins possess interesting functional properties, nutritional, physiological and
pharmaceutical properties. Special proteins can be also flavourful. Consumers may not
always realise that this category of products does indeed come from milk, e.g. the
natural antibacterial lactoferrin protein. Thermal fractionation of whey can be used in
the production of two main whey proteins fractions, the a fractions and the ~-fractions
(Varnam & Sutherland, 1994). These protein fractions have specific functional
properties widely used in the food industry. Mozaffar et al. (2000) provide methods and
compositions for the sequential separation of whey protein fractions.
5-45

5.8.4.1 Ladoferrin Process
Lactoferrin is a natural antibacterial and anti viral protein (Bloore, 2001). Lactoferrin
protein is an inhibitor of bacteria. This inhibition is caused by the removal of iron ions
from the serum. Lactoferrin has good solubility and binds iron so strongly that it is not
available for pathogens (Korhonen et al., 1998).
Many biological functions of lactoferrin have been reported; the bacteriostatic effect of
lactoferrin being perhaps the most significant of its biological functions (Abe et al.,
1991). Lactoferrin provides a wide range of benefits in oral health care and it is
suggested that toothpaste (Fox & McSweeney, 1998) be fortified with proteins such as
lactoferrin to promote superior oral hygiene.
Human milk has a higher lactoferrin content than cows' milk (Walstra et al., 1999).
Therefore, there is considerable interest in supplementing cows' milk based infant
formulae with lactoferrin. The concentration of lactoferrin in colostrum is about 1250
mg/kg. In mid lactation, the concentration falls to less than 100 mg/kg in cow's milk
(Walstra & Jenness, 1984).
Figure 5-21 shows a simplified method patent by Ahmed et al. (1998), a sequential
separation of whey proteins using radial-flow chromatography, where lactoferrin is one
of the protein fractions isolated from whey. ,
Whey
Colloidal and suspended particles (fat, casein fines)
Retentate
Permeate
Acetic acid
Chromatographic
(cation-exchange)
Immunoglo bulin, a-lactalbumin
Reconditioning with a buffer
Chromatographic Lactoferrin
(cation-exchange)
Bovine serum albumin, buffer
Figure 5-21 Lactoferrin process flowsheet (adapted from Ahmed et al., 1998).
5-46

5.8.4.2 a-Lactalbumim Protein Fraction Process
The a-lactalbumin fraction is one of the two main whey protein fractions, representing
about 20% of total whey protein. a-Lactalbumin is the most abundant protein in human
milk, therefore a-lactalbumin is widely used as a source as a highly humanised infant
food (Vamam & Sutherland, 1994). The concentration of lactose in milk is directly
related to the concentration of a-lactalbumin as its biological function is as a coenzyme
in the synthesis oflactose (Walstra et al., 1999).
The a-lactalbumin is present at low concentrations and is hence relatively expensive to
produce (Fox & McSweeney, 1998). These proteins can be used in a variety of
nutritional designed products, a few examples of which are breakfast cereals, nutrition
bars, dietary beverages and general food fortification. These proteins take on the
flavour of anything they come in contact with so they fit very well with whatever
product is being designed.
Processing of a-Lactalbumin
Figure 5-22 shows the heat denaturation of the proteins in acid or rennet whey, usually
at about 90 °e. Whey protein is heated at an acidic pH of about 6 (Fox & McSweeney,
1998) and precipitated as a-lactalbumin. The -precipitate is recovered by settling,
decanting, centrifugating or filtering processes. Washing may be used to reduce the
lactose and mineral content before the drying takes place in a spray drier, fluidised bed
or roller drier, in order to recover up to 90% of the original protein. The conditions
used vary according to the types of whey and the properties that are required in the final
product (Vamam & Sutherland, 1994).
The a-lactalbumin proteins are very hygroscopic and will lump badly and become
unusable in the presence of moisture if not properly sealed during storage.
5-47

Whey pH adjustment ~ heat precipitation
~
Wllter
! Separation
I I I I
.."
Lactose, Minerals
Drying a-Lactalbumht
Figure 5-22 Schematic a-lactalbumin process flowsheet.
The a-lactalbumin can also be fractionated from whey by a single cation exchanger, and
using different pH values for eluting different protein fractions without using salt
elution (Etzel, 1999).
5.8.5 Production Requirements and Constraints
Whey can be protected against rapid spoilage by chilling it to 4°C. This allows storage
for a few hours before it is further processed. It can also be heat treated, although this
can cause protein denaturation (de Witt & Klarenbeek, 1983). In some countries,
preservatives such as 0.05% hydrogen perqxide or 0.5% sodium or magnesium sulphite
are added.
5.9 Production of Lactose
Lactose, commonly referred to as "milk sugar", is the principal carbohydrate in milk. If
lactose is the major constituent of most of the dried dairy-based products, i.e., 37% in
whole milk powder, 50% in skim milk powder, 50% in butter milk powder, and 70% in
whey powder (Holsinger, 1997).
The disposal ofthe lactose component of whey used to be a worldwide problem in any
country with a large dairy industry. Although the liquid has only 4% to 5% lactose
(milk sugar), this is enough to cause a significant environmental impact because of its
very high biological oxygen demand (BOD).
5-48
Large quantities of lactose in whey are produced as a co-product from the manufacture
of cheese and casein or as a co-product of whey protein concentrate production. This
must be disposed of or processed in an environmentally acceptable way.
Lactose is now used as a product of rich diversity and a variety of grades are available.
It is used extensively in the pharmaceutical industries in its most highly purified form as
a coating agent and to give bulk to pills and tablets, ensuring they are large enough for
people to handle (Harper, 1992), and in the formulation of nutritional health foods
believed to enhance health and well-being. Lactose is used in the food industry to
increase the viscosity or to improve texture without making the product too sweet since
it possesses a mildly sweet taste compared with fructose and saccharose. However,
hydrolysis of lactose makes considerably sweeter products (Bylund, 1995). Lactose is
used in beer manufacture because it is not fermented by yeast. Since it remains in the
finished product, it helps increase the viscosity and improve the mouth-feel and flavour
(Holsinger, 1997). It has similar uses in other dairy beverages and foods such as
toppings, icing, and pie fillings (Chandan, 1997). Lactose can also be fermented into
alcohol, which is then distilled to remove impurities and used in gin, and other spirits.
A major use is in humanised infant formula where the balance between carbohydrate
and protein in cows' milk can be corrected by the addition of lactose (Holsinger, 1997).
It is also used as a fermentation substrate for the production of a variety of products, i.e.,
cheese, lactic acid casein, and yoghurt. Another more recent major use is for the
standardisation of milk powder to maintain a constant protein fraction lower than that
naturally occurring in most milk.
5.9.1 Lactose Process
There are three methods proposed for the commercial production of lactose. They are
crystallisation from a supersaturated solution, precipitation by alkaline earth minerals
and precipitation by solvents, such as alcohol. The most common is the crystallisation
method described as follows.
Lactose is generally produced from rennet whey or from whey permeate obtained by
ultrafiltration of milk or whey. The manufacture of lactose (see Figure 5.23) involves
concentration to high total solids, deproteinisation and demineralisation of whey using
membrane separation processes such as ultrafiltration, nanofiltration reverse osmosis
5-49

(see Section 4.2.1.), or by evaporation (see Section 4.2.3). The mineral content is often
reduced by either electrodialysis and/or ion exchange. A supersaturated solution is
cooled under specific conditions to crystallise the lactose, the crystals formed are
harvested, washed to remove the mother liquor, and dried. The product obtained in this
way contains 98% lactose (Chandan, 1997). To obtain lactose with a higher purity, the
product is redissolved and crystallised to remove colours, proteins, salts and odours
(Kessler, 1981). The particle size of lactose depends on its intended application.
Lactose rich Concentration Crystallisation, Drying (Deproteinisation, f---+ Washing & f----i'> and --+- Packed Lactose
liquid Demineralisation) Decanting Milling
Figure 5-23 Schematic flowsheet of lactose production.
The yield and purity of the crystals are affected by the protein and mineral content of
the starting material. F or this reason, it is best to start with deproteinised, and
demineralised whey. The removal of minerals by ion exchange or electrodialysis
improves the heat transfer in the evaporator by reducing deposit formation and
permiting concentration to 75% totals solids (Holsinger, 1997). Crystallised lactose
needs to be purified by washing with pure water in the centrifuge to produce crude
lactose. The grades of lactose obtainable are: technical 90% to 92%, crude 95% to 98%,
food grade 98% and pharmaceutical grade 99.5% to 99.9% (Kessler, 1981). Figure 5-
24 shows the conceptual inputs and outputs for lactose processing.
Wash water Heating medium Steam
Lactose rich Ii uid
Water Minerals
Figure 5-24 Conceptual representatiou of lactose production.
5-50

5.9.2 Products from Lactose
The principal derivatives of lactose have been covered in many publications including
Thelwall (1997) and Morr (1992). Figure 5 .. 25 shows some of the products from
lactose, two of which are discussed below.
Lactose
Hydrolysed ..-, ,. 01 Lactic Oligosaccharides Lactulose Lactose
iLactitol lactose acid esters
Figure 5-25 Schematic representation of some lactose use opportunities.
5.9.3 Production Requirements and Constraints
Moisture control is essential for maintaining quality. Commercial grade lactose needs
to be purifying from water, protein, lactic acid and mineral matter which are attached to
the surface and crevices of the crystals. Lactose production needs to maximise the
crystallisation to maximise the yield.
5.9.4 Hydrolysed Lactose
Lactose hydrolysis offers the dairy industry a range of products with desirable
functional properties, and has increased the consumption of milk in people who have
lactose intolerance, also hydrolysed lactose is sweeter and more soluble than the
original material.
In the process of hydrolysis, the disaccharide lactose is converted, either chemically by
means of acids in conjunction with a heat treatment or by enzymes (~-galactosidases,
commonly called lactase), to its two component monosaccharides, glucose and
galactose (Fox & McSweeney, 1998; Zadow, 1992).
The drying of hydrolysed lactose is more difficult than normal lactose counterpart
because of the presence of high content of its monosaccharides which form glasses in
5-51
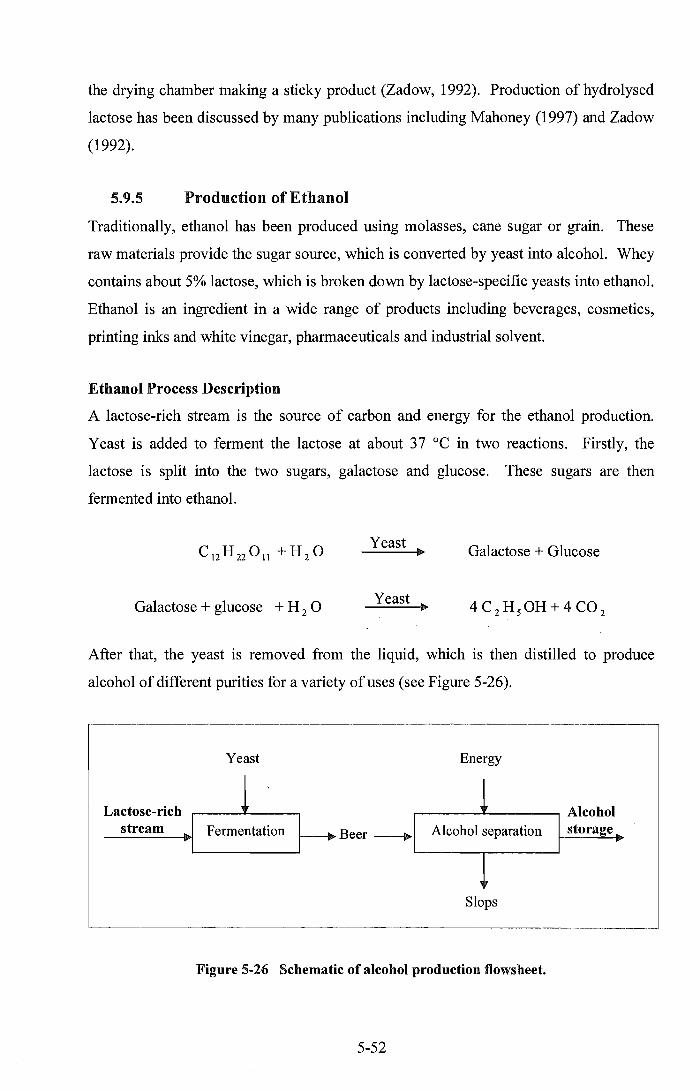
the drying chamber making a sticky product (Zadow, 1992). Production of hydrolysed
lactose has been discussed by many publications including Mahoney (1997) and Zadow
(1992).
5.9.5 Production of Ethanol
Traditionally, ethanol has been produced using molasses, cane sugar or grain. These
raw materials provide the sugar source, which is converted by yeast into alcohol. Whey
contains about 5% lactose, which is broken down by lactose-specific yeasts into ethanol.
Ethanol is an ingredient in a wide range of products including beverages, cosmetics,
printing inks and white vinegar, pharmaceuticals and industrial solvent.
Ethanol Process Description
A lactose-rich stream is the source of carbon and energy for the ethanol production.
Yeast is added to ferment the lactose at about 37°C in two reactions. Firstly, the
lactose is split into the two sugars, galactose and glucose. These sugars are then
fermented into ethanol.
Yeast lit Galactose + Glucose
Galactose + glucose + H 2 0 Yeast lit
After that, the yeast is removed from the liquid, which is then distilled to produce
alcohol of different purities for a variety of uses (see Figure 5-26).
Yeast Energy
Lactose-rich 1 Alcohol stream Fermentation 1----+ Beer ~ Alcohol separation storage
t Slops
Figure 5-26 Schematic of alcohol production flowsheet.
5-52
The recovery of ethanol from a past waste stream (whey) is a good example of process
design applied to rectify a problem. New Zealand now produces much more ethanol
from lactose than it needs. More than half of the total production is exported to
overseas markets.
5-53

6 Integration Based Design
6.1 Definition of process Integration
Process integration is the common term used for the application of methodologies for
system-oriented and integrated approaches for both new and retrofit applications.
Process integration allows feed material, energy, the environment, utilities and time to
be related to the whole process rather than being considered as isolated units.
According to the International Energy Agency (1993), process integration is defined as
the "systematic and general methods for designing integrated production systems,
ranging from individual processes to total sites, with special emphasis on the efficient
use of energy and reducing environmental effects". The emphasis is on energy and the
environment. The lEA (1993) has added to this definition of process integration a
description of the physical arrangement of equipment and the process stream
interconnections in a plant. Process integration is considered to be a major strategic
design and planning technology by leading companies in the process industry
(Gundersen, 2002; Morgan, 1992). Process integration is a relatively new area for
engineering design methodology. Until recently, engineers developed conceptual
process designs by experience and intuition without using methodology (Linnhoff et ai.,
1994).
Different types of process integration can be applied to for the design of dairy
processes:
III Product and component integration,
.. Energy integration,
.. Water integration,
411 Time integration,
411 Clean-in-place integration,
411 Environmental integration.
6-1
Rising material and energy costs in recent years have increased the economic incentive
to employ material and energy integration within a chemical process. These trends have
resulted in a greater interaction among process units which were previously studied
individually as isolated parts of the entire system (Luyben & Flodas, 1994; and Perkins,
2001). One example of integration is the heat exchanger networks, which replace
inefficient uncoupled units (Carlsson et al., 1993; Tjoe & Linnhoff, 1986; Lenhoff &
Morari, 1982).
Modern processes are designed to be more efficient in terms of energy and raw material
usage, implying a higher level of integration (Perkins, 1989; Kenez, 1998). Pinch
analysis, promoted by Linnhoff during the 1980s and early 1990s, was one of the first
systematic assessment techniques for the design of heat exchanger networks. It required
complex process flowsheets that were not only thermally efficient but also industrially
acceptable. Despite being refined by various researchers (Townsend & Linnhoff, 1983;
Kemp, 1986; Kotjabasakis & Linnhoff, 1986; Smith & Patel, 1987), this methodology
was restricted to identifying heat integration opportunities only. Since then pinch
analysis has evolved, its scope has broadened and its application has changed. The
scope today includes separation, waste removal and utility systems, within processes as
well as total sites. Pinch analysis, originally developed for the heat recovery systems, is
now an important concept that initiates the field of process integration (Polley, 1993;
Linnhoff, 1994; Polley, 2002).
In addition, increased product yield through loss minimisation reduces effluent
production through recycling and recovery. More recently, society measures such as
environment effects and sustainability, have become an integral part of the process
integration.
6-2

6.2 Types of Process Integration
There are two general types of process integration. These are "within" and "between"
integration concepts.
6.2.1 Integration "within" an Operation
Most industrial chemical engineering processes consist of a series of standard unit
operations. Each unit operation meets the operation objectives independently within a
process but contains many different processes. This integration is very well identified
and used in the dairy industry. An example is the regeneration section of the
pasteurizer, where raw milk is preheated by the milk coming from the heating section.
Another example is the multi-effect evaporator which uses thermal vapour
recompression and/or mechanical vapour recompression to reuse energy in the vapour.
6.2.2 Integration "within" a Process
A process is a group of operations that together transform a feed material into a product.
Integration within the process is possible and often required. The flow of components
must be integrated between operations within the process to ensure that the product has
the correct composition and that the throughputs are matched. The operating times of
each operation must be integrated to minimise storage times and to maximise
throughput.
There are likely to be opportunities for energy and water integration as heat or cold
water from one operation can be used in another. Cleaning requirements can be
integrated, e.g., by providing one "CIP kitchen" for many different operations in the
process.
Figure 6-1 shows product (salt) and water integration (reuse) within a brine salt cheese
process.
6-3
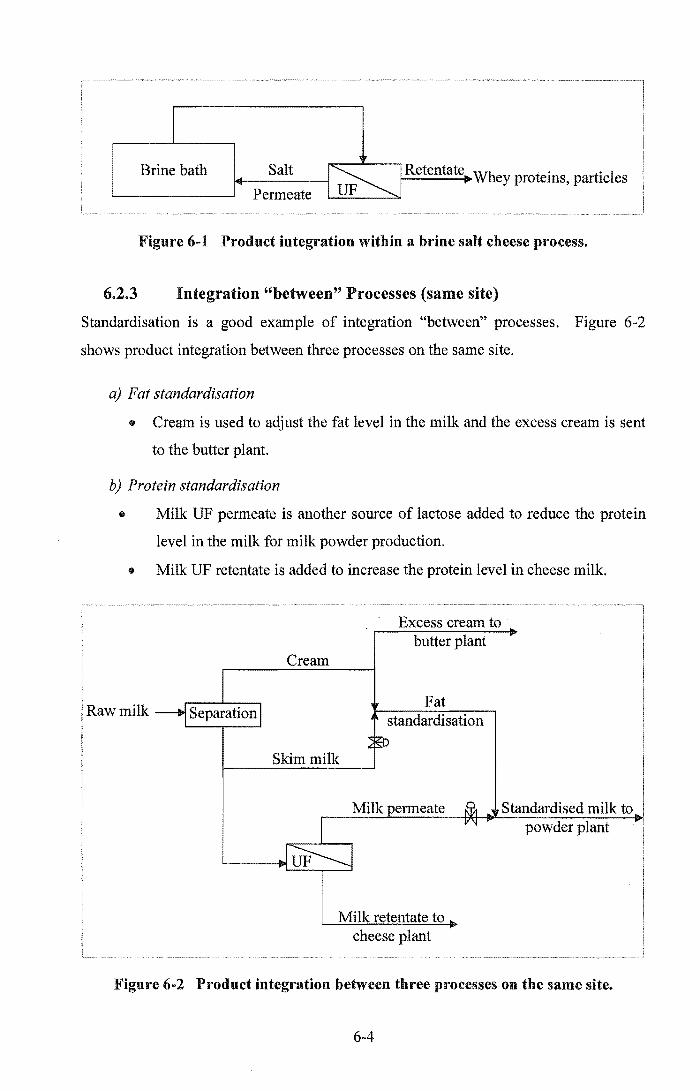
Brine bath Salt Retentate Whey proteins, particles Permeate
Figure 6-1 Product iutegration within a brine salt cheese process.
6.2.3 Integration "between" Processes (same site)
Standardisation is a good example of integration "between" processes. Figure 6-2
shows product integration between three processes on the same site.
a) Fat standardisation
• Cream is used to adjust the fat level in the milk and the excess cream is sent
to the butter plant.
b) Protein standardisation
• Milk UP permeate is another source of lactose added to reduce the protein
level in the milk for milk powder production.
• Milk UF retentate is added to increase the protein level in cheese milk.
Raw milk -iM S
Excess cream to butter plant
Cream
Fat standardisation
Skim milk
Milk retentate to cheese plant
Standardised milk to powder plant
Figure 6-2 Product integration between three processes on the same site.
6-4

1. Process integration of materials between processes involves sending the co
product streams to other parts of the process. For example, excess cream may be
transferred from whole milk powder production to the butter plant.
2. Utilities integration between processes. The integration of utilities in an
operation is well-identified within processes, although integration between processes
still presents a challenge because of the time shifted processes. For example, hot water
from any process such as WPC, lactose and cheese milk treatment to the main storage
for the CIP kitchen area (French, 2003).
6.2.4 Integration "between" Sites
Integration between sites refers to sending the co-products or by-products to other
factories to be further processed. For example, sending whey permeate to a lactose
plant, or cream to the dairy ice cream plant.
Process integration between sites would be restrained to product, co-product and by
product integration. Energy, utilities would probably not be appropriate because of the
geographic separation.
6.2.5 Integration "between" Dairy Processing and Other Activities
The level of integration between dairy proce,ssing,environment and agricultural
activities depends on the scale, and this varies widely among communities. Cheese has
been made for years and the disposal of the whey in large scale operations was a major
concern. While in small scale operations generally, the best alternative for the whey is
for it to be fed to pigs. In this instance, there is integration with animal production.
The most common areas of integration between the dairy industry, animal and pasture
production is in animal feed and crop applications.
Sustainable agricultural production needs to be matched with sustainable consumption.
Sustainable development was defined in 1987 by the Brutlands Commission as
"Development that meets the needs of the present without compromising the ability of
future generation to meet their own needs" (Arthur D. Little Inc., 2001). However, in
an increasingly globalised economy, agricultural companies will only survive if they
can develop a competitive advantage that appeals to consumers (Luostarinen, 1998).
6-5

This presents both challenge and an opportunity. A competitive advantage exists for
someone who combines the needs of customers and the environment. Therefore there is
a pressing need for a methodology to integrate dairy processing and other agricultural
activities.
Table 6-1 summarises some examples of process integration, within and between same
site and between different sites as described above.
Table 6-1 Examples of different types of process integration.
Integration Same site Different Sites
Within Between Between
An operation A process Processes
Product Standardisation Brine Lactose to milk Whey
Salt !UF powder permeate to lactose plant
Energy Past-regeneration, Pinch Cogeneration Cogeneration
Evap. multieffect integration
WaterlEffluent crp reuse RO water to Evap.condensate CIP to boiler
Time Pasteurisation Crystallisation Cheese! WPC Cream! Ice cream
Environment Air heating Bag house Cheese whey to WPC
6.3 Application Areas for Process Integration
Process integration can be applied to the following aspects during the methodology for
the design of dairy processes.
6.3.1 Product and Component Integration
Product and component integration is particularly important in the dairy industry and is
one of the main focuses of this thesis. Consequently, it is considered in detail in the
remainder of this work.
In synthesis, after choosing the main product based on the market, one can identify the
basic product choices shown in Table 6-2 in relation to their milk component
6-6

composition. For a medium scale process, if one wants to produce casein or caseinates
as a first product from whole milk, this leaves other major milk components. The
designer may choose butter or AMF as a co-product and still have lactose, minerals and
water. Lactose can be processed after the minerals, and water can be recovered and
utilised as the water brought onto the site as a component of milk. Milk is about 87.3 %
moisture, so a substantial volume of water can be recovered from whole milk powder,
skim milk powder and other dried milk products.
Table 6-2 Basic product choices from milk.
Products Milk maj or components
Fat Casein Lactose Whey Minerals Water proteins
Whole liquid milk j j j j j j
Stock food j j j j j
Whole milk powder j j j j j
Skim liquid milk j j j j j
Skim milk powder j j j j
Whey powder j j j
Whey protein concentrate j
Whey protein isolates j
Anhydrous milk fat j
Butter j
Butter milk j j j j j
Cheese j j j
Casein, caseinates j
Lactose crystals j
Water j
Once one decides on one main product (based on the market) then by difference there
are other milk components left over for allocation. For example, cheese leaves whey for
processing; casein leaves whey and fat for processing.
6.3.2 Energy Integration in Dairy Industry
The dairy industry is a large consumer of energy. This leads to the necessity for an
efficient use of energy within an operation, within a process unit and between processes
in order to reduce the capital and operating costs.
6-7

Any dairy process operation will require some heating and cooling. Some of this can be
provided from within and between processes or from another source. Thermodynamic
concepts can be applied to find the maximum amount of heat that can be recovered from
a system with process integration (Smith et at., 2001; Horlock, 1997). Coal, natural gas
and electricity are still the main energy sources used by dairy process operations.
Energy conservation has always been important in process design. The objective is to
identify the thermal design of the process to find the energy supply and demand.
Process heat integration generally starts with the generation of the hot and cold
composite curves for the process. These curves provide a pictorial representation of
overall heating and cooling demands. By superimposing the composites, one can
immediately see the scope for heat recovery and hot and cold utility demand (Polley,
1993). Techniques have been developed that minimise the heat needs of a process.
The supply and demand energy should follow certain procedures on the design
methodology. French (2003) has proposed a prioritisation sequence of guidelines for
heat integration.
• It starts with the identification of product-to-product heat integration options
within process unit options.
• This is followed by the identification of product-to-product heat integration
options between process units.
• It ends with the determination of available hot water supplies and demands
within and between process units.
However, French stated that integration between processes will generally require a
larger investment in capital for implementation. This is because of the time shifted
processes that need storage (due to process scheduling issues), as well as additional
piping and instrumentation (related to the distance between the process units).
Furthermore, food safety concerns of product cross-contamination may also exist.
Therefore, options for local process integration should be explored first. French also
6-8

found pinch temperatures of process units and combinations of process units as shown
in Table 6-3.
Table 6-3 Pinch temperatures (French, 2003).
Process unites)
Cheese
WPC
Lactose
Cheese, WPC & Lactose
Milk Powder
AMF
Milk Powder & AMF
Combined site
Pinch temperature cae) 14
17
50
50
60
15
60
15
A dairy process requires a variety of different forms of energy including hot air, steam,
hot water, electricity, compressed air, cooling and refrigeration. There are numerous
combinations of energy sources possible, especially with evaporation and drying. The
evaporator may be a thermal vapour recompression (TVR) type requiring steam at about
10 bar and a small amount of electricity, or it may be a mechanical vapour
recompression (MVR) type requiring a significant amount of electricity and a small
amount of steam. The dryer air may be heated by high pressure steam or by combustion
of oil or gas. A TVR or MVR evaporator is energy integrated within itself, but energy
integration between processes can be achieved through the co-generation of electricity
and steam or hot water. Although pinch technology can be applied here, it does not give
the complete solution for batch processes.
There is also a special case of energy integration between evaporation and
pasteurisation. Through steam compression, vapour from the last stage of the
evaporator is often used to supply a part of the heat needed for pasteurisation. Then the
pasteurisation and the heating to the required temperature before the evaporation are
combined.
The batch or semi-continuous nature of food processing introduces a constraint to
energy integration. Start-up and shut-down of processes at different times require that
energy be stored or that alternative systems be put in place.
6-9

6.3.2.1 Energy for Dairy Processing
The term "cogeneration" is often used when both electric power and useful heat are
produced (Ray & Sneesby, 1998; Horlock, 1997). The selection of type of plant not
only depends largely on the heat and power ratio but also on the size of the heat and
electricity demands. The energy supplied to a thermal power station is more effectively
used to produce both electricity and useful heat. In a conventional thermal power
station only about one-third of the energy in the coal or oil is converted to electrical
power, two-thirds of the energy is thrown away in the form of lukewarm water, to the
cooling towers or to rivers or to a sea (Williamson & Wallace, 1979). This means the
design and operation of an electric power station with cogeneration, producing of both
useful heat and work, improves the energy utilisation of the natural gas or coal feed.
A total energy scheme is developed to achieve an internal balance between the
electricity and the heat needs of an industrial process so that all its energy, i.e.,
electricity and heat needs are met from a single fuel input.
With on-site cogeneration, the primary concern is usually with the process heat
requirements and electricity is produced as a co-product in such quantities as can
conveniently be obtained (Williamson & Wallace, 1979); a deficit or surplus of
electricity can be easily traded.
Figure 6-3 shows a cogeneration representation where HP, MP and LP are high,
medium, and low pressure steam respectively. Cogeneration of electric power at the
dairy processing site enables co-product heat from power generation to be transformed
into process steam for dairy separation processes.
6-10
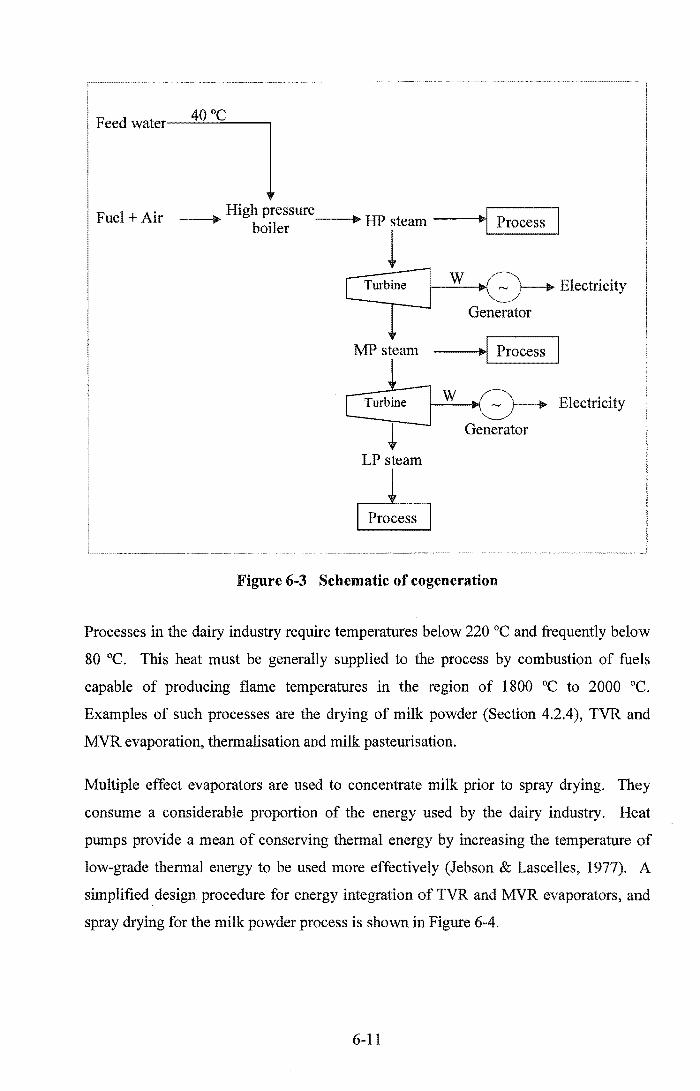
40 DC Feed water--=....::'----="----,
Fuel + Air High pressure '" HP steam "'I Process
• b'l 01 er
! Turbine W Electricity
Generator
MP steam
Turbine W Electricity
~ Generator
LP steam
I Prot I
Figure 6-3 Schematic of cogeneration
Processes in the dairy industry require temperatures below 220 DC and frequently below
80 DC. This heat must be generally supplied to the process by combustion of fuels
capable of producing flame temperatures in the region of 1800 DC to 2000 DC.
Examples of such processes are the drying of milk powder (Section 4.2.4), TVR and
MVR evaporation, thermalisation and milk pasteurisation.
Multiple effect evaporators are used to concentrate milk prior to spray drying. They
consume a considerable proportion of the energy used by the dairy industry. Heat
pumps provide a mean of conserving thermal energy by increasing the temperature of
low-grade thermal energy to be used more effectively (Jebson & Lascelles, 1977). A
simplified design procedure for energy integration of TVR and MVR evaporators, and
spray drying for the milk powder process is shown in Figure 6-4.
6-11

.---D>.Feed water--------,
Gas or coal Q
Steam at process temperature
Feed
Milk Pathogen and
composition control
Steam condensate from eva.
1 ____ -_---------------
HP steam
Mech. driven heat pump
I+---t-~~-_I Air heater
Milk powder
Figure 6-4 Cogeneration and process integration.
6.3.3 Water Integration for Dairy Processing
The cost of wastewater treatment, the shortage of fresh water at many sites, and
environmental protection are all persuasive reasons for reducing raw water consumption
and wastewater discharge at chemical process plants (Dhole et al., 1996; Feng & Seider,
2001 and Bagajewicz et al., 2000). Water reuse and the regeneration before it goes to
waste has led to the reduction of overall water flowrate (Linnhoff et al., 1994). There
are numerous opportunities for water recovery and reuse or recycling, especially with
RO plants. Likewise, there are opportunities for water minimisation through water
recovery and waste segregation.
Water and wastewater minimisation are generic problems of integrated process design.
One of the aims of process integration is to make use of all the milk components,
6-12

including the water. Dairy process streams contain significant amounts of water.
Therefore, water is recognised as one of the valuable components in milk (Roos, 1997).
The options for water integration in dairy processes are defined by a range of qualitative
groups of acceptable contamination levels for water 'sinks'. The energy integration
method further reduces the options for water reuse because hot water integration is
performed first (French, 2003).
Product and utility crossover happen when water becomes both a product and a utility.
Generally, while water carries components, it is considered a product. The engineer
could consider water to be a product at all stages of processes within the context of
component integration. This is a specific example of component integration.
In this study, alternatives are identified for an integrated conceptual design assisted by
alternative strategies for dairy industrial water reuse and wastewater minimisation in a
systematic effort to reuse water at a plant.
Water Sources for the Dairy Industry
Dairy processing water supplies may be bore water, river water, municipal water
systems, or mixed. The dairy industry requires most water to be of potable quality.
Some processes (Le., reverse osmosis and evaporation) produce water by-product
streams. These can either be directly used as process streams (e.g., RO permeate) or as
utility streams (e.g., evaporator condensate). Utilisation of the water from a reverse
osmosis plant will reduce the production demands on both the treated water and
demineralised water plants.
Cooling installation systems provide warm water which is normally potable and is
sometimes discharged into the storm water piping system.
6.3.3.1 Water Uses in Dairy Industry
When manufacturing milk products, large volumes of water are used for a number of
purposes listed below:
1. Process water. Direct contact, e.g., final rinse in the CIP, or washing casein.
2. Heat exchange water. Indirect contact, e.g., cooling water.
6-13

3. Clean-in-place water (CIP) including all the cleaning stages of the plant except
the final rinse.
4. Pump seal water. The water provides the seal, but on failure of the pump seal
the working fluid will pass into the seal water.
Industrial waste water includes spilled milk and its products, and cleaning solutions.
The concentration and composition of the wastewater depends on the production
programme, operating methods and design of the processing plant. The pH varies
between 2 and 12 as a result of the use of acid and alkaline detergent for CIP. Water
with a pH of over 10 or below 6.5 must not be discharged into the sewage systems for
plants located in cities because, it is liable to corrode the pipes. As a result the
detergents normally used are collected in a mixing tank. The pH levels are often
measured and regulated to around 7 before being discharged to the drain. The greatest
volumes of water effluents are produced by casein protein products followed by whey
protein products.
6.3.3.2 Constraints on Water Rense
In practical applications, there are constraints in reusmg water. Some cases are
distinguished where problems of water reuse involve the following constraints:
.. Temperature. In many cases where cooling water has been heated, it cannot be
used for cooling in the same temperature range.
• Microbiological growth when stored. For time shifted processes, microbial
content prohibits reuse of water. For example, water in one process may not be
used in another process because of the danger of microbial contamination within
or between processes. For example, RO water is warm and often has enough
nutrients for the growth of microbes so it needs treatment before it is used. The
potential micro-organisms recycling or distribution of potable water used in the
dairy industry must be free of pathogenic micro organisms.
Water Treatment or Quality Upgrading
There is abundant information on analysing and designing wastewater treatment
systems as well as chemical treatment processes. These include ozonation, chlorination,
ultraviolet light with or without the addition of peroxide, as well as on unit operations
6-14

such as ion exchange, electrodialysis, and reverse osmosis with possible ultrafiltration
or nanofiltration pre-filtering (Stephenson & Blackburn, 1998; Mann & Liu, 1999 and
Bes-Pia et al., 2002). There are limits of contamination and chemicals in the water
which might be injurious to health (Kessler, 1981; Doyle & Smith, 1997).
6.3.3.3 Water Component Integration
Although milk itself is 87.3% water, the dairy industry uses more water than it
processes milk. A large amount of water is transported into the dairy factories in milk.
Water can be recovered as milk water condensate from evaporation or permeate from
the reverse osmosis processing of cheese, casein and whey protein. This not only
facilitates the reuse of a significant waste stream, but also provides a cost effective
source of demineralised water, thus reducing the environmental impact by reducing both
effluent and fresh water supply flows (Barnett et al., 1997).
Reverse osmosis water is a potential source of demineralised water for cleaning and
diafiltration in WPC production where there is a large volume of water usage. RO
water has enough nutrients for the growth of microbes so it must be sterilised and not
stored for more than about 24 hours. The water sterilization system includes the use of
an ultraviolet sterilization unit and the treatment by ozone and chlorination. The water
from the reverse osmosis plant needs to have its bacteria counts determined to detect the
amount of bacteria present.
In order to reduce water consumption in the dairy industry, the designer needs to find
the minimum amount of fresh water that each water-using process needs. Conversely,
the objective is to utilise the maximum amount of water effluent from these processes
that can be reused in other processes. In this way, effluent discharge volumes will be
reduced. Maximising the reuse of water within a process and between processes can be
of great help. A systematic methodology can reduce the freshwater usage.
French (2003) proposed a methodology with four stages for water integration in dairy
processes.
1. The first stage is to identify water sources and sinks after energy integration
procedure has been completed.
6-15

2. This is followed by classification of water production and consumption
according to location and major source and sinks functions.
3. Then, the balance for water sources and sinks by flow rate is performed; water
source and sink matches within process units should be investigated first and
excess water source or sink from other plants should then be matched.
4. Finally, if the dirty water reuse options became non-feasible the treatment of
dirty water may be considered.
Other opportunities to minimise water consumption in dairy process units may arise
from the study and optimisation of water demands through small changes to plant
equipment or operation, with little capital investment (French, 2003). For example, by
reducing the CIP rinse times and cutting back excess water supplies to plant equipment.
6.3.3.4 Examples of Water Integration
There are three possibilities for water integration:
1. Pinch water integration
Pinch technology has been used successfully to identify water reuse opportunities in the
petrochemical industries, which have continuous. processes (Wang & Smith, 1994;
Dhole et at., 1996). However, the dairy industry tends to have batch and semi
continuous processes and food hygiene requirements that limit the extent to which pinch
water integration can be applied. Consequently, most of the water pinch integration is
limited to CIP first rinse and chemical make up.
2. Generation and reuse of water
Here a typical example of water reuse is presented.
Figure 6-5 shows skim milk is sent to an RO plant to concentrate the milk for the casein
process while also generating water as permeate. Casein making requires large amounts
of water to wash lactose and minerals from the casein curd before it is dried (see Section
5.6.1). The reuse of casein wash water is highly desirable. This is technically
achievable using an integrated RO plant to reuse the wash water as shown in Figure 6-5.
This water reuse integration process works well without the need for storage. This
6-16

system also has the advantage of concentrating valuable components of milk solids such
as lactose and minerals.
Water Water
Retentate
Skim Milk L....-~I Casein process
Wash water Water
----l.
Lactose, minerals Water
Figure 6-5 Generation and reuse of water milk component.
3. Water Treatment
The dairy products industry today is based on extracting the full value from milk
components. Figure 6-6 shows milk water condensate treatment by RO membrane
filtration to generate reusable water.
....----.Concentrated milk --+~ Process
Milk water condensate
Figure 6-6 Generation of demineralised water
6-17
6.3.4 Time Integration
Time integration is the allocation of available time between processes. Time integration
or scheduling is part of the design process required to link the production operations.
Classes of Processes with Respect of Time
In this study processes are classified as follows:
1. Contemporaneous processes are those in which everything happens at the same
time, e.g., evaporation preheat and evaporation condensate production.
2. Processes separated by a fixed time are those processes that happen one after the
other with a known time in between, e.g., milk treatment and cheese, which both
operate on 24-hour cycles.
3. Processes separated by a limited variable time are those processes that happen
one after the other and the time is limited so that the second process is carried
out before the product spoils, e.g., cheese and whey permeate processing.
4. Time-independent processes are those where no fixed time is required, e.g.,
anhydrous milk fat (AMF) from butter.
For heat recovery, no storage is required when the processes are contemporaneous.
However, with any processes separated by a fixed time, process separated by limited
variable time or time-independent processes, heat storage is required. Therefore,
contemporaneous processes are more suitable for heat recovery.
Many process unit operations consist of a mixture of batch, semi-batch and semi
continuous process operations. In some cases, these process operations may be
performed in either multipurpose equipment or dedicated equipment (Samsatli & Shah,
1996). Time integration within the process is relatively simple in comparison to the
integration between processes. This is because different processes have different run
times. Therefore, the integration between processes needs scheduling or storage.
6-18

Types of time integration for scheduling products:
Time integration for different products using the same process equipment. Integration
may require that the process for one product must be completed before the process for
the next product starts.
6.3.4.1 Design for "Schedule Ability"
Defining the schedule must be done during design to ascertain that there is enough time
and to see if a continuous process might be better than a batch process. For example,
the cheese process has a combination of continuous and batch processes as shown in
Figure 6-7.
Cheese process scheduling system
~ 1-1 P_a_s_te_u_fl_' s_at_io_n---l�I-----:~~1 Vats f--~~I Belts
Continuous ---.. Batch ---.. Continuous
Figure 6-7 Cheese process schedules
Building scheduling systems requires a structured approach to create lists of inter
related processes. They can be contemporaneous processes, time shifted processes by
fixed time, time variable processes but with limited time (flexible) or time independent
processes. In contrast to energy integration, all classes of processes may have time
integration opportunities. In some cases, it would make the time shifted and time
variable processes easier, thus allowing extra time to achieve better scheduling options.
There are several reasons why the engineer should consider time integration in the
process design.
The design for "schedule ability", which this research is considering, is in response to
feed, capacity for advance planning and scheduling process operations.
6-19
Issues in Time Integration
.. Higher capital investment reduces scheduling problems.
integration minimises capital investment.
Product
Good time
• Minimum storage reduces problems of pathogen growth and/or microbial
control.
• It is important to match capacities of plants to minimise storage time and
maximise plant utilisation.
6.3.5 Clean-in-Place Integration
In the dairy industry cleaning is a crucial operation for ensuring hygienic safety of foods
and for recovering performances of plant and process such as heat transfer, pressure
drops, surface cleanliness (Dresch et al., 2001). There is a special case where cleaning
solutions are periodically drained when they are considered to be too polluted (Gesan
Guiziou et ai., 2002). It does not apply to once through systems.
Clean-in-place integration (CIP) and/or kitchen integration is another integration
opportunity in the dairy industry. The integration of clean-in-place in the dairy
processing operations for minimisation of water, chemicals and energy use also requires
special consideration and, in some cases, a simplification of general process integration
guidelines. There is an option where heat, chemicals and water integration within and
between processes during clean-in-place (CIP) is desirable because this can offer
significant reductions in energy water and chemical usage (Dresch et ai., 2001). CIP
integration would also minimise effluent volumes. However, differences in process run
times and production sequences make this a difficult task. There are also risks
associated with contamination between different parts of the process. Specific CIP
chemical requirements (e.g., specialised membrane cleaning chemicals) further
complicate the task of CIP integration.
An example of process integration between processes is the reuse of milk condensate
for non-critical hygiene applications, such as CIP initial rinses. Integration within
process here is the use of RO plant after the initial and second rinse to treat the water
and reuse the RO water permeate ( see Figure 6-8).
6-20

Condensate"
RO Permeate Milk water condensate
Impure rinse water
I st rinse and 2nd rinse
I
I
I Process I
'"----- ~t-------J
Waste stream treatment
l I
I
I
I
I
Figure 6-8 Minimal discharge CIP
6.3.6 Environmental Integration
Potable water
Final Rinse Water
I
Environment
Environmental integration is a very important topic and needs to be considered at an
early stage of the design. Waste pollutants from the plant must be disposed of in an
acceptable manner and as minimum as possible. Therefore some form of treatments,
e.g., separation, purification, cooling may be necessary prior to disposal.
The interest in waste minimisation comes from two aspects. One of them is the
economic incentive of increasing product yield through dairy process efficiency.
Another is the reduction of the environmental impact ofthe dairy industry, together with
waste treatment and disposal costs.
6-21

Each step III milk processing provides an opportunity for waste to be released.
Therefore, the application area of environmental integration in the dairy process
industry is very important. Furthermore, the dairy industry in many countries is pasture
based and has a low cost structure compared to the dairy farming in other countries
where the dairy industry is based not only on pasture but also on grains. The role of soil
health is extremely important to maintain milk production. One must maintain pasture
or grain production which relies on the condition of the soil.
Land farming can replace conventional biological treatment systems to minimise the
biodegradable oxygen demand (BOD) in some cases. Treated industrial waste waters
can be applied directly to land in various irrigation schemes.
Most of the waste minimisation studies in the open literature focus on continuous plant.
Research work dealing with the design of environmentally benign batchlsemi
continuous plants, which are extensively used in food industries, is rather limited
(Stefanis et ai., 1997). The conceptual design methodology considers environmental
integration in the conceptual design methodology by minimising waste generation in
dairy processing. A minimal adverse environmental effect requires environmental
integration.
6.3.6.1 Emissions Control for Good Process Design
Emissions should be controlled by optimum process design so that emissions are
minimised. For milk processing, the simplest way to determine emissions is by
measuring the effluent streams from all sources. The design for environment should fit
within an integrated product process by waste minimisation (Arthur D. Little, Inc.,
2001).
The losses of milk components in the streams require consideration and for that an extra
rule may be considered:
1. If the losses are less than about 1 % of feed by value, they would become
effluent.
2. If the losses are more than about 2% of feed, then they would need to be
recovered at least for stock food.
6-22

6.4 Dairy Requi.rements and Limitations on Process Integration
The dairy process industry has specific requirements and limitations on product
integration that have to be considered prior to developing process integration.
Limitations imposed on processes due to product safety, functionality, economics and
environment are cited as in the following:
Product safety and processing requirements are:
1. Product must be traceable.
2. Pathogen control cannot be bypassed.
3. There are limitations on recycling water or products because of the potential for
microbial cross-contamination of product.
4. Excessive pumping will damage the fat globules and proteins can be denatured.
6.4.1 Differences from Petrochemical Methodologies
Process integration is widely used in the petrochemical industries, but in the dairy
industry it is just starting to take on more importance. Process integration in the
petrochemical industries was established as good practice a long time ago. In the dairy
industry the concept is just being introduced.
The methodologies applied in the petrochemical industries start with energy integration,
while in the dairy industry the starting point was effluent minimisation, with an attempt
to minimise the biodegradable oxygen demand (BOD). The raw material, milk, has
some special features that distinguish it from other feed materials, especially the
petrochemical materials. Some components of the milk are heat and shear sensitive, so
processing conditions are limited (see Section 3.5).
Chemical engineers seek to make petrochemical processes continuous, but the dairy
industry is constrained by the need to clean the processing equipment. Some processes
are identified by their batch nature, e.g., milk storage in a silo, cheese making and ion
exchange while any continuous processes, such as evaporation, seldom continue for
more than 20 hours before cleaning is required. A single exception is spray drying of
milk with a single dryer fed by multiple evaporator that can operate for perhaps a month
continuously before cleaning is required.
6-23

Significant differences exist between a petrochemical and a dairy processing operation.
Dairy process streams contain significant amounts of water. Control of microbial
growth and contamination (product safety) are paramount. Storage time and buffering
between processes is therefore limited. Essentially, all liquid processes must stop every
few hours for cleaning, in order to control microbial growth. Regular stoppage and
limitations on intermediate storage make the process integration a challenging task.
Process streams are generally heat labile, so many operations are carried out with
minimal thermal processing. Extensive heat recovery is used within the thermal
processing operations (e.g., multiple effect evaporators with vapour recompression), but
many other processes do not operate at elevated temperatures. Thus, little opportunity
exists for heat integration between processes.
The processing time in the dairy industry is a concern for time integration. For
example, the amount of fouling deposit always increases with time. Fouling in the dairy
industry is more severe than that in other industries. In the petrochemical industry, it is
common to clean only once a year or less but in the dairy industry it is necessary to
clean the processing plant after a few hours of operation (see Section 3.6).
6.4.2 Similarities to Petrochemical Methodologies
Although there are significant differences between petrochemical and dairy processing
operations, as described in Section 3.1, some of the petrochemical processing ideas are
still applicable to the dairy process as well as dairy process integration.
Large dairy plant sites are becoming increasingly similar to petrochemical industry
installations. Large scale dairy plants operate 24 hours and seven days. The aims of
process integration are similar, like heat integration, loss minimisation and minimised
effluent production.
Large dairy processes are integrating and fractionating their products in more specific
components such as fat fractionation (see Section 5.4.4).
Factory automation for process integration is another similarity. Large dairy plants are
using programmable logic controllers (PLC) in their operation similar to petrochemical
plants. Automation increase the ease integration within or between processes.
6-24
The energy recovery and reusing utilities are becoming more sophisticated in the dairy
industry as they do in the petrochemical industry. Energy minimisation at a dairy
processing site as well as petrochemical processing may require process integration
within and between process units.
6.5 Effect of Scale on Economics of Integration
There are key point opportunities for integration and these depend on:
1. The product mix. The large scale dairy industry site will probably produce a diverse
range of products. These large sites have increased opportunity for integration
between processes. In contrast, a small scale dairy industry site produces fewer
product types. Consequently, there are reduced opportunities for between process
integration.
2. The cost of integration. A number of options for process integration require
additional process plants, e.g., a RO plant or UF plant. The economics of those
processes are typically dependent on scale. The economic viability of integration is
usually greatest on large scale sites.
3. Utilities and effluent production. Large processing sites are typically subject to
restrictions on water uptake and effluent production.
4. Process integration offers a viable means to achieve capacity increases without
increasing water supply or effluent discharge requirement.
5. Small scale operations may be able to gain approval for increased water supply or
effluent discharge at a lower cost, making this approach more desirable than
employing integration techniques.
6. Product losses. On a large scale dairy site, the cost of product losses became
sufficiently high to justify sophisticated recovery systems. These systems provide
additional opportunities for process integration. On a large scale, product losses
may also incur additional effluent treatment costs. The combined cost of lost
6-25

product and effluent treatment may make product recovery systems economically
viable.
6.5.1 Small Scale Dairy Process Industry
Small scale processing is often the most viable, if not the only, option available for
successful and profitable liquid milk processing in many situations with a poorly
developed or emerging dairy industry. Even though small scale processing seems to be
inevitable, its operations may not always be easy. It is important to highlight the
technical and economic challenges that developing countries face as chemical engineers
try to promote small scale processing in the most integrated way possible.
The dairy process industry has been appropriate for developing countries, where
agricultural products are the basis of existence for the population, and milk is sometimes
the only exchangeable fresh good because of its known nutritive value and daily use.
As long as a dairy process takes place on such a small scale basis, it enjoys relatively
high independence, a local market, and low economic risks. Simple economic
structures still function using local resources as well as locally made equipment, and
local customs and traditions are respected (Homewood, 1986).
Small-scale plant dairy industries process milk from a single cow to about 250 cows at
the peak, using unit operations and the product alternatives described in Chapter 4 and
Chapter 5 respectively. In this work, small scale processing refers to those unit
operations handling more than 10 litres but less than 5000 litres of milk per day.
In the late 1970s and early 1980s, dairy industries with 500 litres of milk per day or over
were essentially "block mounted", with turn-key projects of 500 litres per hour capacity
(up to 5,000 per 8 hour shift). From the author's' experience in Peru, the operations of
these small plants were in most cases not very successful. In some cases, even these
"small scale" industries would be still too large for the small volumes of locally
produced milk (often less than 2000 litres per day) that could be made available. For
someone in New Zealand or Europe it may sound inconceivable that local milk
producers in Cusco-Peru cannot produce enough milk to satisfy the requirements of
such a small plant. The reasons are varied, but some of the very common ones are:
6-26
1. The plant is located in a town far away from the rural based milk producers where
road networks are so bad that is uneconomical for the processor or milk producers
to transport the milk to the plant, particularly during the wet season.
2. The milk marketing system is highly unregulated with informal milk traders
offering a cheaper product to (mostly poor) consumers in the form of raw milk
which they boil at home anyway. The informal milk marketing of raw milk
accounts for more than 90% of milk marketed.
3. The majority oflow income earners in urban centres cannot afford the added cost of
pasteurised milk, especially when expensive packaging systems are used, e.g.,
evaporated canned milk which has a higher cost than raw milk.
4. The high cost of processing due to inadequate plant capacity utilisation, high
electricity tariffs, and taxes on processed milk versus no tax on raw milk.
Besides the technological advances that have been made in the dairy industry and the
subsequent drive for larger and more efficient plants in developed countries, the concept
and need for a design methodology for small scale milk processing remains as valid and
relevant today in most countries with a developing dairy industry as it was 100 years
ago, when developed countries served the needs ofthe on-farm producer-processors.
6.5.2 Medium and Large Scale Dairy Process Industry
Medium scale dairy processing in this thesis considers the production of milk from
more than 250 to 25,000 cows, which may produce approximately 5,000 to 500,000
lIday. Whereas, large scale refers to milk production above 500,000 l/day at the peak.
Dairy industries in many countries have commenced reducing manufacturing costs
through the amalgamation of small companies and the more efficient processing of large
volumes of milk in a relatively few, centralised processing sites (Vickers, 1979).
The growth of milk production forces the dairy industry to increase its operations
capacity and energy supply as well. This provides the opportunity for the discharge of
contaminants to air from dairy production that can be mitigated, reducing negative
impacts by minimisation of steam usage by process integration. This has been well
used in other industries such as the petrochemical industry.
6-27

There is an increasing demand on steam supply in the area of the manufacturing plant at
a time of increasing production. To prevent this becoming a major problem in the dairy
industry, it is necessary to consider techniques and design methods to use the energy
efficiently (Quispe-Chavez et al., 2001). Process integration offers possibilities for
reducing the stearn demand as production levels expand.
The benefits include that the operating cost will be reduced by waste minimisation.
Monitoring the performance during process integration will aid identifYing
environmental issues associated with the expansion, since the need to work under
regulatory conditions is of paramount importance to the dairy industry.
Noise levels, powder emissions in the exhaust drying air from large spray driers and
stack emissions from large coal fired boilers have become a source of significant air
pollution. Increased product and effluent spillage over longer production hours result in
major effluent disposal problems (Quispe-Chavez et al., 2001). Process integration
would be an elegant solution to reduce emissions from coal combustion boiler
equipment, and dryers.
6-28

7 Conceptual Design Methodology of Dairy
Processes
7.1 Introduction
Petrochemical engineering typically uses reactions to transform the selected feedstock
into the final product. Consequently, the flowsheet methodologies (e.g., Douglas, 1988)
usually focus principally on the reactor. There may be several routes to the product,
based on different chemical feedstocks. In contrast, dairy processing is predominantly a
sequence of separations and blending, with reactions used for a small number of
products. Feedstock selection is not an issue in dairy processing since all processing
begins from raw milk. Consequently, any dairy flowsheeting methodology does not
include feedstock selection, nor does it typically require selection of reaction pathways.
Flowsheet development primarily focuses on the selection of compatible or synergistic
products (Le. process integration) as well as the selection of the most suitable order and
type of separation operations. Product synergies enable the processing of by-product
streams into additional saleable products of value. These synergies may be so strong or
clearly defined that these by-product streams are considered to be co-products, e.g.
cheese and whey protein concentrate (WPC) production. WPC is typically considered
to be a co-product of cheese manufacture due to the high value of WPC relative to
cheese, and the large costs of whey (effluent) disposal. However, it is important to
review and challenge conventional dairy process design thinking for several reasons:
1) The development of new processing (especially separation) technologies, which
provide new alternatives for product integration, or provide alternative means to
manufacture products, allow different integration (and co-product) options.
2) Flowsheeting heuristics relating to process integration and co-product
production may well be strongly scale dependent. The development of an
overall flowsheeting methodology should provide a technique to consistently
identify the best flowsheeting options for any scale of operation.
7-1

3) Systematic flowsheet development provides the opportunity to identify new
product opportunities, e.g., recovery of valuable components from waste
streams, or new opportunities to manufacture existing products by more efficient
or lower cost methods.
7.2 Conceptual Design Methodology of Dairy Processing
In this chapter, a methodology for the synthesis of dairy process flowsheets is presented.
The feasibility of dairy process flowsheet integration will be strongly dependent on
scale (see Section 6.5), e.g., smaller scales will favour single product operations, with
fewer options for integration, heat recovery and waste minimisation.
Any process design for new processes goes through at least three stages. One is the
conceptual design with the generation of ideas for new processes (process synthesis)
and their translation into an initial design. This stage includes preliminary cost
estimates to assess the potential profitability of the process, as well as analysis of
process safety and environmental considerations. The second stage is the final design
where a rigorous set of design calculations to specify all the significant details of a
process is performed. The final stage involves detailed design including the preparation
of engineering drawings and the equipment list needed for construction (National
Research Council et al., 1988). The use of methodology is the norm for conceptual
process design, that provides insights. When it is combined with numerical methods, it
creates innovative but practical design tools which are tomorrow's contribution to a
powerful working environment for conceptual process design (Linnhoff et al.) 1994).
Four case studies have been developed to illustrate the application of process integration
using the dairy operations presented in Chapter 4 and dairy products in Chapter 5. The
aim is to present and demonstrate a method for matching streams for integration within
and between units in a process flowsheet.
7-2

Tools for the design methodology synthesis
This methodology will create "partial process flowsheets" that can be joined together
later to form a complete process. This avoids the need to carry numerous different
combinations all through.
It is necessary, for the proposed design methodology, to designate a code to each
process operation, product, and a code for the utilities as follows. The numbering
conventions are established in Tables 7-1, 7-2, and 7-3. These are for utilities, unit
operations, and products and key process operations respectively.
Table 7-1 Designation codes of utilities (to label process flowsheets).
Utility Code
Steam st Energy
Electricity el
Potable water pw
Hot water hw Water
Cooling water cw
Chilled water iw
Milk water condensate rnw
Dernineralised water dw
Hot air ha
Air Cool air ca
Moist air rna
7-3
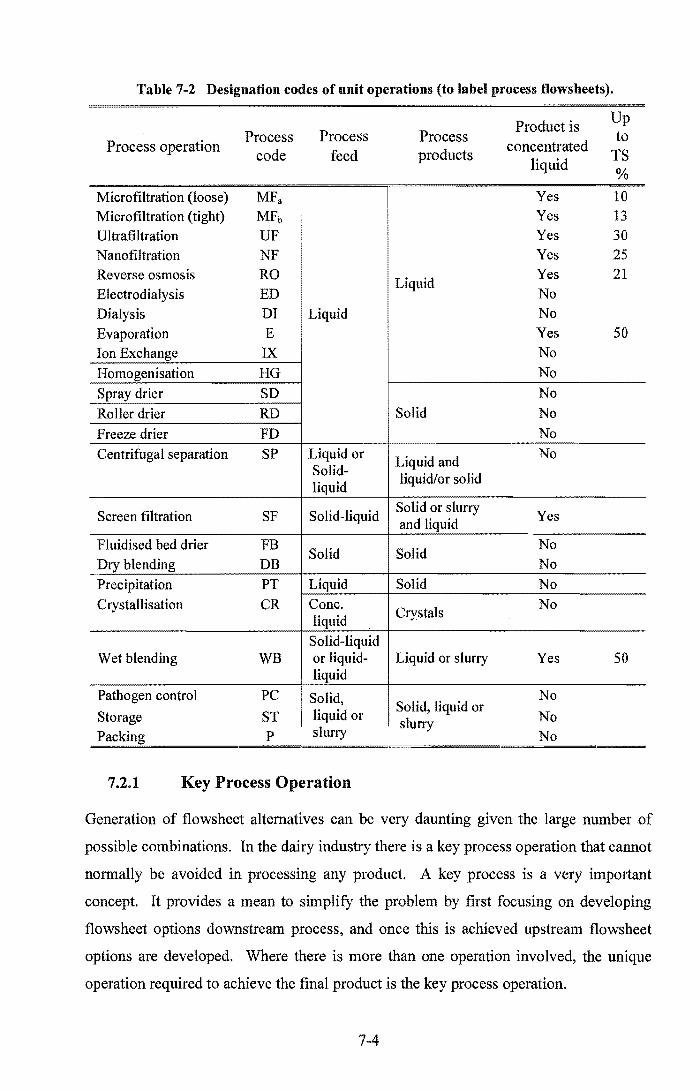
Table 7-2 Designation codes of nnit operations (to label process flowsheets).
Process operation
Microfiltration (loose) Microfiltration (tight) Ultrafiltration Nanofiltration Reverse osmosis Electrodialysis
Dialysis
Evaporation Ion Exchange
Homogenisation
Spray drier
Roller drier
Freeze drier
Centrifugal separation
Screen filtration
Fluidised bed drier
Dry blending
Precipitation
Crystallisation
Wet blending
Pathogen control
Storage
Process code
MFa MFb UF NF RO
ED
DI
E IX HG
SD
RD FD
SP
SF
FB DB
PT
CR
WB
PC
ST P
Process feed
Liquid
Liquid or Solid-liquid
Solid-liquid
Solid
Liquid
Conc. liquid
Solid-liquid or liquid-liquid
Solid, liquid or slurry
7.2.1 Key Process Operation
Process products
Liquid
Solid
Liquid and liquid/or solid
Solid or slurry and liquid
Solid
Solid
Crystals
Liquid or slurry
Solid, liquid or I r s u ry
Product is concentrated
liquid
Yes Yes Yes Yes Yes
No No Yes
No
No
No
No
No
No
Yes
No
No
No
No
Yes
No
No No
Up to
TS %
10 13
30 25 21
50
50
Generation of flowsheet alternatives can be very daunting given the large number of
possible combinations. In the dairy industry there is a key process operation that cannot
normally be avoided in processing any product. A key process is a very important
concept. It provides a mean to simplify the problem by first focusing on developing
flowsheet options downstream process, and once this is achieved upstream flowsheet
options are developed. Where there is more than one operation involved, the unique
operation required to achieve the fmal product is the key process operation.
7-4
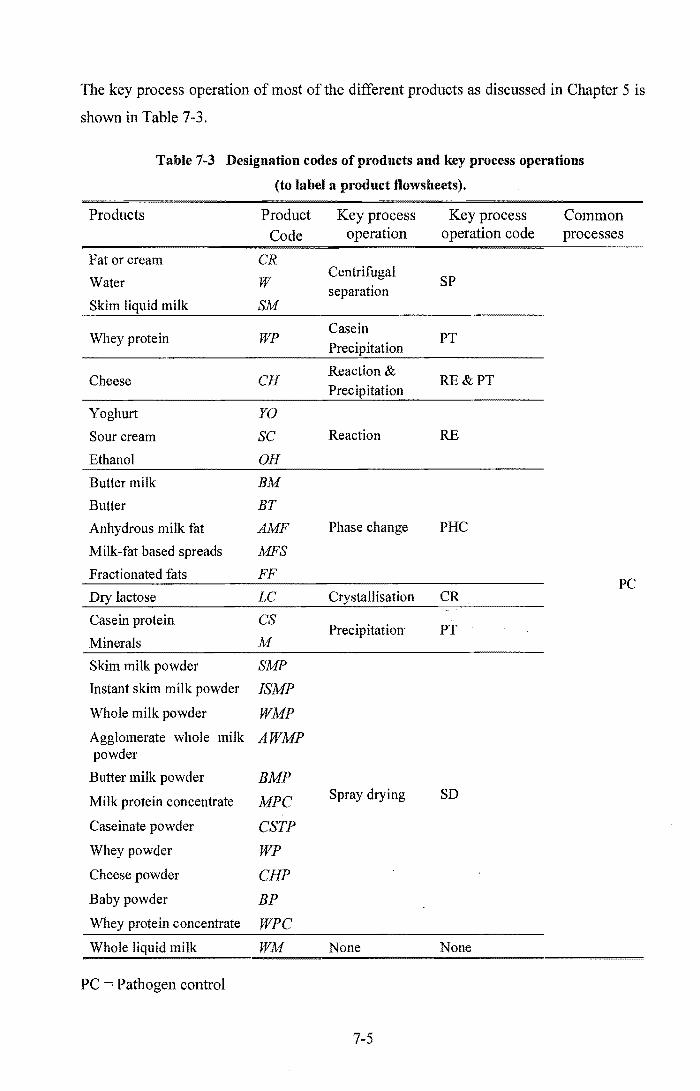
The key process operation of most of the different products as discussed in Chapter 5 is
shown in Table 7-3.
Table 7-3 Designation codes of prodncts and key process operations
(to label a product flowsheets).
Products Product Key process Key process Common Code operation operation code processes
Fat or cream CR Water W
Centrifugal SP
separation Skim liquid milk SM
Whey protein WP Casein
PT Precipitation
Cheese CH Reaction &
RE&PT Precipitation
Yoghurt YO Sour cream SC Reaction RE
Ethanol OH
Butter milk BM
Butter BT
Anhydrous milk fat AMF Phase change PRC
Milk-fat based spreads MFS
Fractionated fats FF PC
Dry lactose LC Crystallisation CR
Casein protein CS Precipitation" PT
Minerals M
Skim milk powder SMP
Instant skim milk powder ISMP
Whole milk powder WMP
Agglomerate whole milk AWMP powder
Butter milk powder BMP
Milk protein concentrate MPC Spray drying SD
Caseinate powder CSTP
Whey powder WP
Cheese powder CHP
Baby powder BP
Whey protein concentrate WPC
Whole milk WM None None
PC = Pathogen control
7-5

7.3 Dairy Process Design Methodology
The methodology presented below was developed by rigorously analysing the steps
taken during the design of a complete dairy process flowsheet. It formalises the steps
that an experienced designer might follow, while at the same time it provides a
framework for innovation.
The methodology has been formulated so that it is applicable to any scale of operation.
It has been written in such a way that it could be implemented using a computer
program to aid the storage of the different possible process flowsheet options. It is very
likely that its application will not be limited to the dairy industry.
In this methodology the term "process" refers to the overall process from raw milk feed
to final saleable product. The term "operation" or "process operation" is used to
identify a single unit operation within the process. Within the methodology, the term
"flowsheet" is used to identify the incomplete process that has been synthesised at any
particular stage.
This methodology can be applied by the process designer to the process of interest
during the conceptual design stage without the need for rigorous modelling and
calculations. The methodology described here is used to generate the guidelines and the
conditions for their use.
During the design methodology, it is advised to keep a track of the thoughts. Thoughts
must be written as carefully as possible during the whole design process cycle as they
appear.
The design procedure can be expressed as a flowchart as shown in Figure 7-1.
7-6
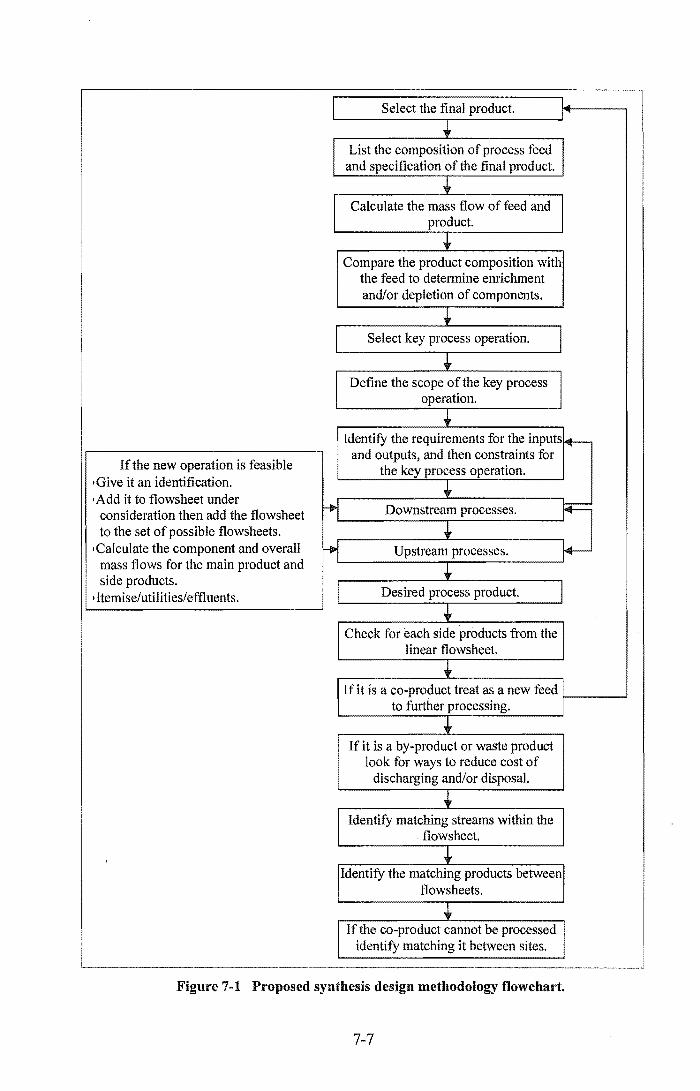
Select the final product.
• List the composition of process feed and specification of the final product.
• Calculate the mass flow of feed and product.
• Compare the product composition with the feed to determine enrichment and/or depletion of components.
• Select key process operation .
... Define the scope of the key process
operation .
... Identify the requirements for the inputs f'4-
If the new operation is feasible and outputs, and then constraints for
the key process operation. ,Give it an identification. • ,Add it to flowsheet under
consideration then add the flowsheet -., Downstream processes. t+= to the set of possible flowsheets. • ,Calculate the component and overall ~ Upstream processes. f+-mass flows for the main product and • side products.
Desired process product. I Itemise/utilities/effluents. • Check for each side products from the
linear flowsheet.
• If it is a co-product treat as a new feed to further processing.
• If it is a by-product or waste product look for ways to reduce cost of
discharging and/or disposal.
• Identify matching streams within the flowsheet.
• Identify the matching products betweenl flowsheets.
• If the co-product cannot be processed identify matching it between sites.
Figure 7-1 Proposed synthesis design methodology flowchart.
7-7

The dairy process methodology incorporated here is based around the key process
operation with integration. The steps in dairy process methodology are as follows:
Step 1: Select the final product.
Step 2: List the composition of process feed and specifications ofthe final product.
Step 3: Calculate the mass flow of feed and product (see Section 4.9.2).
Step 4: Compare the product composition with the feed to determine enrichment and/or
depletion of components.
Step 5: Select the key process operation from Table 7-3 (based on Chapters 4 and 5).
Step 6: Define the scope of the key process operation from the feed to its product and
relate the operation feed and product to the overall process feed and product.
Designate a letter from Table 7-2 to the process.
Estimate the capital cost of the flowsheet and check its economic viability.
Step 7: Identify the requirements for the inputs, outputs and constraints of the selected
key process operation (see Chapters 4 and 5). For the inputs, include
composition calculations by approximate mass balance.
Step 8: Downstream processes:
(This is a recursive step). It will potentially give many different flowsheets
with a combination of operations.
For each current flowsheet, do the following:
If the last operation in the flowsheet does not produce the overall process
product:
Find all operations that can process feeds the same as the current
flowsheet product. For each of these:
If the new operation is feasible:
• Give it an identification.
• Add it to the flowsheet under consideration and then add
the flowsheet to the set of possible flowsheets.
7-8

• Calculate the component and overall mass flows for the
main product and side products.
III Itemise utilities/effluents/timing.
• Estimate the capital cost of the flowsheet and check its
economic viability.
1/1 Call this step recursively.
Step 9: Upstream processes:
(This is a recursive step). It will potentially give many different flowsheets
with a combination of operations.
For each current flowsheet, do the following:
If the first operation in the flowsheet is not fed by the overall process feed:
Find all operations that can produce the feed for the current flowsheet.
For each of these:
If the new operation is feasible:
• Give it an identification.
III Add it to the flowsheet under consideration and then add
the flowsheet to the set of possible flowsheets.
• Calculate the component and overall mass flows for the
main product and side products.
1/1 Itemise utilities/effluents/timing.
III Estimate the capital cost of the flowsheet and check its
economic viability.
III Call this step recursively.
A linear flowsheet is now designed. The linear process flowsheet may produce certain
utilities which can be integrated into the existing process flowsheet. There are perhaps
co-products that can be considered to be further processed, or required ingredients to be
blended into process operations. There may also be utilities required and utilities
produced to process those potential co-products. Therefore continue with Step 10.
7-9
Step 10: Check for each side products from the linear flowsheet. Classify them as co
products, by-products and waste products (see Section 3.3).
Step 11: If it is a co-product, treat it as a new feed to the further processing and repeat
the design methodology from Step 1.
Step 12: If it is a by-product or waste product, look for opportunities to off-set cost of
discharging otherwise determine a suitable treatment for its disposal.
The new process flowsheet corresponds to an integration problem with a parallel
flowsheet.
Step 13: Identify the matching streams within the flowsheet. Consider products and
equipment constraints. Check for energy, water, time and environmental
integration opportunities.
Step 14: Identify the matching products between flowsheets (linear flowsheet and the
new co-product processing flowsheets). Check for energy, water, time and
environmental integration opportunities.
Step 15: If the co-product cannot be proce~sed due to the capacity problem, it may be
necessary to identify the proximity matching product between sites.
This methodology will produce a well integrated process flowsheet producing the
product and possible co-product, by-product and treated effluent.
7-10

7.4 Dairy Process Design Methodology Case Studies
Four case studies are presented to illustrate the use of conceptual methodology for the
design of dairy processes. The first case study is a "very small" scale dairy process and
is followed by a "small" scale process case study (case study 2). The third case study
involves the medium scale dairy process, and then a large scale dairy process is
presented in case study 4. Each case study highlights specific aspects of the dairy
process design at different production scales. The aim is to show that the methodology
is capable of generating a feasible flowsheet for efficient use for both simple to complex
dairy processing systems.
In the case studies the options are not all presented in the order that they would be
generated by strictly following Steps 8 and 9. They are presented in a more compact
manner.
7.4.1 Small Scale Milk Processing
Overview
On a small scale, some specific factors need to be considered, such as location of the
plant, farmers' knowledge and market traditions. The consideration of these factors is
important, for what may be small scale in one country could be medium or large scale in
another, depending on the level of development. 'Each factor has a large influence on
the choice of products, unit operations, technology and utilities that may be available.
Liquid milk occupies a dominant position in milk processing, marketing and
consumption in small scale milk production. This is because it is a basic food in many
societies where cattle and other milk producing animals form an important part of the
agricultural production system. The form in which the milk is presented for sale ranges
from on-farm and market raw milk sales in most of the developing countries to
pasteurised or UHT milk in countries with developed dairy industries. If one reviewed
the history of dairying in most of the European, North American and Australasian
countries, one would see the quantity of liquid milk products in the dairy industry
increasing over time in proportion to the level of economic and technological
development in those societies. Consumers in richer societies demand and consume a
more diversified mix of milk and milk products.
7-11

The selection of liquid whole milk as a product of small scale farms in developing
countries has many advantages and few requirements:
• No need for cooling. Milk product is immediately consumed.
It No need for separation. Milk is usually used as whole liquid milk.
• Need for pathogen control. Although, liquid milk product is consumed soon
after milking, the pathogen control is achieved when the purchaser boils it.
• No cheese production. This is rare, since there is no leftover liquid milk.
• No need for packaging. Product is directly delivered into the customers'
containers.
• No need for marketing. Each producer has its own clientele.
• No need for transport/delivery. The market is in the vicinity.
In a small scale and a short time batch operation there are usually limited resources
available to develop the processes. Table 7-4 shows the different process alternatives to
assist small scale milk production.
Table 7-4 Processes for small scale milk production.
Process Alternatives
Pathogen control Batch heating
Cream separation Natural separation
Curd precipitation Addition of calf rennet (calf stomachs)
Process integration Animal feed, land field irrigation
Small scale dairy processing has almost no cost involved assuming that the farmer has
the basic utilities within a normal domestic kitchen. Similarly, labour is cheap or
involves no cost at all.
Some small scale product options are shown in Table 7-5.
7-12
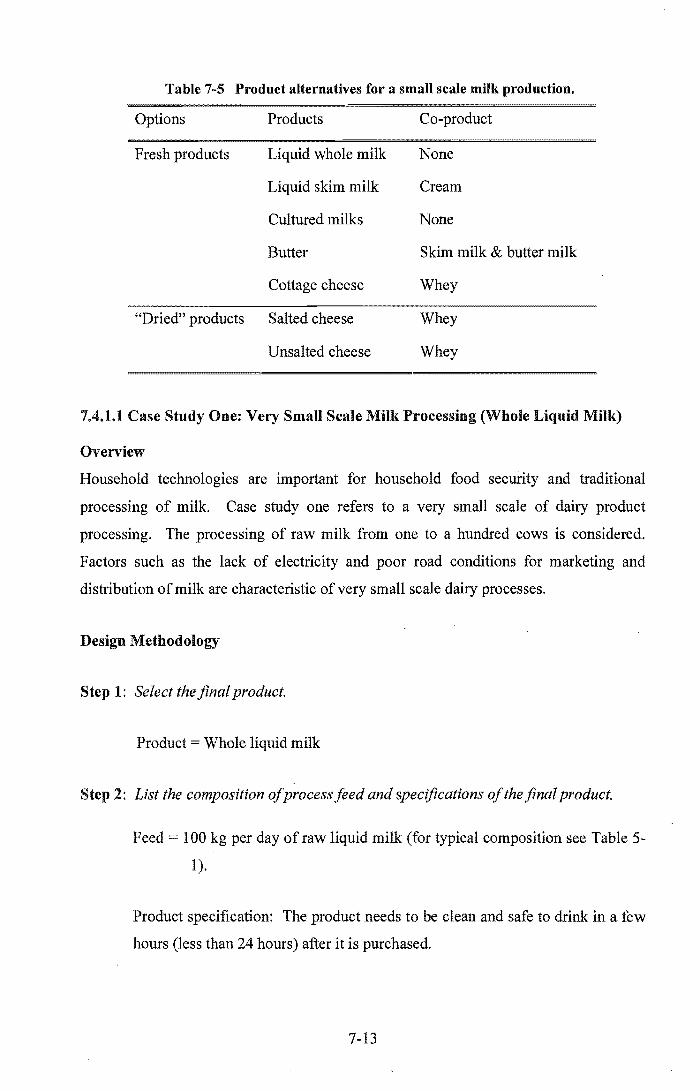
Table 7-5 Product alternatives for a small scale milk production.
Options Products Co-product
Fresh products Liquid whole milk None
Liquid skim milk Cream
Cultured milks None
Butter Skim milk & butter milk
Cottage cheese Whey
"Dried" products Salted cheese Whey
Unsalted cheese Whey
7.4.1.1 Case Study One: Very Small Scale Milk Processing (Whole Liquid Milk)
Overview
Household technologies are important for household food security and traditional
processing of milk. Case study one refers to a very small scale of dairy product
processing. The processing of raw milk from one to a hundred cows is considered.
Factors such as the lack of electricity and poor road conditions for marketing and
distribution of milk are characteristic of very small scale dairy processes.
Design Methodology
Step 1: Select the final product.
Product = Whole liquid milk
Step 2: List the composition of process feed and specifications of the final product.
Feed 100 kg per day of raw liquid milk (for typical composition see Table 5-
1).
Product specification: The product needs to be clean and safe to drink in a few
hours (less than 24 hours) after it is purchased.
7-13
Step 3: Calculate the massflow offeed and product.
The capacity is calculated on a wet basis:
Mass flow of feed = 100 kg per day of whole liquid milk.
Since there is no cream separation:
Mass flow of product = Mass flow of feed
If one day = 8 production hours,
Mass flow of product = 12.5 kg hr-1ofwhole liquid milk
Step 4: Compare the product composition with the feed to determine enrichment and/or
depletion of components.
In a small scale situation, this step can be avoided because raw milk
components will remain unchanged in the process.
Step 5: Select key process operationfrom Table 7-3 (based on Chapters 4 and 5).
From Table 7-3 (based on Section 4.1.4), pathogen control is the general
process required. In a domestic situation the boiling of milk will ensure
pathogen control.
Step 6: Define the scope of the key process operation from the feed to its product and
relate the operation feed and product to the overall process feed and product.
Designate a letter from Table 7-2 to the process.
Estimate the capital cost of the flowsheet and check its economic viability.
The scope of the process is straightforward. The raw milk is collected, boiled
and delivered to the customer. Figure 7-2 shows the flow sheet of pathogen
controlled whole milk.
7-14

Whole raw
Liquid milk PC It--I-.,.P,....a_th,....o,....ge....,n,....c-.,.o_n_tr...,.,o,.,..lle_d .....
I liquid whole milk
Figure 7-2 Whole milk process flow sheet.
Step 7: Identify the requirements for the inputs, outputs and constraints of the selected
key process operation (see Chapters 4 and 5). For the inputs, include
composition calculations by approximate mass balance.
The input and output have already been described in Step 2.
Utilities required are heat to boil the milk, water and detergent for cleaning.
Step 8: Downstream processes:
Downstream processes are not required since pathogen control produce the
desired product.
Table 7-6 from Section 6.5.1. summarises process alternatives for a very small
scale processing of raw whole liquid milk.
Process option
Option 1
Option 2
Option 3
Option 4
Table 7-6 Summary of process alternatives.
Process operation
SP
HG
P
ST
Option Comments
x
x
x
x
Milk is usually used as whole liquid milk with the expectation that a cream layer forms on top.
Not required by the customer.
Product is directly delivered to the client's container.
There is no excess milk to be stored.
In this case study, pathogen control produces the final product.
7-15
Step 9: Upstream processes:
Upstream processes are not required since pathogen control produce the
desired product.
Step 10: Check for each side products from the linear jlowsheet. ClassifY them as co
products, by products and waste products (see Section 3.3).
For this linear flow sheet there is neither co-product nor by-product. The side
products only consist of cleaning wastes.
7.4.1.2 Case Study Two: Small Scale Milk Processing (Packed Cottage Cheese)
Overview
Small scale dairy processing considered here handles up to 5000 kg of milk per day.
The process method should be tailored to the use of local raw materials, local manpower
and energy sources whenever possible. If a technology is to be used, it has to be
adapted to the people using it. These matters need to be considered in conjunction with
the economical viability.
While small scale processing remains inevitable in developing countries, a design
methodology for a scale below 5000 kg of milk per day does not appear to be available
in the open literature. This case study demonstrates that flowsheet alternatives are
dependent on the scale of operation.
Design Methodology
Step 1: Select the final product
The choice of product is selected based on the market demand. The product
studied as an example here is packed cottage cheese.
Step 2: List the composition of process feed and the specification of the final product
Feed =: 5000 kg raw whole milk per day
7-16

The composition of feed, product composition and specification are listed in
Table 7-7.
Table 7-7 Composition of milk feed and cottage cheese product (based on Spreer, 1998 and Kessler, 1981).
Components Composition of feed Composition of Specification
[% w/w] product [% w/w] [% w/w]
Wet basis Dry basis Wet basis Dry basis Wet basis
Fat 3.90 30.7 4.3 19.5 4.3 ± 1
Casein protein 2.60 20.5 12.3 55.9 } 12.8
Whey protein 0.65 5.1 0.5 2.3
Lactose 4.60 36.2 2.0 9.0
Minerals and 0.95 7.5 1 4.5
miscellaneous
Salt 0.0 0.0 1.9 8.6 1.9
Water 87.30 0.0 78 0.0 78
Total solids 12.70 22
Additional product specification include producing fresh cheese with a shelf
life of not less than 4 weeks.
Step 3: Calculate the mass flow of feed and product
Mass flow of feed 5000 kg raw whole milk per day
Mass flow of product (flowrate] (% casein] ( % yield of ] of feed x in feed x casein in process
(.%CaSein] mproduct
5000 x2.6%x95% Mass flow of product = ---=-------
12.3%
Mass flow of product = 1004 kg of cottage cheese per day
(7-1)
If 1 day 8 production hours, then mass flow of product = 125.5 kg hr-1
7-17
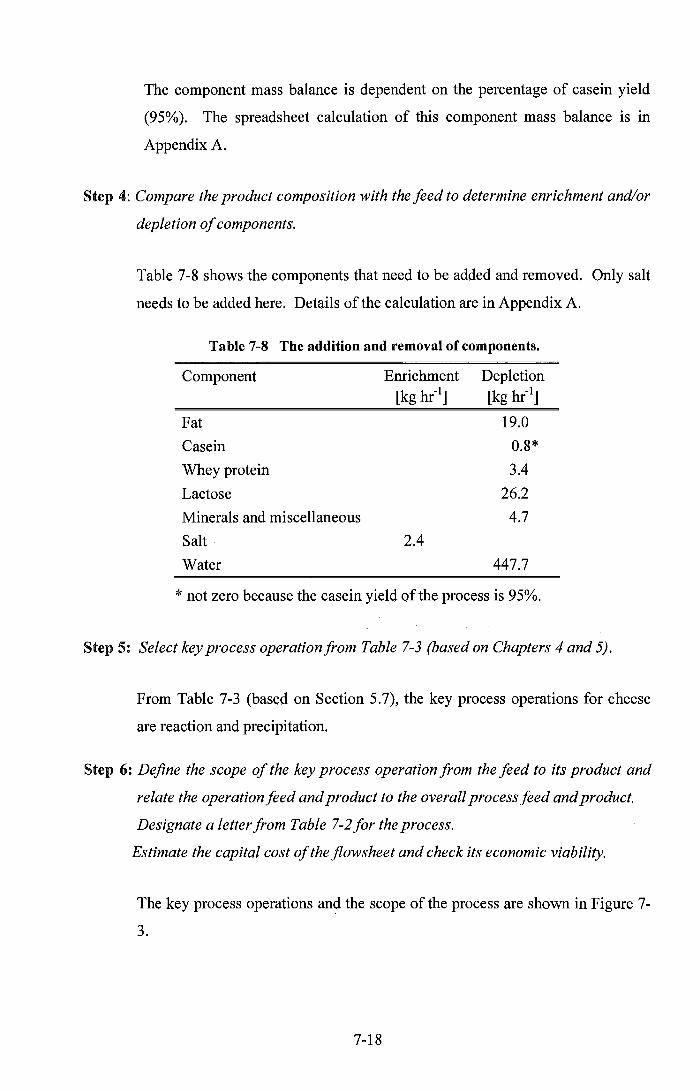
The component mass balance is dependent on the percentage of casein yield
(95%). The spreadsheet calculation of this component mass balance is in
Appendix A.
Step 4: Compare the product composition with the feed to determine enrichment and/or
depletion of components.
Table 7-8 shows the components that need to be added and removed. Only salt
needs to be added here. Details of the calculation are in Appendix A.
Table 7-8 The addition and removal of components.
Component Enrichment Depletion [kg hr-I] [kg hr-I]
Fat 19.0
Casein 0.8*
Whey protein 3.4
Lactose 26.2
Minerals and miscellaneous 4.7
Salt 2.4
Water 447.7
* not zero because the casein yield of the process is 95%.
Step 5: Select key process operation from Table 7-3 (based on Chapters 4 and 5).
From Table 7-3 (based on Section 5.7), the key process operations for cheese
are reaction and precipitation.
Step 6: Define the scope of the key process operation from the feed to its product and
relate the operation feed and product to the overall process feed and product.
Designate a letter from Table 7-2 for the process.
Estimate the capital cost of the flowsheet and check its economic viability.
The key process operations and the scope of the process are shown in Figure 7-
3.
7-18

Starter culture Coagulating agent
Whole raw
liquid milk
Whey protein, lactose minerals and water
Figure 7-3 Cottage cheese process scope.
There are whey protein, lactose, minerals and water produced from cottage cheese
manufacture that leave the key process as the liquid in the slurry.
The economic analysis in Appendix A shows that the key process IS potentially
economically viable.
Step 7. Identify the requirements for the inputs, outputs and constraints of the selected
key process operation (see Chapters 4 and 5). For the inputs, include
composition calculations by approximate mass balance.
Inputs: 1) Feed whole liquid milk with a fat content of 3.9% from Table 5.1.
2) Coagulating agent and starter culture
Outputs: 1) Product is cottage cheese slurry
Casein yield of the process is 95% (see Section 4.9.3).
Step 8: Downstream processes:
(This is a recursive step). It will potentially give many different flowsheets with
a combination of operations.
For each current flowsheet, do the following:
If the last operation in the flowsheet does not produce the overall process
product:
Find all operations that can process feeds the same as the current
flowsheet product. For each of these:
if the new operation is feasible:
• Give it an identification.
7-19

• Add it to the flowsheet under consideration and then add
the flowsheet to the set of possible flowsheets.
• Calculate the component and overall mass flows for the
main product and side products.
• Itemise utilities/effluents/timing.
• Estimate the capital cost of the flowsheet and check its
economic viability.
• Call this step recursively.
From Table 7-2, there are five options that can process the product from the key process.
These are shown in Table 7-9.
Table 7-9 Downstream process options for operations after the key process operation.
Process option
Option I
Option 2
Option 3
Option 4
Option 5
I st consideration
(RE1-PR1)-SP1
(RE1-PR1)-SF1
(RE1-PR1)-WB1
(RE1-PR1)-P1
(RE1-PR1)-ST
These process options are analysed below.
For Option 1, a centrifugal separation (SP) can remove the whey protein, lactose,
minerals and water from the curd to produce cottage cheese. This is shown in Figure 7-
4 as SP 1. The centrifugal separator could be either a decanting centrifuge or a filter
screening (see Section 4.2.2).
Starter culture
Coagulating agent
L-,..---l
--~~ Cottage cheese
WP, LC, M and W
Figure 7-4 Schematic flowsheet for production of cottage cheese using centrifugal separation.
7-20

For Option 2, a screen filtration (SF) can remove the whey from the curd to produce
cottage cheese. This is shown in Figure 7-5 as SFl.
Starter culture Coagulating
1 ager
I RE1-PR1 III---~·II SF1 111----. Cottage
cheese
~ WP, Le, M and W
Figure 7-5 Schematic flowsheet for production of cottage cheese using screen filtration.
Option 3 uses wet blending (WB) if further components need to be added (e.g., salt) to
meet the product composition. This is shown in Figure 7-6 as WBl.
Starter Coagulating Salt and lor culture agent cream
1 1 l I
RE1-PR1 ~I WB1 1 ~ Cottage cheese
Figure 7-6 Schematic flow sheet for production of cottage cheese using wet blending.
Option 4 considers packing (P). However, the product cannot be packed directly
because the product from the reaction-precipitation process has not achieved the product
specifications yet.
Option 5 which considers the storage (ST) of the key process product is also rejected
because there are whey proteins, lactose and minerals that need to be removed from the
precipitated cottage cheese curd.
The analysis above it is shown that, out of the five options in Table 7-9, there are three
processes that can process the key process product stream. These processes are SP, SF
and WB. They are shown in Table 7-10 as the first consideration process options.
7-21

2nd Considerations
Table 7-10 shows the second level of downstream processes.
Downstream process options are then derived from these immediate processes. Only
those marked with an asterisk (*) are considered further as examples. Processes that
cannot be developed further are marked with strikethrough. Possibly feasible processes
but not considered here are not marked. Less conventional alternative process options
are marked with a club (+).
Table 7-10 Possible downstream processes ofthe key process operation.
Process 1 sl 2nd 3rd
option Consideration Consideration Consideration
Option 1 (REI-PRl)-SPl * iR£l-PRl)-SPl-SF+
(REI-PRl)-SPl-WBl * iREf=Plti~Fi-
(REI-PRl)-SPl-WBl-Pl *
(REI-PRl)-SPl-WB l-STl
-R:E+-PR-l-J-SP 1 PI
Option 2 (REI-PRl)-SFl * -~P-l-
(REI-PRl)-SFl-WBl * -(-RE-l~PR:l) SF 1-'vV-B I-SP 1
(REI-PRl)-SFl-WBl-Pl *
(REI-PRl)-SFl-WBl-STl
(REI PRl)-SF-l--Pl--
Option 3 (REI-PRl)-WBI * (REI-PRl)-WB l-SPI +
(REI-PRI)-WB I-SFI iR:ffi=PRt)=WB-~SP-l-
(REI-PRl)-WBl-SFl-Pl
(REI-PRl)-WB I-SFI-STl
(REI-PR-l-)=WB+fl---
For example, (REI-PRl)-SPl can be followed by SPl, SFl, WBl, PI or STl, but the
first two of them are not sensible as no further separation will occur. Packing cannot
yet be done as the product does not yet have the required composition. Storage does not
7-22

seems a reasonable step for a product such as cottage cheese. Blending is the only
option that seems sensible. Likewise (REI-PRI)-SFI can only be reasonable followed
by WB 1. Where salt and other ingredients are added to meet the product specification
(see Figure 7-7). Cream could also be added here if the fat content is too low or if the
cottage cheese is precipitated from skim milk. The last of the 1 st consideration, (RE 1-
PRI)-WBI can only be followed by SPI or SF!. For the 3rd consideration, packing is
added to the process options flowsheet.
Starter culture
Coagulating agent
Whey
Salt andlor cream
1-----iIo- Cottage cheese
Figure 7-7 Screen filtration separation integrated with wet blending.
Once the product has achieved the product specification by centrifugal separation and
wet blending, it can be packed. Therefore, packing is taken into the third list of
considerations (see Figure 7-8).
Starter culture
Coagulating agent
REI-PRI
Whey
Salt andlor cream
Figure 7-8 Centrifugal separation integrated with wet blending.
7-23
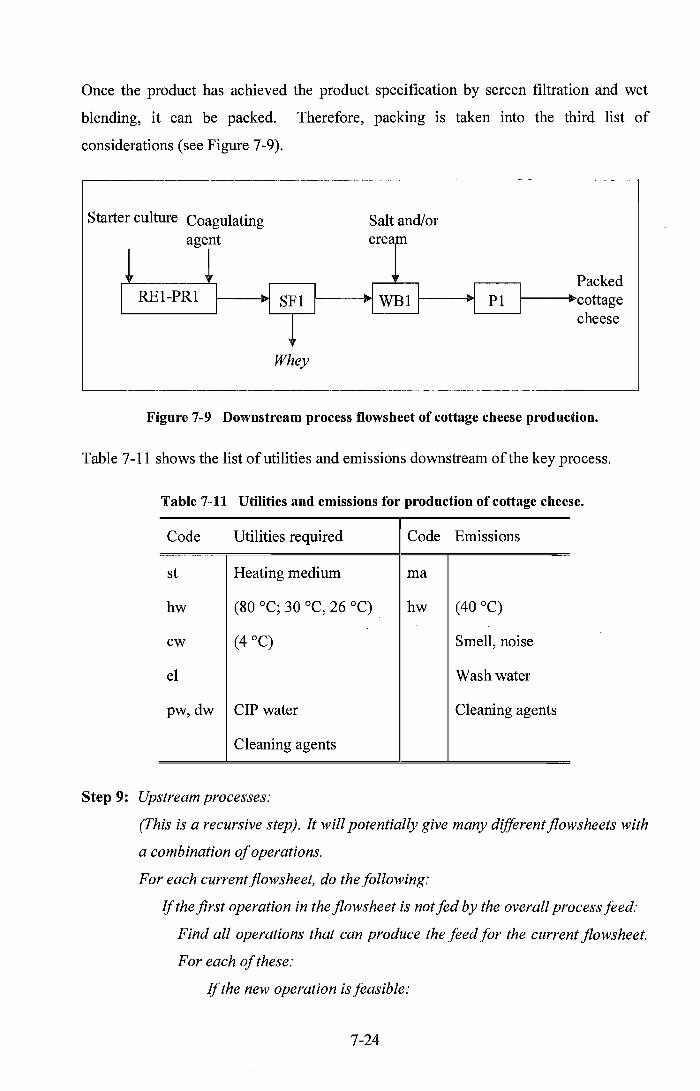
Once the product has achieved the product specification by screen filtration and wet
blending, it can be packed. Therefore, packing is taken into the third list of
considerations (see Figure 7-9).
Starter culture Coagulating agent
Salt andlor cream
Whey
Packed f------+cotiage
L....-_.....J cheese
Figure 7-9 Downstream process flowsheet of cottage cheese production.
Table 7-11 shows the list of utilities and emissions downstream of the key process.
Step 9:
Table 7-11 Utilities and emissions for production of cottage cheese.
Code Utilities required Code Emissions
st Heating medium rna
hw (80 DC; 30 DC, 26 DC) hw (40 DC)
cw (4 DC) Smell, noise
el Wash water
pw,dw CIP water Cleaning agents
Cleaning agents
Upstream processes:
(This is a recursive step). It will potentially give many difJerentflowsheets with
a combination of operations.
For each currentflowsheet, do the following:
If the first operation in the flowsheet is not fed by the overall process feed:
Find all operations that can produce the feed for the current flowsheet.
For each of these:
If the new operation is feasible:
7-24

• Give it an identification.
• Add it to the flowsheet under consideration and then add
the flowsheet to the set of possible flowsheets.
• Calculate the component and overall mass flows for the
main product and side products.
• Itemise utilities/effluents/timing.
• Estimate the capital cost of the flowsheet and check its
economic viability.
• Call this step recursively.
The process operation is fed by liquid milk. Calculations for Step 8 show that when the
key process is fed by whole liquid milk, it is impossible to remove the entrapped fat
downstream of the key process. This is because there is no feasible process operation in
Table 7-2 to separate the fat after the casein is precipitated. Therefore, as much fat as
required must be removed before the key process begins (see Figure 7-10).
Whole raw liquid milk
Fat
Starter culture Coagulating agent
Figure 7-10 Upstream flowsheet process operation.
Various alternatives from Table 7-2 that can produce the feed to the key process are
shown in Table 7-12. These options are micro filtration, ultrafiltration, nanofiltration,
reverse osmosis, evaporation, centrifugal separation and pathogen control. The feed has
to be liquid or solid-liquid state (Table 7-2). Only those marked with an asterisk (*) are
considered further as examples. Processes that cannot be developed further are marked
with strikethrough. Possibly feasible processes but not considered here are not marked.
Less conventional alternative process options are marked with a club (<J!!.).
7-25
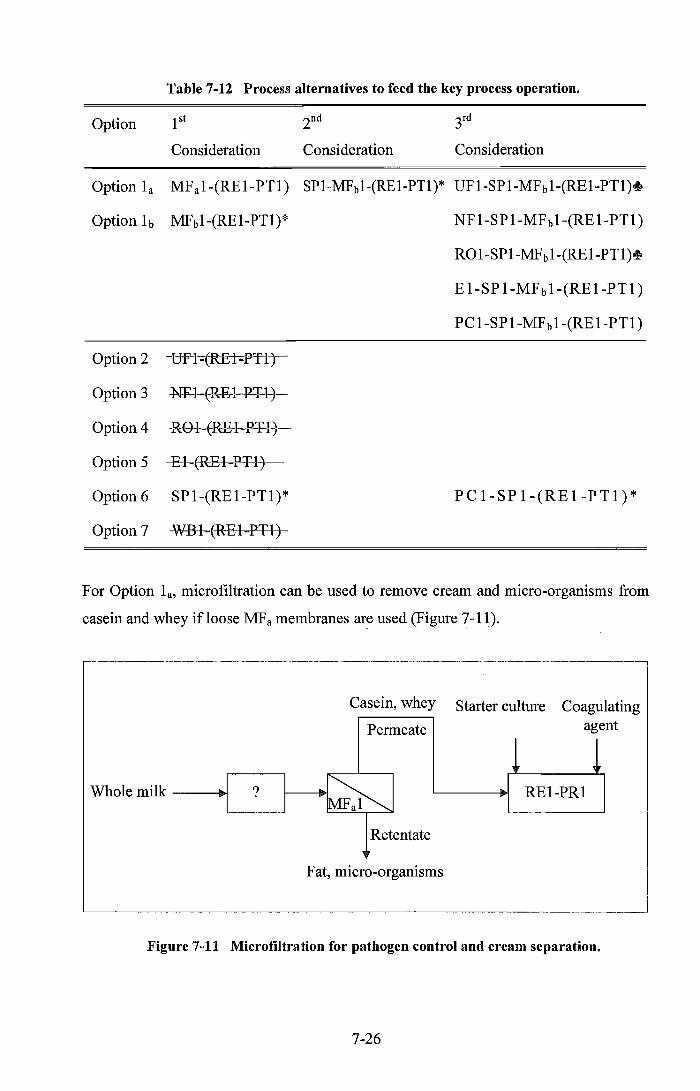
Table 7-12 Process alternatives to feed the key process operation.
Option 1 st 2nd 3rd
Consideration Consideration Consideration
Option 1a MF a1-(RE 1-PT1) SP1-MF b1-(RE 1-PTl)* UF1-SP1-MFb1-(RE1-PT1)+
Option 1b MFb1-(RE1-PT1)* NF l-SP 1-MF b1-(RE1-PT1)
R01-SP1-MF b 1-(RE1-PT1)+
E l-SP 1-MFb1-(RE1-PT 1)
PC 1-SP1-MFb1-(RE1-PT1)
Option 2 -~ - -
Option 3 NF-l~1+-
Option 4 R-Gl-E-RBl--PTl)
Option 5 ---B-1-ERE-l~P-'FB-
Option 6 SP1-(RE1-PT1)* PC1-SP1-(RE1-PT1)*
Option 7 ~~P-HJ--
For Option la, micro filtration can be used to remove cream and micro-organisms from
casein and whey if loose MFa membranes are used (Figure 7-11).
Casein, whey Starter culture Coagulating
Permeate age nt
1 1 Whole milk ? ~ RE1-PR1
Retentate
Fat, micro-organisms
Figure 7-11 Microfiltration for pathogen control and cream separation.
7-26
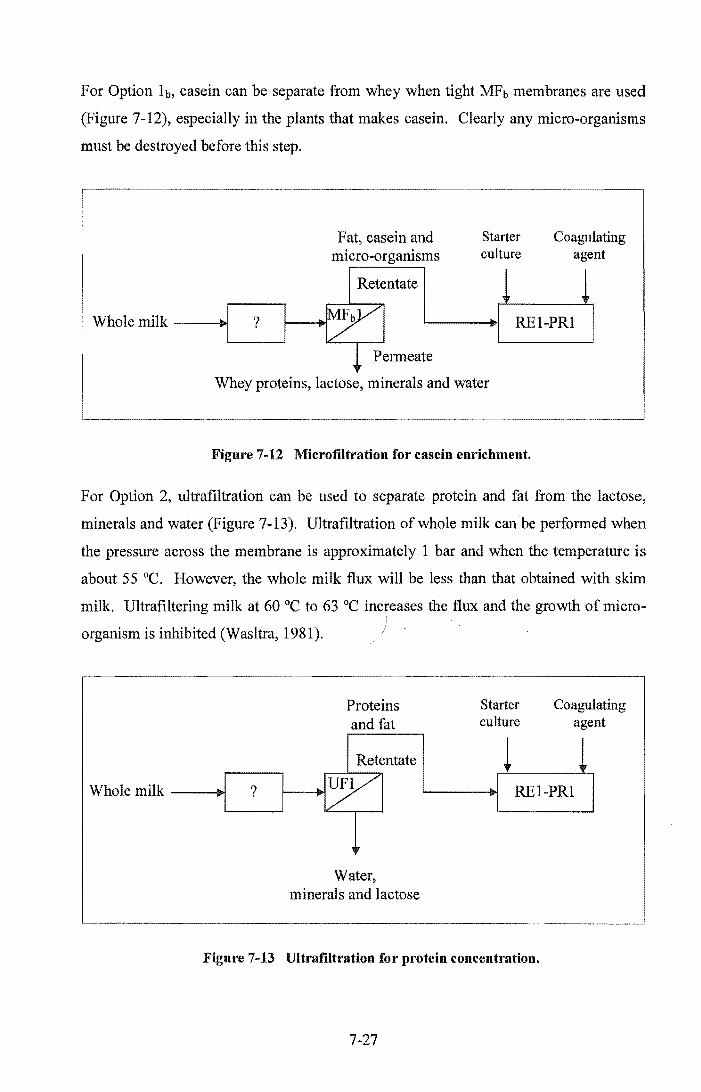
For Option h, casein can be separate from whey when tight MPb membranes are used
(Figure 7-12), especially in the plants that makes casein. Clearly any micro-organisms
must be destroyed before this step.
Fat, casein and micro-organisms
Starter culture
Coagulating agent
Whole milk ---4I00I ? RE1-PR1
Permeate
Whey proteins, lactose, minerals and water
Figure 7-12 Microfiltration for casein enrichment.
For Option 2, ultrafiltration can be used to separate protein and fat from the lactose,
minerals and water (Figure 7-13). Ultrafiltration of whole milk can be performed when
the pressure across the membrane is approximately 1 bar and when the temperature is
about 55°C. However, the whole milk flux will be less than that obtained with skim
milk. Ultrafiltering milk at 60°C to 63 °C increases the flux and the growth of micro
organism is inhibited (Wasltra, 1981).
?
Proteins and fat
Retentate
Water, minerals and lactose
Starter culture
Coagulating agent
RE1-PR1
Figure 7-13 Ultrafiltration for protein concentration.
7-27

In Option 3, nanofiltration is used to concentrate the milk by dewatering and
demineralising the milk. Therefore, less whey has to be removed downstream. The
drawback here is that lactose will be retained. Lactose is not required in the cheese
process except to produce lactic acid for the reaction. However, lactose can be
separated downstream with whey (see Figure 7-14).
Whole milk --~
Water and minerals
Starter culture
Coagulating agent
REI-PRI
Figure 7-14 Nanofiltration for water total solid concentration.
Nanofiltration is rejected here because it retains most of the lactose which it is not
required in the cheese process except for a small amount.
In Option 4, reverse osmosis is another alternative to concentrate milk by the removal of
the water component (Figure 7-15). In practice, due to the concentration polarisation at
the membrane, it will need a considerably higher pressure. Reverse osmosis is rejected
here because cottage cheese requires only small amount of water removal.
Retentate Starter Coagulating culture agent
Whole milk --+I REI-PRI
Water
Figure 7-15 Reverse osmosis for water separation.
7-28

In Option 5, it is possible to use evaporation to concentrate the milk to be fed to the key
process. Evaporation can concentrate the milk to approximately 50% total solids (see
Section 4.2.3). Evaporation does not only increase the concentration of fat and protein
content, but also the lactose and mineral content which is undesirable for the
composition of cottage cheese (see Figure 7-16) .
. ~------.-----~~~---~~~-
Whole milk ---lI>l~1 ? t----+l~1 E 1
• Water
f----~~ REI-PRI I
Figure 7-16 Upstream evaporation process.
For Option 6, fat separation is achieved by centrifugal separation (see Section 4.2.2),
This option is a good candidate to produce the feed for the key process operation shown
in Figure 7-17.
.-----4o>Cream
Whole milk ----II>IL--_~-_""'_ _ ___l-L-~w....,.il,.-.-[-at-.1Io [REI-PRI I
Figure 7-17 Centrifugal separation for low fat milk standardisation.
For Option 7, wet blending can be used to add any ingredient like fat if required.
(Figure 7-18). Addition of salt at this stage would likely inhibit the subsequent reaction.
Fat
Whole milk ---lI>l,--_~--lI>I "'.f .... I 1-----4o>~ I REI-PRl I
Figure 7-18 Wet blending for adding a fat component.
7-29

Out of these seven alternatives from Table 7-12, there are more possible combinations
as shown in Table 7-13. Of these possible combinations, only those marked with an
asterisk (*) are considered further as examples. Processes that cannot be developed
further are marked with strikethrough and processes not to be considered here are not
marked. Less conventional alternative process options are marked with a club (+).
Table 7-13 Possible further combination options.
Fig. Upstream Options Fig. Downstream Options
7-11 ~ 7-8 SP-WB-P
7-12 MF b-(RE-PT)* 7-9 SF-WB-P*
7-13 UF-(RE-PT)~
7-14 -NF-~}-
7-15 -R.&(RE=P1'T
7-16 E-(RE-PT)~
7-17 SP-(RE-PT) * 7-18 WB-(RE-PT)~
Out of these eight options, separation is regarded as the best alternative to fulfil the
product requirement of fat depletion calculated in Step 4. Then, pathogen control needs
to be considered at the beginning of the process.
A final process flowsheet achieved is shown in Figure 7-19 below.
Cream Starter culture
Coagulating agent
Salt
Wash water, whey protein, lactose and minerals
Packed cottage cheese
Figure 7-19 Schematic flowsheet of cottage cheese production.
7-30

The methodology will also produce many alternatives flowsheets e.g., (Figure 7-20).
Cream Starter Coagulating Salt/cream culture agent
t 1 1 :~f~e~1 PCl H SPI H UFl H REl-PRl ~ SPI
Wash water, whey protein, lactose and minerals
Packed cottage cheese
Figure 7-20 Schematic flowsheet option of cottage cheese production.
At the scale of this process, the cost of extra operations is probably not worthwhile.
Utilities and effluents from the separation process are shown in Table 7-14.
Table 7-14 Process utiUties and emission.
Utilities required
Steam Electricity Potable water Hot water Cooling water Demineralised water CIP water, cleaning agents
Emissions
Smell Noise CIP water, cleaning agents
Step 10: Check for each side products from the linear flowsheet. Classify them as co
products, by-products and waste products (see Section 3.3).
Product: Packed cottage cheese
Co-product: Cream
Whey protein
Lactose
Minerals
Effluents: Water and detergent from CIP.
7-31

Step 11: If it is a co-product, treat it as a new feed to the further processing and repeat
the design methodology from Step 1.
There is a significant volume of whey co-products produced from cottage
cheese manufacture. This stream contains valuable components, namely,
whey protein, lactose and minerals. However, at its low rate (3744 kg/day of
whey; see Appendix A), it is unlikely to be economically viable for further
processmg.
The other co-product stream contains valuable component, namely cream.
The cream will be treated as a new feed for further processing. The
methodology will be repeated with the cream powder as the final product (i.e.
Step 1). The details of Step 2 to 4 are not shown here. A freeze drier is
chosen as the key process in Step 5. In Step 6, an economic analysis has
been done in Appendix A for this key process. It shows that freeze drying of
cream into cream powder is marginally unviable.
At this small volume 191.2 kg/day of fat (see Appendix A), it is also unlikely
to be economically viable for further processing. Thus, this cream will be
sold to a small dairy factory for homemade butter processing.
Step 12: If it is a by-product or waste product, lookfor opportunities to off-set cost of
discharging otherwise determine a suitable treatment for its disposal.
Process integration options on small scale operations are typically limited.
Integration of utilities in this case study is not considered.
Step 13: Identify the matching streams within the flowsheet. Consider products and
equipment constraints. Check for energy, water, time and environmental
integration opportunities.
There is no matching product within the flowsheet.
Step 14: Identify the matching products between flowsheets (linear flowsheet and the
new co-product processing flowsheets). Check for energy, water, time and
environmental integration opportunities.

There is no matching product between the flowsheet.
Step 15: If the co-product cannot be processed due to the capacity problem, it may be
necessary to identify the proximity matching product between sites and
environment.
The whey co-product will be disposed of as stock feed. If this cottage cheese
production is carried out on a medium or large scale, then it may become
practical to process the whey co-products stream to recover the valuable
components.
None ofthe utilities and emissions can be matched for further integration.
7.4.2 Medium Scale Milk Processing
Overview
For the purpose of illustration, a medium scale process case study will be evaluated
using the conceptual design methodology. The process shown here is proposed as a
mean of identifying other factors that significantly affect the design opportunities, such
as the process scale.
7.4.2.1 Case Study Three: Medium Scale Milk Processing (Packed Casein Powder)
Design Methodology
Step 1: Select the final product.
The choice of product is based on the market demand, and as an example, the
product chosen here is packed casein powder.
Step 2: List the composition of process feed and specifications of the final product.
Feed = 106 kg raw whole milk per day
The composition of feed, product composition and specification are listed in
Table 7-15.
7-33
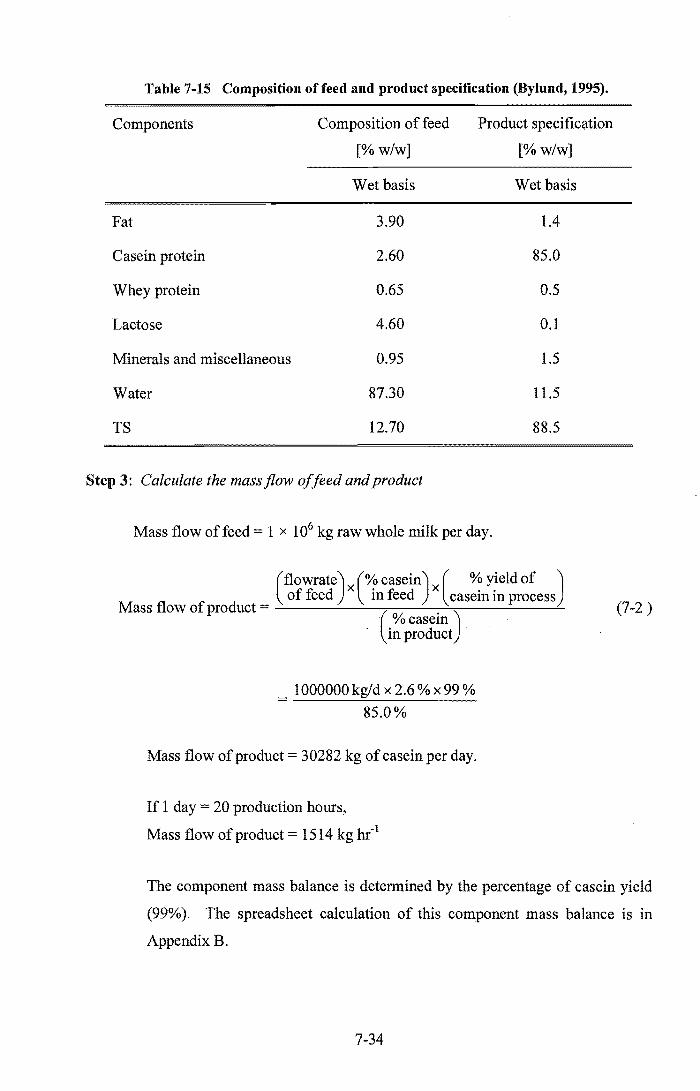
Table 7~15 Composition of feed and product specification (Bylund, 1995).
Components Composition of feed Product specific;;ltion
[%w/w] [%w/w]
Wet basis Wet basis
Fat 3.90 1.4
Casein protein 2.60 85.0
Whey protein 0.65 0.5
Lactose 4.60 0.1
Minerals and miscellaneous 0.95 1.5
Water 87.30 11.5
TS 12.70 88.5
Step 3: Calculate the massflow offeed and product
Mass flow of feed = 1 x 10⁶ kg raw whole milk per day.
(flowrate) (% casein) ( % yield of ) of feed x in feed x casein in process
Mass flow of product = (. ) %casem
in product
1000000 kg/d x 2.6 % x 99 %
85.0%
Mass flow of product = 30282 kg of casein per day.
If 1 day = 20 production hours,
Mass flow of product = 1514 kg hr- l
(7-2 )
The component mass balance is determined by the percentage of casein yield
(99%). The spreadsheet calculation of this component mass balance is in
AppendixB.
7-34

Step 4: Compare product composition with the feed to determine enrichment and/or
depletion of components.
Table 7-16 shows the milk components that need to be enriched and depleted.
It shows that from the component calculations (see Appendix B), all milk
components except for casein need to be depleted. Casein will be slightly
depleted, but this is simply due to the yield of casein being less than 100% (due
to the processing losses). If the casein losses exceed 1%, then the required
depletion of all other components will need to be higher in order to maintain
the desired product composition.
Table 7-16 The addition and removal of components.
Component
Fat
Casein
Whey protein
Lactose
Minerals and miscellaneous
Water
Enrichment
[kg hr- l]
Depletion
[kg hr- l ]
1929
13
317
2298
452
43476
Step 5: Select key process operationfrom Table 7-3 (based on Chapters 4 and 5).
According to Table 7-3, (based on Section 5.6.1), the key process operation for
the casein powder is precipitation. Therefore, a precipitation agent would be
required.
Step 6: Define the scope of the key process operation from the feed to its product and
relate the operation feed and product to the overall process feed and product.
Designate a letter from Table 7-2 to the process.
Estimate the capital cost of the flowsheet and check its economic viability.
7-35

The precipitation agent is the only component to be added. The precipitation
agent used here is sulphuric acid of 10% strength (for casein process
information see Section 5.6.1). Casein curd also need to be 'cooked' (see
Section 5.6.1). Figure 7-21 shows the scope of the process for the production of
casem.
Sulphuric acid
t Whole raw Casein rich Slurry Packed casein ?
low fat liquid ". PT1 ~ ? powder
liquid milk
~ ~ Fat Whey
Figure 7-21 Casein production process scope.
Step 7: Identify the requirements for the inputs, outputs and constraints of the selected
key process operation (see Chapter 4).
From the calculations in Appendix B, the casein protein is precipitated from
low fat liquid containing casein (refer to Section 5.6.1). Therefore, the
precipitation should be carried out with a minimum amount of fat.
Consequently, an upstream fat separation is required.
Inputs: Feed has to be low fat liquid containing casein (see Section 5.6.1).
Precipitation agent
Outputs: Product is a slurry
Step 8: Downstream processes:
(This is a recursive step). It will potentially give many different flowsheets with
a combination of operations.
For each current flowsheet, do the following:
If the last operation in the flowsheet does not produce the overall process
product:
Find all operations that can process feeds the same as the current
flowsheet product. For each of these:
7-36
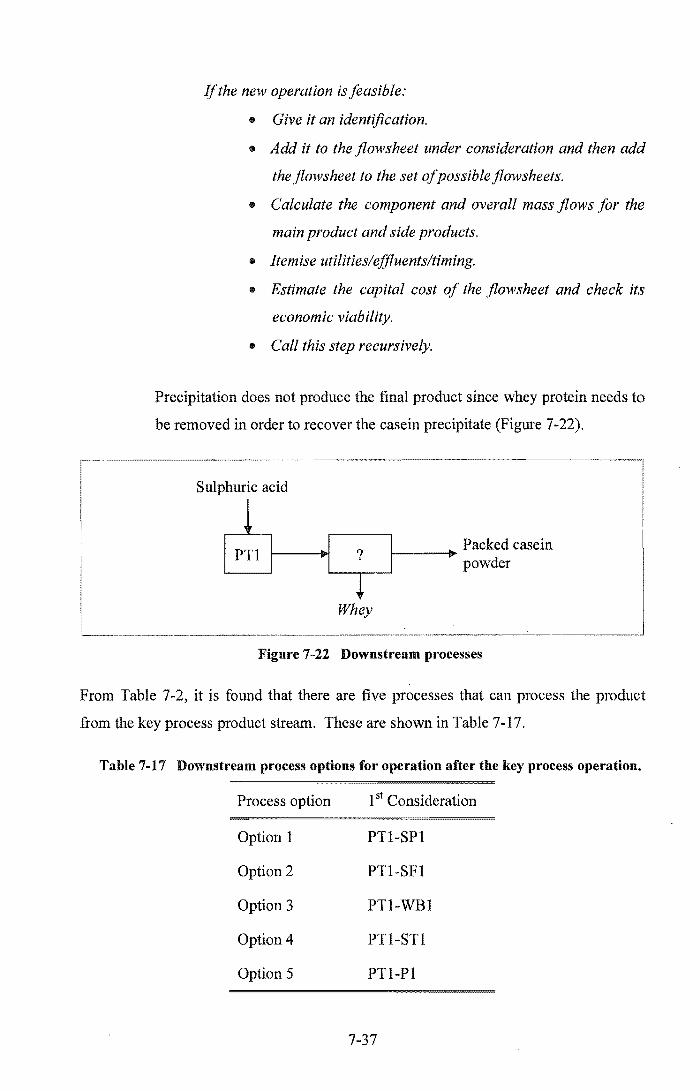
If the new operation is feasible:
• Give it an identification.
• Add it to the flowsheet under consideration and then add
the flowsheet to the set of possible flowsheets.
• Calculate the component and overall mass flows for the
main product and side products.
• Itemise utilities/ejjluents/timing.
• Estimate the capital cost of the flowsheet and check its
economic viability.
• Call this step recursively.
Precipitation does not produce the final product since whey protein needs to
be removed in order to recover the casein precipitate (Figure 7-22).
Sulphuric acid
1 PT1 ?
Packed casein powder
~ Whey
Figure 7-22 Downstream processes
From Table 7-2, it is found that there are five processes that can process the product
from the key process product stream. These are shown in Table 7-17.
Table 7-17 Downstream process options for operation after the key process operation.
Process option 1 sl Consideration
Option 1 PT1-SP1
Option 2 PTl-SF1
Option 3 PT1-WB1
Option 4 PTI-STI
Option 5 PT1-P1
7-37

In Option 1, a centrifugal separator (decanter) is designed to separate casein from whey
(Figure 7-23). There are also other different types of decanter in the dairy industry such
as the conveyor-bowl centrifuge (see Section 4.2.2).
Sulphuric acid
l I PT1 11-----+1,1 SP 1 II---~ Casein curd
t Whey
Figure 7-23 Centrifugal separation for casein process.
Option 2 uses a filtration screen to separate whey from the casein curds (Figure 7-24).
There are a variety of screen filter types, including those using rotary, inclined or
parabolic fine mesh screens for continual removal of the casein curds. Cross-flow
filtration is commonly used for the separation of whey or wash water from casein or
cheese curd (see Section 4.2.1.2).
Sulphuric acid
1 PT1 SF1 Casein curd
t Whey
Figure 7-24 Screen filtration for casein.
In Option 3, a wet blending option is rejected in the first consideration because nothing
needs to be added to the slurry. Only component removal is required.
Option 4 that considers a storage of the key process product is rejected because there is
no good reason for storing the slurry. Furthermore microbial growth might occur.
7-38
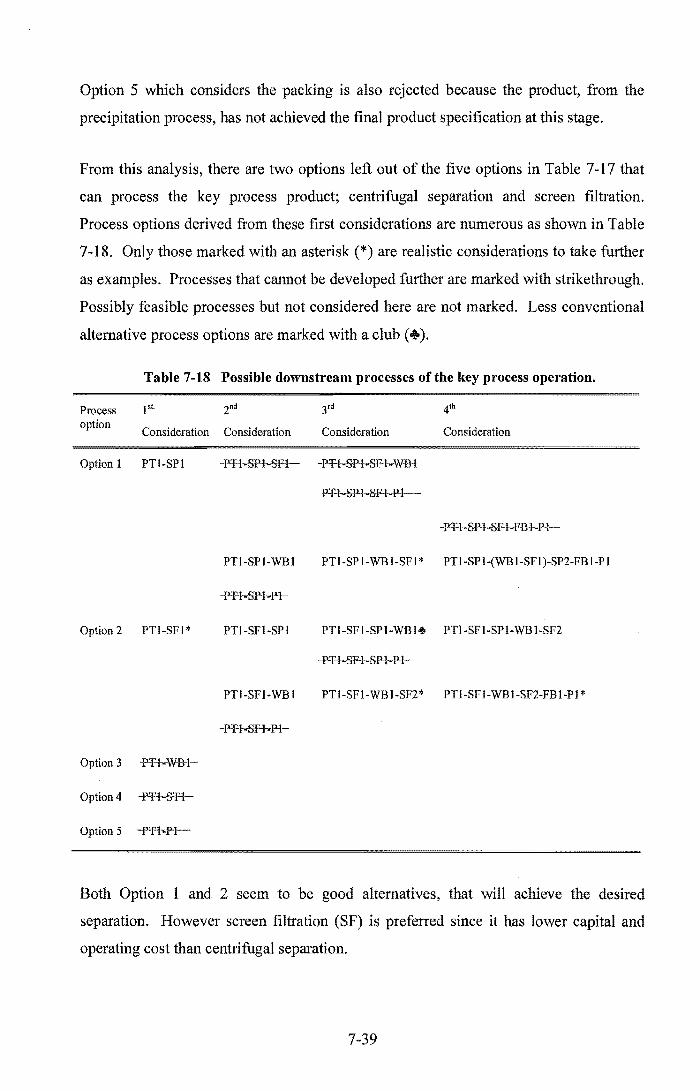
Option 5 which considers the packing is also rejected because the product, from the
precipitation process, has not achieved the final product specification at this stage.
From this analysis, there are two options left out of the five options in Table 7-17 that
can process the key process product; centrifugal separation and screen filtration.
Process options derived from these first considerations are numerous as shown in Table
7-18. Only those marked with an asterisk (*) are realistic considerations to take further
as examples. Processes that cannot be developed further are marked with strikethrough.
Possibly feasible processes but not considered here are not marked. Less conventional
alternative process options are marked with a club (+).
Table 7-18 Possible downstream processes of the key process operation.
Process l't 2nd 3rd 4th
option Consideration Consideration Consideration Consideration
Option 1 PTl-SPl -P'Ff..Sp.J~~1- ...pT1~P-l"§F .. l-vWB-l
P-'fI--8P-l-SF-I-..Fl-
-p..H~P+..sF-l-..FB+·P"l-
PTl-SPI-WBI PTl-SP 1-WB I-SFI * PTl-SPl-(WB I-SFI )-SP2-FB I-P I
Option 2 PTl-SF 1 * PTI-SF I-SP 1 PTl-SFl-SPI-WBI-t PTl-SFl-SPI-WBl-SF2
PTI-SFI-WBI PTI-SFI-WBI-SF2* PTl-SFI-WBl-SF2-FBI-PI *
Option 3 -P-T+-wB-t--
Option 4 -f'Tl=S!f-l-
Option 5 ~p.l-
Both Option 1 and 2 seem to be good alternatives, that will achieve the desired
separation. However screen filtration (SF) is preferred since it has lower capital and
operating cost than centrifugal separation.
7-39

In the second consideration in Table 7-18, the option chosen above does not produce the
final product because the casein curd still contains excess lactose, minerals and whey
proteins (see Appendix B). It needs to be refined by washing out the whey protein,
lactose and minerals.
Warm water is added into a wet blending process for washing out the whey from the
casein curd. This is followed by screen filtration, in order to purify the casein product
(see Section 5.6.1). This is shown in Figure 7-25. The WB-SF2 step (washing) can be
repeated if necessary to obtain higher purity.
Sulphuric acid Water
? '-----'
curd. water
Whey Wash water
Figure 7-25 Screen filtration for casein production.
The product at this stage is a solid curd containing moisture. The moisture needs to be
removed to meet the product specifications., From Table 7-2, there are three operations
that can process this product. They are, centrifugal separation, dry blending and
fluidised bed drying.
Centrifugal separation using a decanter or screen centrifuge can be used to remove more
moisture, however it is unlikely to remove sufficient water to directly achieve the
desired product specification.
Dry blending can be used but it is not considered in this case. However, casein can be
blended with itself to produce a more uniform product.
Fluidised bed drying can follow screen filtration to remove the remainder of the water
from the casein curd in order to meet the product specification as shown in appendix B
(see Figure 7-26). This is selected as the preferred option for producing dried casein.
7-40

Sulphuric acid Water Water vapour
SFI WBI SF2 FBI Casein curd
Whey Wash water
Figure 7-26 Fluidised bed drier for casein production.
Now, the product has achieved its product specification and only requires to be packed
(see Figure 7-27).
Sulphuric acid Water Water vapour
PI
Whey Wash water
Figure 7-27 Screen filtration for casein production.
Dry packed casem
See Section 5.6.1 for the utilities adsociated with the casein process.
Step 9: Upstream processes:
(This is a recursive step). It will potentially give many different flowsheets with
a combination of operations.
For each current flowsheet, do the following:
If the first operation in the flowsheet is not fed by the overall process feed:
Find all operations that can produce the feed for the current flowsheet.
For each of these:
If the new operation is feasible:
• Give it an identification.
CD Add it to the flowsheet under consideration and then add
the flowsheet to the set of possible flowsheets.
• Calculate the component and overall mass flows for the
main product and side products.
7-41

• Itemise utilities/ejJluents/timing.
.. Estimate the capital cost of the flowsheet and check its
economic viability.
• Call this step recursively.
The calculation in Appendix B shows that the fat from the whole milk needs to be
separated (see Figure 7-28) before the key process.
Whole raw liquid milk
?
Sulphuric acid
l Liquid milk
PT1 with no fat
Figure 7-28 Schematic flowsheet upstream of the key process.
From Table 7-2, there are 11 options to deplete components upstream of the key process
(see Table 7-19).
Table 7-19 Process options that can produce the feed for the current flowsheet.
Process option 1 st Consideration
Option 1 MF1 a-PT1
Option 2 MF1 b-PT1
Option 3 UF1-PT1
Option 4 NF1-PT1
Option 5 R01-PT1
Option 6 ED1-PT1
Option 7 DI-PT1
Option 8 IX1-PT1
Option 9 E1-PT1
Option 10 SP1-PT1
Option 11 WB-PT1
From Table 7-19, the unit operations that can produce liquid feed for the current
flowsheet feed are examined in each option and further alternatives explored.
7-42

Option I, loose microfiltration membrane (MFa I) can be used to remove the fat and
micro-organisms from whole milk (Figure 7-29). However there will be significant
casein losses in the retentate which will reduce the overall casein yield (Bylund, 1995).
Whole raw liquid milk
~
Casein, whey protein, lactose, minerals, water
Permeate
~ Retentate
Mlcro-orgamsms, fat
Sulphuric acid
PTI
Figure 7-29 Schematic flowsheet with loose MFa upstream of the key process.
Option 2, tight microfiltration (MFbl) can be used to achieve partial depletion of whey
protein, lactose, minerals and water (see Figure 7-30). There is no casein losses for this
option therefore it is a good candidate. Given that the feed to precipitation must be low
in fat, excess fat must be removed prior to this process. Similarly a pathogen control
step must also exist prior to this process. Upstream removal of water, whey protein,
lactose and minerals reduces the volume of material that must pass through the key
process, and will also lessen the amount of washing required downstream.
Whole raw liquid milk
Fat
?
Fat casein Retentate
Permeate
Whey protein, lactose, minerals, water
Sulphuric acid
'-----+I PTI
Figure 7-30 Schematic flowsheet with MFb upstream ofthe key process.
7-43

F or Option 3, ultrafiltration can be used to produce concentrate skim milk that is rich in
proteins and depleted in lactose, minerals and water (Figure 7-31). This potentially
provides an uncontaminated source of lactose. In this option there are no casein losses,
and downstream washing might be reduced, however UF is not as appealing as MF b
since ultrafiltration retains whey proteins. Excess fat removal upstream is still required.
Whole raw liquid milk
Fat F at, casein, whey protein
Retentate
Lactose, minerals, water
Sulphuric acid
Figure 7-31 Schematic flowsheet with UF upstream of the key process.
For Option 4, nanofiltration can be used to concentrate the skim milk by removal of
minerals and water (Figure 7-32). In this option there are no casein losses, and
downstream washing is reduced, however NF is not as appealing as UF since lactose is
retained by the membrane. Excess fat removal upstream is still required.
Whole raw liquid milk
Fat
?
Fat, casein, whey protein, lactose Retentate
Retentate
Minerals, water
Sulphuric acid
'---~ PT1
Figure 7-32 Schematic flowsheet with loose NF upstream of the key process.
7-44

For Option 5, reverse osmosis prior to precipitation is a viable membrane concentration
of skim milk by removing water (Figure 7-33). This process offers no advantage over
UFo While it might provide a source of clean water, it will not reduce the wash water
requirement downstream. Excess fat removal upstream is still required. This option is
discarded.
Whole raw liquid milk
Fat Fat, casein, whey protein, lactose, minerals, water
Retentate
Retentate
Water
acid
Figure 7M33 Schematic flowsheet with RO upstream of the key process.
For Option 6, electrodialysis (Section 4.2.1.2) can be used for milk demineralisation.
(Figure 7-34). However, like ]W this only offers limited advantages, and excess fat
must still be removed upstream. There is no obvious advantage of mineral reduction
without lactose reduction so this process is rejected.
Whole raw liquid milk
Fat
? Liquid milk
EDI with low minerals
Minerals
Figure 7-34 Schematic flowsheet with ED upstream of the key process.
Option 7, dialysis (Figure 7-35) also removes minerals from the skim milk stream. This
process is discarded for the same reasons as NF and electrodialysis.
7-45
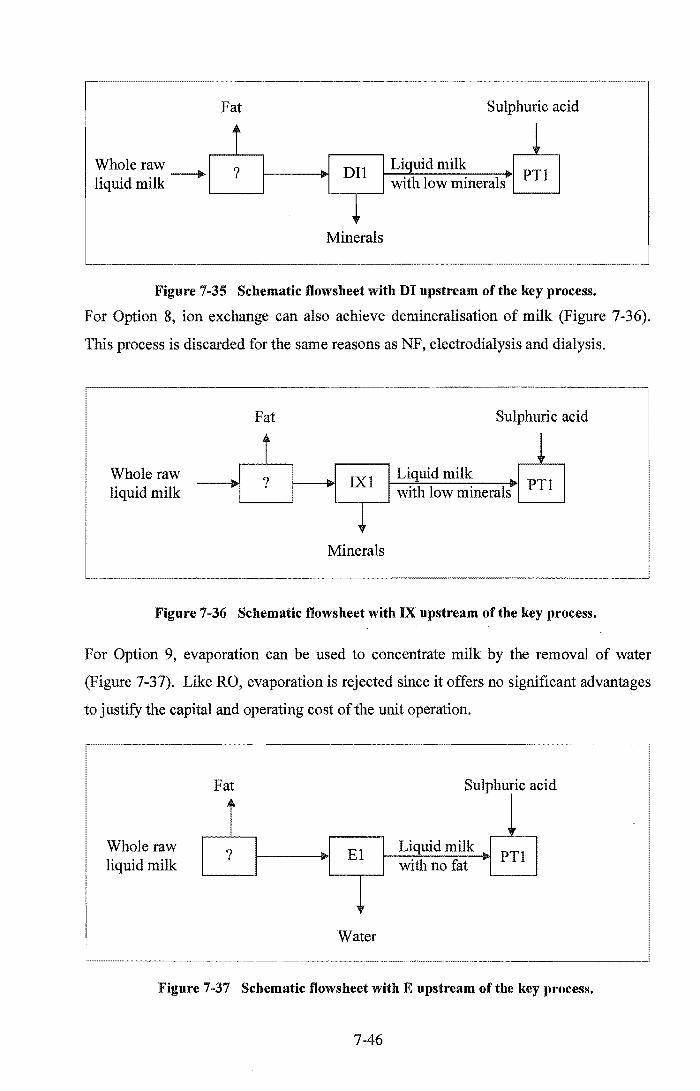
Whole raw liquid milk ---+- ?
1--_-.1
DIl
Sulphuric acid
LiquidmiIk 1---:-':-.,..---.,..---,,-iI>l PT 1
with low minerals ~~-.I ~ __ ~
Minerals
Figure 7-35 Schematic tlowsheet with DI upstream of the key process.
For Option 8, ion exchange can also achieve demineralisation of milk (Figure 7-36).
This process is discarded for the same reasons as NF, electrodialysis and dialysis.
Fat Sulphuric acid
t 1 Whole raw
? I IXI Liquid milk
PTI liquid milk I with low minerals
~ Minerals
Figure 7-36 Schematic flowsheet with IX upstream of the key process.
For Option 9, evaporation can be used to concentrate milk by the removal of water
(Figure 7-37). Like RO, evaporation is rejected since it offers no significant advantages
to justify the capital and operating cost of the unit operation.
Whole raw liquid milk
Fat
r ? I ..
I
Sulphuric acid
El Liquid milk PTI with no fat
Water
Figure 7-37 Schematic flowsheet with E upstream of the key process.
7-46
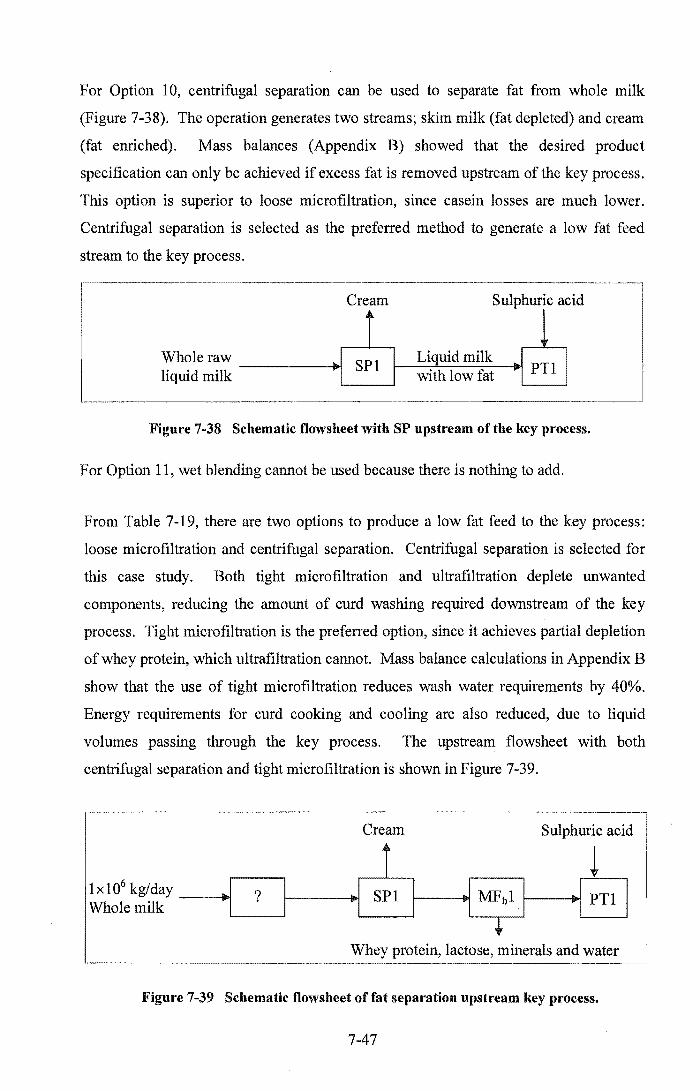
For Option 10, centrifugal separation can be used to separate fat from whole milk
(Figure 7-38). The operation generates two streams; skim milk (fat depleted) and cream
(fat enriched). Mass balances (Appendix B) showed that the desired product
specification can only be achieved if excess fat is removed upstream of the key process.
This option is superior to loose micro filtration, since casein losses are much lower.
Centrifugal separation is selected as the preferred method to generate a low fat feed
stream to the key process.
Cream Sulphuric
with low fat Whole raw
-----~ liquid milk
Liquid milk
Figure 7-38 Schematic flowsheet with SP upstream of the key process.
For Option 11, wet blending cannot be used because there is nothing to add.
From Table 7-19, there are two options to produce a low fat feed to the key process:
loose microfiltration and centrifugal separation. Centrifugal separation is selected for
this case study. Both tight microfiltration and ultrafiltration deplete unwanted
components, reducing the amount of curd washing required downstream of the key
process. Tight micro filtration is the preferred option, since it achieves partial depletion
of whey protein, which ultrafiltration cannot. Mass balance calculations in Appendix B
show that the use of tight microfiltration reduces wash water requirements by 40%.
Energy requirements for curd cooking and cooling are also reduced, due to liquid
volumes passing through the key process. The upstream flowsheet with both
centrifugal separation and tight micro filtration is shown in Figure 7-39.
1 x 10⁶ kg/day Whole milk
?
Cream
r SPI
Sulphuric acid
~ MFb1 PTI
t Whey protein, lactose, minerals and water
~--------------------------------
Figure 7-39 Schematic flowsheet of fat separation upstream key process.
7-47

Food safety and longer shelf life demand that milk should be pathogen controlled (see
Sections 4.1 and 4.8), as shown in Figure 7-40.
lx106 kg/day Whole milk
PCl
Cream Sulphuric acid
i 1 SPI MFb l PI!
! Whey protein, lactose, minerals and water
Figure 7-40 Schematic flowsheet of pathogen control upstream process.
One of many final linear process flowsheet is shown in Figure 7-41 below.
Whole milk Cream Sulphuric acid
Lactose, whey protein, minerals, water
Whey
Water Water vapour
Wash water Dried packed casein
Figure 7-41 Final linear process flowsheet of packed dried casein.
Step 10: Checkfor each side products from the linear flowsheet. ClassifY them as co
products, by-products and waste products (see Section 3.3).
From Step 8 and 9 it can be seen most of the side products produced during casein
manufacture are associated with purifying after precipitation (Figure 7-42). A variety of
flowsheets are possible to achieve this.
7-48
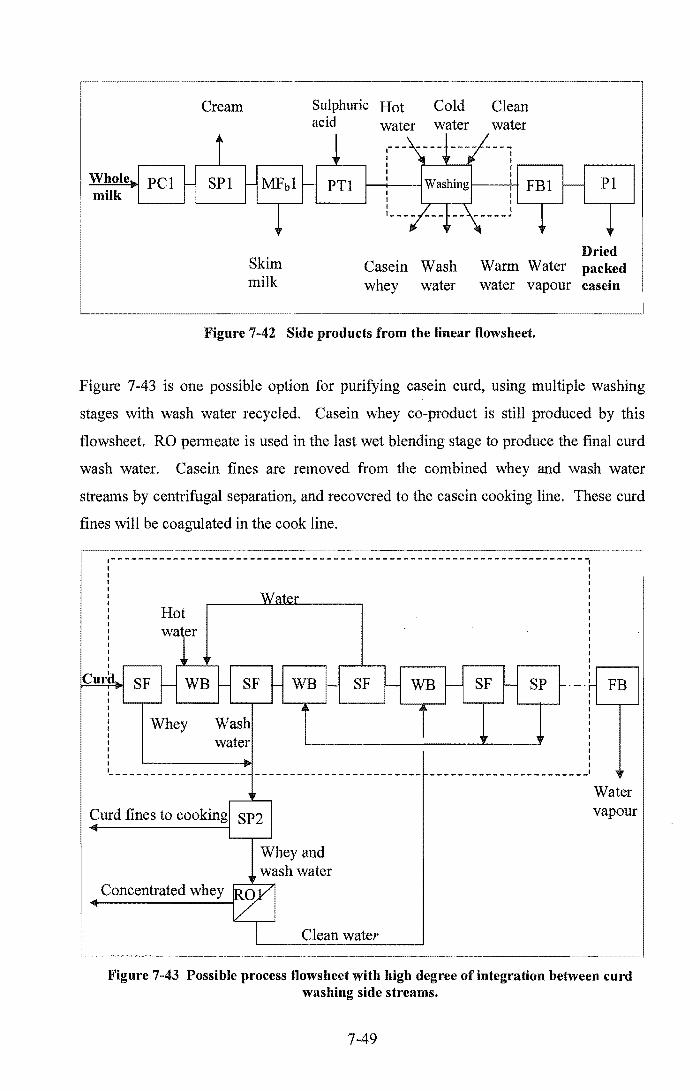
Whole PCI milk
Cream
SPl
Skim milk
Sulphuric Hot Cold Clean acid water water water
PTI
Casein Wash whey water
I---H FBI PI
Dried Warm Water packed water vapour casein
Figure 7-42 Side products from the linear tlowsheet.
Figure 7-43 is one possible option for purifYing casein curd, using multiple washing
stages with wash water recycled. Casein whey co-product is still produced by this
flowsheet. RO permeate is used in the last wet blending stage to produce the final curd
wash water. Casein fines are removed from the combined whey and wash water
streams by centrifugal separation, and recovered to the casein cooking line. These curd
fines will be coagulated in the cook line .
. ------------------------------------------------------ ------------, I I I I I I I I I I I I I I I
Cur<t I I I I I I I I I I I
Hot waer
Whey Wash water
L __________________ _
Curd fines to cooking
Concentrated whey
Whey and wash water
Clean water
SP I : '---,--'
I I I I I I I I
- - - - - - - - - - - - - - - - _I
Water vapour
Figure 7-43 Possible process tlowsheet with high degree of integration between curd washing side streams.
7-49

When fonnally examining possibilities for side stream integration, it is useful to present
the relevant information in a structured fonnat. Table 7-20 shows the inputs streams
required for the casein flowsheet developed in Step 9. Values in the table are generated
from mass and energy balances in Appendix B.
Table 7-20 Inputs required for the linear casein tlowsheet (Figure 7-41).
Stream Use Flow Classification
Whole milk Primary process feed 50000 Ingredient Sulphuric Injected into low fat milk to precipitate casein 20 Ingredient acid curd
Hot water Used to heat curd to cooking temperature 9738 Utility Clean water Potable water added into dewheyed casein to 10628 Ingredient
wash out unwanted fat, whey protein, lactose and minerals.
Table 7-21 shows the output streams from the casein flowsheet developed in Step 9.
Values in the table are generated from mass and energy balances in Appendix B.
Table 7-21 Output streams from the linear casein Howsheet (Figure 7-41).
Stream Description Source Flow Classification
[kg/hr]
Casein Packed casein powder Packing line 1434 Primary product
Cream High solids stream. Primarily fat, Centrifugal separator 4796 Co-product with small amounts of casein, whey processing whole protein, lactose and minerals. milk feed
Skim milk Low solids stream. Primarily Microfiltration plant 32348 Co-product permeate lactose, with small amounts of whey processing skim from
protein and minerals. centrifugal separator
Casein Low solids stream. Primarily Filtration screen 6234 Co~product whey lactose, with small amounts of fat, processing casein
whey protein, minerals and acid. slurry Also contains small amount of casein fines.
Wash Very low solids stream. Small Cooked curd washing 10986 Co-product water amounts of whey protein, lactose
and minerals. Also contains small amount of casein fines.
Warm Clean, warm utility water Heating curd to cook 9738 Utility water temperature
Water Water vapour Hot exhaust gas from 4864 By-product vapour fluidised bed drier
7-50

Step 11: If it is a co-product, treat it as a new feed to the further processing and repeat
the design methodology from Step 1.
There are four possible co-product streams produced by the proposed casein flowsheet
shown in Figure 7-41, and summarised in Tables 7-20 & 7-21. Cream is a co-product
that has immediate value without any further processing; it may be sent to another
factory on site, or on-sold to another processor. In this case study it is assumed that
cream is sent to another factory for processing. Skim milk permeate is also considered
to have immediate value, since it can be injected directly into liquid milk, when
producing milk powder with enriched lactose and minerals content. For this case study,
it is assumed that the milk permeate is sent to used in another a factory without need for
further processing.
The casein whey and wash water require further processing to produce a valuable
product. It is likely to be necessary to remove the casein fmes from the casein whey and
wash water streams. Both streams are produced at the same time, and have very low
solids, making it possible to combine the two streams. Thus for casein production, there
are three potential co-product streams.
Step 12: If it is a by-product or waste product, look for opportunities to off-set cost of
discharging otherwise determine a suitable treatment for its disposal.
The only by-product identified in Table 7-21 is water vapour from the fluidised drier.
Discharging this does not have any associated costs.
Step 13: Identify the matching streams within the flowsheet. Consider products and
equipment constraints. Check for energy, water, time and environmental
integration opportunities.
One possible match is identified from Tables 7-20 and 7-21:
1) Recover water from combined whey and wash water stream to use for curd washing.
To achieve this, it is first necessary to remove the casein fines from this co-product
stream. Centrifugal clarification (see Section 4.2.2) is selected to remove these fines.
Clarifier fines can be recovered to cooking to increase the production yield. NF
7-51

treatment produces a permeate with some lactose and minerals content. Subsequent
RO polishing of this permeate produces a stream that is (essentially) free of dissolved
solids. Use ofRO polisher permeate in the wet blending (curd washing) step reduces
the clean water requirements by 96% (see Appendix B). Time integration is
relatively simple, since the clean water and wash water streams are closely related,
although additional supplementary water may be required at start-up until a permeate
stream is available from the RO polisher. The NF and RO polisher retentate streams
can be combined as a new co-product stream. The casein flowsheet with integrated
side streams is shown in Figure 7-44.
Whole milk Cream Sulphuric acid
Lactose, whey protein, minerals, water
Clar?fied, concentrated whey
Water Water vapour
casein
Figure 7-44 Process flowsheet of packed dried casein with integrated side streams.
Table 7-22 shows the input streams to the casein flowsheet developed in Step 13 after
side streams have been integrated. Values in the table are generated from mass and
energy balances in Appendix B. Values of note are marked in bold.
7-52

Table 7-22 Inputs required for casein flowsheet after integration of matching side streams.
Stream
Whole milk
Sulphuric acid
Hot water
Clean water
Use
Primary process feed
Injected into low fat milk to precipitate casein curd
Used to heat curd to cooking temperature
Potable water added into dewheyed casein to wash out unwanted fat, whey protein, lactose and minerals.
Flow Classification [kg/hr]
50000 Ingredient
20 Ingredient
9762 Utility
454 Ingredient
Table 7-23 shows the output streams from the casein flowsheet developed in Step 13
after side streams have been integrated. Values in the table are generated from mass
and energy balances in Appendix B. Values of note are marked in bold.
Table 7-23 Output streams from casein flowsheet after integration of matching side streams.
Stream
Casein
Cream
Skim milk permeate
Clarified, concentrated whey stream
Warm water
Water vapour
Description
Packed casein powder
High so lids stream. Primarily fat, with small amounts of casein, whey protein, lactose
and minerals.
Low solids stream. Contains lactose, whey protein and minerals.
Medium solids stream. Primarily lactose, with small amounts of fat, whey protein, minerals and acid. Free from casein fines.
Clean, warm utility water
Water vapour
Source Flow Classification
[kg/hr]
Packing line 1434 Primary product
Centrifugal separator 4796 Co-product processing whole milk feed
Microfiltration plant 32348 Co-product processing skim from centrifugal separator
Combined retentate 6987 Co-product streams from NF and RO polisher plants
Heating curd to cook 9762 Utility temperature
Hot exhaust gas from 4910 By-product fluidised bed drier
7-53

Step 14: IdentifY the matching products between flowsheets (linear flowsheet and the
new co-product processing flowsheets). Check for energy, water, time and
environmental integration opportunities.
It was decided to produce WPC powder from the new combined co-product stream (NF
RO polisher retentate). The process flowsheet developed for this case study consists of
a ultrafiltration plant (the diafiltration), evaporator and drier producing a powder
product. A low solids permeate steam that contains primarily lactose and minerals is
also produced (see Appendix B for details). This flowsheet was developed by following
Steps 1-12 of the design methodology described in this chapter initially.
In Step 13 a match was identified, for the recovery of water from the permeate stream
for diafiltration to the ultrafiltration plant. Consequently, NF and RO polisher plants
were added to the flowsheet to facilitate side stream integration. NF treatment followed
by RO polishing would produce sufficient water to supply all WPC UP diafiltration
requirements, with sufficient left to replace remaining potable water required for curd
washing. Retentate streams from the NF and RO polisher plants should be combined as
a single co-product stream. The NF plant and RO polisher are relatively well time
integrated with WPC UF, although additional supplementary water may be required at
start-up until a permeate stream is available from the RO polisher. However the RO
and casein washing processes are less likely to be consistently time integrated, so it is
recommended that the remaining permeate be sent to a silo, and used as required.
Storage of this water would allow it be used for other purposes as required, such as CIPs
of the casein and WPC plants. A second match was identified in Step 13 for the WPC
flowsheet, involving recovery of heat from the evaporator to the NF and RO polisher
plants. However an energy balance showed that the condensate could only supply 6%
of the energy required to preheat the feed to the NF plant (Appendix B). Therefore, this
match was discarded as being impractical. The final process flowsheet is shown in
Figure 7-45.
7-54
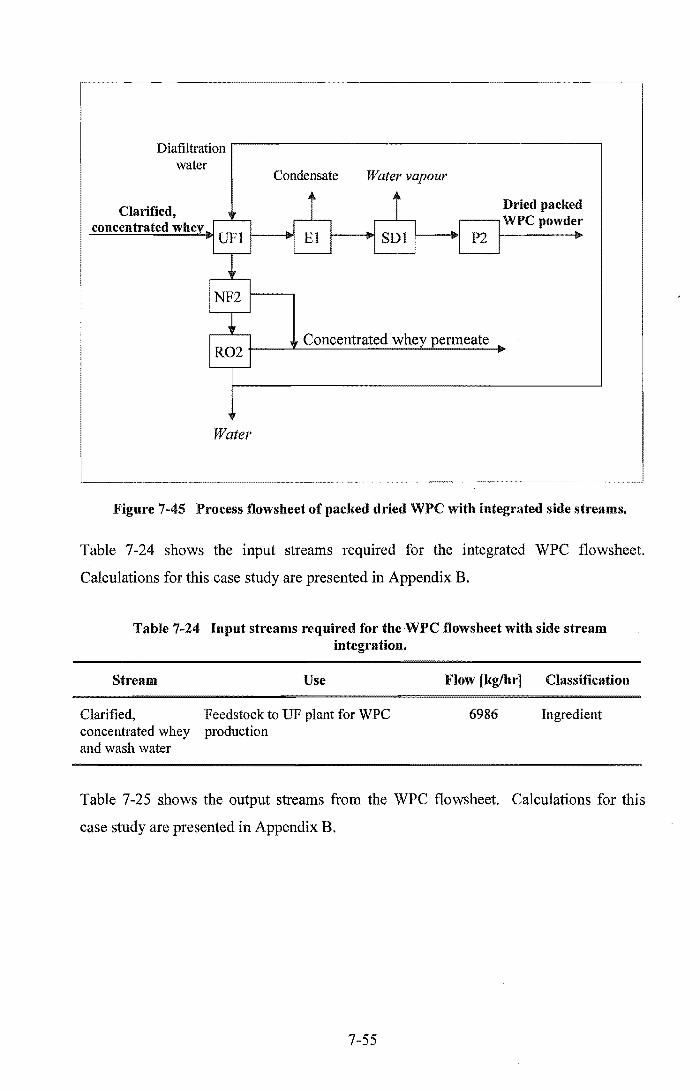
Diafiltration water
Clarified, concentrated whe
Water
Condensate Water vapour
Concentrated whey permeate
Dried packed WPCpowder
Figure 7-45 Process flowsheet of packed dried WPC with integrated side streams.
Table 7-24 shows the input streams required for the integrated WPC flowsheet.
Calculations for this case study are presented in Appendix B.
Table 7-24 Input streams required for the WPC flowsheet with side stream integration.
Stream Use Flow (kg/hr] Classification
Clarified, Feedstock to UF plant for WPC 6986 Ingredient concentrated whey production and wash water
Table 7-25 shows the output streams from the WPC flowsheet. Calculations for this
case study are presented in Appendix B.
7-55

Table 7-25 Output streams from the WPC flowsheet with side stream integration.
Stream Description Source Flow Classification [kg/hr]
Whey protein Packed WPC powder Packing line 166 Co-product concentrate
Concentrated Medium solids stream Combined retentate 3309 Co-product whey permeate containing mainly streams from NF and
lactose and minerals RO polisher plants processing WPC UF permeate
Demineralised Clean water with very Permeate from RO 3850 Co-product water low minerals content polisher processing NF
retentate
Evaporator Water condensate with Evaporator processing 266 Utility condensate no solids ultrafiltration plant
retentate
Water vapour Water vapour Hot exhaust gas from 233 By-product spray drier
Step 15: If the co-product cannot be processed due to the capacity problem, it may be
necessary to identify the proximity matching product between sites.
NF and RO extraction of water from the ultrafiltration permeate stream means that the
co-product derived from WPC production is now a medium solids stream that is high in
lactose and minerals. Such a stream can be further processed to recover lactose. In this
case study, it is assumed that a nearby site has sufficient spare capacity in an existing
lactose plant to process the concentrated permeate stream. Liquid volumes have already
been reduced by the NF and RO polisher plants, so the concentrated WPC permeate can
be transported without need for further processing.
The fmal, integrated process flowsheet for casein and WPC production is shown in
Figure 7-46. Supporting mass balance calculations are presented in Appendix B.
7-56
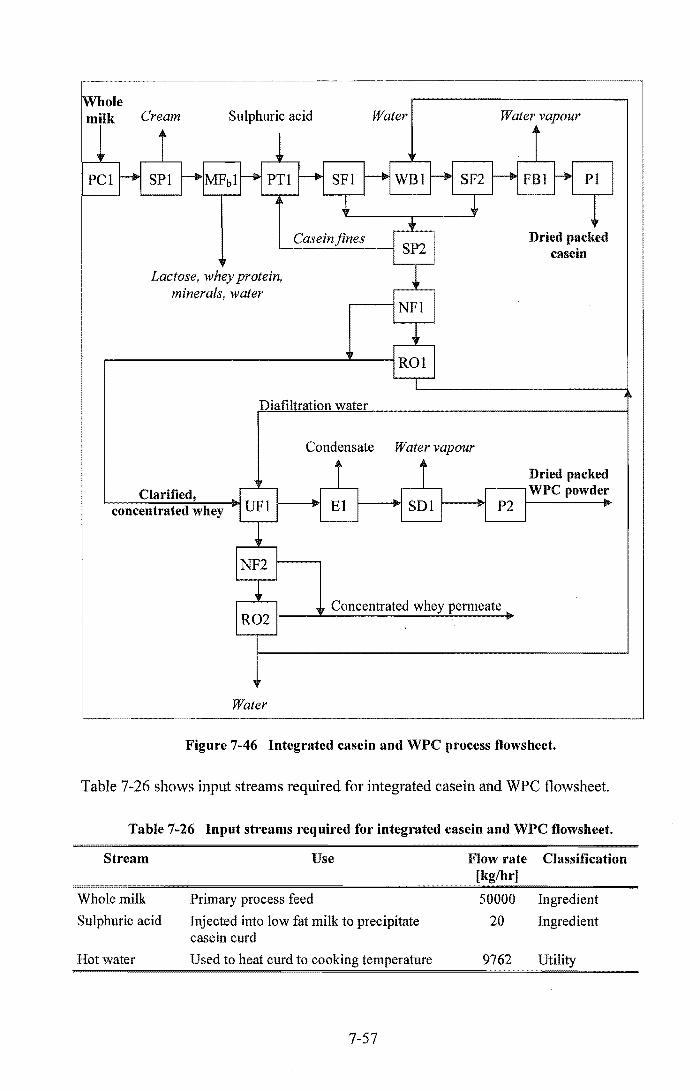
Whole milk Cream Sulphuric acid
Lactose, whey protein, minerals, water
Cas ein fines
Water Water vapour
casein
Condensate Water vapour
Clarified, concentrated whey
Dried packed ,..---,WPC powder
Concentrated whey permeate
Water
Figure 7-46 Integrated casein and WPC process flowsheet.
Table 7-26 shows input streams required for integrated casein and WPC flow sheet
Table 7-26 Input streams required for integrated casein and WPC flowsheet.
Stream
Whole milk
Sulphuric acid
Hot water
Use
Primary process feed
Injected into low fat milk to precipitate casein curd
Used to heat curd to cooking temperature
7-57
Flow rate Classification [kg/hr]
50000 Ingredient
20 Ingredient
9762

Table 7-27 shows output streams from the integrated casein and WPC flowsheet.
Table 7-27 Output streams from the integrated casein and WPC flowsheet.
Stream
Casein
Cream
Skim milk permeate
Whey protein concentrate
Concentrated whey permeate
Warm water
Demineralised water
Evaporator condensate
Water vapour
Water vapour
Description
Packed casein powder
High solids stream. Primarily fat, with small amounts of casein, whey protein, lactose and minerals.
Low solids stream. Contains lactose, whey protein and minerals.
Packed WPC powder
Medium solids stream containing mainly lactose and minerals
Clean, warm utility water
Clean water with very low minerals content
Water condensate with no solids
Water vapour
Water vapour
Source
Packing line
Centrifugal separator processing whole milk feed
Microfiltration plant processing skim from centrifugal separator
Packing line
Combined retentate streams from NF and RO polisher plants processing WPC UF permeate
Heating curd to cook temperature
Permeate from RO polisher processing NF retentate
Evaporator processing ultrafiltration plant retentate
Hot exhaust gas from fluidised bed casein drier
Hot exhaust gas from WPC spray drier
Flow [kg/hr]
1434
4796
Classification
Primary product
Co-product
32348 Co-product
166 Co-product
3309 Co-product
9762 Utility
2558 Co-product
266 Utility
4910 By-product
233 By-product
Casein production is a relatively complex design task, requmng several processing
steps, and generating multiple co-product streams as a result. The conceptual design
methodology provided a means to systematically generate and assess a variety of flow
sheet alternatives. The final flowsheet generated by the design methodology was highly
integrated, achieving an extensive amount of water recovery. The design tool provided
a means to systematically identify and select integration options within and between
process flowsheets.
7-58
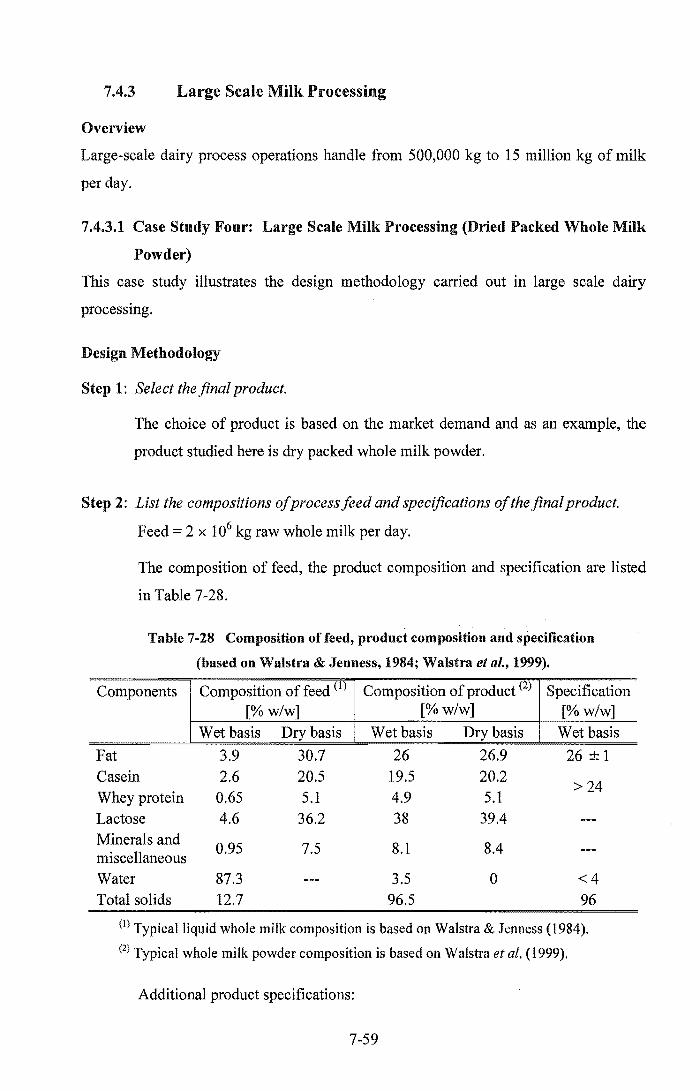
7.4.3 Large Scale Milk Processing
Overview
Large-scale dairy process operations handle from 500,000 kg to 15 million kg of milk
per day.
7.4.3.1 Case Study Four: Large Scale Milk Processing (Dried Packed Whole Milk
Powder)
This case study illustrates the design methodology carried out in large scale dairy
processing.
Design Methodology
Step 1: Select the final product.
The choice of product is based on the market demand and as an example, the
product studied here is dry packed whole milk powder.
Step 2: List the compositions of process feed and specifications of the final product.
Feed = 2 x 10⁶ kg raw whole milk per day.
The composition of feed, the product composition and specification are listed
in Table 7-28.
Table 7-28 Composition offeed, product composition and specification
(based on Walstra & Jenness, 1984; Walstra et al., 1999).
Components Composition of feed (1)
[% w/w] Wet basis Dry basis
Fat 3.9 30.7 Casein 2.6 20.5 Whey protein 0.65 5.1 Lactose 4.6 36.2 Minerals and
0.95 7.5 miscellaneous Water 87.3 Total solids 12.7
Composition of product (2)
[%w/w]
Wet basis Dry basis
26 26.9 19.5 20.2 4.9 5.1 38 39.4
8.1 8.4
3.5 0 96.5
Specification [% w/w]
Wet basis
26 ± 1
>24
<4 96
(I) Typical liquid whole milk composition is based on Walstra & Jenness (1984).
(2) Typical whole milk powder composition is based on Walstra et al. (1999).
Additional product specifications:
7-59

• The product needs to be flowable powder
• The product needs to dissolve and/or rehydrate easily
Step 3: Calculate the mass flow offeed and product.
Mass flow of feed = 2 x 10⁶ kg raw whole milk per day
% total solids in feed Mass flow of product = Mass flow of feed x --------
% total solids in product
=2x10⁶ k Ida x 12.7% g y 96.5%
= 263,212 kg/day of dry milk powder
If 1 day = 24 production hours,
mass flow of product = 10,967 kg hr- I of dry milk powder
~ 11 t hr- I of dry milk powder
(7-3)
Step 4: Compare the product composition with the feed to determine enrichment and/or
depletion of components.
Table 7-29 shows, from componept calculations, that apart from water, fat is
another component to be removed. On the other hand, lactose and minerals
should be emiched. A detailed component mass balance can be found in
Appendix C.
Table 7-29 The addition and removal of components.
Component Emichment Depletion [kg hr-I] [kg hr-I]
Fat 361
Casein 0
Whey protein 0
Lactose 389
Minerals and miscellaneous 108
Water 72361
7-60
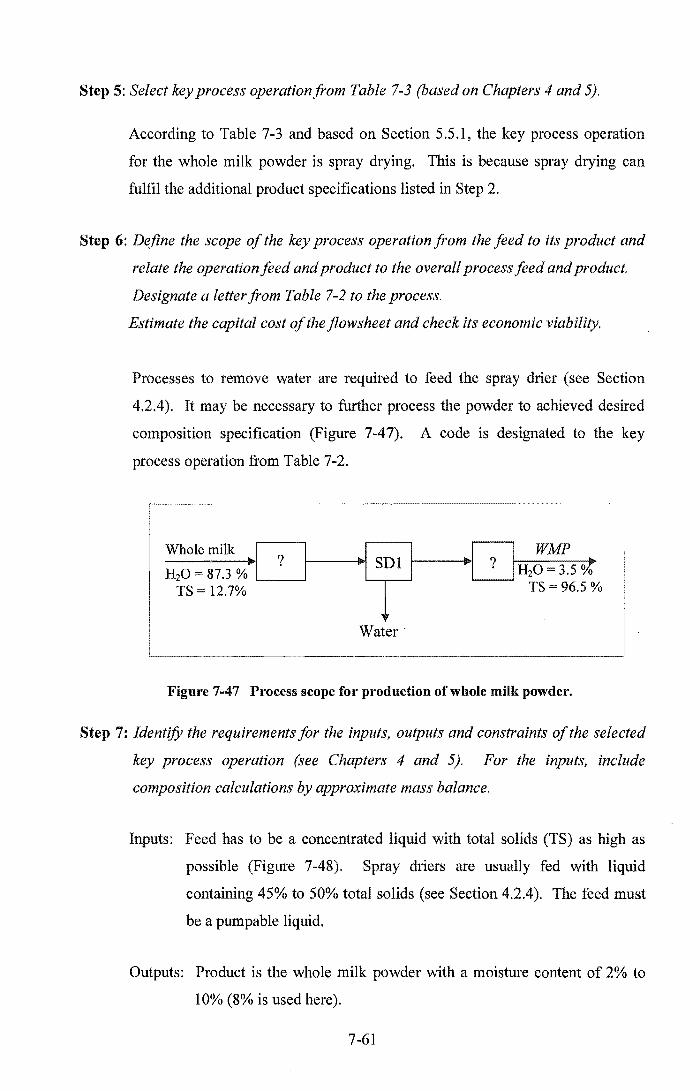
Step 5: Select key process operationfrom Table 7-3 (based on Chapters 4 and 5).
According to Table 7-3 and based on Section 5.5.1, the key process operation
for the whole milk powder is spray drying. This is because spray drying can
fulfil the additional product specifications listed in Step 2.
Step 6: Define the scope of the key process operation from the feed to its product and
relate the operation feed and product to the overall process feed and product.
Designate a letter from Table 7-2 to the process.
Estimate the capital cost of the flowsheet and check its economic viability.
Processes to remove water are required to feed the spray drier (see Section
4.2.4). It may be necessary to further process the powder to achieved desired
composition specification (Figure 7-47). A code is designated to the key
process operation from Table 7-2.
Whole milk
H20 = 87.3 % '---_---' TS 12.7%
Water'
WMP ?
Figure 7-47 Process scope for production of whole milk powder.
Step 7: Identify the requirements for the inputs, outputs and constraints of the selected
key process operation (see Chapters 4 and 5). For the inputs, include
composition calculations by approximate mass balance.
Inputs: Feed has to be a concentrated liquid with total solids (TS) as high as
possible (Figure 7-48). Spray driers are usually fed with liquid
containing 45% to 50% total solids (see Section 4.2.4). The feed must
be a pumpable liquid.
Outputs: Product is the whole milk powder with a moisture content of 2% to
10% (8% is used here).
7-61

milk (2xl06 - X) kg/day WMP
? H20 = 8% ? H20 = = 87.3% H20 = 50%
TS 12.7% TS = 50% TS 92% TS
X kg/day H20 = 100% Water TS=O%
Figure 7-48 Input and outputs composition to key process.
The amount of water that must be removed prior to spray drying, (X in Figure 7-48) is
computed to be 1.492 x 10⁶ kg/day.
Step 8: Downstream processes:
(This is a recursive step). It will potentially give many different flowsheets with
a combination of operations.
For each current flowsheet, do the following:
If the last operation in the flowsheet does not produce the overall process
product:
Find all operations that can process feeds the same as the current
flowsheet product. For each of these:
If the new operation isfeasible:
• Give it an identification.
• Add it to the flowsheet under consideration and then add
the flowsheet to the set of possible flowsheets.
• Calculate the component and overall mass flows for the
main product and side products.
\\) Itemise utilities/ejjluents/timing.
\\) Estimate the capital cost of the flowsheet and check its
economic viability.
\\) Call this step recursively.
The first list of considerations contains the immediate processes after the key process
operation. From Table 7-2, there are four options for taking the solid product from the
spray drier and these are shown in Table 7-30.
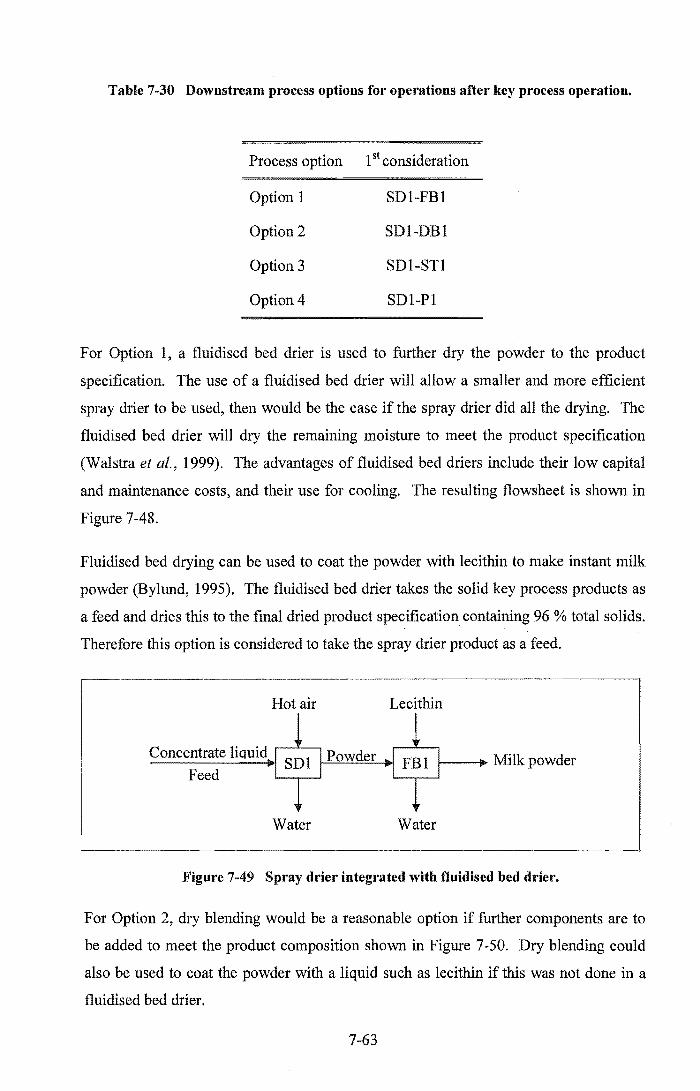
Table 7-30 Downstream process options for operations after key process operation.
Process option 1 st consideration
Option 1 SDI-FBI
Option 2 SDI-DBI
Option 3 SD1-STI
Option 4 SDI-Pl
For Option 1, a fluidised bed drier is used to further dry the powder to the product
specification. The use of a fluidised bed drier will allow a smaller and more efficient
spray drier to be used, then would be the case if the spray drier did all the drying. The
fluidised bed drier will dry the remaining moisture to meet the product specification
(Walstra et al., 1999). The advantages of fluidised bed driers include their low capital
and maintenance costs, and their use for cooling. The resulting flowsheet is shown in
Figure 7-48.
Fluidised bed drying can be used to coat the powder with lecithin to make instant milk
powder (Bylund, 1995). The fluidised bed drier takes the solid key process products as
a feed and dries this to the final dried product specification containing 96 % total solids.
Therefore this option is considered to take the spray drier product as a feed.
Concentrate liquid
Feed
Hot air
Water
Lecithin
1-_" Milk .... r"~TrI"' ..
Water
Figure 7-49 Spray drier integrated with fluidised bed drier.
For Option 2, dry blending would be a reasonable option if further components are to
be added to meet the product composition shown in Figure 7-50. Dry blending could
also be used to coat the powder with a liquid such as lecithin if this was not done in a
fluidised bed drier.
7-63

Table 7-29 shows that whole milk powder needs lactose enrichment. Lactose
enrichment can be achieved by dry blending (DB) of lactose and other ingredients such
as minerals, skim milk powder or whole milk powder can be also added at this point.
L t ac ose
Minerals
WMP
SMP
Powder Concentrate liquid" SD1 I Powder DB1 I
Feed I I Product
Figure 7-50 Spray drier integrated with dry blending.
Option 3, which considers direct storage of the product from the spray drying Figure 7-
51. This would allow accumulation of powder for subsequent blending or packaging
but the product might be too hot for storage.
Concentrate liquid 1
Feed -- SD1 1---+1--1 ST1 1------+.. Powder
product
Figure 7-51 Storage integrated between spray drier and dry blending.
For Option 4, the product cannot be packed directly from the spray drier (Figure 7-52).
As the product is too hot and may bum. Additional cooling by a conveying process (FB)
would be required for this option to be considered.
Figure 7-52 Spray drier integrated with packing.
7-64

Some of the possible process options derived from these immediate processes are listed
in Table 7-31. This table shows a large number of possible alternatives. From all the
available options, the most feasible ones are indicated with an asterisk (*). The options
not considered further in this case study are indicated with strikeout. The Option
considered not sensible are indicated with (/\). Of these alternatives, the first choices are
Options 1, fluidised bed dried (FB) and Option 2, dry blending (DB). These will be
further considered.
Table 7-31 Possible downstream processes of the key process operation.
Process option 1 st Consideration 2nd Consideration
Option 1 SDI-FBI * SDI-FBI-DBI *
Option 2
Option 3
Option 4
SDI-DBI *
SDI-FBI-Pl*
SDI-FD1-STI
SDI-DBI-FBI
SDI-DBI-STI
3rd Consideration
SDI-FBI-DB1-STl
SDI-FBI-DBI-Pl *
SDI-DBI-FBI-STI
SDI-DBI-FBI-PI
SDI-DBI-STI-FBt"
SDI-DBl-STI-Pl
The fluidised bed drier can be used prior to adding lactose into a dry blending as shown
in Figure 7-53.
Concentrate Ii Feed
Lactose
Dry WMP
Figure 7-53 Production of the final product specification.
7-65

At this stage, the product composition has been met. Packing is required because the
product specification is dry packed whole milk powder as shown in Figure 7-54.
Lactose ------,
Concentrate 1 SDI 1 Powder 1 FBI 1 WMP .1 1 Dry 1 PI 1 Dry Packed Liquid feed "I 1 1 1 ·1 DBI 1 WMP 1 1 WMP
Figure 7-54 Dry blending integrated with packing to the required final product.
Table 7-32 summarises the utilities and emissions related to the key process operation;
the code is given in Table 7-1.
Table 7-32 Utilities and emission requirements.
Code Utilities required Code Emissions
st steam Condensate
el electricity
pw 15°C pw
ha 150°C - 250 °C rna
ca 15°C
cleaning agents cleaning agents
Step 9: Upstream processes:
(This is a recursive step). It will potentially give many different flowsheets
with a combination of operations.
For each current flowsheet, do the following:
If the first operation in the flowsheet is not fed by the overall process feed:
Find all operations that can produce the feed for the current flow sheet.
For each of these:
7-66

If the new operation isfeasible:
CD Give it an identification.
CD Add it to the flowsheet under consideration and then add
the flowsheet to the set of possible flowsheets.
CD Calculate the component and overall mass flows for the
main product and side products.
CD Itemise utilities/effluents/timing.
.. Estimate the capital cost of the flow sheet and check its
economic viability.
• Call this step recursively.
Spray driers are fed with liquid of 45% to 50% total solids content (see Section 4.2.4).
There are various alternatives to produce milk concentrate. They are selected from
Table 7-2 and shown here in Table 7-33.
Table 7-33 Water separation processes producing concentrate liquid.
Process option 1 st Consideration
Option 1 MFbl-SDI
Option 2 UFI-SDI
Option 3 NFI-SDI
Option 4 ROI-SDI
Option 5 WBI-SDI
Option 6 EI-SDI
From Table 7-33, the unit operations that concentrate liquid feed are examined in each
option. These are then combined and further alternatives explored.
For Option 1 (Figure 7-55), tight microfiltration concentrates liquid by filtering out
water, lactose, minerals and whey up to 13% total solids content (see Section 4.2.1.2).
The concentrate is unlikely to meet the composition specification so this alternative is
rejected.
7-67

Milk 12.7% TS
MF Permeate
Lactose, minerals and whey protein
Figure 7-55 Microfiltration integrated with spray drier.
For Option 2 (Figure 7-56), ultrafiltration also concentrates liquid up to a maximum of
30% total solids (see Section 4.2.1.2). Again, the composition is unlikely to meet the
specification as the lactose will be depleted and therefore this option is rejected.
Milk 12.7% TS :1 ? if----II>Ii UF1 i 30%
UF Permeate
Water, minerals
Figure 7-56 Ultrafiltratio,n integrated with spray drier.
For Option 3 (Figure 7-57) nanofiltration concentrates the liquid to about 25% total
solids (see Section 4.2.1.2). Both the low total solids level and mineral depletion make
this process unsuitable here.
Milk 12.7% ~I ? 11--_-.tJ NFl I 25% I II I
NF Permeate
Minerals, water
Figure 7-57 Nanofiltration. integrated with spray drier.
7-68
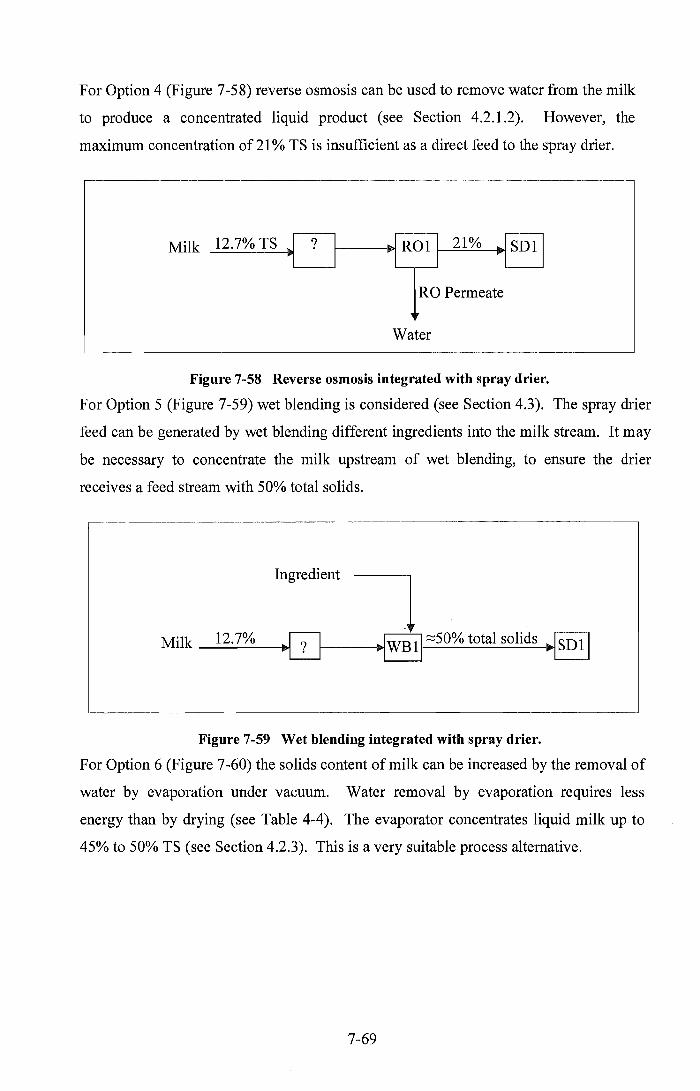
For Option 4 (Figure 7-58) reverse osmosis can be used to remove water from the milk
to produce a concentrated liquid product (see Section 4.2.1.2). However, the
maximum concentration of 21 % TS is insufficient as a direct feed to the spray drier.
Milk 12.7% TS
RO Permeate
Water
Figure 7-58 Reverse osmosis integrated with spray drier.
For Option 5 (Figure 7-59) wet blending is considered (see Section 4.3). The spray drier
feed can be generated by wet blending different ingredients into the milk stream. It may
be necessary to concentrate the milk upstream of wet blending, to ensure the drier
receives a feed stream with 50% total solids.
~---------------------------------------------------------------,
Ingredient 1 Milk _1_2_.7_%_-IM~~ ~~ ~50% total solids ~~
Figure 7-59 Wet blending integrated with spray drier.
For Option 6 (Figure 7-60) the solids content of milk can be increased by the removal of
water by evaporation under vacuum. Water removal by evaporation requires less
energy than by drying (see Table 4-4). The evaporator concentrates liquid milk up to
45% to 50% TS (see Section 4.2.3). This is a very suitable process alternative.
7-69

Milk 12.7% 50% total solids
Condensate
Figure 7-60 Evaporation integrated with spray drier.
Table 7-34 summarises the alternatives from which Options 5 and 6 are the only two
that seem feasible. Options 1 to 4 are rejected since they are unable to achieve a drier
feed stream with 50% total solids.
Table 7-34 Identification of upstream alternatives to produce feed into the key process operation.
Option
Option 1
Option 2
Option 3
Option 4
Option 5
Option 6
Supplies that
concentrate liquids
MF
UF
NF
RO
WB
E
Product
TS%
13
30
25
21
50
50
Water Removal
tIhr.
1.9
48
41
32.9
62.1
Feed to key process operation
No
No
No
No
Yes
Yes
Option 5 offers the ability to manipulate the product composition, but requires a feed
stream with elevated total solids concentration. Option 6 offers a suitable means to
generate a concentrated milk stream. Therefore, both Option 5 and 6 are selected to
jointly generate the drier feed stream, as shown in Figure 7-61.
7-70
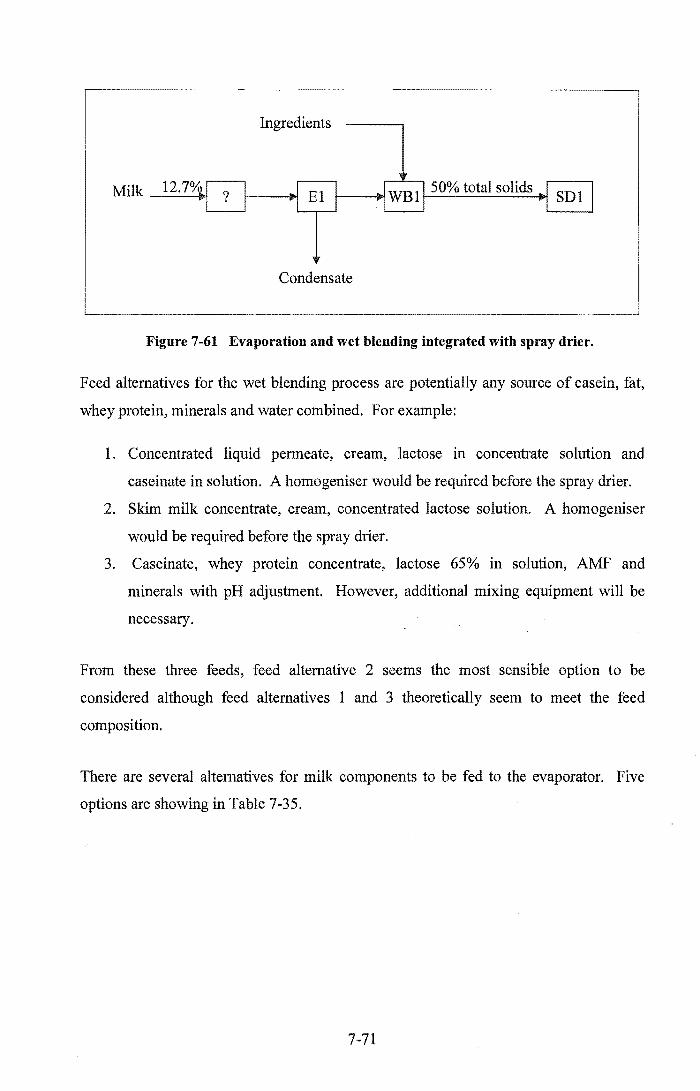
Milk --~
Ingredients
Condensate
Figure 7-61 Evaporatiou and wet blending integrated with spray drier.
Feed alternatives for the wet blending process are potentially any source of casein, fat,
whey protein, minerals and water combined. For example:
1. Concentrated liquid permeate, cream, lactose in concentrate solution and
caseinate in solution. A homogeniser would be required before the spray drier.
2. Skim milk concentrate, cream, concentrated lactose solution. A homogeniser
would be required before the spray drier.
3. Caseinate, whey protein concentrate, lactose 65% in solution, AMP and
minerals with pH adjustment. However, additional mixing equipment will be
necessary.
From these three feeds, feed alternative 2 seems the most sensible option to be
considered although feed alternatives 1 and 3 theoretically seem to meet the feed
composition.
There are several alternatives for milk components to be fed to the evaporator. Five
options are showing in Table 7-35.
7-71

Table 7-35 Possible feed options to evaporation process.
From process 1 st 2nd 3rd
Option Six Consideration Consideration Consideration
Option 1 MFI El-WBI-SDI MFI-EI-WBI-SDI
Option 2 UFI El-WBI-SDI UFI-EI-WBI-SDl
Option 3 NFl El-WBI-SDl NFI-EI-WB l-SDI
Option 4 ROI El-WBI-SDI ROI-EI-WBI-SDI *
Option 5 SPI EI-WBl-SDl SPI-EI-WBI-SDI *
For Option 1 (Figure 7-62), microfiltration can be used to remove fat and micro
organisms. This options is rejected because microfiltration also depletes whey protein,
lactose and minerals that are required for the product.
Milk
12.7% TS
Ingredients
Retentate
Micro-organisms, fat, whey protein, lactose, minerals, water
Figure 7-62 Microfiltration of evaporator feed prior to wet blending and spray drying,
For Option 2 (Figure 7-63), ultrafiltration can be used to concentrate a liquid milk up to
30% TS. It will produce milk rich in proteins, but depleted in lactose and minerals that
are needed for the product. Therefore, this option is rejected.
7-72
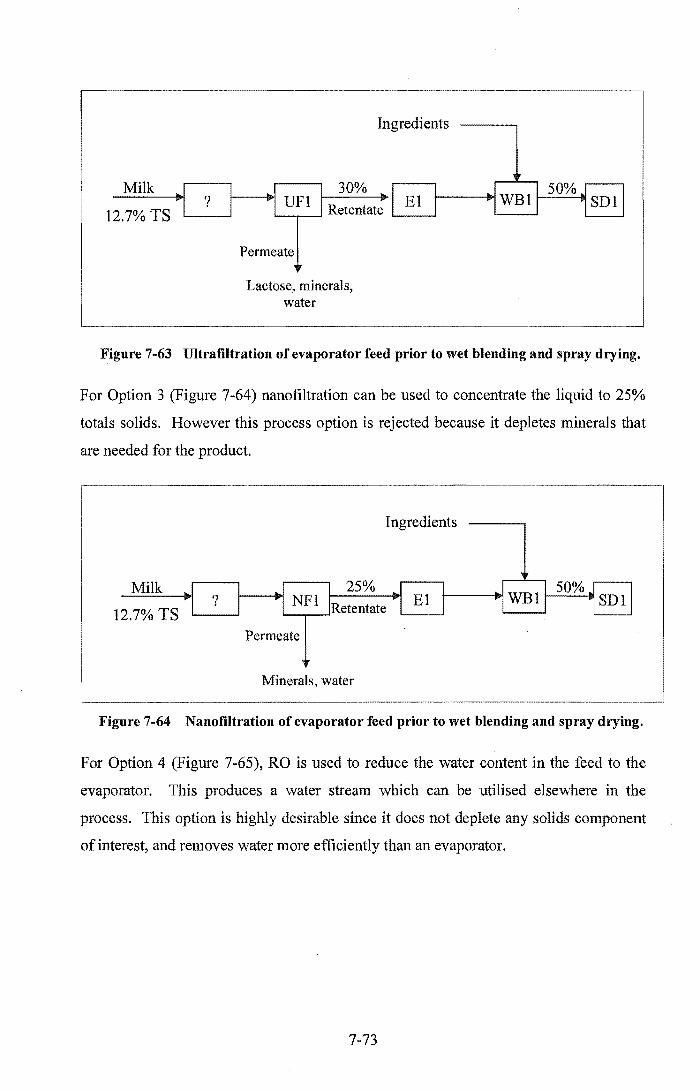
Milk
12.7% TS
Permeate
Lactose, minerals, water
Ingredients
Figure 7-63 Ultrafiltration of evaporator feed prior to wet blending and spray drying.
For Option 3 (Figure 7-64) nanofiItration can be used to concentrate the liquid to 25%
totals solids. However this process option is rejected because it depletes minerals that
are needed for the product.
Milk
12.7% TS Permeate
Minerals, water
Figure 7-64 Nanofiltration of evaporator feed prior to wet blending and spray drying.
For Option 4 (Figure 7-65), RO is used to reduce the water content in the feed to the
evaporator. This produces a water stream which can be utilised elsewhere in the
process. This option is highly desirable since it does not deplete any solids component
of interest, and removes water more efficiently than an evaporator.
7-73

Ingredients
Milk
12.7% TS Permeate
Water
Figure 7-65 Reverse osmosis of evaporator feed prior to wet blending and spray drying.
For Option 5 (Figure 7-66), a centrifugal separator is used to remove fat from the whole
milk feed. This is desirable, since fat depletion is necessary to achieve the desired
product specification (Table 7-29). The separator may either process a small proportion
of the whole milk (since only as small amount of fat depletion is required), or process
all whole milk feed with subsequent wet blending of cream to achieve the desired
product composition.
Ingredients
Milk
12.7% TS
(A) stream
Fat
Milk
12.7% TS
(B)
Figure 7-66 Centrifugal separator generating skim feed to evaporator (A) or depleted fat feed to evaporator (B), prior to wet blending and spray drying.
7-74

Both Options 4 and 5 are desirable. Option 5 is necessary, to achieve the required fat
depletion. Centrifugal separation of the entire whole milk stream (Figure 7-66B)
reduces the liquid volume passing through the evaporator. Fat can be wet blended back
onto the evaporator concentrate prior to the spray drier. Fat can either be supplied using
cream or AMF ingredient. Given the availability of cream this is chosen as the prefer
ingredient. Option 4 further reduces the liquid volume passing through the evaporator
by raising the evaporator feed solids concentration. Food safety and longer shelf life
demand that milk flowsheets should also include pathogen control (see Sections 4.1 and
4.8). The final, linear process flowsheet including pathogen control is shown in Figure
7-67.
Whole milk Cream
Permeate Condensate Water vapour
Lactose
Water vapour
Packed WMP
Figure 7-67 Final linear flowsheet of packed dried whole milk powder.
Step 10: Check for each side products from the linear flowsheet. Classify them as co
products, by-products and waste products (see Section 3.3).
Table 7-36 shows the input streams required for the milk powder flowsheet developed
in Step 9. Calculations for this case study are presented in Appendix C.
Stream
Whole milk
Lactose powder
Table 7-36 Input streams for the milk powder flowsheet.
Use
Primary process feed
Dry blended into dry powder from fluidised bed drier to attain desired product composition
7-75
Flow [kg/hr] Classification
83333 Ingredient
700 Ingredient

Table 7-37 shows the output streams from the milk powder flowsheet developed in
Step 9. Calculations for this case study are presented in Appendix C.
Table 7-37 Output streams from the milk powder tlowsheet.
Stream Description Source Flow [kglhr] Classification
Whole milk Packed whole milk Packing line 11028 Primary product
powder powder
Cream High solids stream. Centrifugal 955 Co-product Primarily fat, with separator small amounts of processing casein, whey whole milk feed protein, lactose
and minerals.
Evaporator Water condensate Evaporator 24759 Utility
condensate with no solids processing skim RO retentate
RO permeate Clean water Skim RO plant 37677 Co~product
containing very low feeding evaporator concentrations of minerals
Water vapour Water vapour Hot exhaust gas 9081 By-product from spray drier
Water vapour Water vapour Hot exhaust gas 505 By-product from fluidised bed drier .
Step 11: If it is a co-product, treat it as a new feed to the further processing and repeat
the design methodology from Step 1.
There are two possible co-product streams produced by the proposed milk powder
flowsheet shown in Figure 7-67, and summarised in Tables 7-36 & 7-37. Cream is a
co-product that has immediate value without any further processing; it may be sent. to
another factory on site, or on-sold to another processor. In this case study it is assumed
that cream is sent to another factory for processing. RO permeate cannot be
manufactured into a saleable dairy product, but is still considered to be a valuable co
product since it can be used in place of potable water.
7-76
Step 12: If it is a by-product or waste product, look for opportunities 10 off-set cost of
discharging otherwise determine a suitable treatment for its disposal.
The only by-product identified in Table 7-37 is water vapour from the spray and
fluidised driers. Discharging this does not have any associated costs.
Step 13: Identify the matching streams within the flowsheet. Consider products and
equipment constraints. Check for energy, water, time and environmental
integration opportunities.
The RO permeate stream (Table 7-37) is not formally matched within the flowsheet,
however this water is valuable, and will be used within the process, most likely for CIPs
(see Section 6.3.5).
Step 14: Identify the matching product between flowsheets (linear flowsheet and the
new co-product processing flowsheets). Check for energy, water, time and
environmental integration opportunities.
With no co-products selected for further processing in this case study, there are no other
flowsheets to integrate with. Had the cream co-product been further processed,
integration with an AMF or butter process may .have been necessary. Because milk
powder production is primarily based on water removal, milk powder plants tend to be
stand-alone processes.
Step 15: If the co-product cannot be processed due to the capacity problem, it may be
necessary to identify the proximity matching product between sites.
Not applicable for this case study.
Application of the conceptual design methodology to large scale milk powder
production produced an innovative flowsheet that is substantially different to 'typical'
milk powder plants. This case study illustrated the ability of the methodology to
systematically generate and assess a variety of flowsheet options. This tool ultimately
developed a novel but feasible flowsheet that satisfied the specified product and
production requirements.
7-77

8 Conclusions
This thesis aimed to develop a conceptual methodology for the design of dairy
processes so as to enable design information for a designer's innovative design in
dairy processing. Analysis of design methodologies published in literature has
demonstrated that dairy process design is very different from others, particularly the
petrochemical industry. Dairy process design deserves a unique methodology since
none of the existing standard design methods are applicable.
There are notable differences between dairy processes and traditional chemical
engineering processes. Solid and liquid separations and mixing are commonly used in
dairy industry while in traditional chemical industry, reactors are the main unit
operation.
In addition, dairy processes are different because of the raw material push, the
perishable nature of milk and food safety. Product recycling is limited by many
constraints and there are large changes in milk supply volumes throughput during the
season. It was necessary to explore the main uses of milk in the industry to determine
the process characteristics of the products together with the constraints imposed on
the design. For this reason, the development of schematic flowsheets in each product
was useful.
It was found that each product has a key process that cannot be avoided in the process
flowsheet. This key process concept provides the starting point of a large number of
potential design alternatives.
When reviewing current dairy processes it was found that the principles of operation
normally discussed in textbooks could not be used immediately for design. For each
operation a different design point of view was required to show essential design
information including objectives and constraints.
8-1

It was found that large scale dairy processes have more opportunities for integration
and more product alternatives than small scale dairy processing. These characteristics
play a significant role in determining the numerous opportunities for integration
which improve recovery and or recycle of several streams and water conservation.
Simplified examples of integration have been identified, between and within
processes in the same site and between sites.
This analysis was used to develop a new conceptual design methodology tailored
specifically to dairy processes. The methodology provides a mean for selecting
preferred flowsheeting options.
The methodology includes the possibility of generating partial solutions means by
reducing and creating sets of processes downstream and upstream of the key process,
thus minimising the number of options that have to be managed. The design
methodology presents a synthesis technique for generating design alternative
flowsheets upstream and downstream from the key process operation.
The methodology integrates the idea of screening unit operations VIa feed and
products requirements and additional information of product specifications.
Screening is an important enhancement of the technique for design dairy processes
synthesis problem, which are often characterised by a large number of milk
components and a wide selection of unit operations. The design analysis reduces the
size of the design space and options for enhancing the diversity of the flowsheet are
generated.
It has been shown that a methodology can be constructed that is suitable for a range of
scales, that encourages lateral innovative thoughts. The conceptual design
methodology developed was tested for a variety of scales and products in four case
studies. Case studies were used to illustrate the application of this methodology to
different situations. The methodology was successfully applied to small, medium and
large scale sites. From the case studies it was found that there are strong similarities
between different dairy processes. These tests suggest that the design methodology
developed here describes well the procedure to design dairy processes.
8-2

The method proposed in this thesis allows a chemical engineer to design a dairy
process industry. This methodology is applicable to a chemical process in the early
stages of process design for which some knowledge of anticipated chemical
engineering background is needed. The methodology also allows the chemical
process engineer to measure the performance of different alternatives at different
scales and produce designs which minimise the effluents and increase the product
yield thus maximizing the plant operation and therefore giving the highest return to
the farmers/shareholders. The steps of the methodology are general enough for
application beyond the case studies presented. The methodology provides basic
insight into potential process integration options for product, co-product, energy,
water, time and the environment.
From the generalised process descriptions and schematics, it was possible to generate
a number of potential flowsheet alternatives for the case studies.
The benefit of this methodology is the creativity arising from the use of a "top down"
approach and the availability of a wide range of alternatives. These advantages prove
the methodology to be an extremely valuable tool to an engineer when designing
dairy processes.
Recommended Future Work
From the investigation presented in this thesis, it is believed that this methodology can
be further improved by refining the economic analysis. It is also highly desirable to
incorporate product selection within a flowsheet design methodology based on the
economic analysis. This can be extended to include better economic analysis that
takes into account ofthe labour, energy and utilities.
In this work, technical feasibility rather than economics was used to select the
potential designs. The real need is, when selecting the key process, that the required
capital cost should be compared with the maximum net revenue from product. When
adding a process to the key process, the accumulated capital cost must be compared.
If the total flowsheet cost exceeds the maximum capital expenditure allowed, then the
new process will be rejected. An example is demonstrated for Case Study Two. It
must be noted that cost is a rejection criteria and it is not a selection (ranking) criteria.
8-3
Incorporating the energy and water integration methodology of French (2003) into
this conceptual methodology is advisable to enhance the completeness of the
integration opportunities. The scope can be enlarged to include other integrations
such as the time integration and component integration.
The time integration to be included in the methodology is expected to involve the
optimisation of plant utilisation throughput through the season.
The component integration can be further studied by considering the composition
variations through the season.
This methodology has the potential to be translated into an engineering design
software tool. This effort is expected to quicken the ftltering of design alternatives
and increase the accessibility of this methodology to more process design engineers.
F or this reason, it is recommended that further work be focussed in this area.
8-4
9 References:
Abe H, Saito H, Miyakawa H, Tamura Y, Shimamura S, Nagao E & Tomita M (1991),
Heat stability ofbobine lactoferrin at acidic pH. Journal of Dairy Science, 74, 65-
71.
Ahmed S H, Saxena V, Mozaffar Z & Miranda Q R (1998), Sequential separation of
whey proteins and formulations theory. United States Patent 5,756,680.
AI-Tahiri R (1987), Recombined and reconstituted milk products-Review. New Zealand
Journal of Dairy Science and Technology, 22, 1-23.
Andres L J, Riera F A & Alvarez R (1995), Skimmed milk demineralization by
electrodialysis: conventional versus selective membranes. Journal of Food
Engineering, 26,57-66.
Archer R H (1998), Whey products. In Chemical Processes in New Zealand (Packer J
E, Robertson J & Wansbrough H, eds.), Volume one, III-Dairy-G-Whey Products-
1 to III-Dairy-G-Whey Products 5. New Zealand Institute of Chemistry,
Auckland, New Zealand.
Arthur D Little Inc. (2001), Making EHS an Integral Part of Process Design. American
Institute of Chemical Engineers, New York, USA.
Ayers J S, Elgar D F & Pritchard M (2003), Method of separating and recovering
proteins from a protein solution. United States Patent 6,528,622.
Bachmann M R (1981), Technology appropriate to food preservation in developing
countries. In Developments in Food Preservation-l (Thorne S, ed.), 1-37. Applied
Science Publishers, London, UK.
9-1

Bagajewicz M J, Rivas M & Savelski M J (2000), A robust method to obtain optimal
and sub-optimal design and retrofit solutions of water utilization systems with
multiple contaminants in process plants. Computers and Chemical Engineering,
24, 1461-1466.
Balannec B, Gesan-Guiziou G, Chaufer B, Rabiller-Baudry M & Daufin G (2002)
Treatment of dairy process waters by membrane operations for water reuse and
milk constituents concentration. Desalination, 147(1-3), 89-94.
Barnett J W, Bamford T J H & Matthews A J (1997), Water minimisation and re-use in
the New Zealand dairy industry. In New Zealand Water and Wastes Association
(NZWWA) Annual Conference, Rotorua, 86-89.
Baya V & Leifer L J (1996), Understanding information management in conceptual
design. In Analysing Design Activity (Cross N, Christians H & Dorst K, eds.), 151-
168. John Wiley & Sons, Inc., USA.
Bes-Pia A, Mendoza-Roca J A, Alcaina-Miranda M I, Iborra-Clar A & Iborra-Clar M I,
(2002), Reuse of wastewater of the textile industry after its treatment with a
combination of physico-chemical treatment and membrane technologies.
Desalination, 149, 169-174.
Biegler L T, Grossmann I E & Westerberg A W (1997), Systematic Methods of
Chemical Process Design, Prentice Hall, Inc., New Jersey, USA.
Bloore C G (2001), Dairy industry trends. 6th World Congress of Chemical Engineering,
Melbourne, Australia, 23-27 September 2001.
Bohn M & Davis S H (1993), Thermocapillary breakdown of falling liquid films at high
Reynolds numbers. International Journal of Heat and Mass Transfer, 7, 1875-
1881.
Bolto B A & Pawlowski L (1987), Waste Water Treatment by Ion Exchange, J. W.
Arrowsmith Ltd., Bristol, Great Britain.
9-2
Buchanan K & Patterson M (2002), Food bugs feel the pressure of new technology. The
Chemical Engineer, January 2002, (727), 20-22.
Bylund G (1995), Dairy Processing Handbook. Tetra Pak Processing Systems AB,
Lund, Sweden.
Callanan T (1991), Recovery of milk constituents in cheesemaking (Relation to process
control). In Factors Affecting the Yield of Cheese. 48-52. International Dairy
Federation, Brussels, Belgium.
Cant P A E, Palfreyman K R, Boston G D & Mac Gibbon A K H (1998), Milk fat
products. In Chemical Processes in New Zealand (packer J E, Robertson J &
Wansbrough H, eds.), Volume one, III-Dairy-B-Milkfat-l to III-Dairy-B-Milkfat
11. New Zealand Institute of Chemistry, Auckland, New Zealand.
Carlsson A, Franck P & Berntsson T (1993), Design better heat exchanger network
retrofits. Energy transfer conversion, Chemical Engineering Progress, 89(3), 87-
96.
Chandan R C (1997), Dairy-Based Ingredients, Eagan Press Handbook Series, St. Paul,
Minnesota, USA.
Chapman H R (1981), Standardisation of milk and milk products. Journal of the Society
of Dairy Technology, 34(4), 147-152.
Coulson J M, Richardson J F, Backhurst J R & Harker J H (2002), Coulson &
Richardson's Chemical Engineering-Particle Technology and Separation
Processes. vol. 2, Butterworth Heinemann, Great Britain.
Crapiste G H & Rotstein E (1997), Design and performance evaluation of dryers. In
Handbook of Food Engineering Practice (Valentas K J, Rotstein E & Singh P R,
eds.), 125-252. CRC Press, USA.
9-3
Cruver J E & Jhawar M (1980), New improvements in ultraviolet sterilization of
desalted and reuse water. Desalination, 32, 365-371.
Dairy Management Inc. (2000), Advanced whey ingredient technologies, Innovations in
dairy, Dairy Management Inc., 1-5, May 2000.
Daufin G, Escudier J P, Carrere H, Berot S, Fillaudeau L & Decloux M (2001), Recent
and emerging applications of membrane processes in the food and dairy industry.
Trans IChemE, 79, Part C, 89-102.
de Lataillade J, (2003), New tools for the production of lactose and demineralized whey
powders: a selection of recent breakthroughs in Ion Exchange and
Chromatography applications for the dairy industry. In The joint conference of
New Zealand Institute for Food Science and Technology (NFIFST) and Dairy
Industry Association of New Zealand (DIANZ), Rotorua, June 2003, New Zealand.
de Witt J N & Klarenbeek (1983), Effects of various heat treatments on structure and
solubility of whey protein. Journal of Dairy Science, 67(11), 2701-2710.
Dhole V R, Ramchandani N, Tainsh R & Wasilewski M (1996), Pinch technology can
be harnessed to minimize raw-water demand and waster generation alike.
Chemical Engineering, 103, 100-103.
Dietz J D (1996), Wastewater treatment. In Environmental Engineering P.E.
Examination Guide & Handbook (King W C, ed.), 181-260. American Academy
of Environmental Engineers, USA.
Douglas J M (1988), Conceptual Design of Chemical Processes, International edition,
McGraw-Hill, Inc., Singapore.
Doyle S J & Smith R (1997), Targeting water reuse with multiple contaminants.
Transactions of Institution of Chemical Engineers, 75, (Part B), 181-189.
9-4
Dresch M, Daufin G & Chaufer B (2001), Integrated membrane regeneration process
for dairy cleaning-in-place. Separation and Purification Technology, 22-23, 181-
191.
Dresch M, Daufin G & Chaufer B (1999), Membrane processes for the recovery of
dairy cleaning-in-place solutions. Editions Scientifiques Medicales, 72(2), 245-
259.
Earle R L (1983), Unit Operations in Food Processing, Oxford: Pergamon Press Ltd.,
England, lJK.
EI-Genk M S & Saber H H (2001), Minimum thickness of a flowing down liquid film on
a vertical surface. International Journal of Heat and Mass Transfer, 44, 2809-
2825.
Escudier J L, Cottereau P, Tusel G & Le Bouar M (1989), Demineralisation and
desacidification of grape sugar must by electrodialysis. In International Technical
Conference on Membrane Separation processes, Brighton, United Kingdom 24-26
May 1989 (Green A, ed.). 291-302. BHRA (Information Services) and Springer
Verlag Publishers, UK.
Etzel M R (1995), Whey protein isolation and fractionation using ion exchangers. In
Bioseparation Processes in Foods, (Singh R K & Rizvi S S H, eds.), 389-415.
Marcel Dekker, Inc., USA.
Etzel M R (1999), Isolating beta-lactoglobulin and alpha-lactalbumin by eluting from a
cation exchanger without sodium chloride. United States Patent 5,986,063.
Eykamp W & Steen J (1987), Ultrafiltration and reverse osmosis. In Handbook of
Separation Process Technology (Rousseau R W, ed.), 826-839. John Willey &
Sons, Inc., USA.
FarraH A W (1952), Dairy Engineering, John Wiley & Sons, Inc., USA.
9-5

Feng X & Seider W D (2001), New structure and design methodology for water
networks. Industrial Engineering and Chemistry Research, 40, 6140-6146.
Field R (1996), Fundamentals of transport in dense membranes. Proceedings of
Application of Membrane Technologies, 2.1-2.8, University of Auckland, New
Zealand.
Fjaervoll A (1970), Anhydrous milk fat: manufacturing techniques and future
applications. Dairy Industries, 35, 424-428.
Fraga E S & McKinnon KIM (1994), CHiPS: A process synthesis package. Chemical
Engineers Research and Design, 72(A), May, 389-394.
French C (2003), Energy and water integration in dairy processes: a practical
methodology. M.E. Thesis. Department of Chemical and Process Engineering,
University of Canterbury, Christchurch, New Zealand.
Fryer P J (1997), Process design: heat integration. In Chemical Engineering for the
Food Industry (Fryer P J, Pyle D L & Rielly C D, eds.), 234-249. Blackie
Academic & Professional, London, UK.
Fryer P (2001), Food: molecules - processes - machines. In 6th World Congress of
Chemical Engineering, Melbourne, Australia, 23-27 September 2001.
Fox P F & McSweeney P L H (1998), Dairy Chemistry and Biochemistry, Blackie
Academic & Professional, Thomson Science, UK.
Garcia A A, Bonen M R, Ramirez-Vick J, Sadaka M & Vuppu A (1999), Bioseparation
Process Science, Blackwell Science, Inc. USA.
Garverick L (1994), Corrosion in the Petrochemical Industry, (Garverick L, ed.), ASM
International, The Materials Infonnation Society, USA.
9-6
Gavrila I S & ledema P (1996), Phenomena-driven process design, a knowledge-based
approach. Computers and Chemical Engineering, 20, Suppl., S103-S108.
Geciova J, Bury D & Jelen P (2002), Methods for disruption of microbial cells for
potential use in the dairy industry - a review. International Dairy Journal, 12(6),
541-553.
Gerrard A M (2000), Guide to Capital Cost Estimating, Institution of Chemical
Engineers (IChemE), United Kingdom.
Gesan-Guiziou G, Boyaval E & Daufin G (2002), Nanofiltration for the recovery of
caustic cleaning-in-place solutions: robustness towards large variation of
composition Desalination, 149(1-3), 127-129.
Glover F A (1986), Modification to the composition of milk. In Modern Dairy
Technology Advances in Milk Processing (Robinson R K, ed.), Volume 1, 235-
272. Elsevier Applied Science Publisher Ltd., USA.
Grandison A S & Lewis M J (1996), Separation Processes in the Food and
Biotechnology Industries: Principles and Applications, (Grandison A S and Lewis
M J, eds.), Woodhead Publishing Ltd., Cambridge England, UK.
Grant R A (1974), Protein recovery from process effluents using ion-exchange resins.
Process Biochemistry, 9(FebruarylMarch), 11-14.
Grossman I E, Halemane K P & Swaney R E (1983), Optimization strategies for
flexible chemical processes. Computers and Chemical Engineering, 7, 439-462.
Grossman I E & Kravanja Z (1995), Mixed-integer nonlinear programming techniques
for process systems engineering. Computers and Chemical Engineering, 19, S189-
S204.
9-7

Gundersen T (2002), Introduction to process integration. In, Norwegian University of
Science and Technology and SINTEF Energy Research, Trondheim, Norway,
April 2002.
Hales C (2000), Ten critical factors in the design process. ASME International
Conference Failure Prevention through Education: Getting to the Root Cause,
ASM International, Strongsville, Ohio, USA, 23-24 May 2000.
Hall C W & Hedrick T I (1971), Drying of Milk and Milk Products, The A vi Publishing
Company Inc., Westport, Connecticut, USA.
Harper W J (1992), Lactose and lactose derivatives. In Whey and Lactose Processing
(Zadow J G, ed.), 317-360. Elsevier Applied Science Publishers Ltd., New York,
USA.
Hartley D E & Murgatroyd (1964), Criteria for break-up of thin liquid layers flowing
isothermally over solid surfaces. International Journal Heat Mass Transfer, 7,
1003-1015.
Helfferich F (1962), Ion Exchange, McGraw-Hill Book Company, Inc., USA.
Herman D J, Sullivan G R & Thomas S (1985), Integration of process design,
simulation, and control systems. Chemical Engineering Research Design, 63, 373-
377.
Hernandez R J (1997), Food packaging materials, barrier properties, and selection. In
Handbook of Food Engineering Practice (Valentas K J, Rotstein E & Singh P R,
eds.), 291-360. CRC Press, USA.
Herve D (1974), Whey treatment by ion-exchange reSIns. Process Biochemistry,
9(FebruarylMarch), 16-17.
9-8
Hinrichs J & Kessler H G (1995), Thennal processing of milk -processes and equipment.
In Heat-induced Changes in Milk (Fox P F, ed.), 9-21. International Dairy
Federation, Brussels, Belgium.
Hobman P G & Elston P D (1976), Casein dewheying and dewatering screens. New
Zealand Journal of Dairy and Technology, 11, 136-137.
Hobman P G (1978), A model for predicting the water required to wash casein curd.
New Zealand Journal of Dairy Science and Technology, 13,229-235.
Hobman P G (1992), Ultrafiltration and manufacture of whey protein concentrates. In
Whey and Lactose Processing (Zadow J G, ed.), 195-231. Elsevier Science
Publishers Ltd., New York, USA.
Hoke B C & Chen C (1992), Thennocapillary breakdown of subcooled falling liquid
films. Industrial Engineering Chemistry Research, 31(3), 688-694.
Holman J P (1992), Heat Transfer, McGraw-Hill International, UK.
Holsinger V H (1997), Physical and chemical properties of lactose. In Advance Dairy
Chemistry Volume 3 (FoxP F, ed.), 1-38. Chapman & Hall, London, UK.
Homewood J T (1986), Technology for the developing countries. In Modern Dairy
Technology, (Robinson R K, ed.), volume 2, 381-429. Elsevier Applied Science
Publishers Ltd., England.
Hoppe G K & Higgins J J (1992), Demineralisation. In Whey and Lactose Processing
(Zadow J G, ed.), 91-132. Elsevier Science Publishers Ltd., New York, USA.
Horlock J H (1997), Cogeneration - Combined Heat and Power (CHP):
Thermodynamics and Economics, Krieger Publishing Company, Malabar, Florida,
USA.
9-9

Howell J A (1990), Overview of membranes. In The Membrane Alternative: Energy
Implications for Industry (Howell J A, ed.), Watt Committee on Energy report
number 21, 1-8. Elsevier Applied Science, London, England.
Howell J M (1998), Whey permeate fouling of evaporators. M.E. Thesis. Department of
Chemical and Process Engineering, University of Canterbury, Christchurch, New
Zealand.
Humphrey J L & Keller II G E (1997), Separation Process Technology, McGraw-Hill,
Inc., USA.
Hunter T J (2000), Dynamics and control of multistage membrane plants. Ph.D. Thesis.
Department of Chemical and Process Engineering, University of Canterbury,
Christchurch, New Zealand.
Hynd J (1975), The industrial production of milk proteins. Journal of the Society of
Dairy Technology, 28(4), 197-203.
International Energy Agency (1993), SINTEF Energy Research, Expert Meeting in
Berlin, 1993.
Ito H & Islam Md S (1994), Effect of dose rate on inactivation of microorganisms in
spices by electron beans and gamma-rays irradiation. Radiation Physics and
Chemistry, 43(6), 545-550.
Jackson A T (1985), Technology appropriate to food preservation in developing
countries. In Developments in Food Preservation-3 (Thome S, ed.), 95-117.
Applied Science Publishers, USA.
J aksland C & Gani R (1996), An integrated approach to process/product design and
synthesis based on properties-process relationship. Computers and Chemical
Engineering, 20, S 151-S 156.
9-10
Jebson R S & Fincham A (1994), Process Capital Cost Estimation for New Zealand,
The Chemical Engineering Group, New Zealand.
Jebson R S & Lascelles (1977), Application of heat pumps in the dairy industry. New
Zealand Journal of Dairy Science and Technology, 12, 116-122.
Jelen P (1992), Whey cheeses and beverages. In Whey and Lactose Processing (Zadow
J G, ed.), 157-194. Elsevier Science Publishers Ltd., New York, USA.
Jensen G K & Nielsen P (1982), Milk powder and recombination of milk and milk
products. Journal of Dairy Research, 49,515-544.
Jones B J (1999), Cheese process control. M.E. Thesis. Department of Chemical and
Process Engineering, University of Canterbury, Christchurch, New Zealand.
Jones H R (1974), Pollution Control in the Dairy Industry, Noyes Data Corporation,
New Jersey, USA.
Jorgensen T C (2002), Removal of ammonia from wastewater by ion exchange in the
presence of organic compounds. M.E. Thesis. Department of Chemical and
Process Engineering, University of Canterbury, Christchurch, New Zealand.
Juriaanse A C (1999), Changing pace in food science and technology: Examples from
dairy science show how descriptive knowledge can be transferred into predictive
knowledge. Trends in Food Science & Technology, 10(9), 303-306.
Kastanas P, Lewis M J & Grandison A S (1995), Design and development of a
miniature UHT plant for fouling studies and its evaluation using milk adjusted to
different pH values, goat's milk and milk permeate. Trans Institution of Chemical
Engineers, 73, Part C, 83-91.
Kaylegian K E & Lindsay R C (1995), Handbook of Milkfat Fractionation Technology
and Applications. AOCS Press, Illinois, USA.
9-11

Kemp I C (1986), Analysis of separation systems by process integration. Journal
Separation Process Technology, 7,9-23.
Kenez J D (1998), Process integration of projects to optimise capital and operating
cost. Chemeca 98 Australia, 28-30 September 1998.
Kessler H G (1981), Food Engineering and Dairy Technology, Verlag A Kessler,
Freising, Germany.
Klein E, Ward R A & Lacey R E (1987), Membrane processes - Dialysis and
electrodialisys. In Handbook of Separation Process Technology (Rousseau R W,
ed.), 954-981. John Willey & Sons, Inc., New York, USA.
Knipschildt M E (1986), Drying of milk and milk products. In Modern Dairy
Technology, Advances in Milk Processing, (Robinson R K, ed.), volume 1, 131-
234. Elsevier Applied Science Publishers Ltd., New York, USA.
Kohlbrand H T (1998), From waste treatment to pollution prevention and beyond:
opportunities for the next 20 years. In Third International Conference on
Foundations of Computer-Aided Process Operations (pekny J F & Blau G E,
eds.). AIChE Symposium Series No 320, 94, 112-125.
Korhonen H, Pihlanto-LeppaHi A, Rantamaki P & Tupasela T (1998), The functional
and biological properties of whey proteins: prospects for the development of
functional foods. Agricultural and Food Science in Finland, 7, 283-296.
Kotjabasakis E & Linnoff B (1986), Sensitivity tables for design of flexible processes
(1)-How much contingency in heat exchanger networks is cost-effective?
Chemical Engineering Research Design, 64, 197-211.
Kuwata T & Ohtomo H (1989), Method for removing beta-lactoglobulin from bovine
milk whey. United States Patent 4,834,994.
9-12

Laing D M & Fraga E S (1997), A case study on synthesis in preliminary design.
Computers and Chemical Engineering, 21, S53-S58.
Langrish TAG & Fletcher D F (2001), Spray drying of food ingredients and
applications of CFD in spray drying. Chemical Engineering and Processing, 40,
345-354.
Lenhoff A M & Morari M (1982), Design of resilient processing plants-I. Process
design under consideration of dynamic aspects. Chemical Engineering science, 37,
245-258.
Lewis M J (1986a), Advances of the heat treatment of milk. In Modern Dairy
Technology Advances In Milk Processing (Robinson R K, ed.), Volume 1, 1-50.
Elsevier Applied Science Publisher Ltd., USA.
Lewis M J (1986b), Physical properties of dairy products. In Modern Dairy Technology,
Volume 2-Advances in milk products (Robinson R K, ed.), 261-306. Elsevier
Applied Science Publishers Ltd., England.
Linnhoff B, Townsend D W, Boland D, Hewitt G F, Thomas B E A Guy A R,
Marshland R H (1994), A User Guide on Process Integration/or the Efficient Use
0/ Energy. The Institution of Chemical Engineers, Rugby, England.
Linnhoff B (1994), Use pinch analysis to knock down capital costs and emissions.
Chemical Engineering Progress, 90(8), 32-57.
Luostarinen M (1998), Integrated environmental research and networking of economy
and information in rural areas of Finland. Agricultural and Food Science in
Finland, 7, 315-328.
Luyben M L & Floudas C A (1994), Analyzing the interaction of design and control-2.
Reactor -separator -recycle system. Computers and Chemical Engineering, 18,
971-994.
9-13

Lyu T H & Mudawar I (1991), Simultaneous measurements of thickness and
temperature profile in a wavy liquid film falling freely on a heating wall.
Experimental Heat Transfer, 4, 217-233.
McCabe W L, Smith J C & Harriott P (1993), Unit Operations of Chemical
Engineering. McGraw-Hill, New York, USA.
McDonough R J (1992), Mixing For the Process Industries. Van Nostrand Reinhold,
New York, USA.
McSweeney P L H, Nursten H E & Urbach G (1997), Flavours and off-flavours in milk
and dairy products. In Advanced Dairy Chemistry Volume 3 (Fox P F, ed.), 403-
468. Chapman & Hall, London, UK.
Mahoney R R (1997), Lactose: enzymatic modification. In Advance Dairy Chemistry
Volume 3 (Fox P F, ed.), 77-125. Chapman & Hall, London, UK.
Malone M F & Iribarren 0 A (1985), Systematic procedure for bath process synthesis.
In Annual Meeting- American Institute of Chemical Engineers, 104F, Chicago,
USA.
Mann J G & Liu Y A (1999), Industrial Water Reuse and Wastewater Minimization,
McGraw-Hill, New York, USA.
Mannapperuma J D (1997), Design and performance evaluation of membrane systems.
In Handbook of Food Engineering Practice (Valentas K J, Rotstein E & Singh P
R, eds.), 167-209. CRC Press, USA.
Matthews ME (1984), Whey protein processes and products. Journal of Dairy Science,
67,2680-2692.
Michalski M C & Briard V (2003), Fat-related surface tension and wetting properties of
milk. Milk Science International, 58(1-2),26-29.
9-14
Mills A F (1999), Basic Heat and Mass Transfer. Prentice Hall Inc., New Jersey, USA.
Minton P E (1986), Handbook of Evaporation Technology, Noyes Publications, Park
Ridge, New Jersey, USA.
Morgan S W (1992), Use process integration to improve process designs and the design
process. Energy Transfer/conversion. Chemical Engineering Progress, September
1992,63-68.
Morison K R (1997a), Cheese manufacture as a separation and reaction process. Journal
of Food Engineering, 32, 179-198.
Morison K R (1997b), Developing a design methodology for ultrafiltration plants. In
Chemeca 97, Rotorua, September 1997, New Zealand.
Morison K R & She X (2003), Optimisation and graphical representation of multi-stage
membrane plants. Journal of Membrane Science, 211, 59-70.
Morr C V (1992), Whey utilization. In Whey and Lactose Processing (Zadow J G, ed.),
133-156. Elsevier Science Publishers Ltd., New York, USA.
Moyers C G Jr., Rousseau R W (1987), Crystallisation operations. In Handbook of
Separation Process Technology (Rousseau R W, ed.), 578-643. John Willey &
Sons, Inc., USA.
Mozaffar Z, Ahmed S H, Saxena V & Miranda Q R (2000), Sequential separation of
whey. United States Patent 6,096,870.
Mulder M (1996), Basic Principles of Membrane Technology, Kluwer Academic
Publishers, Dordrecht, Netherlands.
Muller L L (1971), Manufacture and uses of casein and co-precipitate. Dairy Science
Abstracts, 33(9), 659-674.
9-15

Nagl M, Westfechtel B & Schneider R (2003), Tool support for the management of
design processes in chemical engineering. Computer and Chemical Engineering,
27(2), 175-197.
National Research Council (U. S), Committee on Chemical Engineering Frontiers &
Research Needs and Opportunities (1988), Frontiers in Chemical Engineering:
Research Needs and Opportunities. National Academy Press, Washington, DC.
USA.
New Zealand Dairy Board (1996), New Zealand Dairy Industry Code of Practice 7
(NZCP 7). Pasteurisation Equipment and Instrumentation, New Zealand Dairy
Board, New Zealand.
New Zealand Institute of Chemistry (1998), Chemical Processes in New Zealand.
Volume one, (Parcker J E, Robertson J & Wansbrough H, eds.). New Zealand
Institute of Chemistry, Auckland, New Zealand.
Nicol R S, Fitzpatrick L M & Starling S E (2001), Dairy industry technology transfer.
In 6th World Congress 0/ Chemical Engineering, Melbourne, Australia, 23-27
September 2001.
Nishida N, Stephanopoulos G, Westerberg A (1981), A review of process synthesis.
American Institute o/Chemical Engineers Journal. 27(3), 321-351.
Nordmark B (2002), Processing for the future. Food technology in New Zealand,
February 2002. 37(2), 17-18.
Oakley D E & Bahu R E (1993), Computational modelling of spray dryers. Computers
and Chemical Engineering, 17(1), 493-498.
O'Brien J (1997), Reaction chemistry of lactose: non-enzymatic degradation pathways
and their significance in dairy products. In Advance Dairy Chemistry Volume 3
(Fox P F, ed.), 155-231. Chapman & Hall, London, UK.
9-16
Ogino C, Yasuda Y, Kondo A, Shimizu N & Fukuda H, (2002), Improvement of
transphosphatidylation reaction model of phospholipase D from
streptoverticillium cinnamoneum. Biochemical Engineering Journal, 10, 115-121.
Pahl G & Beitz W (1996), Engineering Design: A Systematic Approach, second ed.
(Wallace K, Blessing L & Bauert F, Translators) (Wallace K, ed.). Springer
Verlang, London.
Palmer D E (1977), High purity protein recovery. Process Biochemistry, 12(5), 24-28.
Paramalingam S, Bakker H H C & Chen H (2001), Investigation of minimum flow
conditions for milk products in falling-film evaporators. In 6th World Congress of
Chemical Engineering, Melbourne, Australia 23-27 September 2001.
Pearce R J (1992), Whey processing. In Whey and Lactose Processing (Zadow J G, ed.),
73-90. Elsevier Science Publishers Ltd., New York, USA.
Penn D G, Lopez de Bertodano M, Lykoudis P S & Beus S G (2001), Dry patch
stability of shear driven liquid films. Journal of Fluids Engineering, 123, 857-
862.
Perkins J (2001), The integration of design and control-The key to future processing
systems? In 6th World Congress of Chemical Engineering, Melbourne, Australia
23-27 September 2001.
Perkins J D (1989), Interactions between process design and process control. Plenary
paper IV, IFAC Dynamics and Control of Chemical Reactors (DYCORD +'89),
Maastricht, The Netherlands, 1989, 195-203.
Perry R H, Green D W & Maloney J 0 (1998), Perry's Chemical Engineers' Handbook,
seventh edn. McGraw-Hill, New York.
Peters M S & Timmerhaus K D (1981), Plant Design and Economics for Chemical
Engineers, McGraw-Hill International Book Company, Inc., Japan.
9-17
Phelan J A (1981), Standardisation of milk for cheesemaking at factory level. Journal of
the Society of Dairy Technology, 34(4), 152-156.
Polley G T (1993), Heat Exchanger Design and Process Integration. Heat Exchange.
The Chemical Engineer, 16-18,8 April 1993.
Polley G T (2002), Pinch technology without tears. Journal of the Association of Energy
Engineers, 99(2), 19-35.
Ponter A B, Davies G A, Ross T K & Thornley P G (1967), The influence of mass
transfer on liquid film breakdown. International Journal of Heat and Mass
Transfer, 10, 349-359.
Pyle D L (1997), Introduction to process design. In Chemical Engineeringfor the Food
Industry (Fryer P J, Pyle D L & Rielly C D, eds.), 1-62. Blackie Academic &
Professional, London, UK.
Quispe-Chavez N, Morison K R & Jordan P J (2001), Reduction of dairy atmospheric
emissions at a time of increasing production. In Sixth International Conference on
Technologies and Combustion for a Clean Environment, Porto, Portugal, 9-12
July 2001.
Ramirez-Vela A & Martin-Fernandez J (2003), Barriers for the developing and
implementation of HACCP plans: results from a Spanish regional survey, Food
Control, 14, 333-337.
Ray M S & Sneesby M G (1998), Chemical Engineering Design Project: a case study
approach (production of phthalic anhydride). Gordon and Breach Science,
Australia.
Rielly C D (1997), Mixing in food processing. In Chemical Engineering for the Food
Industry (Fryer P J, Pyle D L & Rielly C D, eds.), 383-433. Blackie Academic &
Professional, London, UK.
9-18

Rizvi S S H & Brandsma R L (2002), Microfiltration of skim milk for cheese making
and whey proteins. United States Patent 6,485,762.
Robinson R K & Tamime A Y (1986), Recent developments in yoghurt manufacture. In
Modern Dairy Technology, Volume 2-Advances in milk products (Robinson R K,
ed.), 1-34. Elsevier Applied Science Publishers Ltd., England.
Roos Y H (1997), Water in milk products. In Advanced Dairy Chemistry Volume 3 (Fox
P F, ed.), 303-346. Chapman & Hall, London, UK.
Rudd D F, Powers G J & Siirola J J (1973), Process Synthesis, International Series in
the Physical and Chemical Engineering Sciences, Prentice Hall Inc., New Jersey,
USA.
Ruthven D M (1997), Encyclopedia of Separation Technology, (Ruthven D M, ed.), vol.
2, John Wiley & Sons, Inc., New York, USA.
Sadr-kazemi N, Sharratt P N, Wall K & Borland J N (2000), Qualitative models to
support experimental programs for process innovation. AIChE Spring Meeting,
Atlanta, USA, 5-9 March 2000, Paper 49a.
Samsatli N J & Shah N (1996), Optimal integrated design of biochemical processes.
Computers and Chemical Engineering, 20, S315-S320.
Scott R, Macleod N & Members of Staff of the Chemical Engineering Department,
University of Edinburgh (1992), Process Case Studies, Institution of Chemical
Engineers, UK.
Seider W D, Seader J D & Lewin D R (1999), Process Design Principles: Synthesis,
Analysis, and Evaluation, John Wiley and Sons Inc., New York, USA.
Sharma S K, Mulvaney S J & Rizvi S S H (2000), Food Process Engineering Theory
and Laboratory Experiments, John Wiley & Sons Inc., USA.
9-19

Shaw M B (1986), Modern cheesemaking: Soft cheeses. In Modern Dairy Technology,
Volume 2-Advances in milk products (Robinson R K, ed.), 159-214. Elsevier
Applied Science Publishers Ltd., England.
She X (1998), Design and optimisation of multistage ultrafiltration plants. M.E. Thesis.
Department of Chemical and Process Engineering, University of Canterbury,
Christchurch, New Zealand.
Shigley J E & Mischke C R (2001), Mechanical Engineering Design, McGraw-Hill
Inc., New York, USA.
Short J L (1978), Prospects for the utilization of deproteinated whey in New Zealand-A
review. New Zealand Journal of Dairy Science and Technology, 13, 181-194.
Sieber R, Eberhard P & Gallmann P U (1996), Heat treatment of milk in domestic
microwave ovens. International Dairy Journal, 6(3), 231-246.
Sinnott R K (2000), Coulson & Richardson's Chemical Engineering- Chemical
Engineering Design, volume 6, (Coulson J M & Richardson J F, eds.),
Butterworth Heinemann, Great Britain.
Smith G & Patel A (1987), Step by Step through the Pinch, Energy Integration, The
Chemical Engineer, 26-31, November, 1987.
Smith J M, Van Ness H C & Abbott M M (2001), Introduction to Chemical
Engineering Thermodynamics, McGraw-Hill Inc., New York, USA.
Smith R (1995), Chemical Process Design, McGraw-Hill Inc., New York, USA.
Southward C R (1986), Utilisation of milk components: Casein. In Modern Dairy
Technology Advances In Milk Processing (Robinson R K, ed.), Volume 1, 317-
368. Elsevier Applied Science Publisher Ltd., USA.
9-20

Southward C R (1998), Casein products. In Chemical Processes in New Zealand
(Packer J E, Robertson J & Wansbrough H, eds.), Volume one, Ill-Dairy-E
Casein-l to III-Dairy-E-Casein 13. New Zealand Institute of Chemistry,
Auckland, New Zealand.
Southward C R & Walker N J (1980), The manufacture and industrial use of casein.
New Zealand Journal of Dairy Science and Technology, 15,201-217.
Spalding D B (1992), Heat exchanger theory. In Handbook of Heat Exchanger Design
(Hewitt G F, coordinating ed.), (1.1.1-1)-(1.4.3-6). Begell House Inc., UK.
Spreer E (1998), Milk and Dairy Product Technology, Marcel Dekker, New York, USA.
Stefanis S K, Livingston A G & Pistikopoulos E N (1997), Environmental impact
considerations in the optimal design and scheduling of batch processes.
Computers and Chemical Engineering, 21(10), 1073-1094.
Steffens M A, Fraga E S & Bogle I D L (1999), Multicriteria process synthesis for
generating sustainable and economic bioprocesses. Computers and Chemical
Engineering, 23, 1455-1467.
Steffens M A, Fraga E S & Bogle I D L (2000a), Synthesis of purification tags for
optimal downstream processing. Computers and Chemical Engineering, 24, 717-
720.
Steffens M A, Fraga E S & Bogle I D L (2000b), Synthesis of bioprocesses using
physical properties data. Biotechnology and Bioengineering, 68(2),218-230.
Stephenson R L & Blackburn J B, Jr., (1998), The Industrial Wastewater Systems
Handbook. Lewis Publishers, New York, USA.
Stoltze S, Mikkelsen J & Lorentzen B (1995), Waste-heat recovery in batch processes
using heat storage. Journal of Energy Resources Technology, 117,142-149.
9-21

Tamime A Y (1986), Modem cheesemaking: Hard cheeses. In Modern Dairy
technology (Robinson R K, ed.), volume 2, 35-158. Elsevier Applied Science
Publishers Ltd., England.
Thelwall LAW (1997), Lactose: chemical derivatives. In Advance Dairy Chemistry
Volume 3 (Fox P F, ed.), 39-76. Chapman & Hall, London, UK.
Thomas J M (2000), Dynamics, control and controllability of plate heat exchangers
configured for milk pasteurisation. M.E. Thesis. Department of Chemical and
Process Engineering, University of Canterbury, Christchurch, New Zealand.
Tissier J P & Lalande M (1986), Experimental device and methods for studying milk
deposit formation on heat exchange surfaces. Biotechnology Progress, 2(4), 218-
229.
Tjoe TN & LinnhoffB (1986), Using pinch technology for process retrofit. Chemical
Engineering, 93(8),47-60.
Towler C (1976), Conversion of casein curd to sodium caseinate. New Zealand Journal
of Dairy Science and Technology, 11,24-29.
Towler C (1986), Developments in cream separation and processing. In Modern Dairy
Technology Advances In Milk Processing (Robinson R K, ed.), Volume 1,51-92.
Elsevier Applied Science Publisher Ltd., USA.
Townsend D W & LinnhoffB (1983), Heat and power networks in process design. The
American Institute of Chemical Engineers Journal, 29(5), 742-749.
Trela M (1994), A semi-theoretical model of stability of vertical falling liquid films.
Chemical Engineering Science, 49(7), 1007-1013.
9-22

Trujillo A J, Capellas M, Buffa M, Royo C, Gervilla R, Felipe X, Sendra Saldo J,
Ferragut V & Guamis B (2000), Application of high pressure treatment for cheese
production. Food Research International, 33(3-4),311-316.
Trujillo A J, Capellas M, Saldo J, Gervilla R & Guamis B (2002), Applications of high
hydrostatic pressure on milk and dairy products: a review. Innovative Food
Science & Emerging Technologies, 3(4), 295-307.
Trujillo A J (2002), Applications of high-hydrostatic pressure on milk and dairy
products. High Pressure Research, Taylor & Francis Group, 22,619-626.
Tung M A & Britt I J (1995), Food material science and food process engineering: keys
to product quality and safety. Food Research International, 28(4), 101-108.
Turton R, Bailie R C, Whiting W B & Shaeiwitz J A (1998), Analysis, SyntheSiS, and
Design of Chemical Processes, Prentice Hall, Inc., New Jersey, USA.
Umeda T, Itoh J & Shiroko K (1978), Heat exchange system synthesis. Chemical
Engineering Progress, July 1978, 70-76.
University of Guelph, (2003), Dairy Science and Technology Education Series, [on line
accessed 5 December 2003] http://www.foodscLuoguelph.caldairyedulhome.html
Vamam A H & Sutherland J P (1994), Milk and Milk Products - Technology, Chemistry
and Microbiology, Chapman & Hall, London, UK.
Vickers V T (1968), The use of hot water as heating medium in a cheddar cheese
factory. New Zealand Journal of Dairy Technology, 3(1),4-9.
Vickers V T (1979), Plant design and construction. New Zealand Journal of Dairy
Science and Technology, 14,42-58.
Wagner J (2001), Membrane Filtration Handbook: Practical tips and hints, Wagner
Publishing, Denmark.
9-23

Wai P P C, Bogle I D Bagherpour K & Gani R (1996), Process synthesis and
simulation strategies for integrated biochemical process design. Computers and
Chemical Engineering, 20, S357-S362, Great Britain.
Walas S M (1990), Chemical Process Equipment: Selection and Design, Butterworth
Heinemann, Boston.
Wall K, Sharratt P N & Sadr-Kazemi N (2000), Developing chemical processes for the
21st century. American Institute of Chemical Engineers, Spring Meeting, Atlanta,
USA, 5-9 March 2000, Paper No 53d.
Walstra P & Jenness R (1984), Dairy Chemistry and Physics, John Wiley & Sons Inc.,
New York, USA.
Walstra P, Geurts T J, Noomen A, Jellema A & Van Boekel M A J S (1999), Dairy
Technology, Marcel Dekker, Inc., New York, USA.
Wang Y P & Smith R (1994), Wastewater minimisation. Chemical Engineering
Science, 49(7), 981-1006.
Wankat P C (1990), Rate-Controlled Separations, Elsevier Science Publishers Ltd.,
USA.
Westerberg A W (1999), Pursuing Process Design Insights, Sixth Annual Roger Sargent
Lecture, 6 December 1999, Imperial College, London.
Westerberg A W, Subrahmanian E, Reich Y, Konda S & the n-dim group (1997),
Designing the process design process. Computers and Chemical Engineering, 21,
Sl-S9.
White A H (1953), Reconstituting dry milks. The Australian Journal of Dairy
Technology, 8, 3-9.
9-24

Wilbey R A (1986), Production of butter and dairy-based spreads. In Modern Dairy
Technology Advances in Milk Processing (Robinson R K, ed.), Volume 1, 93-130.
Elsevier Applied Science Publisher Ltd., USA.
Williamson A G & Wallace K L (1979), Co-generation: an overview. In The New
Zealand Institution of Engineers Proceedings of Technical Groups, Annual
conference ofthe NZIE, February 1979,5(5),811-856. Wellington, New Zealand.
Winchester J (1996), Computer simulation and controllability studies of multi-module
ultrafiltration plants. M.E. Thesis. Department of Chemical and Process
Engineering, University of Canterbury, New Zealand.
Winchester J (2000), Model based analysis of the operation and control of falling film
evaporators. Ph.D. Thesis. Institute of Technology and Engineering, Massey
University, Palmerston North, New Zealand.
Woods D R (1994), Process Design and Engineering Practice, PTR Prentice Hall Inc.,
New Jersey, USA.
Zall R R (1992), Sources and composition of whey and permeate. In Whey and Lactose
Processing (Zadow J G, ed.), 1-72. Elsevier Science Publishers Ltd., New York,
USA.
Zadow J G (1986), Utilisation of milk components: Whey. In Modern Dairy
Technology Advances In Milk Processing (Robinson R K, ed.), Volume 1, 273-
316. Elsevier Applied Science Publisher Ltd., USA.
Zadow J G (1992), Lactose hydrolysis. In Whey and Lactose Processing (Zadow J G,
ed.), 361-408. Elsevier Science Publishers Ltd, New York, USA.
Zhao J Q (1999), Flow modelling of cyclones. Ph.D. Thesis. Department of Chemical
and Process Engineering, University of Canterbury, Christchurch, New Zealand.
9-25

Appendix A - Case Study Two
Small scale milk processing: Packed Cottage Cheese

Appendix A - Case study two
APPENDIX A: Case study two Small scale milk processing: Packed Cottage cheese A comparison of wet basis composition of product to raw milk feed in order to determine required component enrichment / depletion The following calculations show how the mass balance is calculated for steps 3 and 4 of the methodology Assume that 1 day = 8 production hours. Feed and product composition based on Spreer (1998) and Kessler (1981).
Overall casein yield = 95%
Raw milk (feed) Cottage cheese (Product - Feed) Mass flow [kg/d] 5000 1004.1 -3995.9 Mass flow [kg/hr] 625.0 125.5 -499.5
[% w/w] [kg/hr] [% w/w] [kg/hr] [% w/w] [kglhr] Fat 3.9 24.4 4.3 5.4 3.8 -19.0 .. Large negative value Casein 2.6 16.3 12.3 15.4 0.2 -0.8 for fat means that there Whey Protein 0.65 4.1 0.5 0.6 0.7 -3.4 are excessive amounts Lactose 4.6 28.8 2.0 2.5 5.3 -26.2 of fat in the feed stream. Minerals & miscellaneous 0.95 5.9 1.0 1.3 0.9 -4.7 An upstream process Water 87.3 545.6 78.0 97.9 89.6 -447.7 must be used Salt 0.0 0.0 ·1.9 2.4 -0.5 2.4 to generate a low-fat Coagulant 0.0 0.0 0.0 0.0 0.0 0.0 feed stream
Total Solids, TS 12.7 79.4 22.0 27.6 10.4 -51.8
Calculation steps 1) List the composition of feed 2) Determine the flowrate of each component in the feed 3) Specify the % yield of casein 4) Calculate the flowrate of casein in the product where it is = (flowrate of casein in feed) * (% yield of casein) 5) List the required composition of product 6) Calculate the total flowrate of product stream where it is = (flowrate of casein in product) I (% of casein in product) 7) Calculate the flowrate of other total solids and water in the product stream 8) Determine the difference in flowrate of each component between the product and feed Le. (Product - Feed) 9) For each component, a negative value of (Product - Feed) means that component need depletion while a positive value means enrichment 10) Determine the composition of each component in (Product - Feed)
A-1
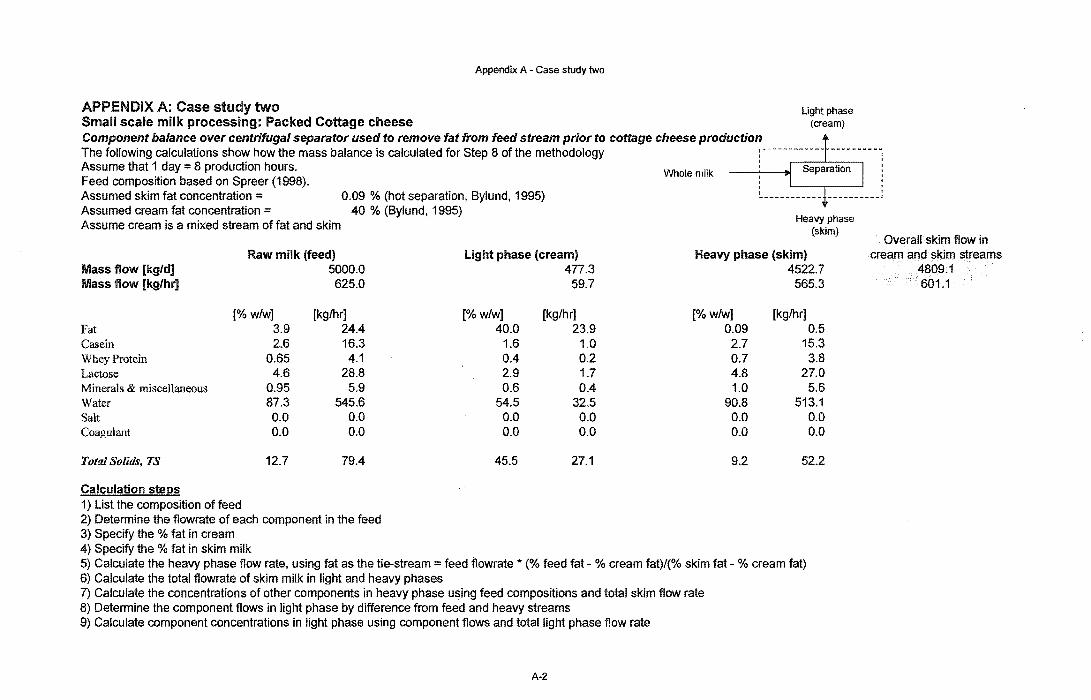
Appendix A - Case study two
APPENDIX A: Case study two Small scale milk processing: Packed Cottage cheese Component balance over centrifugal separator used to remove fat from feed stream prior to cottage cheese production The following calculations show how the mass balance is calculated for Step 8 of the methodology Assume that 1 day = 8 production hours. Feed composition based on Spreer (1998). Assumed skim fat concentration = Assumed cream fat concentration =
0.09 % (hot separation, Bylund, 1995) 40 % (Bylund, 1995)
Assume cream is a mixed stream of fat and skim
Raw milk (feed) light phase (cream) Mass flow [kg/d] 5000.0 477.3 Mass flow [kg/hr] 625.0 59.7
[% w/w] [kglhr] [%w/w] [kg/hr] Fat 3.9 24.4 40.0 23.9 Casein 2.6 16.3 1.6 1.0 Whey Protein 0.65 4.1 0.4 0.2 Lactose 4.6 28.8 2.9 1.7 Minerals & miscellaneous 0.95 5.9 0.6 0.4 Water 87.3 545.6 54.5 32.5 Salt 0.0 0.0 0.0 0.0 Coagulant 0.0 0.0 0.0 0.0
Total Solids, TS 12.7 79.4 45.5 27.1
Calculation steps 1) list the composition of feed 2) Determine the flowrate of each component in the feed 3) Specify the % fat in cream 4) Specify the % fat in skim milk
Whole milk
Heavy phase
[%w/w] 0.09 2.7 0.7 4.8 1.0
90.8 0.0 0.0
9.2
Light phase (cream)
Heavy phase (skim)
4522.7 565.3
[kglhr] 0.5
15.3 3.8
27.0 5.6
513.1 0.0 0.0
52.2
5) Calculate the heavy phase flow rate, using fat as the tie-stream = feed flowrate * (% feed fat % cream fat)/(% skim fat - % cream fat) 6) Calculate the total flowrate of skim milk in light and heavy phases 7) Calculate the concentrations of other components in heavy phase using feed compositions and total skim flow rate 8) Determine the component flows in light phase by difference from feed and heavy streams 9) Calculate component concentrations in light phase using component flows and total light phase flow rate
A-2
Overall skim flow in cream and skim streams
4809.1 601.1
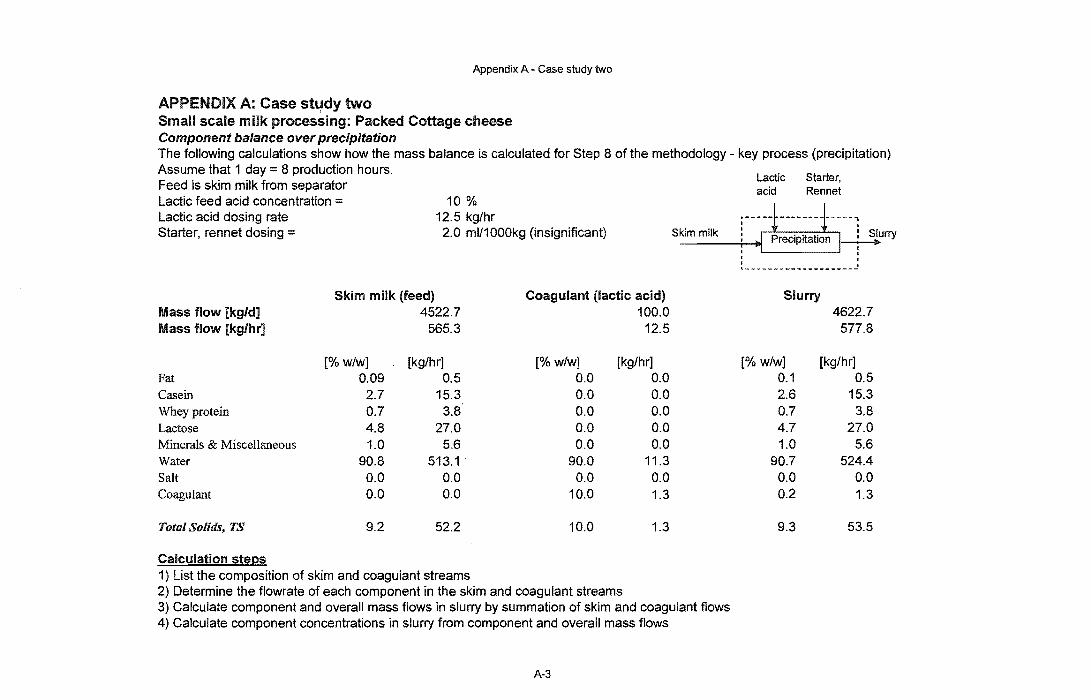
Appendix A - Case study two
APPENDIX A: Case study two Small scale milk procesSing: Packed Cottage cheese Component balance over precipitation The following calculations show how the mass balance is calculated for Step 8 of the methodology - key process (precipitation) Assume that 1 day = 8 production hours. Feed is skim milk from separator Lactic feed acid concentration = 10 %
12.5 kg/hr Lactic acid dosing rate Starter, rennet dosing = 2.0 ml/1000kg (insignificant)
Skim milk (feed) Coagulant (lactic acid) Mass flow [kg/d] 4522.7 100.0 Mass flow [kg/hr] 565.3 12.5
[% w/w] [kg/hr] [% w/w] [kg/hr] Fat 0.09 0.5 0.0 0.0 Casein 2.7 15.3 0.0 0.0 Whey protein 0.7 3.8 0.0 0.0 Lactose 4.8 27.0 0.0 0.0 Minerals & Miscellaneous 1.0 5.6 0.0 0.0 Water 90.8 513.1 90.0 11.3 Salt 0.0 0.0 0.0 0.0 Coagulant 0.0 0.0 10.0 1.3
Total Solids, TS 9.2 52.2 10.0 1.3
Calculation steps 1) List the composition of skim and coagulant streams 2) Determine the flowrate of each component in the skim and coagulant streams
Skim milk
3) Calculate component and overall mass flows in slurry by summation of skim and coagulant flows 4) Calculate component concentrations in slurry from component and overall mass flows
A-3
Lactic acid
Starter, Rennet
~ ___________________ 2
Slurry
[% w/w] 0.1 2.6 0.7 4.7 1.0
90.7 0.0 0.2
9.3
4622.7 577.8
[kg/hr] 0.5
15.3 3.8
27.0 5.6
524.4 0.0 1.3
53.5

Appendix A - Case study two
APPENDIX A: Case study two Small scale milk processing: Packed Cottage cheese Component balance over slurry filtration The following calculations show how the mass balance is calculated for Step 8 of the methodology - curd slurry filtration Assume that 1 day = 8 production hours. :-------------------Feed is cheese curd Slurry : I Filtration I Filtered curd Curd water content = 82.3 % , • jIo
Fat yield in curd = 90 % L ________ 1 ________ _
Casein yield in curd = 99 % • Whey protein yield in curd = 15 % Whey
Lactose yield in curd = 8 % Minerals yield in curd = 20 % Coagulant yield in curd = 0 %
Slurry Whey Filtered curd Mass flow [kg/d] 4622.7 3744.0 Mass flow [kg/hr] 577.8 468.00
878.7 109.8
[%w/w] [kg/hr] [%w/w] [kg/hr] [% w/w] [kg/hr] Fat 0.1 0.5 0.0 0.1 0.4 0.5 Casein 2.6 15.3 0.0 0.2 13.8 15.1
0.7 3.8 0.7 3.2 0.5 0.6 Lactose 4.7 .27.0 5.3 24.9 2.0 2.2 Minerals & Miscellaneous 1.0 5.6 1.0 4.5 1.0 1.1 Water 90.7 524.4 92.7 434.0 82.3 90.4 Salt 0.0 0.0 0.0 0.0 0.0 0.0 Coagulant 0.2 1.3 0.3 1.3 0.0 0.0
Total Solids, TS 9.3 53.5 7.3 34.0 17.7 19.4
Calculation steps 1) List the composition of slurry stream 2) Determine the flowrate of each component in the slurry stream 3) Calculate component mass flows in filtered curd from assumed yield values 4) Calculate the total mass flow rate of filtered curd using moisture as a tie-stream
= (sum all non-water component flows in filtered curd stream)/(1-% water in filtered 5) Calculate water mass flow from specified % concentration and overall mass flow of fiiltered curd 6) Calculate component and overall mass flows in whey by difference 7) Calculate % component concentrations in whey stream from mass flows
A-4

APPENDIX A: Case study two Small scale milk processing: Packed Cottage cheese Component balance over wet blending
Appendix A - Case study two
The following calculations show how the mass balance is calculated for Step 8 of the methodology - wet blending of filtered curd Assume that 1 day = 8 production hours. Cream, salt and water added to get desired product composition (based on Spreer, 1998)
Salt Cream
r------i-------i------: Filtered curd I I : Cottage cheese , Wet
Filtered curd Salt Cream (light phase) Cottage cheese Mass flow [kg/d] 878.7 19.2 99.2 997.1 Mass flow [kg/hr] 109.8 2.4 12A 124.6
[% wfw] [kg/hr] [%w/w] [kg/hr] [% wfw] [kg/hr] [% w/w] [kg/hr1 Fat OA 0.5 0.0 0.0 40.0 5.0 4.3 5A Casein 13.8 15.1 0.0 0.0 1.6 0.2 12.3 15.3 Whey protein 0.5 0.6 0.0 0.0 OA 0.1 0.5 0.6 Lactose 2.0 2.2 0.0 0.0 2.9 OA 2.0 2.5 Minerals & Miscellaneous 1.0 1.1 0.0 0.0 0.6 0.1 1.0 1.2 Water 82.3 90A 0.0 0.0 54.5 6.8 77.9 97.1 Salt 0.0 0.0 100.0. 2.4 0.0 0.0 1.9 2A Coagulant 0.0 0.0 0.0 0.0 0.0 0.0 0.0 0.0
Total Solids, TS 17.7 19A 100.0 2.4 45.5 5.6 22.0 27.5
Calculation steps 1) List the composition of filtered curd stream 2) Determine the flowrate of each component in the filtered curd stream 3) Specify component concentrations in salt and water streams 4) Use same component concentrations for skim stream as calculated in whole milk separator mass balance (A-2) 5) Estimate initial mass flow rates for salt, water and skim streams 6) Calculate the total mass flow rate of filtered curd using moisture as a tie-stream 7) Calculate component mass flows for salt, water and skim streams 8) Calculate component mass flows in final product by summation of component mass flows in ingredient streams 9) Calculate overall mass flows of final product by summation of overall mass flows in ingredient streams 10) Calculate component concentrations in final product from component mass flows and total stream flow rate 11) Refine estimated salt, water and skim stream flow rates until final product compositions equal desired values
A-5
Desired product (Spreer, 1998) (Kessler, 1981)
4.3 12.3 0.5 2.0 1.0
78.0 1.9 0.0
22.0
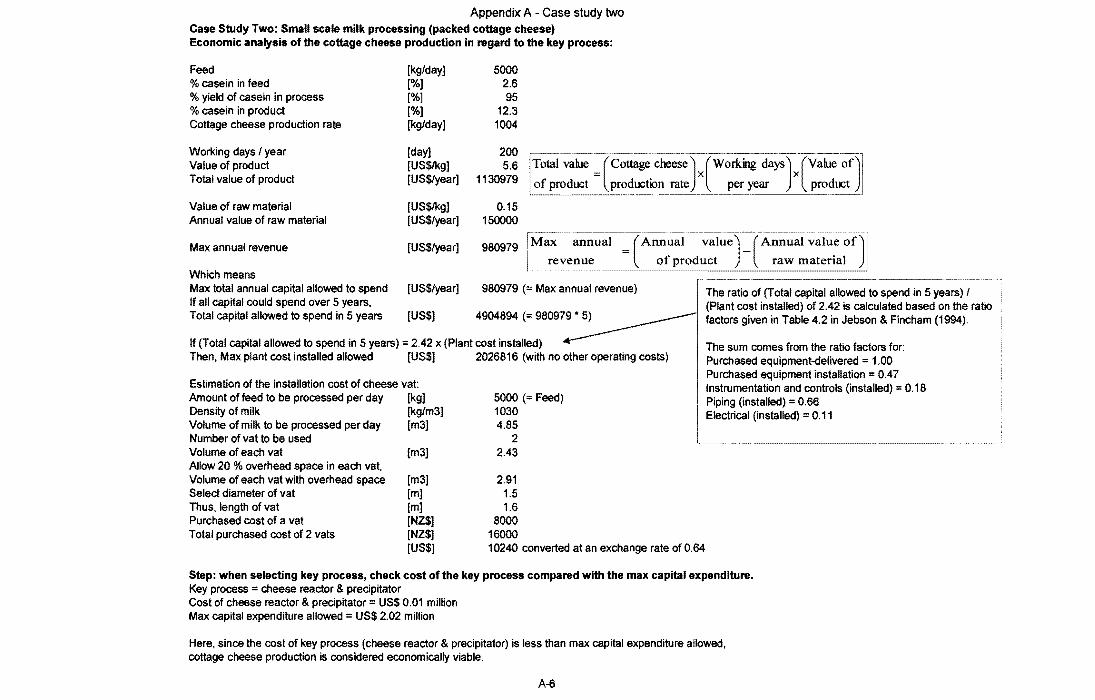
Appendix A - Case study two Case Study Two: Small scale milk processing (packed cottage cheese) Economic analysis of the cottage cheese production in regard to the key process:
Feed [kg/day] 5000 % casein in feed [%] 2.6 % yield of casein in process [%] 95 % casein in product [%] 12.3 Cottage cheese production rate [kg/day] 1004
Working days / year [day] 200 Value of product [US$lkg] 5.6 Total value of product [US$lyear] 1130979
-".-""--".-" ... "-".---.-." .. ---.. "-.-.---.-.----.--.--.... --... --""---:J-." ... ""." Total vah.re (cottage cheese) (WOrkilg days) (Vahle Of) of product = production rate x per year x product
Value of raw material [US$lkg] 0.15 Annual value of raw material [US$/year] 150000
Max annual revenue [US$/year] 980979
1,--"'-" - -._-.. --_ .. -.--... -... " ... --.. -.--".-.------.----------I Max annual = (Annual value) (Annual value
revenue of product raw material Which means Max total annual capital allowed to spend [US$/year] 980979 (= Max annual revenue) If all capital could spend over 5 years, Total capital allowed to spend in 5 years [US$] 4904894 (= 980979·5) ______
The ratio of (Total capital allowed to spend in 5 years) / (Plant cost installed) of 2.42 is calculated based on the ratio factors given in Table 4.2 in Jebson & Fincham (1994).
If (Total capital allowed to spend in 5 years) = 2.42 x (Plant cost installed) ...-------Then, Max plant cost installed allowed [US$] 2026816 (with no other operating costs)
Estimation of the installation cost of cheese vat: Amount offeed to be processed per day Density of milk Volume of milk to be processed per day Number of vat to be used Volume of each vat Allow 20 % overhead space in each vat. Volume of each vat with overhead space Select diameter of vat Thus, length of vat Purchased cost of a vat Total purchased cost of 2 vats
[kg/m3] [m3]
[m3]
[m3] [m] [m] [NZ$] [NZ$] [US$]
5000 (:::: Feed) 1030 4.85
2 2.43
2.91 1.5 1.6
8000 16000 10240 converted at an exchange rate of 0.64
The sum comes from the ratio factors for: Purchased equipment-delivered = 1.00 Purchased equipment installation:: 0.47 Instrumentation and controls (installed) :: 0.18 Piping (installed) :: 0.66 Electrical (installed) :: 0.11
Step: when selecting key process, check cost of the key process compared with the max capital expenditure. Key process = cheese reactor & precipitator Cost of cheese reactor & precipitator = US$ 0.01 million Max capital expenditure allowed = US$ 2.02 million
Here, since the cost of key process (cheese reactor & precipitator) is less than max capital expenditure allowed, cottage cheese production is considered economically viable.
A-6

Appendix A - Case study two
Case Study Two: Small scale milk processing (packed cottage cheese) Economic analysis of the cottage cheese production in regard to the depleted cream that is not wet-blended:
Out of 19 kg/h of depleted fat, 12 kg/h is wet-blended into the filtered curd. Therefore, flow rate of cream left [kg/hr) 7 Working hours per day [hr/day) 8 Thus, flow rate of cream [kg/day) 56
If the product is cream powder, Working days / year Value of product Total value of product
The raw material is cream, Value of raw material Annual value of raw material
Max annual revenue
Which means Max total annual capital allowed to spend If all capital could spend over 5 years, Total capital allowed to spend in 5 years
[day) [US$lkg) [US$/year)
[US$/kg) [US$/year)
[US$/year)
[US$/year)
[US$)
200 ~------------------- --- - ------------------ ---
3 iTotal varue = (cream powder ) x (Working daYS)x(Varue Of)
33600 : of product production rate per year product
2.5 28000 ' ..•. --------------------.-.. -----.-.-----------.--.----------.... -.-.-.-]
: Max annual = (Annual value] _ (Annual value Of]
5600! revenue of product raw material ,-----._--•• _---_.-.---_.---____ -0 __ ._.-_ .. ----------_. _____ ._ .. _____ 0 _________ ... __ , ________ 0 __________ .. ____________________ _
5600 (= Max annual revenue)
28000 (= 980979 • 5)
If (Total capital allowed to spend in 5 years) = 2.42 x (Plant cost installed) Then, Max plant cost installed allowed [US$) 11570 (with no other operating costs)
Estimation of the installation cost of freeze drier: Amount of cream to be processed [kg/day) 56 Density of cream [kg/m3) 940 Volume of cream to be processed [m3/day) 0.06
The loading of freeze drier takes place in the morning, and it is unloaded 8 hours later. Loading into freeze drier each time [m3) 0.48
I (cost of ] (internal] ((internal]]2
1
log . =4.90-0.401xlog +O.850x log 4.77 L ____ ~~:e_~: d~l=r_______ ___ ~_~I~~~___________ volume
Assume cream occupies 10% of freeze drier volume: So, freeze drier volume [m3/s) Purchased cost of freeze drier [NZ$) 104464
[US$) 66857 converted at an exchange rate of 0.64
Step: when selecting key process, check cost of the key process compared with the max capital expenditure. Key process = freeze drier Cost of freeze drier = US$ 66857 Max capital expenditure allowed = US$ 11570
Here, since the cost of key process (freeze drier) is more than max capital expenditure allowed, cream powder production is economically rejected.
A-7

Appendix B - Case Study Three
Medium scale milk processing: Packed Casein Powder

Appendix B - Case study three
APPENDIX B: Case study three Medium scale milk processing: Packed casein powder A comparison of composition of product to raw milk feed in order to determine required component enrichment / depletion The following calculations show how the mass balance is calculated for Step 4 of the methodogy Assume that 1 day = 20 production hours. Feed and product composition are taken from Bylund (1995). 1 % is lost as fines in separation Assumed casein yield = 99 %
Whole milk feed Mass flow [kg/d] 1000000 Mass flow [kg/hr] 50000
[% w/w] [kg/hr] Fat 3.9 1950 Casein 2.6 1300 Whey Protein 0.65 325 Lactose 4.6 2300 Minerals & miscellaneous 0.95 475 Water 87.3 43650 Acid 0.0 0
Total Solids, TS 12.7 6350
Calculation steps 1) list the composition of feed 2) Determine the flowrate of each component in the feed 3) Specify the % yield of casein
Depletion and/or enrichment Desired product (Product - Feed)
30282 -969718 1514 -48486
[% w/w] [kg/hr] [% w/w] [kg/hr] 1.4 21.2 4.0 -1929 ..
85.0 1287.0 0.0 -13 0.5 7.6 0.7 -317 0.1 1.5 4.7 -2298 1.5 22.7 0.9 -452
11.5 174.1 89.7 -43476 0.0 < 0.001 0.0 0
88.5 1340 10.3 -5010
4) Calculate the flowrate of casein in the product where it is = (flow rate of casein in feed) * (% yield of casein) 5) list the required composition of product 6) Calculate the total flowrate of product stream where it is = (flowrate of casein in product) I (% of casein in product) 7) Calculate the flowrate of other total solids and water in the product stream 8) Determine the difference in flowrate of each component between the product and feed i.e. (Product - Feed)
large negative value for fat means that there
. are excessive amounts of fat in the feed stream. An upstream process
must.be. used to generate a low-fat
feed stream
9) For each component. a negative value of (Product - Feed) means that component need depletion while a positive value means enrichment 10) Determine the composition of each component in (Product - Feed)
B-1
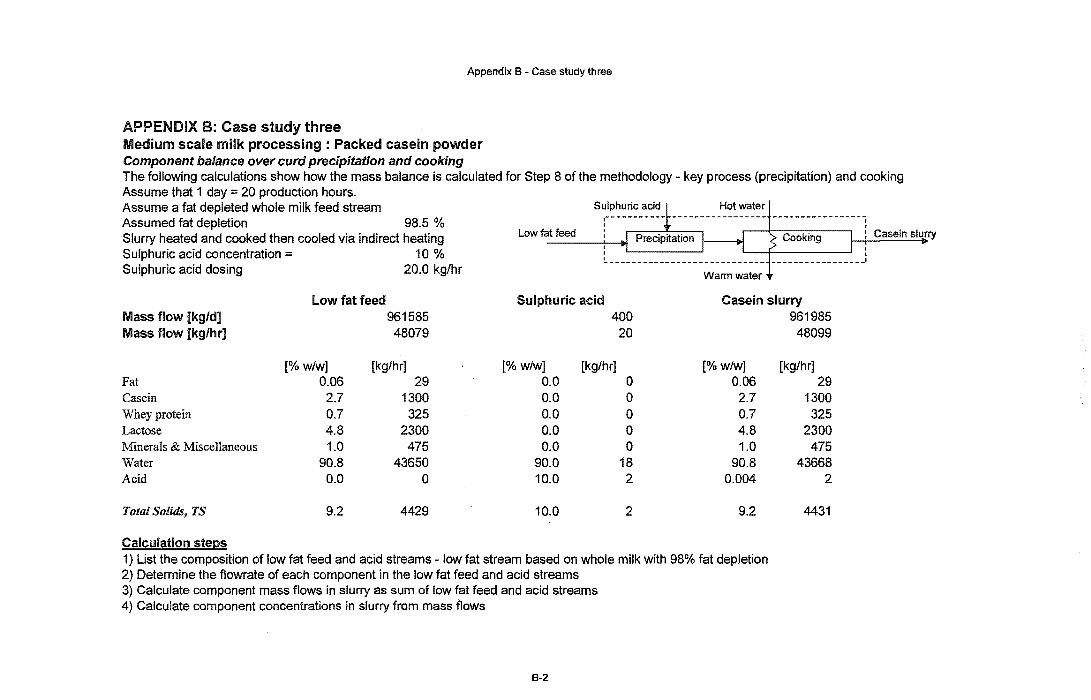
Appendix B - Case study three
APPENDIX B: Case study three Medium scale milk processing: Packed casein powder Component balance over curd precipitation and cooking The following calculations show how the mass balance is calculated for Step 8 of the methodology - key process (precipitation) and cooking Assume that 1 day = 20 production hours. Assume a fat depleted whole milk feed stream Assumed fat depletion 98.5 % Slurry heated and cooked then cooled via indirect heating Low fat feed Casein slu~rry
Sulphuric acid concentration = 10 % Sulphuric acid dosing 20.0 kg/hr
low fat feed Sulphuric acid Casein slurry Mass flow [kg/d] 961585 400 961985 Mass flow [kg/hr] 48079 20 48099
[% w/w] [kg/hr] [% w/w] [kg/hr] [%w/w] [kg/hr] Fat 0.06 29 0.0 0 0.06 29 Casein 2.7 1300 0.0 0 2.7 1300 Whey protein 0.7 325 0.0 0 0.7 325 Lactose 4.8 2300 0.0 0 4.8 2300 Minerals & Miscellaneous 1.0 475 0.0 0 1.0 475 Water 90.8 43650 90.0 18 90.8 43668 Acid 0.0 0 10.0 2 0.004 2
Total Solids, TS 9.2 4429 10.0 2 9.2 4431
Calculation steps 1) List the composition of low fat feed and acid streams - low fat stream based on whole milk with 98% fat depletion 2) Determine the flowrate of each component in the low fat feed and acid streams 3) Calculate component mass flows in slurry as sum of low fat feed and acid streams 4) Calculate component concentrations in slurry from mass flows
B-2

APPENDIX B: Case study three Medium scale milk processing : Packed casein powder Component balance over filtration of casein slurry
Appendix B - Case study three
The following calculations show how the mass balance is calculated for Step 8 of the methodology - separation of casein curd from whey Assume that 1 day = 20 production hours. Feed is casein slurry from precipitation and cooking Separated curd water content = 80 % Fat loss in whey = 25 %
Casein slurry
Casein loss in whey = 0.8 % Whey protein loss in whey = 92 % ~~a~~wh~= ~% Minerals loss in whey = 20 % Acid loss in whey 100 %
Casein slurry Whey Mass flow [kg/d] 961985 785631 Mass flow [kg/hr] 48099 39282
[% w/w] [kg/hr] [% w/w] [kg/hr] Fat 0.06 29 0.02 7 Casein 2.7 1300 0.03 10
0.7 325 0.8 299 Lactose 4.8 2300 5.7 2254 Minerals & Miscellaneous 1.0 475 0.2 95 Water 90.8 43668 93.2 36614 Acid 0.004 2 0.005 2
Total Solids, TS 9.2 4431 6.8 2668
Calculation steps 1) List the composition of casein slurry 2) Determine the flowrate of each component in the casein slurry stream
Dewheyed casein curd 176354
8818
Desired product (Bylund, 1995)
[% w/w] [kg/hr] [% w/w] 0.2 22 1.4
14.6 1290 85.0 0.3 26 0.5
r-------------------------~ I 0.5 46 0.1 I I 4.3 380 1.5 I ~---8o.0----m54-r---------n]-
0.0 a < 0.001
20.0 1764 88.5
Insufficient lactose and minerals depletion to achieve desired product composition when dried
3) Calculate component mass flows in dewheyed curd from assumed yield values for all except water 4) Calculate the total mass flow rate of dewheyed curd using water as a tie-stream
= (sum all non-water component flows in dewheyed curd stream)/(1-% water in dewheyed curdl100) 5) Calculate component concentrations in dewheyed curd stream from mass flows 6) Calculate component mass flows in whey stream by difference 7) Calculate component concentrations in whey stream from mass flows
B-3
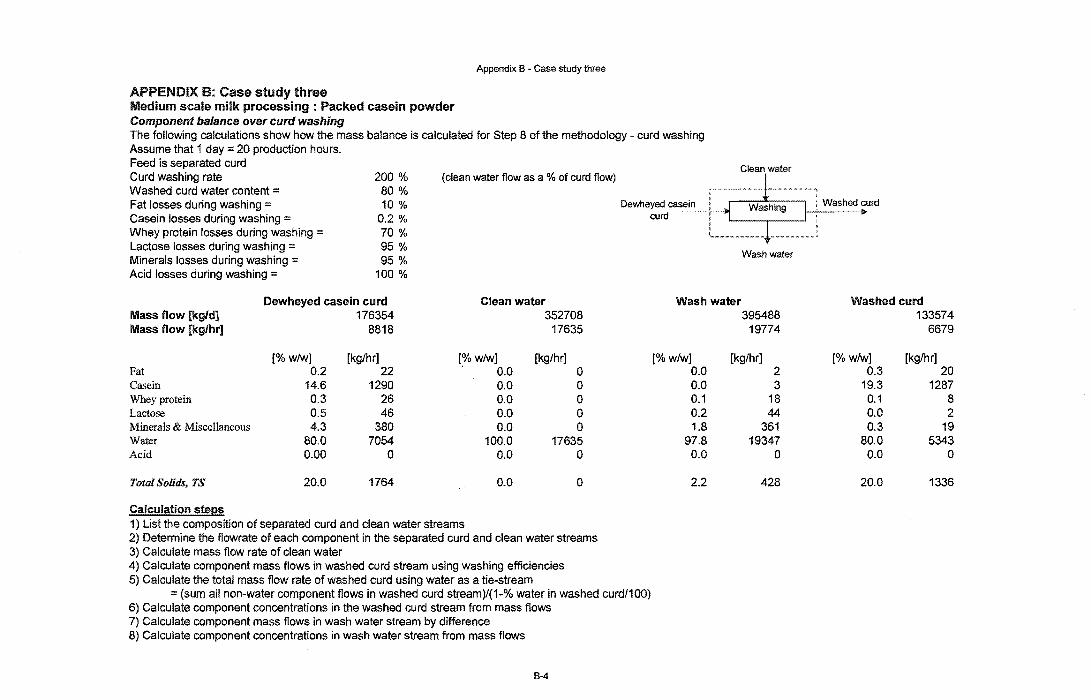
APPENDIX B: Case study three Medium scale milk processing : Packed casein powder Component balance over curd washing
Appendix B - Case study three
The following calculations show how the mass balance is calculated for Step 8 of the methodology - curd washing Assume that 1 day = 20 production hours. Feed is separated curd Curd washing rate Washed curd water content = Fat losses during washing Casein losses during washing Whey protein losses during washing = Lactose losses during washing Minerals losses during washing = Acid losses during washing =
200 % 80 % 10 %
0.2 % 70 % 95 % 95 %
100 %
(clean water flow as a % of curd flow) Clean water
Wash water
Dewheyed casein curd Clean water Wash water Mass flow [kg/d] 176354 352708 395488 Mass flow [kg/hr] 8818 17635 19774
[% wlwj [kg/hr] [%w/w] [kg/hrJ [%w/w] (kglhr] Fat 0.2 22 0.0 0 0.0 2 Casein 14.6 1290 0.0 0 0.0 3 Whey protein 0.3 26 0.0 0 0.1 18 Lactose 0.5 46 0.0 0 0.2 44 Minerals & Miscellaneous 4.3 380 0.0 0 1.8 361 Water 80.0 7054 100.0 17635 97.8 19347 Acid 0.00 0 0.0 0 0.0 0
Total Solids, TS 20.0 1764 0.0 0 2.2 428
Calculation steps 1) List the composition of separated curd and clean water streams 2) Determine the f10wrate of each component in the separated curd and clean water streams 3) Calculate mass flow rate of clean water 4) Calculate component mass flows in washed curd stream using washing efficiencies 5) Calculate the total mass flow rate of washed curd using water as a tie-stream
= (sum all non-water component flows in washed curd stream)/(1-% water in washed curdl100) 6) Calculate component concentrations in the washed curd stream from mass flows 7) Calculate component mass flows in wash water stream by difference 8) Calculate component concentrations in wash water stream from mass flows
B-4
Washed curd
Washed curd 133574
6679
[%w/w] [kg/hr] 0.3 20
19.3 1287 0.1 8 0.0 2 0.3 19
80.0 5343 0.0 0
20.0 1336
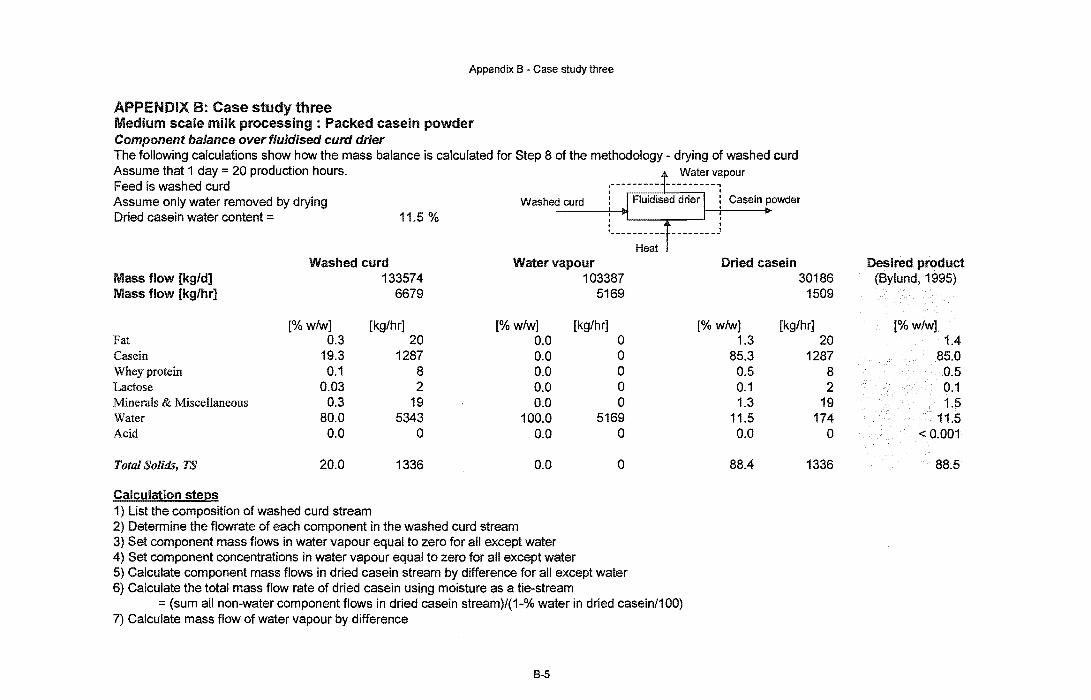
Appendix B - Case study three
APPENDIX B: Case study three Medium scale milk processing: Packed casein powder Component balance overfluidised curd drier The following calculations show how the mass balance is calculated for Step 8 of the methodology - drying of washed curd Assume that 1 day = 20 production hours. Feed is washed curd Assume only water removed by drying Dried casein water content =
Washed curd Casein powder j ..
11.5 % , , __ .... _____ 1
Heat Washed curd Water vapour
Mass flow [kg/d] 133574 103387 Mass flow [kg/hrl 6679 5169
[%wlw] [kg/hr] [% w/w] [kg/hr] Fat 0.3 20 0.0 0 Casein 19.3 1287 0.0 0 Whey protein 0.1 8 0.0 0 Lactose 0.03 2 0.0 0 Minerals & Miscellaneous 0.3 19 0.0 0 Water 80.0 5343 100.0 5169 Acid 0.0 0 0.0 0
Total Solids, TS 20.0 1336 0.0 0
Calculation steps 1} List the composition of washed curd stream 2} Determine the flowrate of each component in the washed curd stream 3} Set component mass flows in water vapour equal to zero for all except water 4) Set component concentrations in water vapour equal to zero for all except water 5) Calculate component mass flows in dried casein stream by difference for all except water 6) Calculate the total mass flow rate of dried casein using moisture as a tie-stream
= (sum all non-water component flows in dried casein stream)/(1-% water in dried casein/1 00) 7) Calculate mass flow of water vapour by difference
8-5
Dried casein 30186
1509
[% wlw] [kg/hr] 1.3 20
85.3 1287 0.5 8 0.1 2 1.3 19
11.5 174 0.0 0
88.4 1336
Desired product (Bylund, 1995)
[% w/w] 1.4
85.0 0.5 0.1 1.5
11.5 < 0.001
88.5

Appendix B - Case study three
APPENDIX B: Case study three Medium scale milk processing : Packed casein powder Component balance over centrifugal separator used to remove fat from feed stream prior to casein production The following calculations show how the mass balance is calculated for Step 9 of the methodology - centrifugal separation of whole milk feed Step 8 calculations repeated using centrifugal separation to achieve low fat feed stream Assume that 1 day = 20 production hours. Whole milk
Feed composition based on Bylund (1995). Assumed skim fat concentration = 0.07 % Assumed cream fat concentration = 40 % (Bylund, 1995) Assume cream is a mixed stream of fat and skim
Whole milk feed light phase (cream) Heavy phase (skim) Mass flow [kg/d] 1000000 95918 904082 Mass flow [kg/hr] 50000 4796 45204
[% w/w] [kg/hr] [% w/w] [kg/hr] [% w/w] [kg/hr] Fat 3.9 1950 40.0 1918 0.07 32 Casein 2.6 1300 1.6 78 2.7 1222 Whey Protein 0.65 325 0.4 19 0.7 306 Lactose 4.6 2300 2.9 138 4.8 2162 Minerals & miscellaneous 0.95 475 0.6 28 1.0 447 Water 87.3 43650 54.5 2614 90.8 41036 Acid 0.0 0 0.0 0 0.0 0
Total Solids, TS 12.7 6350 45.5 2182 9.2 4168
Calculation steps 1) List the composition of feed 2) Determine the f10wrate of each component in the feed 3) Specify the % fat in cream 4) Specify the % fat in skim milk 5) Calculate the heavy phase flow rate, using fat as the tie-stream = feed f10wrate * (% feed fat - % cream fat)/(% skim fat % cream fat) 6) Calculate the total flowrate of skim milk in light and heavy phases 7) Calculate the concentrations of other components in heavy phase using feed compositions and total skim flow rate 8) Determine the component flows in light phase by difference from feed and heavy streams 9) Calculate component concentrations in light phase using component flows and total light phase flow rate
B-6
Heavy phase (skim)
Overall skim flow in cream and skim streams
384653 48082

Appendix B - Case study three
APPENDIX 8: Case study three Medium scale milk processing: Packed casein powder Component balance over microfiltration plant used to remove lactose, minerals and whey protein from feed stream prior to casein production The following calculations show how the mass balance is calculated for Step 9 of the methodology skim milk microfiltration Step 8 calculations repeated using microfiltration to deplete lactose. minerals and whey protein prior to curd washing downstream of key process Assume that 1 day = 20 production hours. Feed is separated skim milk Retentate total solids = 15 %
100 % 100 % 50 % 20 % 20%
---------------------i ---':--..IJ Microfiltration I i II> Retentate Fat retention =
Casein retention = Whey protein retention = Lactose retention = Minerals retention =
Skim milk
Mass flow [kgJd] Mass flow [kg/hr]
Skim milk feed 904082 45204
Skim permeate 646962 32348
Fat Casein Whey Protein Lactose Minerals & miscellaneous Water Acid
Total Solids, TS
Calculation steps
[% w/w] 0.07 2.7 0.7 4.8 1.0
90.8 0.0
9.2
1) List the composition of feed
[kg/hr] 32
1222 306
2162 447
41036 o
4168
2) Determine the f10wrate of each component in the feed
[% wlw] 0.0 0.0 0.5 5.3 1.1
93.1 0.0
6.9
3) Calculate component mass flows in retentate stream using retention values 4) Calculate the total mass flow rate of retentate using water as a tie-stream
[kg/hr] o o
153 1730 357
30108 o
2240
= (sum all non-water component flows in retentate stream)/(1-% water in retentate/100) 5) Calculate component concentrations in the retentate stream from mass flows 6) Calculate component mass flows in permeate stream by difference 7) Calculate component concentrations in permeate stream from mass flows
B-7
Permeate
I ,
Skim retentate 257120 12856
[% w/w] 0.2 9.5 1.2 3.4 0.7
85.0 0.0
15.0
[kg/hr] 32
1222 153 432
89 10928
o
1928

Appendix 8 - Case study three
APPENDIX B: Case study three Medium scale milk processing: Packed casein powder Component balance over curd precipitation and cooking The following calculations show how the mass balance is calculated for Step 9 of the methodology - key process (precipitation) and cooking Step 8 calculations repeated using centrifugal separator to deplete fat, microfiltration to deplete lactose, minerals and whey protein Assume that 1 day = 20 production hours. Feed stream is skim retentate (fat, minerals, lactose and whey protein depleted)
Sulphuric acid
Slurry heated and cooked then cooled via indirect heating Sulphuric acid concentration = 10 % Skim retentate
Sulphuric acid dosing 20.0 kg/hr
Skim retentate Sulphuric acid Casein slurry Mass flow [kg/d] 257120 400 257520 Mass flow [kg/h r] 12856 20 12876
[%w/w] [kg/hr] [% w/w] [kg/hr] [%w/w] [kg/hr] Fat 0.2 32 0.0 0 0.25 32 Casein 9.5 1222 0.0 0 9.5 1222 Whey protein 1.2 153 0.0 0 1.2 153 Lactose 3.4 432 0.0 0 3.4 432 Minerals & Miscellaneous 0.7 89 0.0 0 0.7 89 Water 85.0 10928 90.0 18 85.0 10946 Acid 0.0 0 10.0 2 0.02 2
Total Solids, TS 15.0 1928 10.0 2 15.0 1930
Calculation steDs 1) List the composition of skim retentate and acid streams 2) Determine the flow rate of each component in the skim retentate and acid streams 3) Calculate component mass flows in slurry as sum of low fat feed and acid streams 4) Calculate component concentrations in slurry from mass flows
8-8
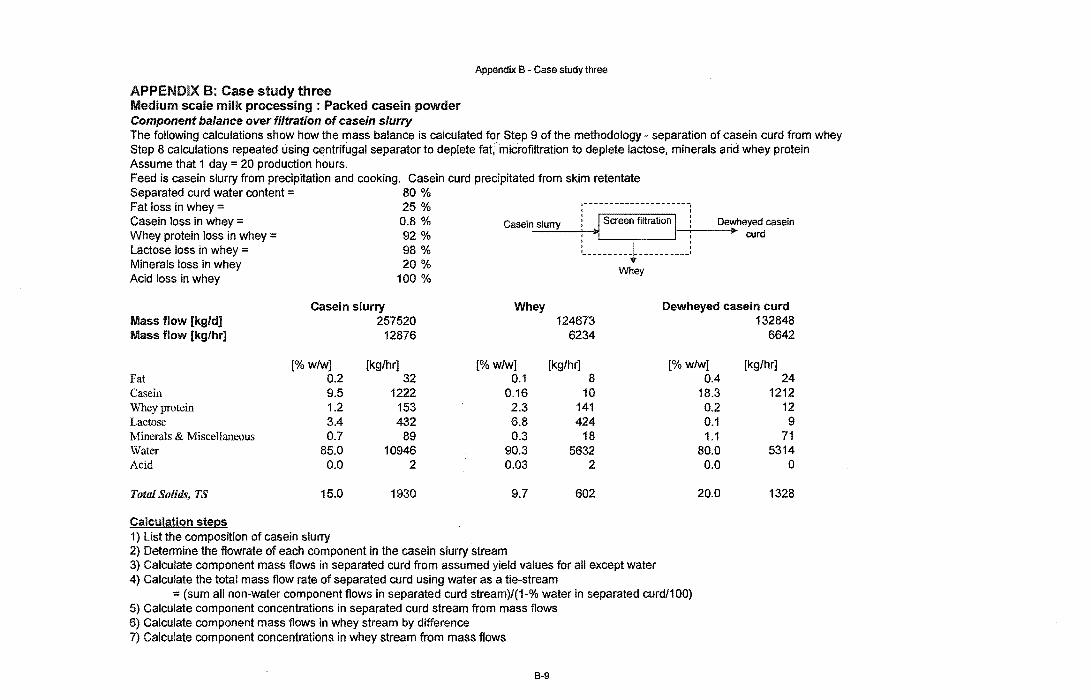
APPENDIX B: Case study three Medium scale milk processing: Packed casein powder Component balance over filtration of casein slurry
Appendix B - Case study three
The following calculations show how the mass balance is calculated for Step 9 of the methodology - separation of casein curd from whey Step 8 calculations repeated using centrifugal separator to deplete fat, microfiltration to deplete lactose, minerals and whey protein Assume that 1 day = 20 production hours. Feed is casein slurry from precipitation and cooking. Casein curd precipitated from skim retentate Separated curd water content = 80 % Fat loss in whey = 25 % I--------------------j , , Casein loss in whey = 0.8 % Whey protein loss in whey = 92 % Lactose loss in whey = 98 % ~~~~~~~ W% Acid loss in whey 100 %
Casein slurry Screen filtration ' Dewheyed casein , II curd
L ______ --t----------: Whey
Casein slurry Whey Oewheyed casein curd Mass flow [kg/d] 257520 124673 132848 Mass flow [kg/hr] 12876 6234 6642
w/w] [kg/hr] [% wlw] [kg/hr] [% w/w] [kg/hr] Fat 0.2 32 0.1 8 0.4 24 Casein 9.5 1222 0.16 10 18.3 1212 Whey protein 1.2 153 2.3 141 0.2 12 Lactose 3.4 432 6.8 424 0.1 9 Minerals & Miscellaneous 0.7 89 0.3 18 1.1 71 Water 85.0 10946 90.3 5632 80.0 5314 Acid 0.0 2 0.03 2 0.0 0
Total Solids, TS 15.0 1930 9.7 602 20.0 1328
Calculation steps 1) List the composition of casein 2) Determine the f10wrate of each component in the casein slurry stream 3) Calculate component mass flows in separated curd from assumed yield values for all except water 4) Calculate the total mass flow rate of separated curd using water as a tie-stream
= (sum all non-water component flows in separated curd stream)/(1-% water in separated curdl100) 5) Calculate component concentrations in separated curd stream from mass flows 6) Calculate component mass flows in whey stream by difference 7) Calculate component concentrations in whey stream from mass flows
8-9

APPENDIX B: Case study three Medium scale milk processing: Packed casein powder Component balance over curd washing
Appendix 8 - Case study three
The following calculations show how the mass balance .is calculated for Step 9 of the methodology - curd washing Step 8 calculations repeated using centrifugal separator to deplete fat, microfiltration to deplete lactose, minerals and whey protein Assume that 1 day = 20 production hours. Feed is separated curd. Casein curd preCipitated from skim retentate Curd washing rate 160 % (clean waterflow as a % of curd flow) Washed curd water content = 80 % Fat losses during washing = 8 % Washing Casein losses during washing 0 % +- efficiency Whey protein losses during washing 56 % assumed to be Lactose losses during washing = 76 % proportional to Minerals losses during washing = 76 % washing rate
Acid losses during washing 80 %
Dewheyed casein curd Clean water Mass flow [kg/d] 132848 212556 Mass flow [kg/hr] 6642 10628
[%w/w] [kg/hr] '[%wlw] [kglhr] Fat 0.4 24 0.0 0 Casein 18.3 1212 0.0 0
0.2 12 0.0 0 Lactose 0.1 9 0.0 0 Minerals & Miscellaneous 1.1 71 0.0 0 Water 80.0 5314 100.0 10628 Acid 0.00 0 0.0 0
Total Solids, TS 20.0 1328 0.0 0
Calculation steps 1) List the composition of separated curd and clean water streams 2) Determine the flowrate of each component in the separated curd and clean water streams 3) Calculate mass flow rate of clean water 4) Calculate component mass flows in washed curd stream using washing efficiencies 5) Calculate the total mass flow rate of washed curd using water as a tie-stream
Dewheyed curd
Clean water
Wash water
Wash water 219722
10986
[%w/w] [kg/hr] 0.0 2 0.0 2 0.1 7 0.1 7 0.5 54
99.3 10914 0.0 0
0.7 72
= (sum all non-water component flows in washed curd stream)/(1-% water in washed curd/100) 6) Calculate component concentrations in the washed curd stream from mass flows 7) Calculate component mass flows in wash water stream by difference 8) Calculate component cOncentrations in wash water stream from mass flows
8-10
Washed curd
Washed curd 125682
6284
[%w/w] [kg/hr] 0.3 22
19.3 1210 0.1 5 0.0 2 0.3 17
80.0 5027 0.0 0
20.0 1257

APPENDIX B: Case study three Medium scale milk processing: Packed casein powder Component balance over curd drying to produce casein powder
Appendix 8 - Case study three
The following calculations show how the mass balance is calculated for Step 9 of the methodology - drying curd to produce casein product Step 8 calculations repeated using centrifugal separator to deplete fat, microfiltration to deplete lactose, minerals and whey protein Assume that 1 day = 20 production hours. Feed is washed curd and recovered casein fines from clarifier (B-12). Assume only water removed by drying Dried casein water content =
Washed curd Casein powder
11.5 %
Washed curd Water vapour Mass flow [kg/d] 125682 97279 Mass flow [kg/hr] 6284 4864
[% w/w] [kg/hr] [% w/w] [kg/hr] Fat 0.3 22 0.0 a Casein 19.3 1210 0.0 0 Whey protein 0.1 5 0.0 0 Lactose 0.03 2 0.0 0 Minerals & Miscellaneous 0.3 17 0.0 0 Water 80.0 5027 100.0 4864 Acid 0.0 0 0.0 0
Total Solids, TS 20.0 1257 0.0 0
Calculation steps 1) List the composition of washed curd stream feed drier 2) Determine the flowrate of each component in the drier feed stream 3) Set component mass flows in water vapour equal to zero for all except water 4) Set component concentrations in water vapour equal to zero for all except water 5) Calculate component mass flows in dried casein stream by difference for all except water 6) Calculate the total mass flow rate of dried casein using water as a tie-stream
= (sum all non-water component flows in dried casein stream)/(1-% water in dried casein/1 00) 7) Calculate mass flow of water vapour by difference
8-11
II>
Heat Dried casein
28403 1420
[% w/w] [kg/hr] 1.5 22
85.2 1210 0.4 5 0.1 2 1.2 17
11.5 163 0.0 0
88.5 1257
Microfiltration of skim allows desired product composition
to be achieved using 40% less
-r~' Desired product
(Bylund, 1995)
[% w/w] 1.4
85.0 0.5 0.1 1.5
11.5 < 0.001
88.5

Appendix B - Case study three
APPENDIX B: Case study three Medium scale milk processing: Packed casein powder Heat balance over curd cooking to determine hot water requirements The following calculations show how the energy balance is calculated for Step 9 of the methodology - utilities requirement Step 8 calculations repeated using centrifugal separator to deplete fat, microfiltration to deplete lactose, minerals and whey protein Assume that 1 day = 20 production hours. Feed stream is skim retentate (fat. minerals, lactose and whey protein depleted) Raw curd slurry heated via indirect heating with counter-current heat eachanger Assumed temperature approach for HX'er 5 °C
Heating casein to cook temp Raw casein curd Cooking: Casein slurry ,
Mass flow [kg/d] Mass flow [kg/hr] Initial temperature [0C] Final temperature [0C] Specific heat [kJ/kgrC] Required heat duty [kW]
Required heat Specific heat [kJ/kgrC] Initial temperature [0C] Final temperature [0C] Required mass flow [kg/hr] Required mass flow [kg/d]
Calculation steps
Process side 257520
12876 12 60
4.5 773
side - separate streams 773 4.2 85 17
9738 194763
1) Calculate required duty to heat curd to cook temperature 2) Calculate necessary mass flow rate of hot water to deliver required heat duty
B-12
, , , , 1 _________________________ 1
Warm water from cooking curd
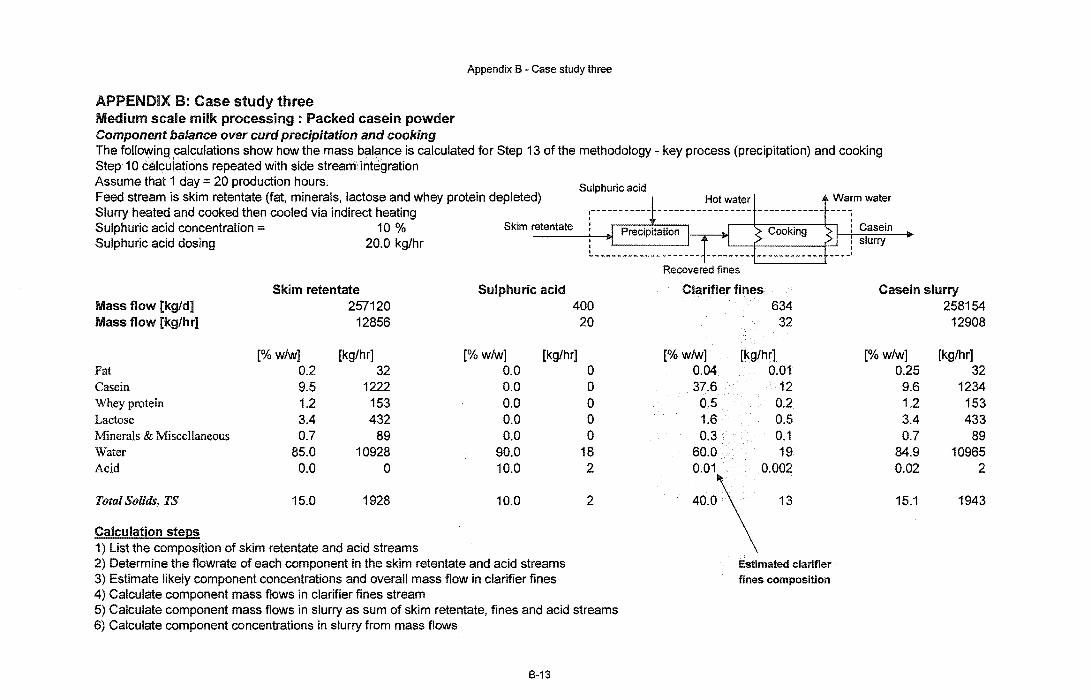
APPENDIX B: Case study three Medium scale milk processing; Packed casein powder Component balance over curd precipitation and cooking
Appendix 8 - Case study three
The following calculations show how the mass balance is calculated for Step 13 of the methodology - key process (precipitation) and cooking Step 10 calculations repeated with side stream integration Assume that 1 day = 20 production hours. Feed stream is skim retentate (fat, minerals, lactose and whey protein depleted)
Sulphuric acid
Slurry heated and cooked then cooled via indirect heating Sulphuric acid concentration = 10 % Skim retentate
acid dosing 20.0 kg/hr
Skim retentate Sulphuric acid Mass flow [kg/d] 257120 400 Mass flow [kg/hr] 12856 20
[% w/w] [kg/hr] [% w/w] [kg/hr] Fat 0.2 32 0.0 0 Casein 9.5 1222 0.0 0 Whey protein 1.2 153 0.0 0 Lactose 3.4 432 0.0 0 Minerals & Miscellaneous 0.7 89 0.0 0 Water 85.0 10928 90.0 18 Acid 0.0 0 10.0 2
Total Solids, TS 15.0 1928 10.0 2
Calculation steps 1) List the composition of skim retentate and acid streams 2) Determine the flowrate of each component in the skim retentate and acid streams 3) Estimate likely component concentrations and overall mass flow in clarifier fines 4) Calculate component mass flows in clarifier fines stream 5) Calculate component mass flows in slurry as sum of skim retentate, fines and acid streams 6) Calculate component concentrations in slurry from mass flows
8-13
Clarifier fines 634
32
[% w/w] [kg/hr] 0.04 0.01 37.6 12
0.5 0.2 1.6 0.5 0.3 0.1
60.0 19
:~o:\ o~:
Estimated clarifier fines composition
Casein slurry
Casein slurry 258154
12908
[% w/w] 0.25 9.6 1.2 3.4 0.7
84.9 0.02
15.1
[kg/hr] 32
1234 153 433
89 10965
2
1943
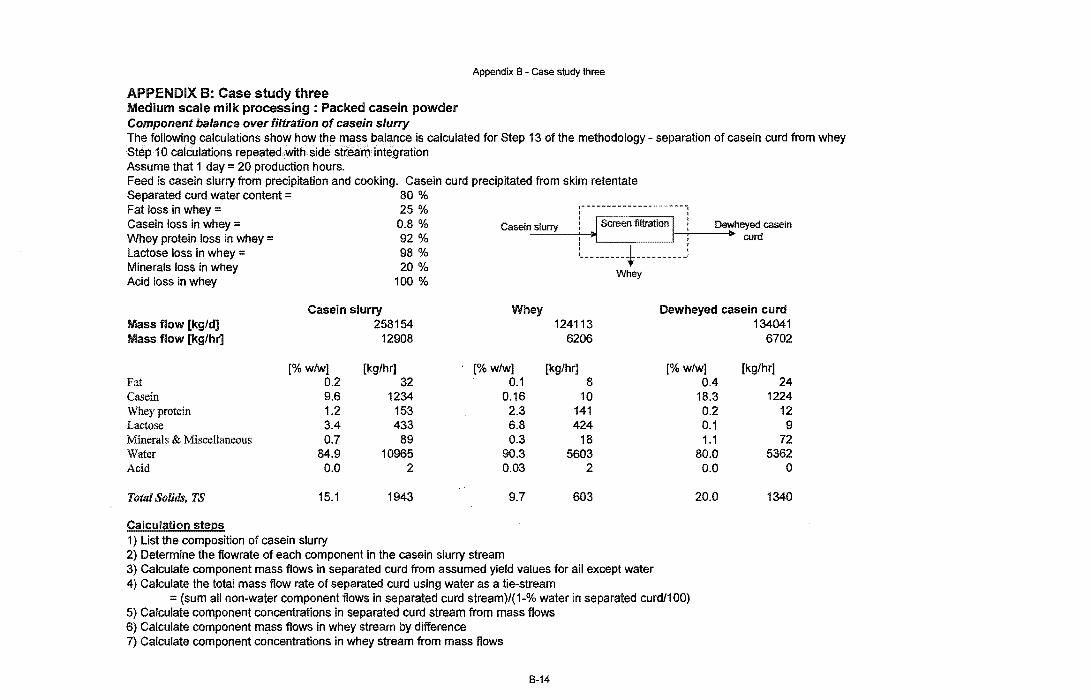
APPENDIX B: Case study three Medium scale milk processing: Packed casein powder Component balance over filtration of casein slurry
Appendix 8 - Case study three
The following calculations show how the mass balance is calculated for Step 13 of the methodology separation of casein curd from whey Step 10 calculations repeated with side stream integration Assume that 1 day = 20 production hours. Feed is casein slurry from precipitation and cooking. Casein curd precipitated from skim retentate Separated curd water content = 80 % Fat loss in whey 25 % Casein loss in whey = 0.8 % Casein slurry Whey protein loss in whey = 92 % '----,----'
Dewheyed casein -i----.... curd
Lactose loss in whey = 98 % Minera[s loss in whey 20 % Acid loss in whey 100 %
Whey
Casein slurry Whey Dewheyed casein curd Mass flow [kg/d) 258154 124113 134041 Mass flow [kg/hr] 12908 6206 6702
[% wfw] [kg/hr] [%w/w] [kg/hr] [%w/wl [kgfhr] Fat 0.2 32 0.1 8 0.4 24 Casein 9.6 1234 0.16 10 18.3 1224
1.2 153 2.3 141 0.2 12 Lactose 3.4 433 6.8 424 0.1 9 Minerals & Miscellaneous 0.7 89 0.3 18 1.1 72 Water 84.9 10965 90.3 5603 80.0 5362 Acid 0.0 2 0.03 2 0.0 0
Total Solitls, TS 15.1 1943 9.7 603 20.0 1340
Calculation steps 1) List the composition of casein slurry 2) Determine the flowrate of each component in the casein slurry stream 3) Calculate component mass flows in separated curd from assumed yield values for all except water 4) Calculate the total mass flow rate of separated curd using water as a tie-stream
= (sum all non-water component flows in separated curd stream)/(1-% water in separated curd/100) 5) Calculate component concentrations in separated curd stream from mass flows 6) Calculate component mass flows in whey stream by difference 7) Calculate component concentrations in whey stream from mass flows
8-14
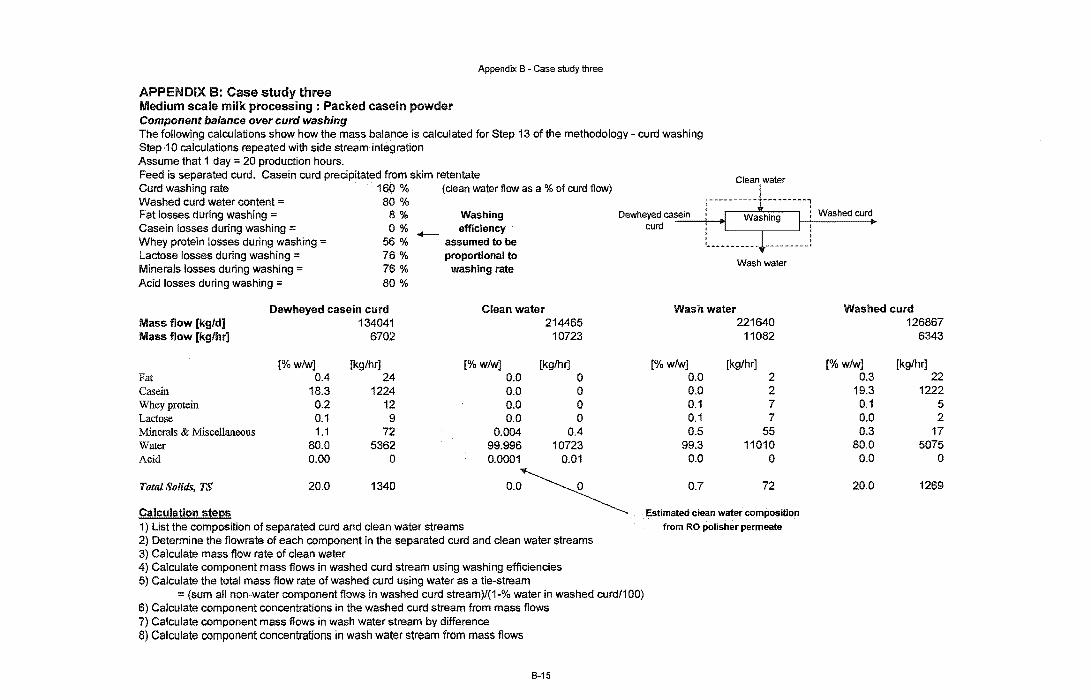
APPENDIX B: Case study three Medium scale milk processing: Packed casein powder Component balance over curd washing
Appendix B - Case study three
The following calculations show how the mass balance is calculated for Step 13 of the methodology - curd washing Step 10 calculations repeated with side stream integration Assume that 1 day = 20 production hours. Feed is separated curd. Casein curd precipitated from skim retentate Clean water Curd washing rate 160 % (clean water flow as a % of curd flow) Washed curd water content:: 80 % Fat losses during washing = 8 % Washing Casein losses during washing = 0 % __ efficiency Whey protein losses during washing = 56 % assumed to be
Dewheyed casein pi cum L. ____ -. ____ ~
Lactose losses during washing = 76 % proportional to Minerals losses during washing = 76 % washing rate
Wash water
Acid losses during washing = 80 %
Dewheyed casein curd Clean water Wash water Mass flow [kg/d] 134041 214465 221640 Mass flow [kg/hr] 6702 10723 11082
[%w/w] [kglhr] [%w/w] [kg/hr] [%w/w] [kg/hr] Fat 0.4 24 0.0 0 0.0 2 Casein 18.3 1224 0.0 0 0.0 2 Whey 0.2 12 0.0 0 0.1 7 Lactose 0.1 9 0.0 0 0.1 7 Minerals & Miscellaneous 1.1 72 0.004 0.4 0.5 55 Water 80.0 5362 99.996 10723 99.3 11010 Acid 0.00 0 0.0001 0.01 0.0 0
Total Solids, TS 20.0 1340 oo~ Calculation steps
0.7 72
Estimated clean water composHlon 1) List the composition of separated curd and clean water streams from RO polisher permeate 2) Determine the flowrate of each component in the separated curd.and clean water streams 3) Calculate mass flow rate of clean water 4) Calculate component mass flows in washed curd stream using washing efficiencies 5) Calculate the total mass flow rate of washed curd using water as a tie-stream
(sum all non-water component flows in washed curd stream)/(1-% water in washed curd/100) 6) Calculate component concentrations in the washed curd stream from mass flows 7) Calculate component mass flows in wash water stream by difference 8) Calculate component concentrations in wash water stream from mass flows
8-15
Washed curd 126867
6343
[%w/w] [kg/hr] 0.3 22
19.3 1222 0.1 5 0.0 2 0.3 17
80.0 5075 0.0 0
20.0 1269

APPENDIX B: Case study three Medium scale milk processing: Packed casein powder Component balance over curd drying to produce casein powder
Appendix B - Case study three
The following calculations show how the mass balance is calculated for Step 13 of the methodology - drying curd to produce casein product Step 10 calculations repeated with side stream integration Assume that 1 day = 20 production hours. Feed is washed curd and recovered casein fines from clarifier (B-12). Assume only water removed by drying Washed curd
Dried casein water content = 11.5 %
Washed curd Water vapour Mass flow [kg/d] 126867 98196 Mass flow [kg/hr] 6343 4910
[%w/w] [kg/hr] [% w/w] [kg/hr] Fat 0.3 22 0.0 0 Casein 19.3 1222 0.0 0 Whey protein 0.1 5 0.0 0 Lactose 0.03 2 0.0 0 Minerals & Miscellaneous 0.3 17 0.0 0 Water 80.0 5075 100.0 4910 Acid 0.0 0 0.0 0
Total Solids, TS 20.0 1269 0.0 0
Calculation steps 1) List the composition of washed curd stream feed drier 2) Determine the flowrate of each component in the drier feed stream 3) Set component mass flows in water vapour equal to zero for all except water 4) Set component concentrations in water vapour equal to zero for all except water 5) Calculate component mass flows in dried casein stream by difference for all except water 6) Calculate the total mass flow rate of dried casein using water as a tie-stream
= (sum all non-water component flows in dried casein stream)/(1-% water in dried casein/100) 7) Calculate mass flow of water vapour by difference
6-16
Dried casein 28670
1434
[% w/w] [kg/hr] 1.4 22
85.3 1222 0.4 5 0.1 2 1.2 17
11.5 165 0.0 0
88.4 1269
Microfiltration of skim allows desired product composition
to .be achieved using 40% less
wash water
1 Desired product
(Bylund, 1995)
[% w/w] 1.4
85.0 0.5 0.1 1.5
11.5 < 0.001
88.5
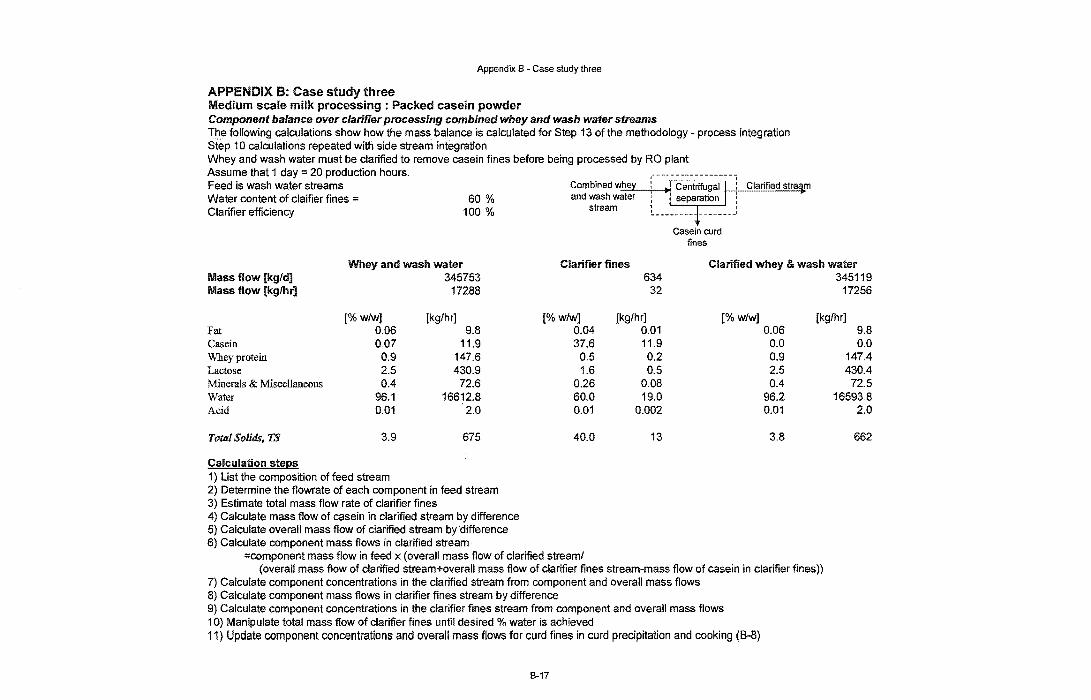
Appendix 8 - Case study three
APPENDIX B: Case study three Medium scale milk processing: Packed casein powder Component balance over clarifier processing combined whey and wash water streams The following calculations show how the mass balance is calculated for Step 13 of the methodology - process integration Step 10 calculations repeated with side stream integration Whey and wash water must be clarified to remove casein fines before being processed by RO plant Assume that 1 day = 20 production hours. Feed is wash water streams Water content of claifier fines = Clarifier efficiency
60 % 100 %
Combined whey !n~I_;-~;t~i;~~~;j-i and wash water
stream
Casein curd fines
Clarified stream
Whey and wash water Clarifier fines Clarified whey & wash water Mass flow [kg/d] 345753 634 345119 Mass flow [kg/hrJ 17288 32 17256
[% wfw] [kgfhr] [%wfw] [kg/hr] [% wfw] [kgfhr] Fat 0.06 9.8 0.04 0.01 0.06 9.8 Casein 0.07 11.9 37.6 11.9 0.0 0.0 Whey protein 0.9 147.6 0.5 0.2 0.9 147.4 Lactose 2.5 430.9 1.6 0.5 2.5 430.4 Minerals & Miscellaneous 0.4 72.6 0.26 0.08 0.4 72.5 Water 96.1 16612.8 60.0 19.0 96.2 16593.8 Acid 0.01 2.0 0.01 0.002 0.Q1 2.0
Total Solids, TS 3.9 675 40.0 13 3.8 662
Calculation steps 1) List the composition of feed stream 2) Determine the flowrate of each component in feed stream 3) Estimate total mass flow rate of clarifier fines 4) Calculate mass flow of casein in clarified stream by difference 5) Calculate overall mass flow of clarified stream by difference 6) Calculate component mass flows in clarified stream
=component mass flow in feed x (overall mass flow of clarified streamf (overall mass flow of clarified stream+overall mass flow of clarifier fines stream-mass flow of casein in clarifier fines»
7) Calculate component concentrations in the clarified stream from component and overall mass flows 8) Calculate component mass flows in clarifier fines stream by difference 9) Calculate component concentrations in the clarifier fines stream from component and overall mass flows 10) Manipulate total mass flow of clarifier fines until desired % water is achieved 11) Update component concentrations and overall mass flows for curd fines in curd precipitation and cooking (6-8)
8-17
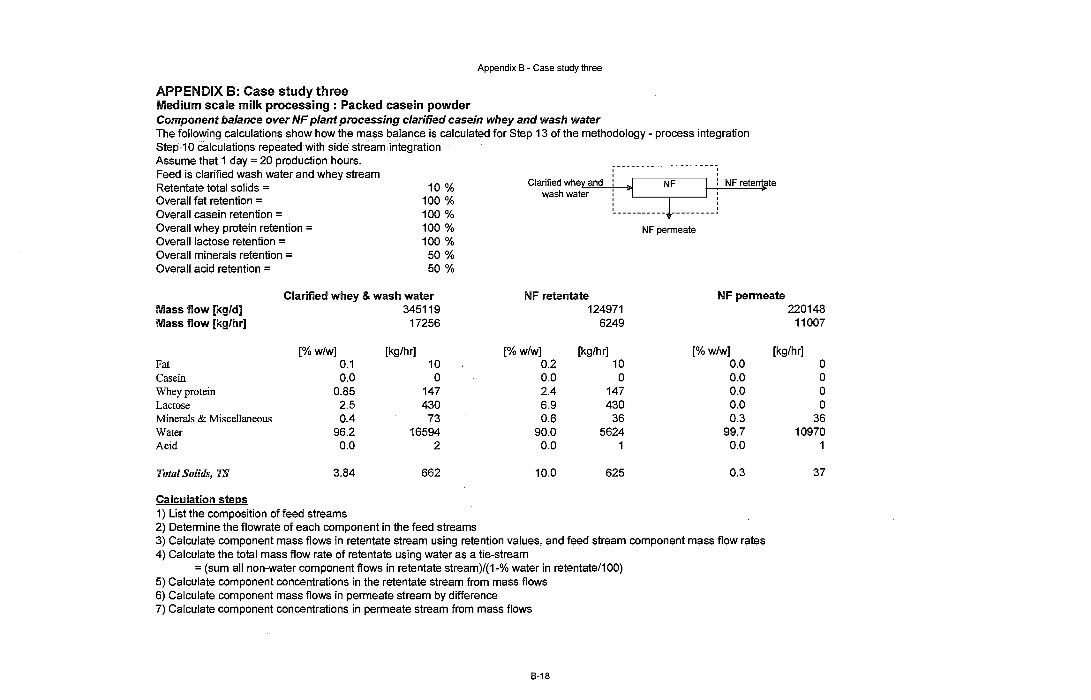
Appendix B - Case study three
APPENDIX B: Case study three Medium scale milk processing: Packed casein powder Component balance over NF plant processing clarified casein whey and wash water The following calculations show how the mass balance is calculated for Step 13 of the methodology - process integration Step 10 calculations repeated with side stream integration Assume that 1 day = 20 production hours. Feed is clarified wash water and whey stream Retentate total solids = Overall fat retention = Overall casein retention = Overall whey protein retention = Overall lactose retention = Overall minerals retention = Overall acid retention =
10 % 100 % 100 % 100 % 100 % 50 % 50 %
~---------------------, , Clarified whey and ~I
wash water , , , L __________ ~ _________ ~
NF permeate
Clarified whey & wash water NF retentate NF permeate Mass flow [kg/d] 345119 124971 220148 Mass flow [kg/hr] 17256 6249 11007
[%w/w] [kg/hr] [%w/w] [kg/hr] [%wlw] [kg/hr] Fat 0.1 10 0.2 10 0.0 0 Casein 0.0 0 0.0 0 0.0 0 Whey protein 0.85 147 2.4 147 0.0 0 Lactose 2.5 430 6.9 430 0.0 0 Minerals & Miscellaneous 0.4 73 0.6 36 0.3 36 Water 96.2 16594 90.0 5624 99.7 10970 Acid 0.0 2 0.0 1 0.0 1
Total Solids, TS 3.84 662 10.0 625 0.3 37
Calculation steps 1) List the composition of feed streams 2) Determine the flowrate of each component in the feed streams 3) Calculate component mass flows in retentate stream using retention values, and feed stream component mass flow rates 4) Calculate the total mass flow rate of retentate using water as a tie-stream
= (sum all non-water component flows in retentate stream)/(1-% water in retentate/100) 5) Calculate component concentrations in the retentate stream from mass flows 6) Calculate component mass flows in permeate stream by difference 7) Calculate component concentrations in permeate stream from mass flows
B-18
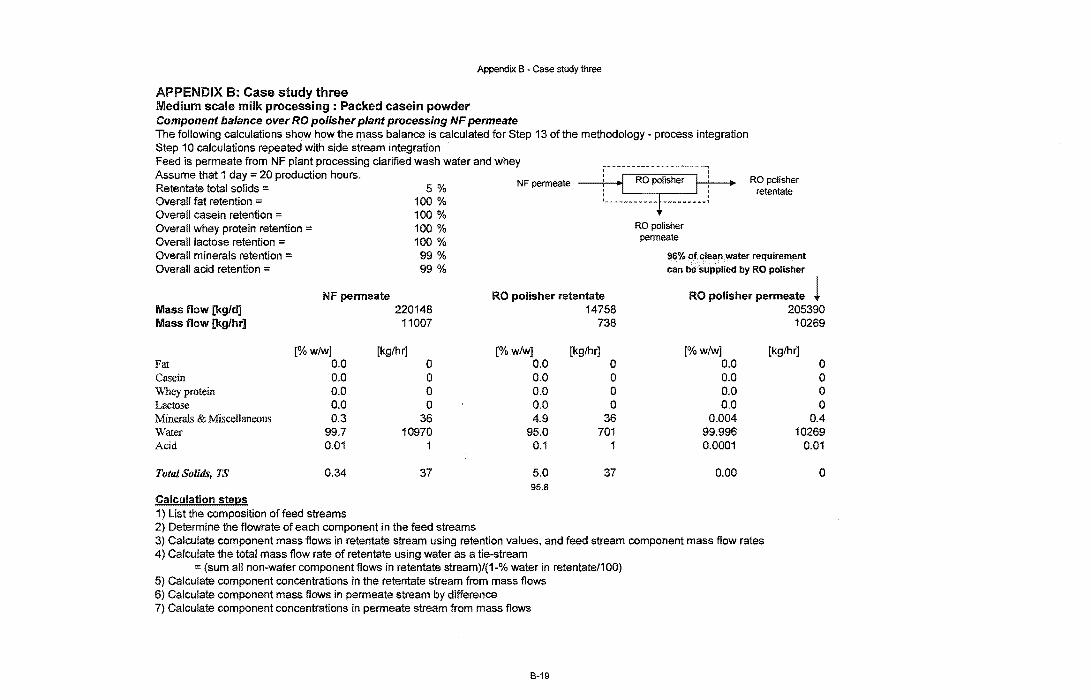
Appendix B - Case study three
APPENDIX B: Case study three Medium scale milk processing: Packed casein powder Component balance over RO polisher plant processing NF permeate The following calculations show how the mass balance is calculated for Step 13 of the methodology - process integration Step 10 calculations repeated with side stream integration Feed is permeate from NF plant processing clarified wash water and whey Assume that 1 day = 20 production hours. Retentate total solids = Overall fat retention = Overall casein retention = Overall whey protein retention = Overall lactose retention = Overall minerals retention = Overall acid retention =
5% 100 % 100 % 100 % 100 % 99 % 99 %
NF permeate Mass flow [kg/d] Mass flow [kg/hr]
Fat Casein
Lactose Minerals & Miscellaneous Water Acid
Total Solids, TS
Calculation steps
[%wlw] 0.0 0.0 0.0 0.0 0.3
99.7 0.01
0.34
1) List the composition of feed streams
220148 11007
[kg/hr] 0 0 0 0
36 10970
1
37
2) Determine the f10wrate of each component in the feed streams
NFpermeate
RO polisher retentate 14758
738
[%wlw] [kg/hr] 0.0 0 0.0 0 0.0 0 0.0 0 4.9 36
95.0 701 0.1 1
5.0 37 95.8
RO polisher permeate
RO polisher retentate
96% of clean water requirement
can be supplied by RO polisher
RO polisher permeate 1 205390
10269
[%w/w] [kg/hr] 0.0 0 0.0 0 0.0 0 0.0 0
0.004 0.4 99.996 10269 0.0001 0.01
0.00 0
3) Calculate component mass flows in retentate stream using retention values, and feed stream component mass flow rates 4) Calculate the total mass flow rate of retentate using water as a tie-stream
= (sum all non-water component flows in retentate stream)/(1-% water in retentate/100) 5) Calculate component concentrations in the retentate stream from mass flows 6) Calculate component mass flows in permeate stream by difference 7) Calculate component concentrations in permeate stream from mass flows
8-19
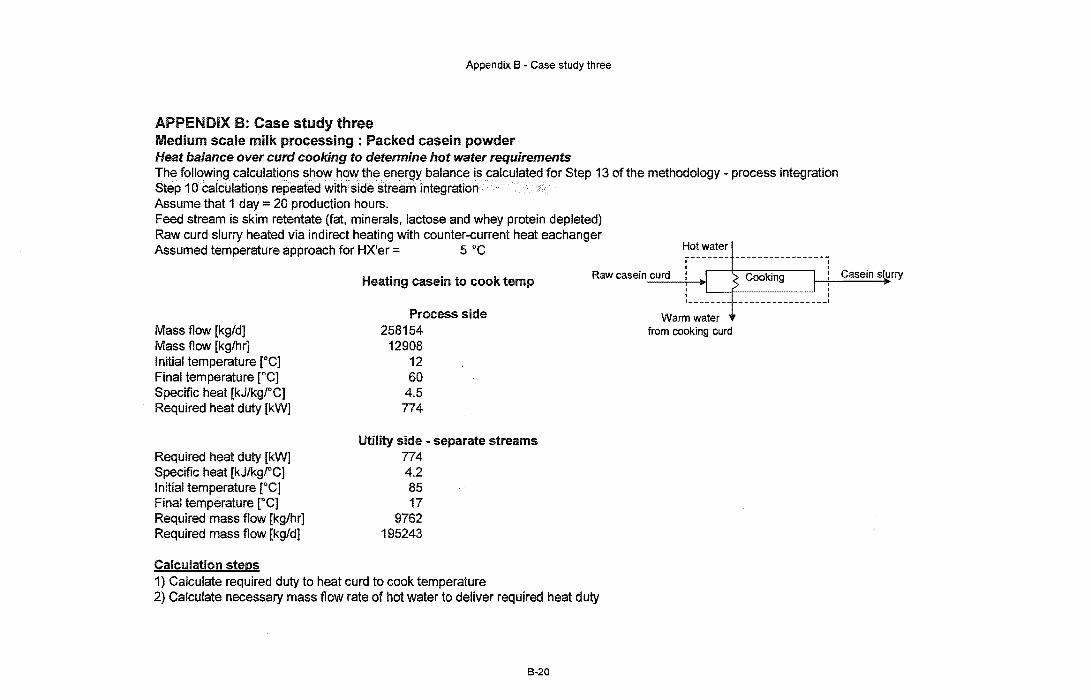
Appendix B - Case study three
APPENDIX B: Case study three scale milk processing: Packed casein powder
Heat balance over curd cooking to determine hot water requirements The following calculations show how the energy balance is calculated for Step 13 of the methodology - process integration Step 10 calculations repeated with side stream integration Assume that 1 day = 20 production hours. Feed stream is skim retentate (fat, minerals, lactose and whey protein depleted) Raw curd slurry heated via indirect heating with counter-current heat eachanger Assumed temperature approach for HX'er = 5 °C
Mass flow [kg/d] Mass flow [kg/hr] Initial temperature rC] Final temperature [DC] Specific heat [kJ/kg/°C] Required heat duty [kW]
Required heat duty Specific heat Initial temperature Final temperature [DC] Required mass flow [kglhr] Required mass flow [kg/d]
Calculation steps
Heating casein to cook temp
Process side 258154
12908 12 60
4.5 774
side - separate streams 774 4.2 85 17
9762 195243
1) Calculate required duty to heat curd to cook temperature
Raw
2) Calculate necessary mass flow rate of hot water to deliver required heat duty
8-20
Warm water from cooking curd
Cooking , ,
________________ 1
Casein s[~rry

Appendix 8 - Case study three
APPENDIX B: Case study three Medium scale milk processing: Packed casein powder with integrated WPC powder production Component balance over UF plant processing combined NF and RO polisher retentate streams The following calculations show how the mass balance is calculated for Step 14 of the methodology - co-product processing Assume that 1 day = 20 production hours. Feed is combined retentate streams from NF & RO polisher plants Overall diafiltration ratio = 12 % Retentate total solids = 24 % Overall fat retention = 100 % Combined NF Overall casein retention = 1 00 % retentate and ill! Overall whey protein retention = 90 % Use of diafiltration RO polisher
Overall lactose retention = 3.8 %.....- reduces retention of retentate
Overall minerals retention = 1.5 % lactose and minerals Overall acid retention = 0.5 %
NF retentate & RO polisher retentate Diafiltration water WPC UF permeate Mass flow [kgJdl 139729 16767 143189 Mass flow [kgJhr] 6986 838 7159
[%w/w] [kg/hr] [% w/w] [kg/hr] [% w/w] [kg/hr] Fat 0.1 10 0.0 0 0.0 0 Casein 0.0 0 0.0 0 0.0 0
Protein 2.1 147 0.0 0 0.2 15 Lactose 6.2 430 0.0 0 5.8 414 Minerals & miscellaneous 1.0 72 0.0 0 1.0 71 Water 90.5 6325 100.0 838 93.0 6657 Acid 0.0 2 0.0 0 0.0 2
Total Solids, TS 9.5 662 0.0 0 7.0 502
Calculation steps 1) List the composition of feed and diafiltration streams 2) Determine the flowrate of each component in the feed and diafiltration streams 3) Calculate component mass flows in retentate stream using retention values 4) Calculate the total mass flow rate of retentate using water as a tie-stream
= (sum all non-water component flows in retentate stream)/(1-% water in retentate/100) 5) Calculate component concentrations in the retentate stream from mass flows 6) Calculate component mass flows in permeate stream by difference from feed and diafiltration flows 7) Calculate component concentrations in permeate stream from mass flows
8-21
1---+---.... Retentate
Permeate
WPC UF retentate 13307
665
[%w/w] 1.5 0.0
19.9 2.4 0.2
76.0 0.002
24.0
[kg/hr] 10 o
133 16
1 506
0.01
160

Appendix B - Case study three
APPENDIX B: Case study three Medium scale milk processing: Packed casein powder with integrated WPC powder production Component balance over evaporator processing WPC UF retentate The following calculations show how the mass balance is calculated for Step 14 of the methodology - co-product processing Assume that 1 day = 20 production hours. ,-------------------~
Feed is WPC UF retentate. UF retentate ! I Evaporation I i Concentrate Assume only water removed by evaporation : .. ; It>
Evaporator concentrate total solids 40 % L ________ ~---------j
WPC UF retentate Evap condensate Mass flow [kg/d] 13307 5323 Mass flow [kg/hr] 665 266
[% w/w] [kg/hr] [% w/w] [kg/hr] Fat 1.5 10 0.0 0 Casein 0.0 0 0.0 0
19.9 133 0.0 0 Lactose 2.4 16 0.0 0 Minerals & Miscellaneous 0.2 1 0.0 0 Water 76.0 506 100.0 266 Acid 0.002 0.01 0.0 0
Total Solids, TS 24.0 160 0.0 0
Calculation steps 1) List the composition of feed 2) Determine the f10wrate of each component in the feed 3) Calculate component mass flows in concentrate assuming no solids loss in condensate 4) Calculate the total mass flow rate of concentrate using water as a tie-stream
= (sum all non-water component flows in concentrate)/(1-% water in concentrate/100) 5) Calculate component concentrations in concentrate stream from mass flows
8-22
Condensate
Evap concentrate 7984
399
[% w/w] [kg/hr] 2.5 10 0.0 0
33.2 133 4.0 16 0.3 1
60.0 240 0.003 0.01
40.0 160

Appendix B - Case study three
APPENDIX B: Case study three Medium scale milk processing: Packed casein powder with integrated WPC powder production Component balance over spray drier processing evaporator concentrate to produce WPC powder The following calculations show how the mass balance is calculated for Step 14 of the methodology - co-product processing
,----------T---------~
Assume that 1 day = 20 production hours. Feed is evaporator concentrate Assume only water removed by drying Dried WPC powder water content =
Concentrate , WPCpowder
4% I I , I
L _________ 1 __________ ! Heat
Washed curd Water vapour DriedWPC Mass flow [kg/d] 7984 4658 Mass flow [kglhr} 399 233
[% w/w] [kg/hr] [% w/w] [kg/hr] [% w/w] Fat 2.5 10 0.0 0 5.9 Casein 0.0 0 0.0 0 0.0 Whey protein 33.2 133 0.0 0 79.7 Lactose 4.0 16 0.0 0 9.7 Minerals & Miscellaneous 0.3 1 0.0 0 0.7 Water 60.0 240 100.0 233 4.0 Acid 0.003 0.01 0.0 0 0.006
Total Solids, TS 40.0 160 0.0 0 96.0
Calculation steps 1) List the composition of feed stream 2) Determine the mass flowrate of each component in the feed 3) Set component mass flows in water vapour equal to zero for all except water 4) Set component concentrations in water vapour equal to zero for all except water 5) Calculate component mass flows in WPC powder stream by difference for all except water 6) Calculate the total mass flow rate of WPC powder using water as a tie-stream
= (sum all non-water component flows in WPC powder stream)/(1-% water in WPC powder/100) 7) Calculate mass flow of water vapour by difference
8-23
3327 166
[kg/hr] 10
0 133
16 1 7
0.01
160
Desired product (Based on
Winchester, 1996)
[% w/w] 6.0 0.0
79.5 9.7 0.8 4.0
> 0.01
96.0

Appendix B - Case study three
APPENDIX B: Case study three Medium scale milk processing: Packed casein powder with integrated WPC powder production Component balance over NF plant processing WPC UF permeate The following calculations show how the mass balance is calculated for Step 14 of the methodology - co-product processing Assume that 1 day:::: 20 production hours. Feed is WPC UF permeate Retentate total solids :::: Overall fat retention = Overall casein retention ::::
WPC UF permeate ~
Overall whey protein retention = Overall lactose retention = Overall minerals retention = Overall acid retention ::::
18 % 100 % 100 % 100 % 100 %
NF permeate
50 % 50 %
WPC UF permeate Mass flow [kg/d] 143189 Mass flow [kglhr] 7159
[%wlwj [kg/hrj Fat 0.0 0 Casein 0.0 0 Whey protein 0.2 15 Lactose 5.8 414 Minerals & Miscellaneous 1.0 71 Water 93.0 6657 Acid 0.0 2
Total Solids, TS 7.0 502
Calculation steps 1) List the composition of feed streams 2) Determine the flowrate of each component in the feed streams
NF retentate NF permeate 51725 91464
2586 4573
[%w/wj [kg/hrj [% w/wj [kg/hrj 0.0 0 0.0 0 0.0 0 0.0 0 0.6 15 0.0 0
16.0 414 0.0 0 1.4 36 0.8 36
82.0 2121 99.2 4537 0.038 1 0.022 1
18.0 466 0.8 37
3) Calculate component mass flows in retentate stream using retention values, and feed stream component mass flow rates 4) Calculate the total mass flow rate of retentate using water as a tie-stream
(sum all non-water component flows in retentate stream)/(1-% water in retentate/100) 5) Calculate component concentrations in the retentate stream from mass flows 6) Calculate component mass flows in permeate stream by difference 7) Calculate component concentrations in permeate stream from mass flows
B·24

Appendix B - Case study three
APPENDIX B: Case study three Medium scale milk processing: Packed casein powder with integrated WPC powder production Component balance over RO polisher plant processing NF retentate generated from WPC UF permeate The following calculations show how the mass balance is calculated for Step 14 of the methodology - co-product processing Assume that 1 day = 20 production hours. Feed is permeate from NF plant processing WPC UF permeate Retentate total solids = 5 % Overall fat retention = 100 % Overall casein retention = 100 % Overall whey protein retention = 100 % Overall lactose retention = 100 % Overall minerals retention = 99 % Overall acid retention = 99 %
NF permeate Mass flow [kg/d] Mass flow [kg/hr]
Fat Casein Whey protein Lactose Minerals & Miscellaneolls Water Acid
Total Solids, TS
Calculation steps
[%w/w] 0.0 0.0 0.0 0.0 0.8
99.2 0.0
0.80
1) List the composition of feed streams
91464 4573
[kg/hr] 0 0 0 0
36 4537
1
37
2) Determine the flowrate of each component in the feed streams
NF permeate 1101
RO polisher reteotate 14468
723
[%w/w] [kg/hr] 0.0 0 0.0 0 0.0 0 0.0 0 4.9 35
95.0 687 0.1 1
5.0 36
I-i----l.... RO polisher retentate
RO polisher permeate
RO polisher permeate 76996
3850
[%w/w] [kg/hr] 0.0 0 0.0 0 0.0 0 0.0 0
0.009 0.4 99.99 3849
0.0 0
0.01 0
3) Calculate component mass flows in retentate stream using retention values, and feed stream component mass flow rates 4) Calculate the total mass flow rate of retentate using water as a tie-stream
= (sum all non-water component flows in retentate stream)/(1-% water in retentate/100) 5) Calculate component concentrations in the retentate stream from mass flows 6) Calculate component mass flows in permeate stream by difference 7) Calculate component concentrations in permeate stream from mass flows
B-25

Appendix B - Case study three
APPENDIX B: Case study three scale milk processing: Packed casein powder with integrated WPC powder production
Heat balance to investigate possible integration between WPC evaporator and WPC NFIRO polisher plants The following calculations show how the mass balance is calculated for Step 14 of the methodology - co-product processing WPC evaporator produces hot condensate. WPC NF and RO polisher plants require heat to operate Assume that 1 day = 20 production hours. WPC evaporator condensate temp WPC UF operating temp Assumed operating temp for NF & RO polisher plants Assumed temperature approach for HX'er =
Mass flow [kg/d] Mass flow [kg/hr] Initial temperature ["C] Final temperature [ec] Specific heat [kJ/kgl"C] Required heat duty [kW]
Heating NF feed to operating temp
143189 7159
10 30
4.5 179
Required heat duty [kW] 179 Specific heat [kJ/kgI"C] 4.2 Initial temperature ["C] 50 t~~~~!~~~LC1 _______________ ~1
,Required condensate flow [kg/hr] 4383, IRequired condensate flow [kg/d] 87667,
50°C 10 °c 30°C 5°C
Heating RO pOlisher feed to operating temp
Process side
Utility side
91464 4573
10 30
4.5 114
114 4.2 50 15
2800 55998
I ,~ IAvailable condensate flow [kg/hr] 2661 Evaporator condensate can only supply 6% ~~.!!.a~l.!::. <E!!.d!n.!~e..!l2.wJ~~L _________ 51~! of the hot water requirements for NF and RO
polisher plants, so integration is not worthwhile
Calculation steps 1) Calculate required heat duty to heat NF and RO polisher feed streams to operating temp 2) Calculate required mass flow rate of condensate required to supply net duty. using specified approach temperatures
8-26

Appendix C - Case Study Four
Large scale milk processing: Packed Whole Milk Powder

Appendix C - Case study four
APPENDIX C: Case study four large scale milk processing: Packed whole milk powder A comparison of composition of product to raw milk feed in order to determine required component enrichment I depletion The following calculations show how the mass balance is calculated for Step 4 of the methodogy Assume that 1 day = 24 production hours. Feed and product composition are based on Walstra et a/. (1999). For initial calculations, it is assumed that all components except casein can be deleted or enriched Assumed casein yield = 100 %
Depletion and/or enrichment Whole milk feed Desired product (Product - Feed)
Mass flow [kg/d] 2000000 266667 -1733333 Mass flow [kg/hr] 83333 11111 -72222
[% w/w] [kg/hr] [% w/w] [kg/hr] [% w/w] [kg/hr] Fat 3.9 3250 26.0 2889 0.5 -361 Casein 2.6 2167 19.5 2167 0.0 0 Whey Protein 0.65 544 4.9 544 0.0 0 Lactose 4.6 3833 38.0 4222 -0.5 389 Minerals & miscellaneous 0.95 792 8.1 900 -0.2 108 Water 87.3 72750 3.5 389 100.2 -72361 +--
Total Solids, TS 12.7 10586 96.5 10722 -0.2 136
Calculation steps 1) List the composition of feed 2) Determine the flowrate of each component in the feed 3) Specify the desired component % in product
Large negative value for moisture means that moisture removal is an
important part of of milk powder
produc
4) Calculate the product flow rate, using casein (assuming no enrichment or depletion) = feed mass flow casein 1(% product casein/100) 5) Calculate the remaining component mass flows using desird component concentrations in product and overall product flow rate 6) Determine the difference in flowrate of each component between the product and feed (Product - Feed) 7) For each component, a negative value of (Product - Feed) means component depletion is required while a positive value means
enrichment is necessary 8) Determine the composition of each component in (Product - Feed)
C-1

Appendix C - Case study four
APPENDIX C: Case study four Large scale milk processing: Packed whole milk powder Component balance over spray drier producing high moisture powder, for subsequent drying and lactose dry-blending The following calculations show how the mass balance is calculated for Step 8 of the methodogy - spray drying Assume that 1 day = 24 production hours. Feed is whole milk that has been moisture depleted, with minerals enriched to meet product composition of Walstra et a/. (1999). Lactose not enriched - same as whole milk feed. Assumed feed total solids 50 % Assumed powder moisture = 8% .---------- --------~
I :
Concentrated i High mo~ture feed : powder , ---------- ---------
Heat
Concentrated feed Water vapour High moisture powder Mass flow [kg/d] 496000 226435 269565 Mass flow [kg/hr] 20667 9435 11232
[%wlw] [kg/hr] [%wlw] [kg/hr] [% w/w] [kg/hr] Fat 14.0 2889 0.0 0 25.7 2889 Casein 10.5 2167 0.0 0 19.3 2167 Whey Protein 2.6 544 0.0 0 4.8 544 Lactose 18.5 3833~ 0.0 0 34.1 3833 Minerals & miscellaneous 4.4 900 Same mass 0.0 0 8.0 900 Water 50.0 10333 flow as 100.0 9435 8.0 899
whole milk
Total Solids, TS 50.0 10333 feed 0.0 0 92.0 10333
Calculation steps 1) Set component mass flows in concentrated feed stream to be equal to desired whole milk product values, except for water 2) Calculate the total mass flow of concentrated feed using water as a tie-stream
= (sum all non-water component mass flows in concentrated feed)/(1-% water in concentrated feed/100) 3) Set component concentrations in water vapour equal to zero for all except water 4) Calculate component mass flows in high moisture powder stream by difference for all except water 5) Calculate the total mass flow rate of high moisture powder using water as a tie-stream
= (sum all non-water component mass flows in high moisture powder stream)/(1-% water in high moisture powder/100) 6) Calculate remaining component concentrations in high moisture powder using component mass flows and overall mass flow 7) Calculate mass flow of water vapour by difference
C-2

Appendix C - Case study four
APPENDIX C: Case study four Large scale milk processing: Packed whole milk powder Component balance over fluidised bed drier producing low moisture powder, for subsequent lactose dry-blending The following calculations show how the mass balance is calculated for Step 8 of the methodogy - fluidised drying then dry blending Assume that 1 day = 24 production hours. Feed is whole milk that has been moisture depleted, with minerals enriched to meet product composition of Walstra et a/. (1999). Lactose not enriched - same as whole milk feed. Feed moisture = 8 % Product moisture 3.5 % ,-,
High moisture: powder
Heat High moisture powder
269565 11232
Water vapour low moisture powder Mass flow [kg/d] Mass flow [kg/hr]
Fat Casein
Protein Lactose Minerals & miscellaneous Water
Total Solids, TS
Calculation steps
[% w/w] 25.7 19.3 4.8
34.1 8.0 8.0
92.0
1) List the composition of feed
[kg/hr] 2889 2167
544 3833 "'f---.
900 Same mass
899 flow as
whole milk
10333 feed
2) Determine the flowrate of each component in the feed
12570 524
[% w/w] [kg/hr] 0.0 0 0.0 0 0.0 0 0.0 0 0.0 0
100.0 524
0.0 0
3) Set component concentrations in water vapour equal to zero for all except water 4) Calculate component mass flows in product stream by difference for all except water 5) Calculate the total mass flow rate of low moisture powder using water as a tie-stream
[%w/w] 27.0 20.2
5.1 35.8
8.4 3.5
96.5
= (sum all non-water component mass flows in low moisture powder stream)/(1-% water in low moisture powder/100)
256995 10708
[kg/hr] 2889 2167
544 3833
900 375
10333
6) Calculate remaining component concentrations in low moisture powder using component mass flows and overall mass flow 7) Calculate mass flow of water vapour by difference
C-3

Appendix C - Case study four
APPENDIX C: Case study four Large scale milk processing: Packed whole milk powder Component balance over dry blending operation adding lactose to produce whole milk powder product The following calculations show how the mass balance is calculated for Step 8 of the methodogy - dry blending Assume that 1 day = 24 production hours. Feed is whole milk that has been moisture depleted, with minerals enriched to meet product composition of Walstra et a/. (1999). lactose not enriched - same as whole milk feed. Final product moisture = 3.5 % Fat content of lactose powder = 0 %
Lactose powder
Casein content of lactose powder = 0 % protein content of lactose powde 0 %
Whole,;nilk : ~I : product
lactose content of lactose powder = 96.5 % I ' I ___________________ ~
Minerals content of lactose powder = 0 % Water content of lactose powder = 3.5 %
low moisture powder lactose powder Final product Mass flow [kg/d] 256995 9672 266667 Mass flow [kg/hr] 10708 403 11111
[% wlw] [kg/hr] [% w/w] [kg/hr] [% w/w] [kg/hr] Fat 27.0 2889 0.0 0 26.0 2889 Casein 20.2 2167 0.0 0 19.5 2167 Whey Protein 5.1 544 0.0 0 4.9 544 Lactose 35.8 3833~ 96.5 389 38.0 4222 Minerals & miscellaneous 8.4 900 Same mass 0.0 0 8.1 900 Water 3.5 375 flow as 3.5 14 3.5 389
whole milk
Total Solids, TS 96.5 10333 feed 96.5 389 96.5 10722
Calculation steps 1) list the composition of feed 2) Determine the flowrate of each component in the feed 3) Calculate the required total mass flow of lactose powder using lactose as a tie-stream
= (sum all non-lactose component mass flows in lactose powder)/(1-% lactose in lactose powder/100) 4) Calculate remaining component concentrations in lactose powder using component mass flows and overall mass flow 5) Calculate component mass flows in final product by difference 6) Calculate component concentrations in final product using component mass flows and overall mass flow
C-4
Desired product (Based on
Walstra et al. ,1999)
[%w/w] 26.0 19.5 4.9
38.0 8.1 3.5
96.5
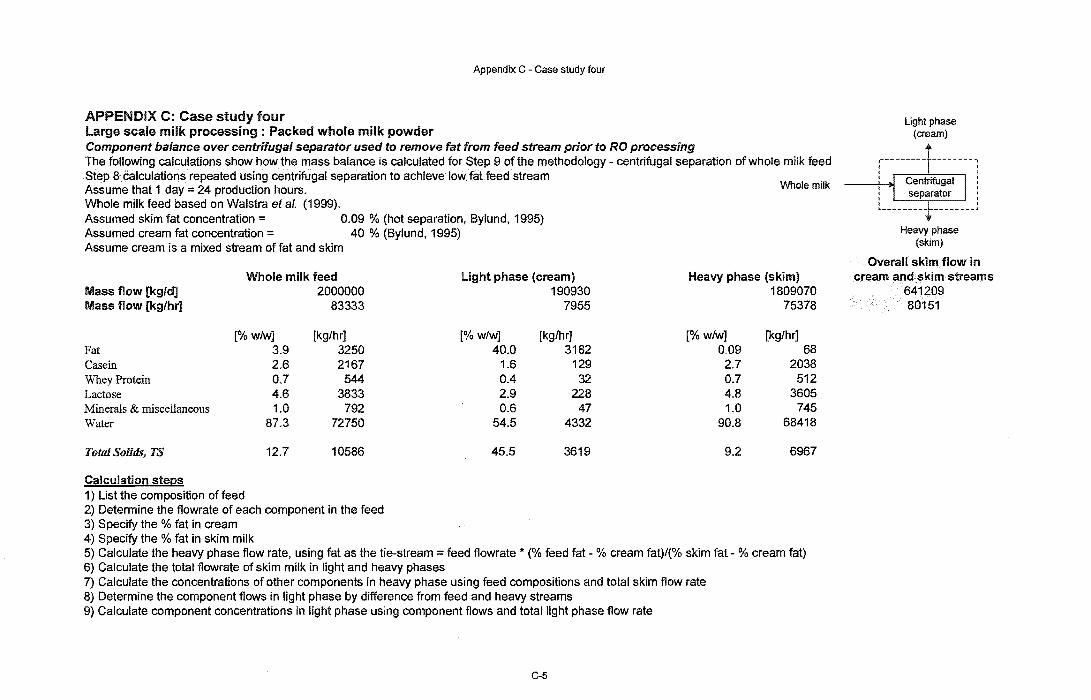
Appendix C - Case study four
APPENDIX C: Case study four Large scale milk processing: Packed whole milk powder Component balance over centrifugal separator used to remove fat from feed stream prior to RO processing The following calculations show how the mass balance is calculated for Step 9 of the methodology - centrifugal separation of whole milk feed Step 8 calculations repeated using centrifugal separation to achieve low fat feed stream Assume that 1 day = 24 production hours. Whole milk feed based on Walstra et al. (1999). Assumed skim fat concentration = 0.09 % (hot separation, Bylund, 1995) Assumed cream fat concentration = 40 % (Bylund, 1995) Assume cream is a mixed stream of fat and skim
Whole milk feed light phase (cream) Mass flow (kg/d] 2000000 190930 Mass flow [kg/hr] 83333 7955
[% w/w] [kg/hr] [% w/w] [kglhr] Fat 3.9 3250 40.0 3182 Casein 2.6 2167 1.6 129 Whey Protein 0.7 544 0.4 32 Lactose 4.6 3833 2.9 228 Minerals & miscellaneous 1.0 792 0.6 47 Water 87.3 72750 54.5 4332
Total Solids, TS 12.7 10586 45.5 3619
Calculation steps 1) List the composition of feed 2) Determine the flowrate of each component in the feed 3) Specify the % fat in cream 4) Specify the % fat in skim milk
Whole milk
Heavy phase (skim) 1809070
75378
[% w/w] [kg/hr] 0.09 68
2.7 2038 0.7 512 4.8 3605 1.0 745
90.8 68418
9.2 6967
5) Calculate the heavy phase flow rate, using fat as the tie-stream = feed flowrate * (% feed fat - % cream fat)/(% skim fat - % cream fat) 6) Calculate the total flowrate of skim milk in light and heavy phases 7) Calculate the concentrations of other components in heavy phase using feed compositions and total skim flow rate 8) Determine the component flows in light phase by difference from feed and heavy streams 9) Calculate component concentrations in light phase using component flows and total light phase flow rate
C-5
Light phase (cream)
Heavy phase (skim)
Overall skim flow in cream and skim streams
641209 80151
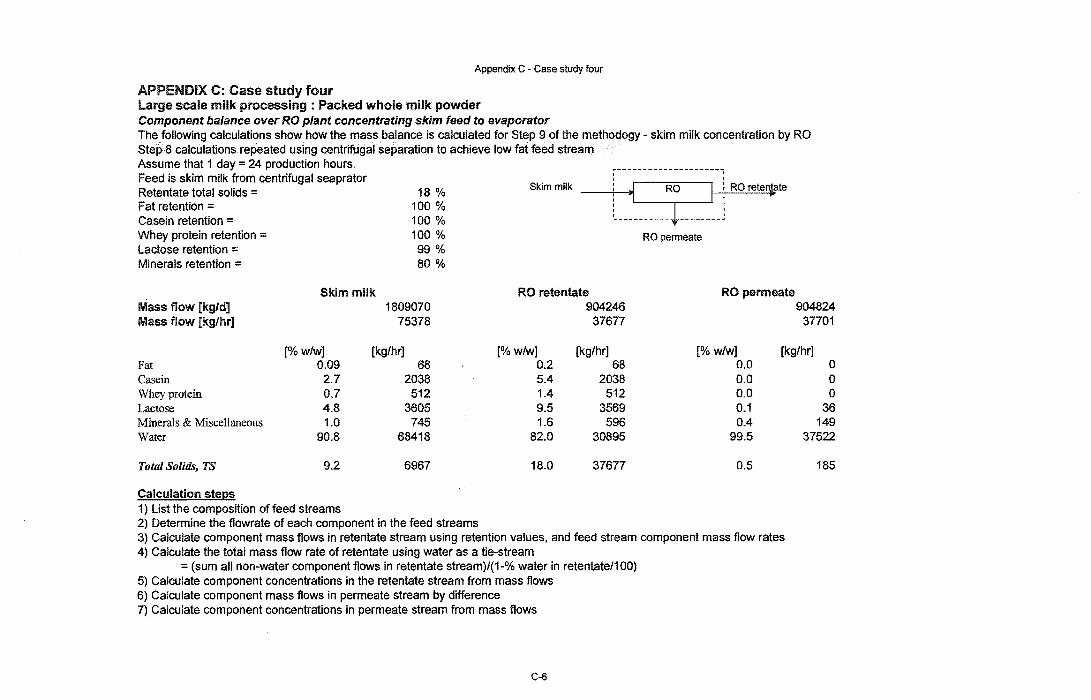
Appendix C - Case study four
APPENDIX C: Case study four large scale milk processing : Packed whole milk powder Component balance over RO plant concentrating skim feed to evaporator The following calculations show how the mass balance is calculated for Step 9 of the methodogy - skim milk concentration by RO Step 8 calculations repeated using centrifugal separation to achieve low fat feed stream Assume that 1 day = 24 production hours. Feed is skim milk from centrifugal seaprator Retentate total solids = Fat retention = Casein retention = Whey protein retention = Lactose retention = Minerals retention =
18 % 100 % 100 % 100 % 99 % 80 %
Skim milk Mass flow [kg/d] Mass flow [kg/hr]
Fat Casein
protein Lactose Minerals & Miscellaneous Water
Total Solids, TS
Calculation steps
[%w/w] 0.09 2.7 0.7 4.8 1.0
90.8
9.2
1) List the composition of feed streams
1809070 75378
[kg/hr] 68
2038 512
3605 745
68418
6967
2) Determine the f10wrate of each component in the feed streams
Skim milk ,,~ ,v,v,~ate
ROpermeate
RO retentate RO permeate 904246 904824 37677 37701
[%wlw] [kg/hr] [% w/w] [kg/hr] 0.2 68 0.0 0 5.4 2038 0.0 0 1.4 512 0.0 0 9.5 3569 0.1 36 1.6 596 0.4 149
82.0 30895 99.5 37522
18.0 37677 0.5 185
3) Calculate component mass flows in retentate stream using retention values, and feed stream component mass flow rates 4) Calculate the total mass flow rate of retentate using water as a tie-stream
= (sum all non-water component flows in retentate stream)/(1-% water in retentate/100) 5) Calculate component concentrations in the retentate stream from mass flows 6) Calculate component mass flows in permeate stream by difference 7) Calculate component concentrations in permeate stream from mass flows
C-6

Appendix C - Case study four
APPENDIX C: Case study four Large scale milk processing: Packed whole milk powder Component balance over evaporator processing retentate stream from skim milk RO plant The following calculations show how the mass balance is calculated for Step 9 of the methodogy - skim milk evaporation Step 8 calculations repeated using centrifugal separation to achieve low fat feed stream Assume that 1 day = 24 production hours. Feed is retentate stream from RO plant processing skim product composition of Walstra et a/. (1999). Lactose not enriched - same as whole milk feed.
Condensate
Evaporator concentrate total solids 52.5 % RO retentate I I I::vapora~or I
-------~----------
Concentrate .
RO retentate Evap condensate Evap concentrate Mass flow [kg/d] 904246 495183 Mass flow [kg/hr] 37677 24759
[% w/w] [kg/hr] [% w/w] [kg/hr] Fat 0.2 68 0.0 0 Casein 5.4 2038 0.0 0 Whey protein 1.4 512 0.0 0 Lactose 9.5 3569 0.0 0 Minerals & Miscellaneous 1.6 596 0.0 0 Water 82.0 30895 100.0 24759
Total Solids, TS 18.0 6782 0.0 0
Calculation steps 1) List the composition of feed 2) Determine the flowrate of each component in the feed 3) Calculate component mass flows in concentrate assuming no solids loss in condensate 4) Calculate the total mass flow rate of concentrate using water as a tie-stream
= (sum all non-water component flows in concentrate)/(1-% water in concentratel100) 5) Calculate component concentrations in concentrate stream from mass flows
C-7
258356 12918
[% wlw] [kg/hr] 0.5 68
15.8 2038 4.0 512
27.6 3569 4.6 596
47.5 6136
52.5 6782

Appendix C - Case study four
APPENDIX C: Case study four Large scale milk processing : Packed whole milk powder Component balance over wet blending operation adding cream to skim milk concentrate The following calculations show how the mass balance is calculated for Step 9 of the methodogy - wet blending with cream Step 8 calculations repeated using centrifugal separation to achieve low fat feed stream Cream
Assume that 1 day = 24 production hours. Feed is a skim concentrate from evaporator Lactose content of lactose powder = 96.5 % Water content of lactose powder = 3.5 %
Skim milk concentrate
Desired concentrate total solids to drier = 50 % Sufficient cream must be added in order to achieve the desired fat content in the final product
Evaporator concentrate Cream Concentrate to drier Mass flow [kg/d] 258356 168000 478027 Mass flow [kg/hr] 12918 7000 19918
[% wlw] [kglhr] [% w/w] [kg/hr] [% w/w] [kg/hr] Fat 0.5 68 40.0 2800 14.4 2868 Casein 15.8 2038 ' 1.6 114 10.8 2151 Whey Protein 4.0 512 0.4 29 2.7 540 Lactose 27.6 3569 2.9 201 18.9 3770 Minerals & miscellaneous 4.6 596 0.6 41 3.2 637 Water 47.5 6136 54.5 3812 49.9 9948
TS 52.5 6782 45.5 3184 50.0 9966
Calculation steps 1) List the composition of feed 2) List the f10wrate of each component in the feed, except for water 3) Specify a intial value of required % feed water in evaporator medel 4) Calculate the required total mass flow of evaporator concentrate using water as a tie-stream
= (sum all non-water component mass flows in evap concentrate milk)/(1-% water in evap concentrate milkl100) 5) Specify an initial mass flow of cream 6) Calculate component mass flows in lactose powder using component concentrations 7) Calculate component mass flows in drier concentrate by difference 8) Calculate overall mass flow of drier concentrate by difference 9) Manipulate evaporator concentrate total solids and cream flow until desired fat content in final powder is achieved and the drier
is receiving concentrate feed with 50% total solids
C-8
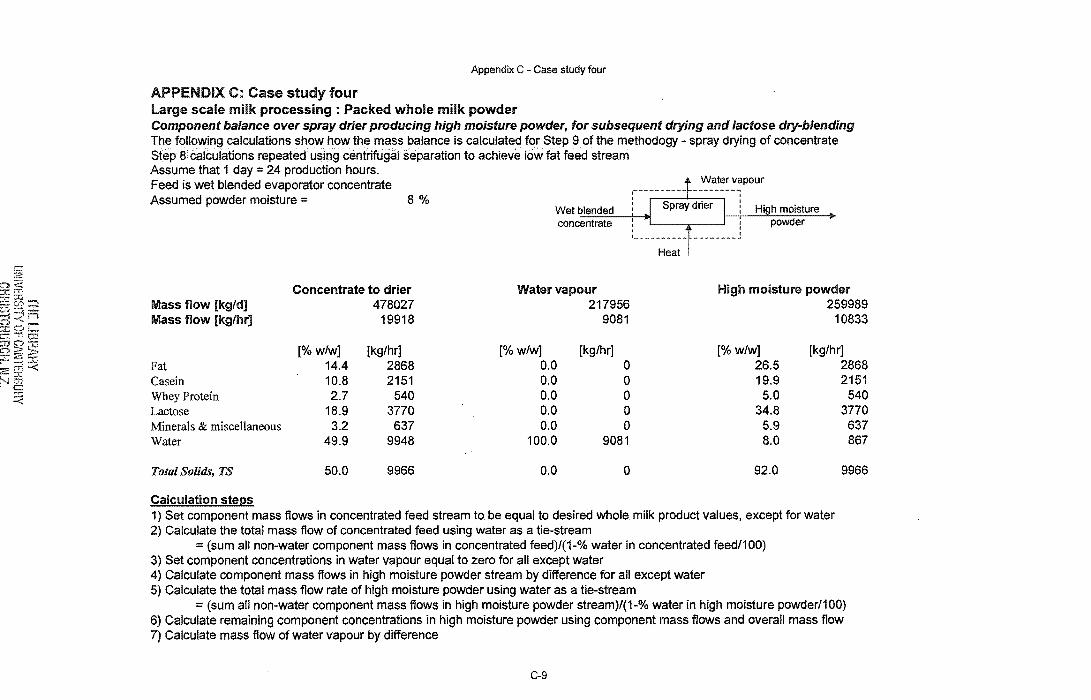
Appendix C - Case study four
APPENDIX C: Case study four large scale milk processing : Packed whole milk powder Component balance over spray drier producing high moisture powder, for subsequent drying and lactose dry-blending The following calculations show how the mass balance is calculated for Step 9 of the methodogy - spray drying of concentrate Step 8 calculations repeated using centrifugal.separation to achieve low fat feed stream Assume that 1 day = 24 production hours. Feed is wet blended evaporator concentrate Assumed powder moisture = 8%
Concentrate to drier Mass flow [kg/d] 478027 Mass flow [kg/hr] 19918
[%wlw] [kg/hr] Fat 14.4 2868 Casein 10.8 2151 Whey Protein 2.7 540 Lactose 18.9 3770 Minerals & miscellaneous 3.2 637 Water 49.9 9948
Total Solids, TS 50.0 9966
Calculation steps
Wet blended concentrate
Water vapour High moisture powder 217956 259989
9081 10833
[%w/w] [kglhr] [% w/w] [kg/hr] 0.0 0 26.5 2868 0.0 0 19.9 2151 0.0 0 5.0 540 0.0 0 34.8 3770 0.0 0 5.9 637
100.0 9081 8.0 867
0.0 0 92.0 9966
1) Set component mass flows in concentrated feed stream to be equal to desired whole milk product values, except for water 2) Calculate the total mass flow of concentrated feed using water as a tie-stream
= (sum all non-water component mass flows in concentrated feed)/(1-% water in concentrated feed/100) 3) Set component concentrations in water vapour equal to zero for all except water 4) Calculate component mass flows in high moisture powder stream by difference for all except water 5) Calculate the total mass flow rate of high moisture powder using water as a tie-stream
= (sum all non-water component mass flows in high moisture powder stream)/(1-% water in high moisture powder/100) 6) Calculate remaining component concentrations in high moisture powder using component mass flows and overall mass flow 7) Calculate mass flow of water vapour by difference
C-9

Appendix C - Case study four
APPENDIX C: Case study four large scale milk processing: Packed whole milk powder Component balance over fluidised bed drier producing low moisture powder, for subsequent lactose dry-blending The following calculations show how the mass balance is calculated for Step 9 of the methodogy - fluidised drying to high moisture product Step 8 calculations repeated using centrifugal separation to achieve low fat feed stream Assume that 1 day = 24 production hours. Feed is high moisture whole milk powder from spray drier Feed moisture = 8 % Product moisture 3.5 %
High moisture powder Water vapour Mass flow [kg/d] 259989 12124 Mass flow [kg/hr] 10833 505
[% w/w] [kg/hr] [% w/w] [kg/hr] Fat 26.5 2868 0.0 0 Casein 19.9 2151 0.0 0 Whey Protein 5.0 540 0.0 0 Lactose 34.8 3770 0.0 0 Minerals & miscellaneous 5.9 637 0.0 0 Water 8.0 867 100.0 505
TS 92.0 9966 0.0 0
Calculation steps 1) List the composition of feed 2) Determine the flow rate of each component in the feed 3) Set component concentrations in water vapour equal to zero for all except water 4) Calculate component mass flows in product stream by difference for all except water 5) Calculate the total mass flow rate of low moisture powder using water as a tie-stream
Low moisture powder 247865
10328
[% w/w] [kg/hr] 27.8 2868 20.8 2151
5.2 540 36.5 3770
6.2 637 3.5 361
96.5 9966
= (sum all non-water component mass flows in low moisture powder stream}/(1-% water in low moisture powder/100) 6) Calculate remaining component concentrations in low moisture powder using component mass flows and overall mass flow 7) Calculate mass flow of water vapour by difference
C-10
Desired product (Based on
Walstra at al. ,1999)
[% w/w] 26.0 19.5 4.9
38.0 8.1 3.5
96.5

Appendix C - Case study four
APPENDIX C: Case study four Large scale milk processing: Packed whole milk powder Component balance over dry blending operation adding lactose to produce whole milk powder product The following calculations show how the mass balance is calculated for Step 9 of the methodogy - dry blending with lactose addition Step 8 calculations repeated using centrifugal separation to achieve low fat feed stream Assume that 1 day = 24 production hours. Feed is lowq moisture whole milk powder from fluidised bed drier Final product moisture = 3.5 % Fat content of lactose powder = 0 % Casein content of lactose powder = 0 % Whey protein content of lactose powder = 0 % Lactose content of lactose powder = 96.5 % Minerals content of lactose powder = 0 % Water content of lactose powder = 3.5 %
low moisture powder Mass flow [kg/d] 247865 Mass flow [kg/hr] 10328
[% w/w] [kg/hr] Fat 27.8 2868 Casein 20.8 2151 Whey Protein 5.2 540 Lactose 36.5 3770 Minerals & miscellaneous 6.2 637 Water 3.5 361
Total Solids, TS 96.5 9966
Calculation steps 1) List the composition of feed 2) Determine the flowrate of each component in the feed 3) Specify an initial mass flow of lactose powder 4) Calculate component mass flows in lactose powder stream
Lactose powder
----~----.." , , Low moisture' I ""'1 """""''''11 I Whole milk
'.:..:..:.:.::;::=~! -/lOll!> .. powder : product , L __________________ 2
lactose powder 16800
700
[% wlw] [kglhr] 0.0 0 0.0 0 0.0 0
96.5 676 0.0 0 3.5 25
96.5 676
Final product 266667
11028
Desired product (Based on
Walstra et a/. ,1999)
[% w/w] [kglhr] [% wlw] 26.0 2868 26.0 19.5 2151 19.5 4.9 540 4.9
i---40]---~5----------38.01
I 5.8 637 8.1 I
·---~;--~:~-I--------~~~· Minerals content of powder is low so lactose content
elevated to compensate. Final product Is stili considered to meet spec requirements
5) Calculate overall and component mass flows in final product by difference 6) Calculate component concentrations in final product using component mass flows and overall mass flow 7) Manipulate the mass flow of lactose powder until desired powder composition is achieved. 8) Review cream addition rate in concentrate wet blending and manipulate if necessary to achieve the desired powder composition
C-11