Thermally-Driven Mesopore Formation and Oxygen Release in ...
38
Thermally-Driven Mesopore Formation and Oxygen Release in Delithiated NCA Cathode Particles Journal: Journal of Materials Chemistry A Manuscript ID TA-ART-02-2019-001720.R1 Article Type: Paper Date Submitted by the Author: 09-Apr-2019 Complete List of Authors: Besli, Münir; Robert Bosch LLC Research and Technology Center North America, RTC2.4 Shukla, Alpesh; Lawrence Berkeley National Laboratory, National Center of Electron Microscopy, Molecular Foundry Wei, Chenxi; University of Science & Technology of China; SLAC National Accelerator Laboratory, Stanford Synchrotron Radiation Lightsource Metzger, Michael; Robert Bosch LLC Research and Technology Center North America, RTC2.4 Alvarado, Judith; Lawrence Berkeley National Laboratory, Energy Technologies Area Boell, Julian; Robert Bosch LLC Research and Technology Center North America, RTC2.4 Nordlund, Dennis; SLAC National Accelerator Laboratory, Stanford Synchrotron Radiation Lightsource Schneider, Gerhard; Aalen University, Materials Research Institute Hellstrom, Sondra; Robert Bosch LLC Research and Technology Center North America, RTC2.4 Johnston, Christina; Robert Bosch LLC Research and Technology Center North America, RTC2.4 Christensen, Jake; Robert Bosch LLC Doeff, Marca; Lawrence Berkeley National Laboratory, Liu, Yijin; SLAC National Accelerator Laboratory, Stanford Synchrotron Radiation Lightsource Kuppan, Saravanan; Robert Bosch LLC Research and Technology Center North America, RTC2.4 Journal of Materials Chemistry A
Transcript of Thermally-Driven Mesopore Formation and Oxygen Release in ...

Thermally-Driven Mesopore Formation and Oxygen Release in Delithiated NCA Cathode Particles
Journal: Journal of Materials Chemistry A
Manuscript ID TA-ART-02-2019-001720.R1
Article Type: Paper
Date Submitted by the Author: 09-Apr-2019
Complete List of Authors: Besli, Münir; Robert Bosch LLC Research and Technology Center North America, RTC2.4Shukla, Alpesh; Lawrence Berkeley National Laboratory, National Center of Electron Microscopy, Molecular FoundryWei, Chenxi; University of Science & Technology of China; SLAC National Accelerator Laboratory, Stanford Synchrotron Radiation LightsourceMetzger, Michael; Robert Bosch LLC Research and Technology Center North America, RTC2.4Alvarado, Judith; Lawrence Berkeley National Laboratory, Energy Technologies AreaBoell, Julian; Robert Bosch LLC Research and Technology Center North America, RTC2.4Nordlund, Dennis; SLAC National Accelerator Laboratory, Stanford Synchrotron Radiation LightsourceSchneider, Gerhard; Aalen University, Materials Research InstituteHellstrom, Sondra; Robert Bosch LLC Research and Technology Center North America, RTC2.4Johnston, Christina; Robert Bosch LLC Research and Technology Center North America, RTC2.4Christensen, Jake; Robert Bosch LLCDoeff, Marca; Lawrence Berkeley National Laboratory, Liu, Yijin; SLAC National Accelerator Laboratory, Stanford Synchrotron Radiation LightsourceKuppan, Saravanan; Robert Bosch LLC Research and Technology Center North America, RTC2.4
Journal of Materials Chemistry A

1
Thermally-Driven Mesopore Formation and Oxygen
Release in Delithiated NCA Cathode Particles
Münir M. Beslia,b, Alpesh Khushalchand Shuklac, Chenxi Weid, Michael Metzgera, Judith
Alvaradoe, Julian Boella, Dennis Nordlundd, Gerhard Schneiderb,f, Sondra Hellstroma, Christina
Johnstona, Jake Christensena, Marca M. Doeffe,*, Yijin Liud,*, Saravanan Kuppana,*
aRobert Bosch LLC, Research and Technology Center, Sunnyvale, California 94085, United States
bDept. of Mech. Engineering, Karlsruhe Institute of Technology (KIT), Karlsruhe 76131, Germany
cNational Center of Electron Microscopy, Molecular Foundry, Lawrence Berkeley National Laboratory, Berkeley, California
94720, United States
dStanford Synchrotron Radiation Lightsource, SLAC National Accelerator Laboratory, Menlo Park, California 94025, United
States
eLawrence Berkeley National Laboratory, Energy Storage and Distributed Resources Division, University of California, Berkeley,
California 94720, United States
fMaterials Research Institute, Aalen University, Aalen 73430, Germany
*Correspondence and requests for materials should be addressed to M.D. ([email protected]), Y.L. ([email protected]),
and S.K. ([email protected])
Key Words
NCA; cathode; lithium-ion battery; intergranular crack; transmission X-ray microscopy; chemical
delithiation; mesopores; thermal stability
Page 1 of 37 Journal of Materials Chemistry A

2
Abstract
The structural integrity of layered Ni-rich oxide cathode materials are one of the most essential
factors that critically affect the performance and reliability of lithium-ion batteries. Prolonged
battery operation often involves repeated phase transitions, builds up mechanical stresses, and
could provoke thermal spikes. Such sophisticated chemo-thermo-mechanical interplay can cause
performance degradation through structural disintegration of the cathode active materials
(CAMs). Herein, we systematically investigate the thermal decomposition, fracture, and oxygen
evolution of chemically delithiated Li0.3Ni0.8Co0.15Al0.05O2 (NCA) particles upon heating from 25 °C
to 450 °C using a number of advanced X-ray and electron probes. We observed a continuous
reduction of the Ni oxidation state upon heating, as well as the release of oxygen from the NCA
lattice that undergoes the thermally induced phase transformations. The release of oxygen also
created numerous mesopores throughout the analyzed particles, which could significantly affect
the chemical and mechanical properties of the electrode. In addition, intergranular and
intragranular fracturing at elevated temperatures also contribute to the degradation of the NCA
cathode under these conditions. Our investigation of the mechanical integrity at elevated
temperatures provides a fundamental understanding of the thermally driven chemomechanical
breakdown of the NCA cathode active materials.
Introduction
In order to enable high energy density and long cycle life batteries for electric vehicles or off-grid
power storage systems, intensive research has been conducted on advanced and improved
Page 2 of 37Journal of Materials Chemistry A

3
cathode materials. Among the vast number of novel cathode materials, layered Ni-rich oxides,
LiNi1−x−yCoxAlyO2 (NCA) or LiNi1−x−yCoxMnyO2 (NCM), in particular, are the most promising for next-
gen Lithium-ion batteries (LIBs).1 Despite their high capacities of 220 mAh/g and the potential to
reach even higher capacities of > 250 mAh/g when cycled to 4.6 V,2,3 layered Ni-rich oxides still
face some major limitations. A significant drawback of high Ni content layered oxides is their
intrinsic instability in their delithiated state, which occurs because of the effect of cation mixing:4–
9 The similar radii of Li ions (0.76 Å) and Ni2+ ions (0.69 Å) enable Li+/Ni2+ site exchange, e.g. the
occupation of 3b Li+ layer sites by Ni2+.8 This lattice disordering leads to the obstruction of Li
diffusion pathways through electrostatic repulsion by Ni cations10,11 and contraction of Li slabs,11
ultimately resulting in reduced capacity, cycling instability, and limited rate capability.9 A further
major drawback of layered Ni-rich oxides in the delithiated state is the release of oxygen12–14
through reduction of Ni4+ in the delithiated material especially at elevated temperatures. In
comparison to cathode materials with lower Ni content (e.g., NCM111), layered Ni-rich oxides
(e.g., NCA, NCM523, 622 or 811) release more oxygen at lower onset temperatures accompanied
with greater heat generation;15–17 thus, Ni-rich cathodes are thermally less stable.18 Several X-ray
diffraction studies have shown that heat induced oxygen release in NCA and NCM takes place
through structural changes of the material.19–21 The layered oxide ( ) transitions first to a R3m
spinel ( ) then to a rock salt ( ) phase with rising temperature.17,19,22 More oxygen is Fd3m Fm3m
released during the transition from spinel to rock salt than for the first phase change. It is
important to note that, due to the hierarchically complex nature of the secondary particles, these
phase transitions take place over a broad temperature range and co-exist within the particles
with heterogeneous spatial distributions. Hence, it is of utmost importance to fully understand
Page 3 of 37 Journal of Materials Chemistry A
4
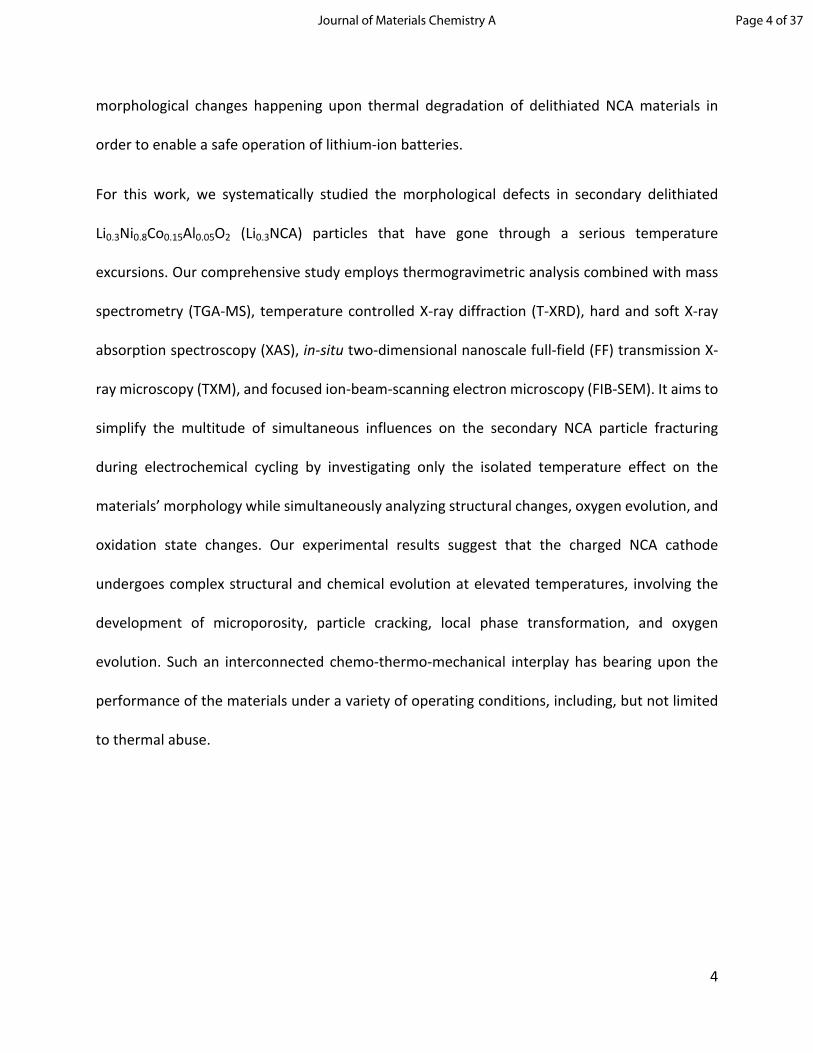
morphological changes happening upon thermal degradation of delithiated NCA materials in
order to enable a safe operation of lithium-ion batteries.
For this work, we systematically studied the morphological defects in secondary delithiated
Li0.3Ni0.8Co0.15Al0.05O2 (Li0.3NCA) particles that have gone through a serious temperature
excursions. Our comprehensive study employs thermogravimetric analysis combined with mass
spectrometry (TGA-MS), temperature controlled X-ray diffraction (T-XRD), hard and soft X-ray
absorption spectroscopy (XAS), in-situ two-dimensional nanoscale full-field (FF) transmission X-
ray microscopy (TXM), and focused ion-beam-scanning electron microscopy (FIB-SEM). It aims to
simplify the multitude of simultaneous influences on the secondary NCA particle fracturing
during electrochemical cycling by investigating only the isolated temperature effect on the
materials’ morphology while simultaneously analyzing structural changes, oxygen evolution, and
oxidation state changes. Our experimental results suggest that the charged NCA cathode
undergoes complex structural and chemical evolution at elevated temperatures, involving the
development of microporosity, particle cracking, local phase transformation, and oxygen
evolution. Such an interconnected chemo-thermo-mechanical interplay has bearing upon the
performance of the materials under a variety of operating conditions, including, but not limited
to thermal abuse.
Page 4 of 37Journal of Materials Chemistry A
5
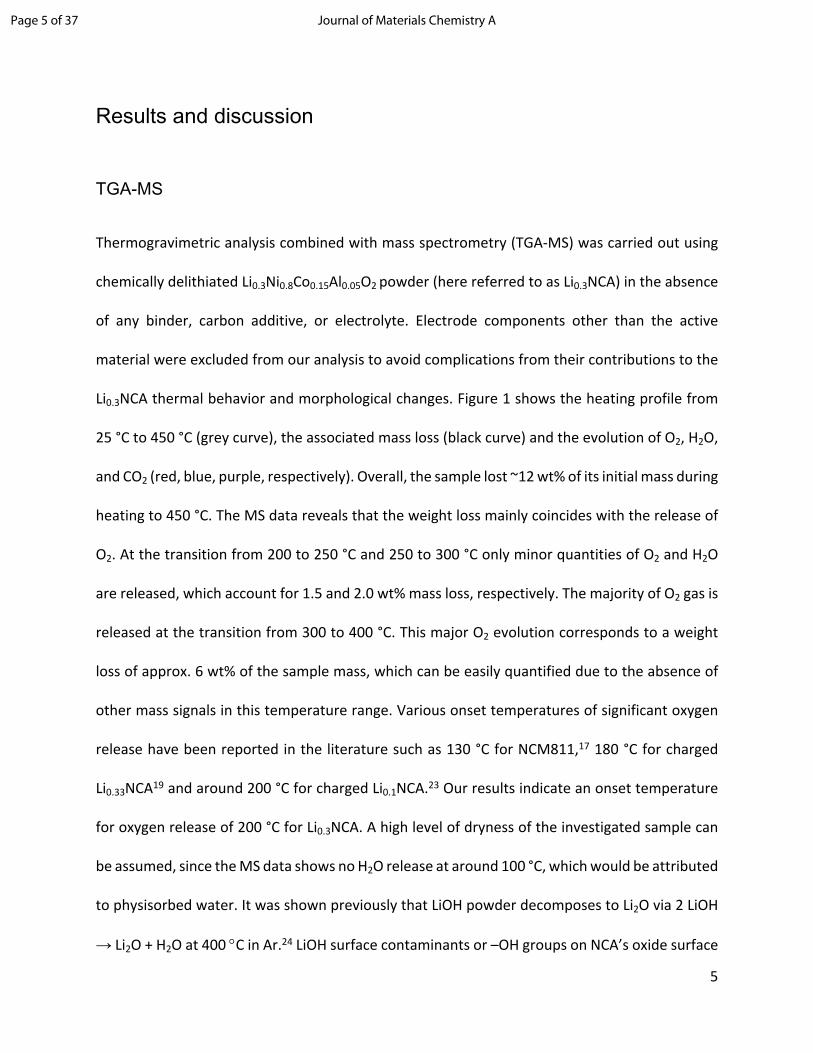
Results and discussion
TGA-MS
Thermogravimetric analysis combined with mass spectrometry (TGA-MS) was carried out using
chemically delithiated Li0.3Ni0.8Co0.15Al0.05O2 powder (here referred to as Li0.3NCA) in the absence
of any binder, carbon additive, or electrolyte. Electrode components other than the active
material were excluded from our analysis to avoid complications from their contributions to the
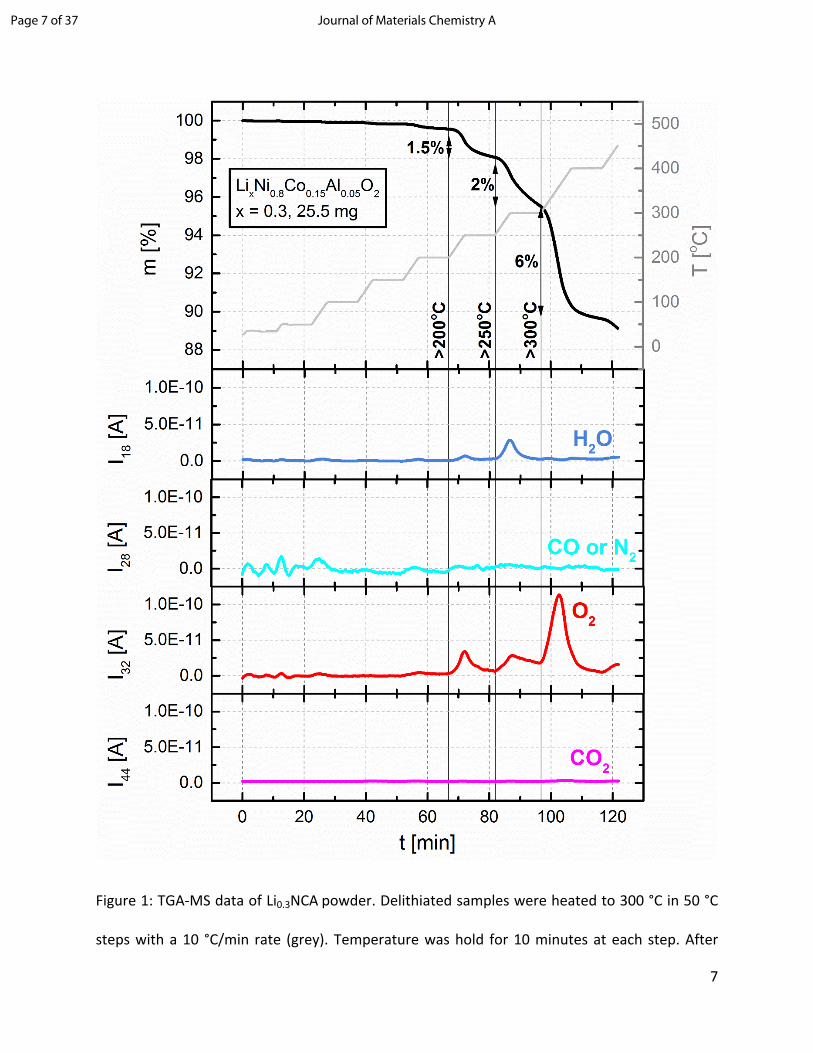
Li0.3NCA thermal behavior and morphological changes. Figure 1 shows the heating profile from
25 °C to 450 °C (grey curve), the associated mass loss (black curve) and the evolution of O2, H2O,
and CO2 (red, blue, purple, respectively). Overall, the sample lost ~12 wt% of its initial mass during
heating to 450 °C. The MS data reveals that the weight loss mainly coincides with the release of
O2. At the transition from 200 to 250 °C and 250 to 300 °C only minor quantities of O2 and H2O
are released, which account for 1.5 and 2.0 wt% mass loss, respectively. The majority of O2 gas is
released at the transition from 300 to 400 °C. This major O2 evolution corresponds to a weight
loss of approx. 6 wt% of the sample mass, which can be easily quantified due to the absence of
other mass signals in this temperature range. Various onset temperatures of significant oxygen
release have been reported in the literature such as 130 °C for NCM811,17 180 °C for charged
Li0.33NCA19 and around 200 °C for charged Li0.1NCA.23 Our results indicate an onset temperature
for oxygen release of 200 °C for Li0.3NCA. A high level of dryness of the investigated sample can
be assumed, since the MS data shows no H2O release at around 100 °C, which would be attributed
to physisorbed water. It was shown previously that LiOH powder decomposes to Li2O via 2 LiOH
→ Li2O + H2O at 400 C in Ar.24 LiOH surface contaminants or –OH groups on NCA’s oxide surface
Page 5 of 37 Journal of Materials Chemistry A

6
may, however, decompose at a lower temperature. Hence, the H2O release at the 200 to 250 °C
and 250 to 300 °C transitions could originate from LiOH impurities or –OH groups on the surface
of the sample.25 There are no quantifiable amounts of CO2 released during heating to 450 °C.
Li2CO3 was shown to decompose only at 700 °C.24 Thus, it is not possible to make a statement
about the presence of Li2CO3 impurities on the NCA surface.
Page 6 of 37Journal of Materials Chemistry A
7
Figure 1: TGA-MS data of Li0.3NCA powder. Delithiated samples were heated to 300 °C in 50 °C
steps with a 10 °C/min rate (grey). Temperature was hold for 10 minutes at each step. After
Page 7 of 37 Journal of Materials Chemistry A

8
reaching 300 °C, samples were heated in 100 °C steps up to 450 °C. Sample mass loss (black) and
evolution of H2O, CO (or N2), O2 and CO2 gases (blue, cyan, red, and purple) were monitored
during the heating process.
Temperature controlled XRD
An in-situ temperature controlled XRD study was carried out to systematically investigate the
absolute thermal behavior of delithiated NCA. T-XRD allows information to be obtained on the
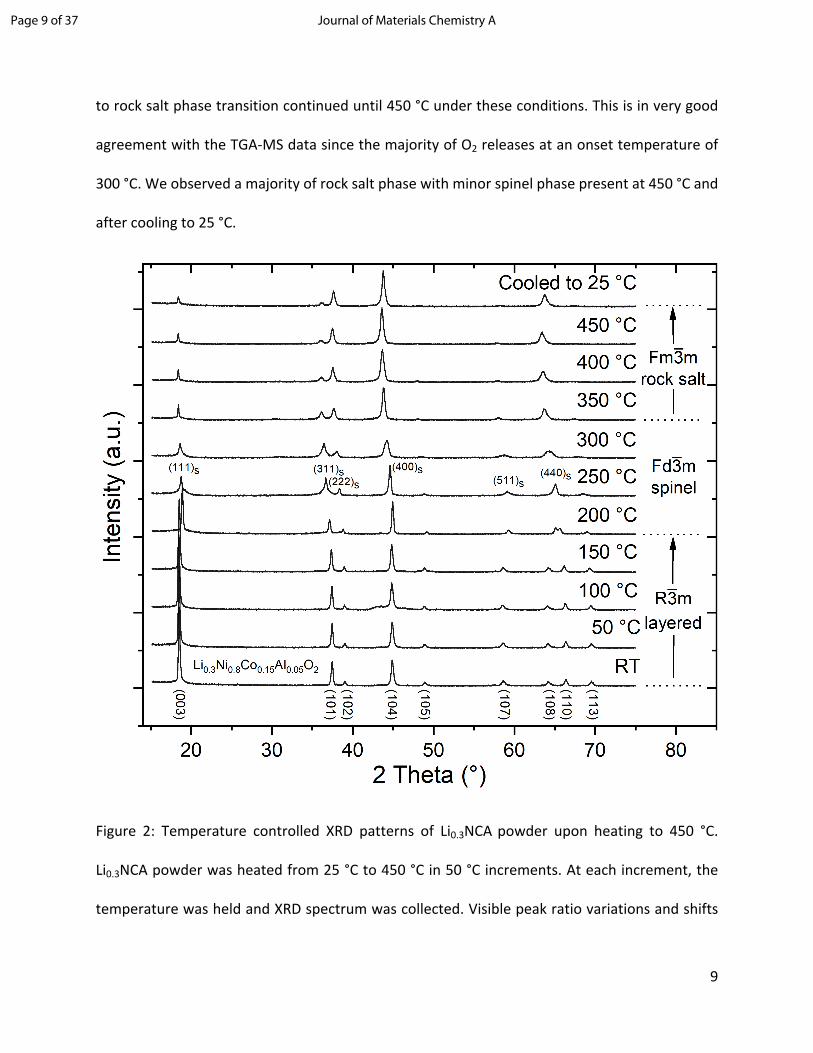
bulk structural changes during thermal stress. Figure 2 shows a series of T-XRD patterns of
Li0.3NCA continuously heated to 450 °C and subsequently cooled to 25 °C. No significant changes
to the rhombohedral structure ( ) of delithiated NCA were detected below 150 °C, and the R3m
obtained diffraction patterns are in good agreement with XRD data reported in literature.19,26
Upon further heating, we observed a phase transition from the layered to the disordered spinel
phase ( to ) starting at about 200 °C completed at about 250 °C. This phase R3m Fd3m
transformation is indicated by the conjoining of the (108) and (110) peaks and decrease in the
intensity ratio between the (003) and (104) peaks of the rhombohedral structure. These changes
indicate that a significant number of cations (Ni, Co and Al) have migrated from the transition
metal layer to the Li layer upon heating to about 250 °C. Subsequently, a second phase
transitioning from the spinel to the NiO-type rock salt phase ( to ) takes place at Fd3m Fm3m
temperatures above 250 °C as marked by the decrease in (311)s and (511)s spinel peak intensities.
This phase transition is accompanied by a major oxygen loss, correlating with the biggest oxygen
loss observed in our TGA-MS results (Figure 1). The intensities of the spinel phase peaks reached
a maximum at about 300 °C, then declined to a very low level at 450 °C indicating that the spinel
Page 8 of 37Journal of Materials Chemistry A
9
to rock salt phase transition continued until 450 °C under these conditions. This is in very good
agreement with the TGA-MS data since the majority of O2 releases at an onset temperature of
300 °C. We observed a majority of rock salt phase with minor spinel phase present at 450 °C and
after cooling to 25 °C.
Figure 2: Temperature controlled XRD patterns of Li0.3NCA powder upon heating to 450 °C.
Li0.3NCA powder was heated from 25 °C to 450 °C in 50 °C increments. At each increment, the
temperature was held and XRD spectrum was collected. Visible peak ratio variations and shifts
Page 9 of 37 Journal of Materials Chemistry A
10
indicate a phase transition from layered ( ) to spinel ( ) and spinel to NiO-type rock salt R3m Fd3m
( ).Fm3m
Soft and hard XAS analysis
Soft X-ray absorption spectroscopy (XAS) probes the changes in the oxidation state of elements
as a function of the depth and, hence, is a vital tool for understanding changes in the valence
state of various elements within the surface and sub-surface region. The depth profiling from
surface to sub-surface can be achieved by varying the detection modality, namely the electron
and fluorescence yield. The smaller mean free path length of electrons offers surface sensitive
information (Auger Electron Yield, ~2 nm (AEY), Total Electron Yield ~5 nm (TEY)); whereas, the
larger escape depth of photons (Fluorescence Yield, ~50 nm (FY)) offers sub-surface details of the
sample.27 The transition metal L-edge spectra (Ni and Co) are based on dipole allowed transitions
starting at the p1/2 and p3/2 energy levels into the empty 3d orbitals (eg*). Due to spin-orbit
coupling of the core hole, the L-edge spectrum is split into two well separated energy bands
namely, the L3 edge (2p3/2) and the L2 edge (2p1/2). Furthermore, 2p-3d interactions and crystal
field effects result in the splitting of these bands into multiplet structures. The shape, energy
position, and branching ratio (L3,high/L3,low) of the multiplets contain information about the
valence state, the spin state, and symmetry of the metal coordination of the samples. Therefore,
any changes observed to the multiplet before and after the heat treatment process indicates the
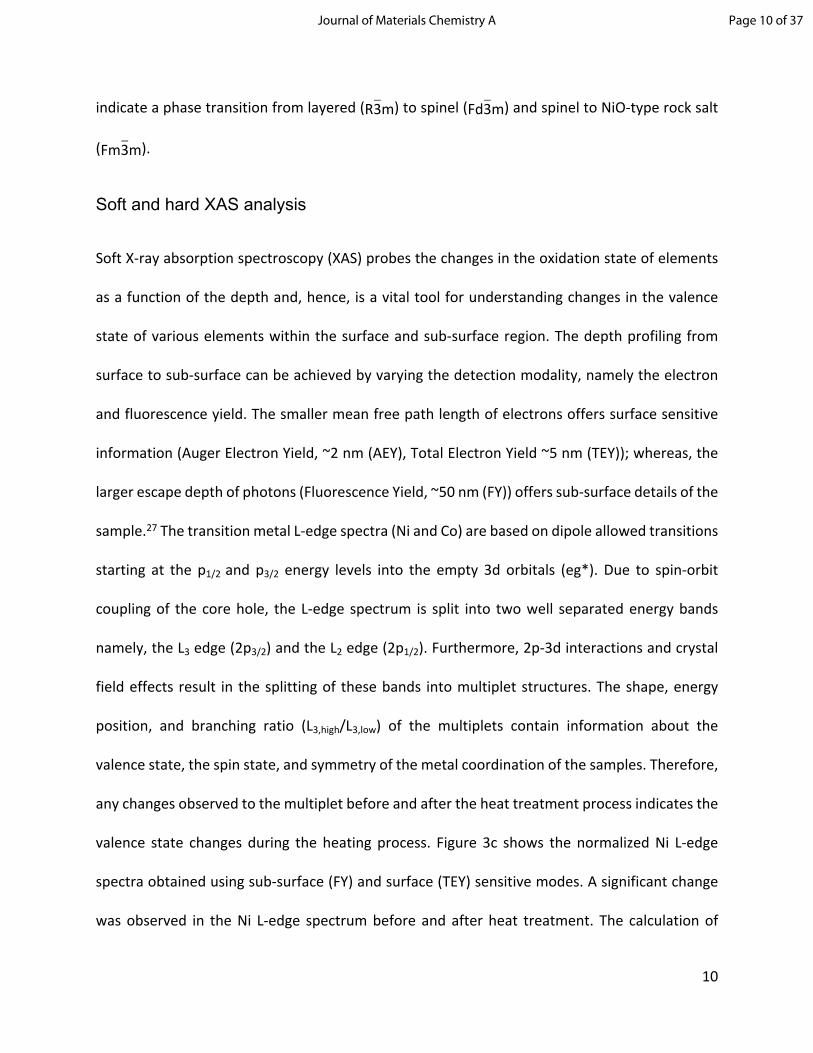
valence state changes during the heating process. Figure 3c shows the normalized Ni L-edge
spectra obtained using sub-surface (FY) and surface (TEY) sensitive modes. A significant change
was observed in the Ni L-edge spectrum before and after heat treatment. The calculation of
Page 10 of 37Journal of Materials Chemistry A

11
L3,high/L3,low ratios shows Ni valence reduction at both probing depths as depicted in Figure 3d. In
order to quantify this reduction, we have measured several Ni containing oxide standards,
namely NiO, NCM111, NCM622, NCM811 and NCA and linked the calculated L3,high/L3,low ratio to
their respective oxidation state (see supplementary Figure S1). After linear fitting of the ratios to
the oxidation states, the resulting correlation allows us to estimate the oxidation state of Ni in
Li0.3NCA heated to 450 °C using the calculated L3,high/L3,low ratios of the TEY signals to +2.06. This
indicates a very severe reduction of Ni in the layered oxide to the level of rock salt (NiO) and also
suggest that there is probably not much Li in the rock salt structure. Figure 3b shows the
normalized Co L-edge XAS spectra. In contrast to the Ni L-edge spectra, the TEY and FY modes
show very minor changes, which illustrates that Co ions are less prone to reduce than the Ni ions
during heating. However, a small peak that appears in the TEY and FY spectra for heat-treated
Li0.3NCA (marked with a plus sign) indicates slight reduction of Co3+ to Co2+. Figure 3a also shows
the O K-edge spectra of the Li0.3NCA before and after heat treatment. The intense absorption
peak around 527.2 eV is associated with the lattice oxygen (metal-oxygen bond) in the layered
oxide (oxygen 1s → metal 3d orbitals hybridized with O 2p). The broad peak features above 534
eV correspond to the O 2p → Ni 4sp transitions and other empty orbitals in this energy region.
The peak observed at 532.3 eV (marked with an asterisk) in the surface sensitive mode (TEY) is
associated with Li2CO3, which is often found on surfaces of layered Ni-rich oxide materials.28,29
Since Li2CO3 is mostly found on the outmost surface of the particle, the corresponding peak
appears only in TEY mode (5 nm). During the delithiation process, the native Li2CO3 layer on the
pristine NCA surface is washed away, resulting in an amplification of the lattice oxygen peak at
527.2 eV. As seen in the Ni L-edge spectra, there is a significant change observed in the O K-edge
Page 11 of 37 Journal of Materials Chemistry A
12
spectra in both the surface and sub-surface regions upon heat treatment. We note the
remarkable decrease in the lattice oxygen peak at 527.2 eV and evolution of the peak at 539.2
eV, which is attributed to the formation of divalent Ni at the surface and sub-surface. These
observations indicate that NiO is formed at the surface and sub-surface upon heat treatment,
consistent with the TGA-MS and T-XRD results.
Figure 3: (a-c) Soft XAS O K-edge, Co L-edge and Ni L-edge spectra for pristine (Li1NCA), delithiated
(Li0.3NCA), and delithiated + heat-treated NCA powders in TEY (5 nm) and FY (50 nm) modes. (d)
Calculated Ni L3,high/L3,low ratios for all samples shown in TEY and FY mode. Peak marked with an
asterisk in (a) is associated with Li2CO3. Plus sign in (b) is indicating slight reduction in Co.
In addition to the surface analysis, we conducted hard X-ray absorption spectroscopy (XAS),
which correlates the changes in the absorption edge to the changes in the average oxidation
state of the absorbing atoms in the bulk material.19,30,31 For example, a forward shift (higher eV)
in edge energies indicates an increased valence state of the atom being probed. Since the core
Page 12 of 37Journal of Materials Chemistry A

13
electrons are more strongly bound to the nucleus in the higher valence state, their photo-
ionization requires higher photon energies, whereas a backward shift (lower eV), in contrast,
indicates a decreased valence state. Figure 4 shows the normalized Ni K-edge X-ray absorption
near edge structure (XANES) spectra for pristine, delithiated (+ heat-treated) NCA, and also NiO
(shown as a reference). While Ni is divalent in NiO and trivalent in pristine NCA, the oxidation
state of Ni in delithiated NCA is estimated to be close to 3.7+, under the assumption, that most
of the charge compensation is done by Ni.32 Using the edge position defined by the Photoelectron
Energy Origin (E0),33 we quantified the changes happening for delithiated heat-treated NCA (450
°C), in relation to pristine NCA (Li1NCA) and delithiated NCA (Li0.3NCA). Additionally, the linear
relationship between the Ni K-edge energy and state of charge (SOC) makes it possible to use the
determined Ni oxidation state as a proxy for pseudo SOC estimations as reported in literature.34–
38 While the edge energy for heat-treated Li0.3NCA is 8340.98 eV, the edge energies of pristine
NCA and Li0.3NCA are 8342.10 eV and 8343.95 eV, respectively. Edge energies were derived from
the 1st inflection point of each spectra. The entire Ni K-edge clearly shifts from higher to lower
energies in the order of delithiated, pristine, and delithiated + heat-treated NCA, indicates a
strong reduction in the Ni oxidation state upon heating. This strong edge shift (2.97 eV) between
Li0.3NCA and heat-treated Li0.3NCA illustrates that the average oxidation state of Ni decreases
significantly to compensate for the oxygen released from the delithiated Li0.3NCA during thermal
excursion. The XANES result is in complete agreement with our TGA-MS, T-XRD and previous
works.19,39,40 It has also been demonstrated that the oxygen release and crystal structure phase-
change are correlated.19 Furthermore, it is believed that the phase transitioning from layered to
rock salt predominantly affects the surface of secondary NCA particles while the core of the
Page 13 of 37 Journal of Materials Chemistry A

14
material still remains as a layered oxide.41 However, recently Zhang et al. have shown phase
transitions can occur below the surface. Using transmission electron microscopy (TEM) they
demonstrated how rock salt domains within the core of the material initiate degradation
phenomena such as intragranular cracks.42,43 Hence, it is of utmost importance to understand the
interplay of the observed effects such as oxygen evolution, phase transition and reduction in
further detail. In order to do so, we have conducted a series of imaging measurements to obtain
chemical and morphological insight into decrepitation of secondary particles.
Page 14 of 37Journal of Materials Chemistry A
15
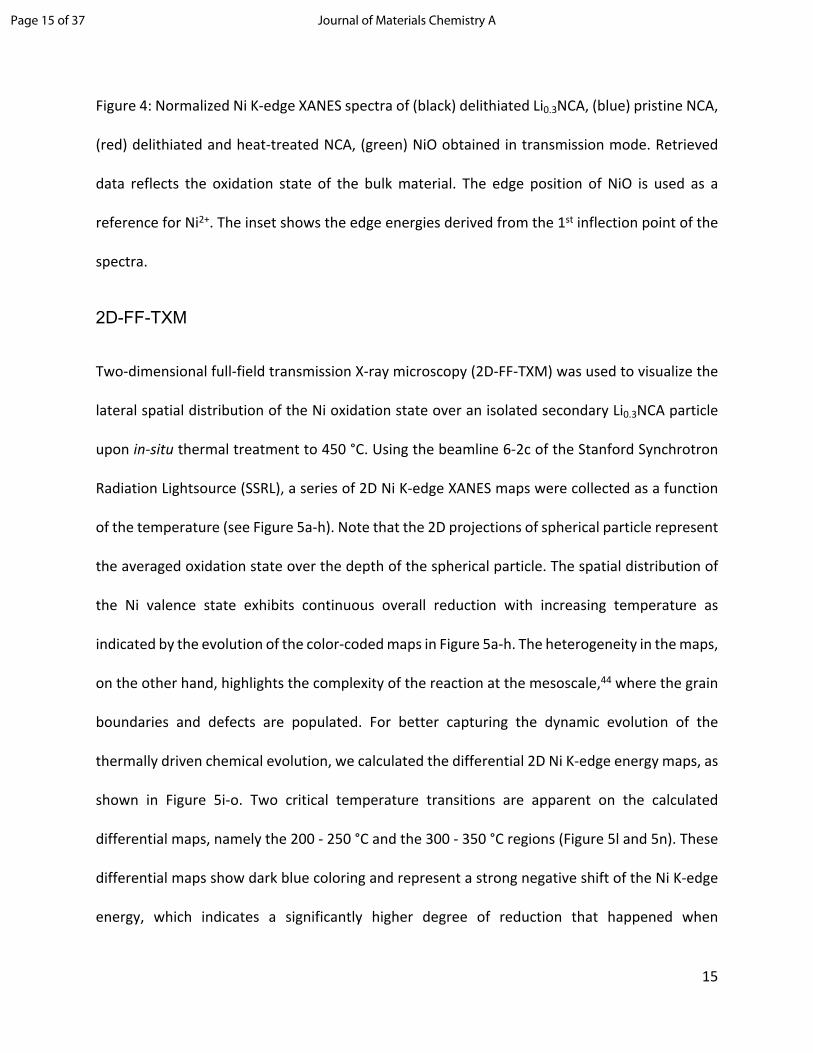
Figure 4: Normalized Ni K-edge XANES spectra of (black) delithiated Li0.3NCA, (blue) pristine NCA,
(red) delithiated and heat-treated NCA, (green) NiO obtained in transmission mode. Retrieved
data reflects the oxidation state of the bulk material. The edge position of NiO is used as a
reference for Ni2+. The inset shows the edge energies derived from the 1st inflection point of the
spectra.
2D-FF-TXM
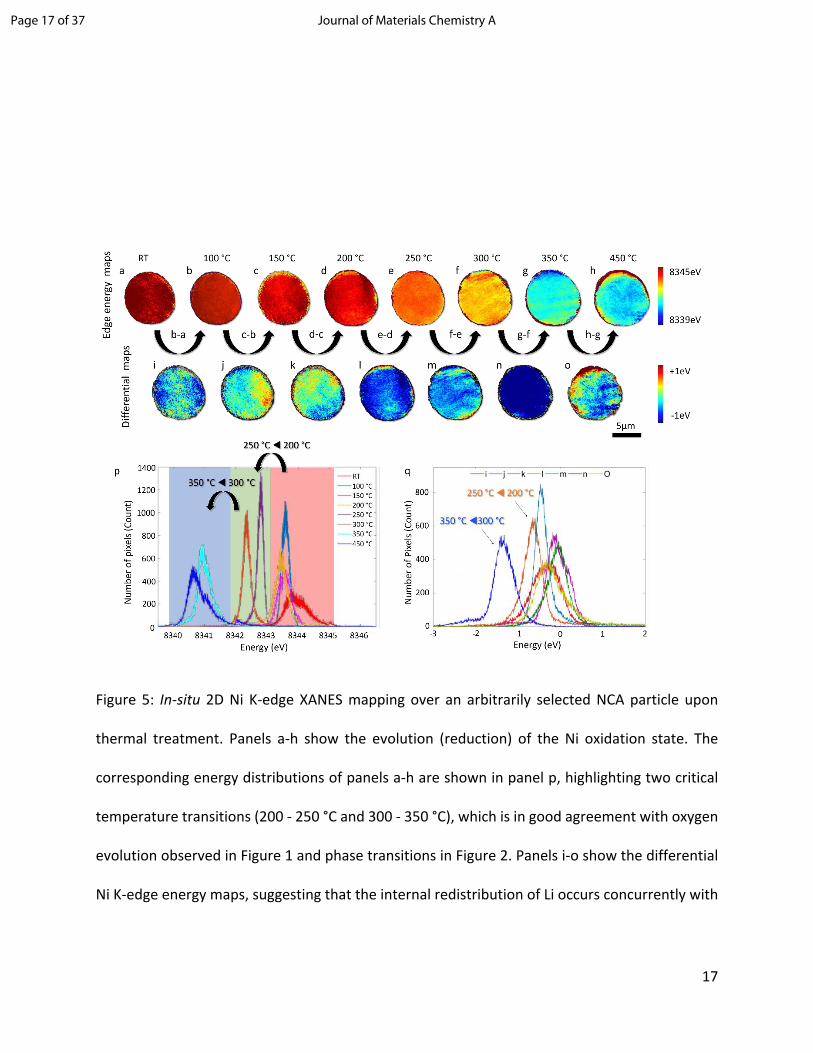
Two-dimensional full-field transmission X-ray microscopy (2D-FF-TXM) was used to visualize the
lateral spatial distribution of the Ni oxidation state over an isolated secondary Li0.3NCA particle
upon in-situ thermal treatment to 450 °C. Using the beamline 6-2c of the Stanford Synchrotron
Radiation Lightsource (SSRL), a series of 2D Ni K-edge XANES maps were collected as a function
of the temperature (see Figure 5a-h). Note that the 2D projections of spherical particle represent
the averaged oxidation state over the depth of the spherical particle. The spatial distribution of
the Ni valence state exhibits continuous overall reduction with increasing temperature as
indicated by the evolution of the color-coded maps in Figure 5a-h. The heterogeneity in the maps,
on the other hand, highlights the complexity of the reaction at the mesoscale,44 where the grain
boundaries and defects are populated. For better capturing the dynamic evolution of the
thermally driven chemical evolution, we calculated the differential 2D Ni K-edge energy maps, as
shown in Figure 5i-o. Two critical temperature transitions are apparent on the calculated
differential maps, namely the 200 - 250 °C and the 300 - 350 °C regions (Figure 5l and 5n). These
differential maps show dark blue coloring and represent a strong negative shift of the Ni K-edge
energy, which indicates a significantly higher degree of reduction that happened when
Page 15 of 37 Journal of Materials Chemistry A

16
transitioning from 200 to 250 °C and from 300 to 350 °C. To confirm our interpretation of the
visualized maps (Figure 5a-o), we plotted the probability distribution of the Ni K-edge energy and
the differential energies of the XANES maps in Figure 5p and 5q, respectively. Figure 5p confirms
a monotonic reduction of Ni upon heating while highlighting two of the major shifts toward lower
energies that appear upon heating from 200 to 250 °C and from 300 to 350 °C. Similar to this, the
probability distributions in the differential maps offer comparable information. It is interesting
to point out that there are positive components in the probability distribution of the differential
maps, which could be attributed to the thermally driven lithium redistribution within the
secondary particle, a phenomenon that has been reported in NCM compounds.45 The highlighted
temperature transitions are in very good agreement with our TGA-MS and T-XRD data. The TGA-
MS shows the most significant oxygen evolution at the same temperature transitions at which
the XRD data shows a phase change. Also in accordance with our XAS data, a clear reduction of
Ni is visible upon heat treatment that seems to be happening homogenously throughout the
particle.
Page 16 of 37Journal of Materials Chemistry A
17
Figure 5: In-situ 2D Ni K-edge XANES mapping over an arbitrarily selected NCA particle upon
thermal treatment. Panels a-h show the evolution (reduction) of the Ni oxidation state. The
corresponding energy distributions of panels a-h are shown in panel p, highlighting two critical
temperature transitions (200 - 250 °C and 300 - 350 °C), which is in good agreement with oxygen
evolution observed in Figure 1 and phase transitions in Figure 2. Panels i-o show the differential
Ni K-edge energy maps, suggesting that the internal redistribution of Li occurs concurrently with
Page 17 of 37 Journal of Materials Chemistry A

18
the overall Ni reduction. The corresponding energy distributions of panels i-o are shown in panel
q.
Page 18 of 37Journal of Materials Chemistry A
19
Particle morphology
In a final step, we investigated morphological changes upon heating on a single particle level
using scanning electron microscopy (SEM) and focused ion-beam-scanning electron microscopy
(FIB-SEM). Several delithiated, as well as delithiated and heated treated particles (450 °C), were
subjected to a surface SEM study and FIB-SEM tomography to highlight morphological changes
throughout the particle and visualize the impact of oxygen evolution on the core, sub-surface,
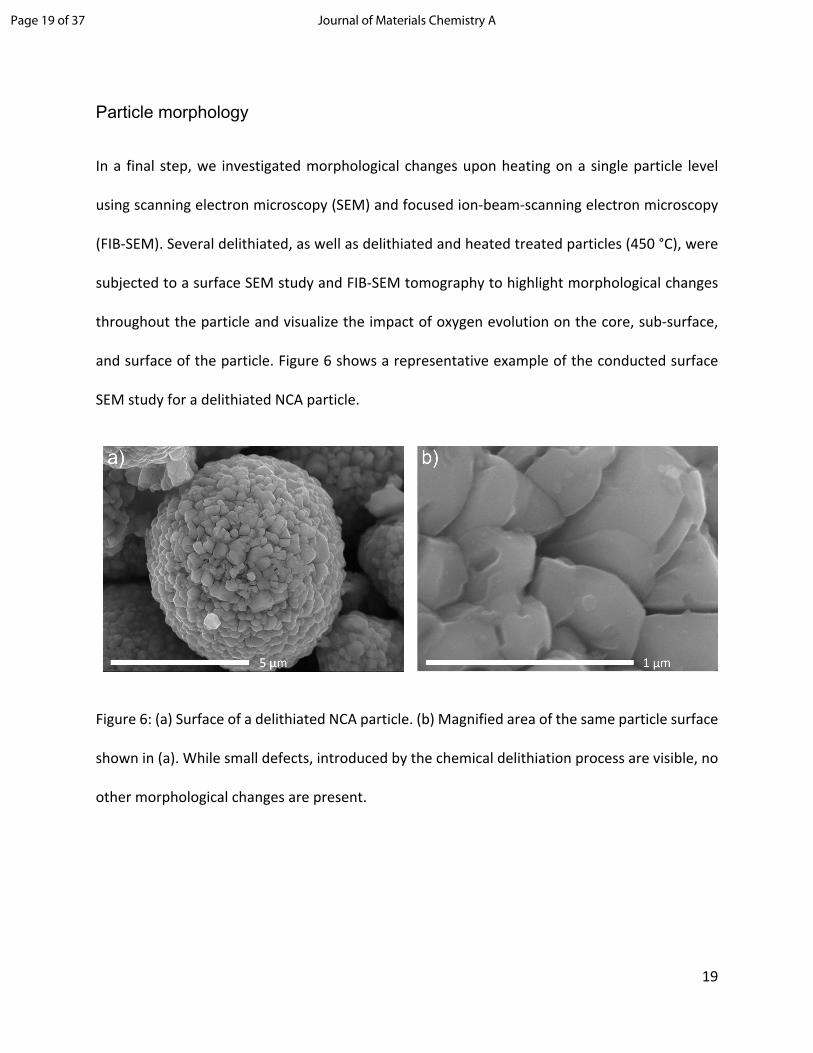
and surface of the particle. Figure 6 shows a representative example of the conducted surface
SEM study for a delithiated NCA particle.
Figure 6: (a) Surface of a delithiated NCA particle. (b) Magnified area of the same particle surface
shown in (a). While small defects, introduced by the chemical delithiation process are visible, no
other morphological changes are present.
Page 19 of 37 Journal of Materials Chemistry A

20
None of the analyzed delithiated NCA particles showed mesopores on the surface even in images
taken at higher magnifications as shown in Figure 6b. Chemical delithiation is widely used to
prepare delithiated cathode materials similar to electrochemically charged cathode, it often
involves strong chemical oxidants e.g., nitronium tetrafluoroborate (NO2BF4) with very high
potentials (~5.1 V vs. Li+/Li).35 Under these conditions, delithiated secondary NCA particles are
fully intact but show slight intergranular cracking similar to electrochemically delithiated
NCA.46,47 In contrast to particles that were only delithiated, delithiated and heat-treated (450 °C)
particles show extensive mesopores on their surface. Figure 7 shows the surface of a heat-
treated, delithiated particle.
Figure 7: (a) Surface of a delithiated and heat-treated NCA particle. (b) Magnified area of the
same particle surface shown in (a). Besides small morphological changes introduced by chemical
delithiation, an extensive amount of uniformly distributed mesopores are visible on the surface.
The observed evolution of mesopores upon heat treatment strongly suggest that oxygen escapes
the surface via mesopores under thermal abuse conditions (more images are shown in
supplementary Figure S2). This is significantly different from electrochemical cycling-induced
Page 20 of 37Journal of Materials Chemistry A

21
surface degradation of layered Ni-rich oxides involving reaction of the cathode surface with the
electrolyte and surface oxygen loss. The latter has been shown to cause stronger electrolyte
decomposition than purely potential driven electro-oxidation of electrolyte, since singlet oxygen
is released from the cathode surface at ~80% delithiation of layered oxides reacts readily with
electrolyte.12,48–50 Potential induced oxygen loss starts at the surface and sub-surface region,
while the bulk mainly stays intact.51–53 In this so-called core-shell model, the degradation of
layered oxide materials is initiated by a transition from a layered phase to a spinel phase.
Ultimately, the surface of the secondary particle transforms to the rock salt phase, the sub-
surface to a spinel phase, while the majority of the core remains in the layered phase.51,53–56 In
the absence of electrolyte, as in our study, the observed mesopores clearly show the evolution
of oxygen from the surface as a result of thermal abuse.
In order to see if mesopores from oxygen release are also present in the core of thermally treated
and delithiated secondary NCA particles, we milled many secondary particles using a focused ion-
beam. Figure 8 shows a representative SEM image showing the cross-section of a milled particle.
Page 21 of 37 Journal of Materials Chemistry A
22
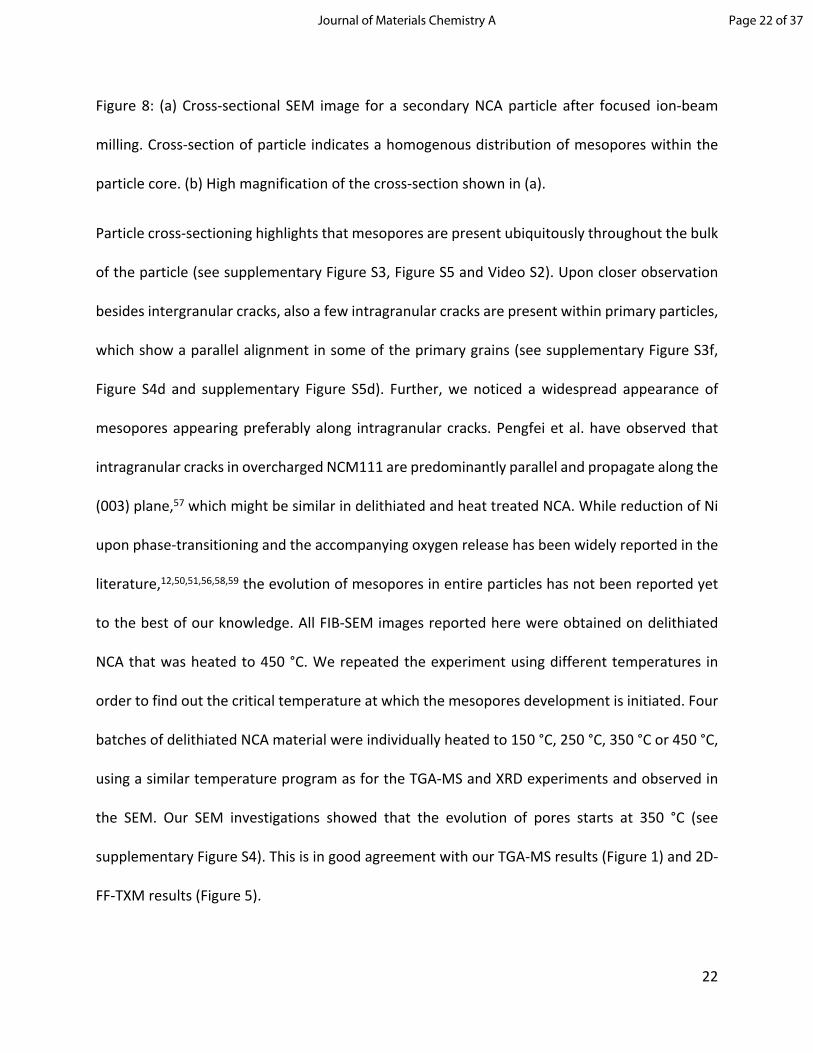
Figure 8: (a) Cross-sectional SEM image for a secondary NCA particle after focused ion-beam
milling. Cross-section of particle indicates a homogenous distribution of mesopores within the
particle core. (b) High magnification of the cross-section shown in (a).
Particle cross-sectioning highlights that mesopores are present ubiquitously throughout the bulk
of the particle (see supplementary Figure S3, Figure S5 and Video S2). Upon closer observation
besides intergranular cracks, also a few intragranular cracks are present within primary particles,
which show a parallel alignment in some of the primary grains (see supplementary Figure S3f,
Figure S4d and supplementary Figure S5d). Further, we noticed a widespread appearance of
mesopores appearing preferably along intragranular cracks. Pengfei et al. have observed that
intragranular cracks in overcharged NCM111 are predominantly parallel and propagate along the
(003) plane,57 which might be similar in delithiated and heat treated NCA. While reduction of Ni
upon phase-transitioning and the accompanying oxygen release has been widely reported in the
literature,12,50,51,56,58,59 the evolution of mesopores in entire particles has not been reported yet
to the best of our knowledge. All FIB-SEM images reported here were obtained on delithiated
NCA that was heated to 450 °C. We repeated the experiment using different temperatures in
order to find out the critical temperature at which the mesopores development is initiated. Four
batches of delithiated NCA material were individually heated to 150 °C, 250 °C, 350 °C or 450 °C,
using a similar temperature program as for the TGA-MS and XRD experiments and observed in
the SEM. Our SEM investigations showed that the evolution of pores starts at 350 °C (see
supplementary Figure S4). This is in good agreement with our TGA-MS results (Figure 1) and 2D-
FF-TXM results (Figure 5).
Page 22 of 37Journal of Materials Chemistry A

23
Besides the observed evolution of mesopores throughout the bulk of the particle, upon thermal
treatment, crack volumes for delithiated particles seem to shrink due to the evolution of
mesopores (see supplementary Figure S5). To see how mesopores affect the intergranular crack
volume, we look at 2D slices of the NCA particles with fixed cross-sectional area before and after
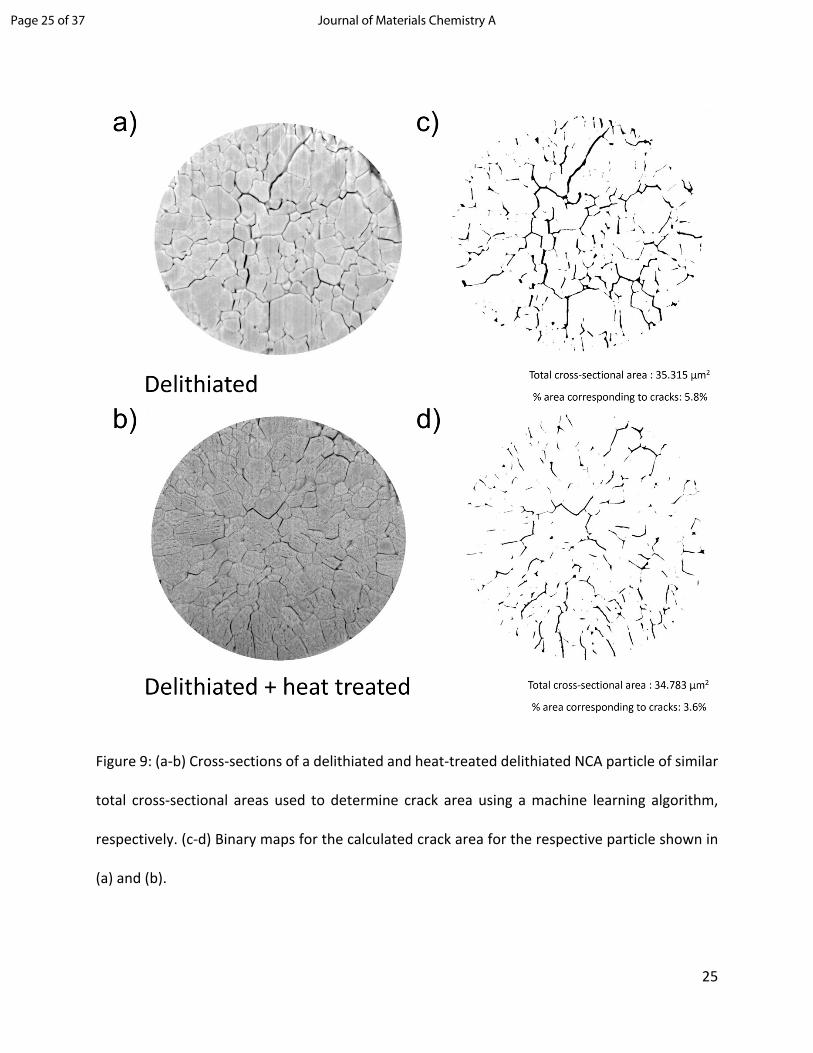
heat treatment (see Figure 9) and compare black area (cracks) to white area (solid phase). A
machine-learning based segmentation was deployed using Trainable Weka Segmentation.60
Several 2D slices of delithiated NCA particles and heat-treated NCA particles were used to train
the machine-learning algorithm. The algorithm was then used to calculate the crack area in the
2D slices (shown in black) resulting from a change in the volume fractions of intergranular cracks
and mesopores for delithiated particles and heat-treated delithiated NCA particles. Although we
just obtain quantitative information about the crack area in a 2D slice of the NCA particles, it is
reasonable to assume that a larger crack area also implies a larger crack volume fraction, as long
as we compare two slices with same cross-sectional area. Interestingly, when comparing
delithiated and heat-treated delithiated NCA particles with similar cross-sectional areas, the total
crack area of heat-treated NCA particles is smaller than that of the delithiated particles (Figure
9c and d). This indicates that mesopore evolution results in increased void volume within primary
particles and thus decreased crack volume within the secondary agglomerate. The expansion of
primary grains has been quantified for milled particles with very similar total cross-sectional areas
(Figure 9) and shows a significant reduction of the total crack area from 5.8% (delithiated particle)
to 3.6% (heat-treated delithiated particle). This calculation was repeated two more times for
pairs of delithiated, and delithiated and heat-treated secondary NCA particles with similar cross-
sectional area. On average, calculated crack area for delithiated particles resulted in 5.33%, while
Page 23 of 37 Journal of Materials Chemistry A

24
delithiated particles showed a crack area of 3.99% after heat-treatment. Even though the crack
area change cannot be directly translated into a change in the crack volume fraction, we
attempted to calculate the volume fraction that is associated with the mesopores by using an
‘apparent crack volume’ obtained from the 2D binary maps in Figure 9c, d and the mass loss
shown in Figure 1. The details of the calculation can be found in the supplementary information.
While the result is quite sensitive to the density of the different NCA phases after heat treatment,
we can get an idea of the mesopore volume. Assuming that the NCA particles after heat
treatment consists of a delithiated layered phase, a disordered rock salt phase, intergranular
cracks and mesopores, the mesopore volume fraction would be between 10 and 20%.
Page 24 of 37Journal of Materials Chemistry A
25
Figure 9: (a-b) Cross-sections of a delithiated and heat-treated delithiated NCA particle of similar
total cross-sectional areas used to determine crack area using a machine learning algorithm,
respectively. (c-d) Binary maps for the calculated crack area for the respective particle shown in
(a) and (b).
Page 25 of 37 Journal of Materials Chemistry A

26
Conclusion
In this paper, we have employed a variety of techniques to thoroughly probe chemical and
morphological changes of chemically delithiated NCA cathode active material that was
continuously heated to 450 °C. Our findings indicate oxygen evolution, phase transitioning, and
continuous reduction of surface, sub-surface, and bulk Ni, and inter- as well as intragranular
cracking and the creation of mesopores upon heating. While our work is in good agreement with
what has been reported previously in the literature for the thermal degradation of delithiated
NCA, it further reveals that oxygen evolution causes mesopores upon heating to temperatures
above 350 °C, creating a pathway for release of lattice oxygen from the bulk and surface. To the
best of our knowledge, this has not been reported before. Furthermore, we observed, that some
of the mesopores seem to follow intragranular cracks, that appear in somewhat parallel manner
within primary grains. These mesopores most probably are part of the compensation of the
internal pressure build up due to oxygen evolution. However, internal pressure build up further
decreases the volume of intergranular cracks suggesting that mesopores lead to a volume
expansion of primary grains. While the chemical and morphological changes appear at
temperatures higher than 200 °C, delithiated NCA shows good short term stability for
temperatures up to 200 °C.
Page 26 of 37Journal of Materials Chemistry A

27
Experimental procedures
Chemical delithiation
Pristine NCA (Li1Ni0.8Co0.15Al0.05O2) cathode active material, of commercial grade, was chemically
delithiated to Li0.3Ni0.8Co0.15Al0.05O2 through oxidation with a 0.1 M solution of nitronium
tetrafluoroborate (NO2BF4) in acetonitrile. The delithiated NCA powder was subsequently dried
in a vacuum oven at room-temperature. The Li ratio in NCA is governed by the ratio of NCA to
NO2BF4 during the oxidation reaction and the elemental stoichiometry was subsequently
determined via inductively coupled plasma – optical emission spectroscopy (ICP-OES) to
Li0.30Ni0.8Co0.15Al0.05O2.
Materials characterization
Thermogravimetric analysis of delithiated NCA powder was performed on a TA Instruments TGA
5500 instrument coupled to a TA Instruments Discovery benchtop quadrupole mass
spectrometer for evolved gas analysis. 25.5 mg of delithiated NCA powder was weighed in a
stainless steel crucible and transferred to the TGA-MS instrument with minimal exposure to
ambient air. After sample insertion, the furnace was purged with Ar for 30 min at 25 °C to
minimize trace amounts of ambient air during the measurement. The active material sample was
heated from 25 °C to 450 °C at 10 °C/min with 10 min hold times at several discrete temperatures.
Mass spectrometer was operated in multiple ion detection mode and recorded m/z of 2, 18, 19,
28, 32, 44 ions with a < 10 s time resolution. Note that the Li0.3NCA powder was stored in a
glovebox and the sample was transferred to the TGA-MS instruments in a closed container
Page 27 of 37 Journal of Materials Chemistry A
28
without exposure to ambient air.
Temperature controlled XRD analysis was performed on a Panalytical X’Pert Pro diffractometer
with monochromatized Cu Kα radiation equipped with an Anton Parr HTK 1200 hot stage. Scans
were collected between 15 and 75° (2θ) at a rate of 0.0001°/s and a step size of 0.022°.
Delithiated NCA powder was heated in air at a rate of 5 °C/min and the XRD patterns were
recorded at a temperature step size of 50 °C with each temperature holding for 10 minutes
before data collection.
Hard XAS data on Ni K-edge was collected in transmission mode using a Si (220) monochromator
at SSRL beamline 4-1. Pristine NCA, as-prepared delithiated NCA as well as delithiated + heat-
treated NCA and NiO powders were dispersed on Kapton films for the measurement. Higher
harmonics in the X-ray beam were rejected by detuning the Si (220) monochromator by 40% at
the Ni edge. Energy calibration was accomplished by using the first inflection points in the spectra
of Ni metal foil reference at 8332.8 eV. XANES data were analyzed by Sam's Interface for XAS
Package (SIXPACK),61 with the photoelectron energy origin (E0) determined by the first inflection
point of the absorption edge jump.
For soft XAS measurements, a thin layer of the samples was spread onto a conductive carbon
tape which was then attached to an aluminum sample holder inside an Ar-filled glovebox.
Measurements for O K-edge, Co L-edge and Ni L-edge were carried out at the 31-pole wiggler
beamline 10-1 at SSRL with a spherical grating monochromator with 20 mm entrance and exit
slits, a 0.2 eV energy resolution and a 1 mm2 beam spot. Data were collected at room
Page 28 of 37Journal of Materials Chemistry A
29
temperature under ultrahigh vacuum (10-9 Torr) in a single load using the total electron yield
(TEY) and fluorescence yield (FY) mode detectors.
2D-FF-TXM imaging was performed at the 54 pole wiggler beamline 6-2c at the SSRL. Detailed
beamline configuration can be found in a previous report62. Delithiated NCA powder was
carefully dispersed in cylindrical quartz capillaries (100 µm in diameter and 10 µm in wall
thickness) and carefully mounted to the beamline sample holder. Slow and steady helium gas
flow was applied to the capillaries to prevent air exposure. The X-ray energy was tuned to Ni K-
edge and then focused onto the sample by an elliptically shaped capillary condenser providing
illumination for a FOV of approx. 30 x 30 µm2. 2D transmission images (0.5 s exposure time, 5
repetitions, binning 2, 1,024 x 1,024 pixels) were collected from 8,313 to 8,394 eV with a
minimum step size of 1 eV. To remove distortions caused by the flux and beam instabilities,
concurrent acquisition of reference images at each energy was also performed through an open
area of the sample (outside the capillary) with the same imaging configuration. The repetitions
in exposures were carried out to enhance the dynamic range of the existing charge-coupled
device and, subsequently, improve the signal to noise ratio in the data. 2D-FF-TXM images were
first acquired at room temperature, upon heating, images were acquired in 50 °C intervals from
100 °C to 350 °C and lastly at 450 °C.
FIB-SEM of delithiated and delithiated + heat-treated particles was performed using a Helios G4
dual-beam FIB. Heat-treatment protocol was adjusted to the same protocol used in our other
experiments. Sectioning of particles was performed using gallium ions at 30 kV and were imaged
using electrons at 5 kV. The currents used for ion and electron beams were 26 pA and 0.1 nA,
respectively. Secondary electron as well as backscattered electron detectors were used for
Page 29 of 37 Journal of Materials Chemistry A

30
imaging. Serial-sectioning and SEM imaging was done every 10 nm and the images were aligned
and reconstructed to create a 3D volume of entire secondary particles.
Acknowledgements
The synchrotron experiments of this research were carried out at the SSRL, a Directorate of SLAC
National Accelerator Laboratory and an Office of Science User Facility operated for the U.S.
Department of Energy Office of Science by Stanford University. Use of the Stanford Synchrotron
Radiation Lightsource, SLAC National Accelerator Laboratory, is supported by the U.S.
Department of Energy, Office of Science, Office of Basic Energy Sciences under Contract No. DE-
AC02-76SF00515. We thank Drs. Erik Nelson and Matthew Latimer for assisting with the
synchrotron experiments. The engineering support from D. Van Campen, D. Day and V. Borzenets
for the TXM experiment at beamline 6-2C of SSRL is gratefully acknowledged. Work at the
Molecular Foundry was supported by the Office of Science, Office of Basic Energy Sciences, of the
U.S. Department of Energy under Contract No. DE-AC02-05CH11231.
Author contribution
S.K. designed this work and prepared delithiated cathode for this study; M.M.B. and S.K. carried
out in-situ XRD, synchrotron XAS and SEM experiments. M.M.B. processed and visualized in-situ
XRD, soft and hard XAS, and surface SEM data. J.A. assisted with in-situ XRD and D.N. assisted
with soft XAS. M.M. performed and analyzed TGA-MS. C.W and Y.L. performed in-situ 2D-FF-TXM
and analyzed the data. J.B. assisted with in-situ 2D-FF-TXM. A.K.S. carried out FIB-SEM and
Page 30 of 37Journal of Materials Chemistry A

31
machine learning experiments. M.M.B. prepared the figures and wrote the initial manuscript
draft under the supervision of S.K. The results were discussed by M.M.B., A.K.S., M.M., J.A., G.S.,
S.H., C.J., J.C., M.M.D., Y.L. and S.K. All authors reviewed the manuscript and approved the final
manuscript.
Page 31 of 37 Journal of Materials Chemistry A
32
References
1 S. T. Myung, F. Maglia, K. J. Park, C. S. Yoon, P. Lamp, S. J. Kim and Y. K. Sun, ACS Energy
Lett., 2017, 2, 196–223.
2 W. Liu, P. Oh, X. Liu, M. J. Lee, W. Cho, S. Chae, Y. Kim and J. Cho, Angew. Chemie - Int.
Ed., 2015, 54, 4440–4457.
3 M. M. Thackeray, S.-H. Kang, C. S. Johnson, J. T. Vaughey, R. Benedek and S. A. Hackney,
J. Mater. Chem., 2007, 17, 3112–3125.
4 T. Ohzuku, A. Ueda and M. Nagayama, J. Electrochem. Soc., 1993, 140, 1862–1870.
5 S. Zheng, R. Huang, Y. Makimura, Y. Ukyo, C. A. J. Fisher, T. Hirayama and Y. Ikuhara, J.
Electrochem. Soc., 2011, 158, A357–A362.
6 Y. Cho, P. Oh and J. Cho, Nano Lett., 2013, 13, 1145–1152.
7 M. Jo, M. Noh, P. Oh, Y. Kim and J. Cho, Adv. Energy Mater., 2014, 4, 1301583.
8 J. Zhao, W. Zhang, A. Huq, S. T. Misture, B. Zhang, S. Guo, L. Wu, Y. Zhu, Z. Chen, K.
Amine, F. Pan, J. Bai and F. Wang, Adv. Energy Mater., 2017, 7, 1601266.
9 P. Yan, J. Zheng, D. Lv, Y. Wei, J. Zheng, Z. Wang, S. Kuppan, J. Yu, L. Luo, D. Edwards, M.
Olszta, K. Amine, J. Liu, J. Xiao, F. Pan, G. Chen, J. G. Zhang and C. M. Wang, Chem.
Mater., 2015, 27, 5393–5401.
10 E. M. Erickson, F. Schipper, T. R. Penki, J.-Y. Shin, C. Erk, F.-F. Chesneau, B. Markovsky and
D. Aurbach, J. Electrochem. Soc., 2017, 164, A6341–A6348.
Page 32 of 37Journal of Materials Chemistry A
33
11 K. Kang and G. Ceder, Phys. Rev. B, 2006, 74, 094105.
12 R. Jung, M. Metzger, F. Maglia, C. Stinner and H. A. Gasteiger, J. Electrochem. Soc., 2017,
164, A1361–A1377.
13 S. M. Bak, K. W. Nam, W. Chang, X. Yu, E. Hu, S. Hwang, E. A. Stach, K. B. Kim, K. Y. Chung
and X. Q. Yang, Chem. Mater., 2013, 25, 337–351.
14 H. Konishi, M. Yoshikawa and T. Hirano, J. Power Sources, 2013, 244, 23–28.
15 I. Belharouak, W. Lu, D. Vissers and K. Amine, Electrochem. commun., 2006, 8, 329–335.
16 I. Belharouak, W. Lu, J. Liu, D. Vissers and K. Amine, J. Power Sources, 2007, 174, 905–
909.
17 S. Bak, E. Hu, Y. Zhou, X. Yu, S. D. Senanayake, S. Cho, K. Kim, K. Y. Chung, X. Yang and K.
Nam, Appl. Mater. Interfaces, 2014, 6, 22594–22601.
18 H. J. Noh, S. Youn, C. S. Yoon and Y. K. Sun, J. Power Sources, 2013, 233, 121–130.
19 K.-W. Nam, S.-M. Bak, E. Hu, X. Yu, Y. Zhou, X. Wang, L. Wu, Y. Zhu, K.-Y. Chung and X.-Q.
Yang, Adv. Funct. Mater., 2013, 23, 1047–1063.
20 W.-S. Yoon, O. Haas, S. Muhammad, H. Kim, W. Lee, D. Kim, D. A. Fischer, C. Jaye, X.-Q.
Yang, M. Balasubramanian and K.-W. Nam, Sci. Rep., 2015, 4, 6827.
21 S. Bak, E. Hu, Y. Zhou, X. Yu, S. D. Senanayake, S. Cho, K. Kim, K. Y. Chung, X. Yang and K.
Nam, ACS Appl. Mater. Interfaces, 2014, 6, 22594–22601.
22 B. Xu, C. R. Fell, M. Chi and Y. S. Meng, Energy Environ. Sci., 2011, 4, 2223–2233.
Page 33 of 37 Journal of Materials Chemistry A
34
23 Y. Huang, Y.-C. Lin, D. M. Jenkins, N. A. Chernova, Y. Chung, B. Radhakrishnan, I.-H. Chu, J.
Fang, Q. Wang, F. Omenya, S. P. Ong and M. S. Whittingham, ACS Appl. Mater. Interfaces,
2016, 8, 7013–7021.
24 H. Beyer, S. Meini, N. Tsiouvaras, M. Piana and H. A. Gasteiger, Phys. Chem. Chem. Phys.,
2013, 15, 11025–11037.
25 R. Jung, R. Morasch, P. Karayaylali, K. Phillips, F. Maglia, C. Stinner, Y. Shao-Horn and H.
A. Gasteiger, J. Electrochem. Soc., 2018, 165, A132–A141.
26 K. W. Nam, W. S. Yoon and X. Q. Yang, J. Power Sources, 2009, 189, 515–518.
27 J. Stohr, NEXAFS Spectroscopy, Springer-Verlag Berlin Heidelberg, 1992.
28 W.-S. Yoon, K. Y. Chung, J. McBreen, D. A. Fischer and X.-Q. Yang, J. Power Sources, 2006,
163, 234–237.
29 J. Xu, E. Hu, D. Nordlund, A. Mehta, S. N. Ehrlich, X. Q. Yang and W. Tong, ACS Appl.
Mater. Interfaces, 2016, 8, 31677–31683.
30 Z. Gong and Y. Yang, J. Energy Chem., 2018, 27, 1566–1583.
31 Y. Terada, K. Yasaka, F. Nishikawa, T. Konishi, M. Yoshio and I. Nakai, J. Solid State Chem.,
2001, 156, 286–291.
32 M. Balasubramanian, X. Sun, X. Q. Yang and J. McBreen, J. Electrochem. Soc., 2000, 147,
2903–2909.
33 K. Saravanan, A. Jarry, R. Kostecki and G. Chen, Sci. Rep., 2015, 5, 8027.
Page 34 of 37Journal of Materials Chemistry A

35
34 A. Manthiram, B. Song and W. Li, Energy Storage Mater., 2017, 6, 125–139.
35 S. Kuppan, Y. Xu, Y. Liu and G. Chen, Nat. Commun., 2017, 8, 14309.
36 W.-S. Yoon, M. Balasubramanian, K. Y. Chung, X.-Q. Yang, J. McBreen, C. P. Grey and D. A.
Fischer, J. Am. Chem. Soc., 2005, 127, 17479–17487.
37 C. Rumble, T. E. Conry, M. Doeff, E. J. Cairns, J. E. Penner-Hahn and A. Deb, J.
Electrochem. Soc., 2010, 157, A1317–A1322.
38 J. Xu, F. Lin, M. M. Doeff and W. Tong, J. Mater. Chem. A, 2017, 5, 874–901.
39 E. Hu, Y. Lyu, H. L. Xin, J. Liu, L. Han, S. M. Bak, J. Bai, X. Yu, H. Li and X. Q. Yang, Nano
Lett., 2016, 16, 5999–6007.
40 S.-M. Bak, E. Hu, Y. Zhou, X. Yu, S. D. Senanayake, S.-J. Cho, K.-B. Kim, K. Y. Chung, X.-Q.
Yang and K.-W. Nam, ACS Appl. Mater. Interfaces, 2014, 6, 22594–601.
41 S. Hwang, S. M. Kim, S.-M. Bak, B.-W. Cho, K. Y. Chung, J. Y. Lee, W. Chang and E. A.
Stach, ACS Appl. Mater. Interfaces, 2014, 6, 15140–15147.
42 H. Zhang, F. Omenya, M. S. Whittingham, C. Wang and G. Zhou, ACS Energy Lett., 2017, 2,
2598–2606.
43 L. Mu, R. Lin, R. Xu, L. Han, S. Xia, D. Sokaras, J. D. Steiner, T. C. Weng, D. Nordlund, M. M.
Doeff, Y. Liu, K. Zhao, H. L. Xin and F. Lin, Nano Lett., 2018, 18, 3241–3249.
44 C. Wei, S. Xia, H. Huang, Y. Mao, P. Pianetta and Y. Liu, Acc. Chem. Res., 2018, 51, 2484–
2492.
Page 35 of 37 Journal of Materials Chemistry A

36
45 C. Wei, Y. Zhang, S.-J. Lee, L. Mu, J. Liu, C. Wang, Y. Yang, M. Doeff, P. Pianetta, D.
Nordlund, X. Du, Y.-C. Tian, K. Zhao, J.-S. Lee, F. Lin and Y. Liu, J. Mater. Chem. A, 2018, 6,
23055–23061.
46 P. C. Tsai, B. Wen, M. Wolfman, M. J. Choe, M. S. Pan, L. Su, K. Thornton, J. Cabana and Y.
M. Chiang, Energy Environ. Sci., 2018, 11, 860–871.
47 C. Tian, Y. Xu, D. Nordlund, F. Lin, J. Liu, Z. Sun, Y. Liu and M. Doeff, Joule, 2018, 2, 464–
477.
48 J. Wandt, A. T. S. Freiberg, A. Ogrodnik and H. A. Gasteiger, Mater. Today, 2018, 21, 825–
833.
49 R. Jung, M. Metzger, F. Maglia, C. Stinner and H. A. Gasteiger, J. Phys. Chem. Lett., 2017,
8, 4820–4825.
50 B. Strehle, K. Kleiner, R. Jung, F. Chesneau, M. Mendez, H. A. Gasteiger and M. Piana, J.
Electrochem. Soc., 2017, 164, A400–A406.
51 S.-K. Jung, H. Gwon, J. Hong, K.-Y. Park, D.-H. Seo, H. Kim, J. Hyun, W. Yang and K. Kang,
Adv. Energy Mater., 2014, 4, 1300787.
52 F. Lin, I. M. Markus, D. Nordlund, T.-C. Weng, M. D. Asta, H. L. Xin and M. M. Doeff, Nat.
Commun., 2014, 5, 3529.
53 F. Lin, D. Nordlund, I. M. Markus, T. C. Weng, H. L. Xin and M. M. Doeff, Energy Environ.
Sci., 2014, 7, 3077–3085.
54 A. Manthiram, K. Chemelewski and E.-S. Lee, Energy Environ. Sci., 2014, 7, 1339–1350.
Page 36 of 37Journal of Materials Chemistry A
37
55 P. Mukherjee, N. V Faenza, N. Pereira, J. Ciston, L. F. J. Piper, G. G. Amatucci and F.
Cosandey, Chem. Mater., 2018, 30, 8431–8445.
56 K. Karki, Y. Huang, S. Hwang, A. D. Gamalski, M. S. Whittingham, G. Zhou and E. A. Stach,
ACS Appl. Mater. Interfaces, 2016, 8, 27762–27771.
57 P. Yan, J. Zheng, M. Gu, J. Xiao, J.-G. Zhang and C.-M. Wang, Nat. Commun., 2017, 8,
14101.
58 H. Zhang, K. Karki, Y. Huang, M. S. Whittingham, E. A. Stach and G. Zhou, J. Phys. Chem. C,
2017, 121, 1421–1430.
59 S. Hwang, W. Chang, S. M. Kim, D. Su, D. H. Kim, J. Y. Lee, K. Y. Chung and E. A. Stach,
Chem. Mater., 2014, 26, 1084–1092.
60 I. Arganda-Carreras, V. Kaynig, C. Rueden, K. W. Eliceiri, J. Schindelin, A. Cardona and H.
Sebastian Seung, Bioinformatics, 2017, 33, 2424–2426.
61 S. Webb, Phys. Scr., 2005, 2005, 1011.
62 Y. Liu, J. C. Andrews, J. Wang, F. Meirer, P. Zhu, Z. Wu and P. Pianetta, Opt. Express, 2011,
19, 540–545.
Page 37 of 37 Journal of Materials Chemistry A