THERMAL STABILrrY OF DISTILLATE Kishenkumar … · 3.4 Identification of n-Dodecane Derived...
199
THERMAL STABILrrY OF DISTILLATE HYDROCARBON FUELS by Kishenkumar Tadisina Reddy Submitted is partial fulfillment of the requirements for the degree of Doctor of Philosophy Approved by Dr. Nicholas P. Principal Investigator Research Sponsored by the NASA Lewis Research Center under Grant No. NAG 3-183 and by Drexel University Department of Mechanical Engineering and Mechanics Drexel University, Philadelphia, PA 19104 October 1987 https://ntrs.nasa.gov/search.jsp?R=19870020273 2018-06-15T08:05:49+00:00Z
Transcript of THERMAL STABILrrY OF DISTILLATE Kishenkumar … · 3.4 Identification of n-Dodecane Derived...

THERMAL STABILrrY OF DISTILLATE
HYDROCARBON FUELS
by
Kishenkumar Tadisina Reddy
Submitted is partial fulfillment of the requirements for the degree of
Doctor of Philosophy
Approved by
Dr. Nicholas P.
Principal Investigator
Research Sponsored by the NASA Lewis Research Center under
Grant No. NAG 3-183 and by Drexel University
Department of Mechanical Engineering and Mechanics
Drexel University, Philadelphia, PA 19104
October 1987
https://ntrs.nasa.gov/search.jsp?R=19870020273 2018-06-15T08:05:49+00:00Z

ABSTRACT
Thermal stability of fuels is expectedto becomea severeproblem in the future due to theanticipateduseof broadenedspecification andalternative fuels. Futurefuels will havehighercontentsof heteroatomicspecieswhich arereactiveconstituentsandareknown to infuence fuel
degradation.
Oneapproachfor studyingthe thermaldegradationproblem is to understandthe detailedbehaviorof aprototypicaldistillatefuel component,i.e., a largen-alkane,andthenextendthestudyto includebinaryandtenaryfuel componentcombinations,etc. To studythedegradationchemistryof selectedmodel fuels,n-dodecaneandn-dodecaneplusheteroatomswereaeratedby bubblingair
throughthefuelsandstressedon amodifiedJetFuelThermalOxidationTesterfacility operatingatheater tube temperaturesbetween 200-400°C. The resulting sampleswere fractionated toconcentrate the soluble products and then analyzed using gas chromatographic and massspectrometrictechniquesto quantify and identify the stablereaction intermediateandproductspecies.
The solubleproductsconsistedmainly of <C12n-alkanesand1-alkenes,<C12aldehydes,tetrahydrofurans,C12 alcohol and ketoneisomers,dodecylhydroperoxides(hypothesized),andC24alkaneisomers.Comparisonof relativeamountsandshiftsin thedistributionof thesespecieswith dopantaddition led to inferencesaboutthereactionmechanisms.Thedatafrom thepresentneatn-dodecaneexperimentsagreedwith thework of Hazlett et al., therebyverifying bothsetsofdata. Also, new products were identified leading to a modification of the existingn-dodecane/oxygenreactionmechanism.
Themodified n-dodecaneoxidationmechanismrequiresthat alkylperoxy radical reactions
dominate in theautoxidation temperatureregime (T < 300°C), while alkyl radical reactions are
important in the intermediate temperature regime (300 _<T _<400°C).
"Heteroatom addition showed that the major soluble products were always the same, with and
without heteroatoms, but their distributions varied considerably. 3,4-dimercaptotoluene and
dibutylsulfide heteroatoms, individually added to n-dodecane, interfere with the hydrocarbon
oxidation chain at the alkylperoxy radical and the alkylhydroperoxide link, respectively.
2,5-dimethylpyrrole heteratom, on the other hand, introduces cooxidation reactions involving
heteroatom and oxygen and, consequently, inhibits ROOH formation. Pyridine, pyrrole and
dibenzothiophene individually added to n-dodecane showed few significant effects.


THERMAL STABILITY OF DISTILLATE
HYDROCARBON FUELS
A Thesis
Submitted to the Faculty
of
Drexe! University
by
Kishenkumar Tadislna Reddy
in partial fulfillment of the
requirements for the degree
of
Doctor of Philosophy
October 1987


ii
ACKNOWLEDGEMENTS
[ would like to thank my advisors, Professors Nicholas
P. Cernansky and Richard S. Cohen for their guidance,
support and co-operation during the past few years of my
doctoral research program. I acknowledge my thesis advisory
committee members, Professors Irwin H. (Mel) Suffet, David
L. Nil ler_ Franklin A. Davis. and Dr. Robert N. Hazlett from
Naval Research Laboratory whose helpful suggestions and
comments contributed to the quality of this work.
My sincere thanks are extended to Patricia A. Partridge
for guiding me through the intricacies and finer points of
analytical and organic chemistry. Right now, I am capable of
calling myself a chemist with a rich and varied experience
in gas chromatography and mass spectrometry. I appreciate
the co-operation of Dr. Hamid Sarv for helping me with the
initial stages of the chromatography data analysis. I would
]ike to thank Dr. Richard D. Wi |k for he|pfu| discussions on
aspects of hydrocarbon reaction chemistry.
The financial support provided by the NASA Lewis
Research Center (Grant No. NAG 3-183) for the early phase er
this work is grateful ly acknowledged. Also, the ongoing
support from Drexel University, which permitted completion
of the work, is appreciated.

iii
Finally, I would like to thank my family for their
patience, support and encouragement during the course of the
work. Besides academia, the experience of a new culture has
been personally enriching.

iv
TABLE OF CONTENTS
LIST OF TABLES .....................................
LIST OF ILLUSTRATIONS ..............................
ABSTRACT ...........................................
CHAPTER 1 INTRODUCTION AND OVERVIEW OF THE PRESENTWORK ....................................
i.i Introduction ................................1.2 Overview of the Present Work ................
CHAPTER 2 BACKGROUND AND LITERATURE SURVEY ........
2.1 Distillate Fuel Stability ...................2.1.1 General Characteristics ................
2.1.2 Effect of Fuel Composition .............
2.1.3 Effect of Temperature ..................
2.1.4 Effect of Deoxygenation ................
2.2 Liquid Phase Oxidation of Hydrocarbons With
and Without Heteroatomlc Species ............2.2.1 Oxidation of Hydrocarbons in the Liquid
Phase ..................................
_.°2._° Co-oxidatlons of Hydrocarbons and
Heteroatomic Compounds .................2.2.2.1 Effect of Heteroatoms on
Neighboring C-H bonds ...........2.2.2.2 Attack on Heteroatom-Hydrogen
Bonds ...........................
2.3 Closure .....................................
CHAPTER 3 EXPERIMENTAL FACILITY AND ANALYTICAL
METHOD DEVELOPMENT ......................
3.1 JFTOT Modification and Operation ............
3.2 Chromatographic/Separation Methods ..........
3.2. 1 GC Parameters ..........................
3.2.2 Peak Profile Analysis Technique ........
3.2.3 Sep-pak Fractionation Scheme ...........
3.2.a Development of GC/On-Column Injection
Technique ..............................
_,.°._ 5 Character Impact Peak Representation . • •
3.2.6 Limitations of the Sep-pak Fractionati_n
Protocol ...............................
_. _,_ Sample Hand] ins ............................3.3. I Vacuum Distil [ation System and Operation
Page
vi
vii
x
1
17
14
14.15202323
25
28"
37
38
3943
4'-3
464'-3505053
SS58
58
5g61
3.4 Identification of n-Dodecane Derived
Reaction Products ..........................
3.5 System Reproducibility .....................
3.5.1 Reproducibility Within a JFTOT
Experiment .............................
3.5.2 Reproducibility of Multiple JFTOT
Experiments ............................
3.5.3 Long Term JFTOT System Reproducibility
CHAPTER 4 NEAT n-DODECANE RESULTS AND MECHANISM
DISCUSSION ..............................
4.1 Temperature Dependence of the Reaction
Products ....................................
4.2 System Verification .........................
4.3 Effect of Dissolved Oxygen ..................
4.4 Modified n-Dodecane/Oxygen Mechanism ........
4.4.1 Autoxldatlon Regime (T < 300C) .........
4.4.2 Intermediate Temperature Regime(300 < T < 400C)
4 5 Conclusions• ...°.°,,°.,..°.°.,,,.,,.,....,.,.
CHAPTER 5 n-DODECANE PLUS DOPANT RESULTS AND
MECHANISM DISCUSSION ....................
5.i Nitrogen Dopant Experiments .................
5.1.1 Pyrrole ................................
5.1.2 Pyridine ...............................
5.1.3 2,5-Dimethylpyrrole (DMP) ..............
5.2 Sulfur Dopant Experiments ...................
5.2.1 3,4-Dimercaptotoluene (DMT) ............
5.2.2 Dibutylsulfide (DBS) ...................
5.2.3 Dibenzothiophene (DBT) .................
5.3 Conclusions .................................
CHAPTER 6 DISCUSSION, CONCLUSIONS AND
RECOMMENDATIONS FOR FUTURE WORK .........
6.1 Fuel Degradation Mechanism: Correlation with
Actual Deposit and Gum Formation Studies ....
S.2 Summary and Conclusions .....................
6.3 Recommendations for Future Work .............
LIST OF REFERENCES
APPENDIX A. MODIFIED JFTOT OPERATING PROCEDURE .....
APPENDIX B. OPERATION OF VACUUM DISTILLATION
APPARATUS ..............................
VITA-.•-..o..o°o.°o.o°.o...o.•.°o.......,.,.o..,.,,
v
Page
6571
72
-2,'-)q w-
89
92
929.4.99105105
113
¢-,z..
124
126127
127
130
134141144146
147
14.158161
164
172
175
177

vi
LIST OF TABLES
Table
3.1
3.4
3.5
3.6
Bond Dissociation Energies .................
Gas Chromatographic Configuration and
Operating Conditions .......................
Sep-pak Fractionation Scheme ...............
Reproducibility of the GC Split Injection
Analysis Technique for n-Dodecane Samples
Collected at 250. 300, 350 and 400C ........
Reproducibility of GC/OCI and GC/Split
Injection Techniques, for n-Dodecane SamplesCollected at 250C ..........................
Changes in Normalized Group I I-IV Peak Areas
with Injection Technique ...................
Reproducibility of the GC/OCI Analysis
Technique for n-Dodecane Polar Fraction
Samples Collected Between 200-_00C .........
Page
4O
51
76
78
86

vli
LIST OF XLMUSTRAT[ONS
Figure
2.1
3.1
3.2
3.3
3.4
3.5
3.8
3.9
3.10
3.11
3.12
3.13
4.1
Mechanism of Sediment/Deposit Formation
(Taylor, 1986) .............................
Modifled Jet Fuel Thermal Oxldatlon Tester
(JFTOT) wlth Sample Withdrawal System ......
GC Peak Profiles of JFTOT Stressed,
Dlstll led n-Dodecane .......................
GC Profiles of Sep-pak Fractions ...........
Duplicate GC Profiles of Sep-pak Fractions
GC Peak Profiles of JFTOT Stressed,As-Received n-Dodecane .....................
Vacuum Distillation Apparatus ..............
GC Peak Profiles of As-Recelved and
Distil led n-Dodecane .......................
Effect of Reaction Time on n-Dodecane + 02
Synthesis Using GC/OCX Analysis of P1Fractions ..................................
Effect of Storage Time on n-Dodecane + O:
Synthesis Samples Using GC/OCI Analysis ofP1 Fractions ...............................
GC Profiles of JFTOT Stressed n-Dodecane
Samples Collected at Various Times During aSingle JFTOT Run at 300C ...................
Selected Group [, I I, I I I and IV Impact
Species From Testing of Aerated n-Dodecane
Total Group I, | [. IX I and IV Products From
JFTOT Testing of Aerated n-Dodecane ........
Selected Group I. If, | IX and IV Impact
Specles From Testing of Aerated n-Dodecane
After One Year .............................
Polar Reaction Products From JFTQT Testing
of Aerated n-Dodecane Using GC/OCI Analysis
Page
16
48
56
57
60
62
64.
68
7O
73
87
88
9O
93

4.3
4.4
_.5
4.6
4.7
4.8
4.9
4. tO
5.1
5.2
5.3
5.4
Non-Polar Reaction Products From JFTOTTesting of Aerated n-Dodecane Using GC/SplitInjection Analysis .........................
Comparison of Aerated n-Dodecane ReactionProduct Profiles ...........................
Effect of Deoxygenatlon on Polar Reaction
Products From JFTOT Testing of n-Dodecane
Using GC/OCI Analysis of P1 Fractions ......
Effect of Oxygenation on Polar Reaction
Products From JFTOT Testing of n-Dodecane
Using GC/OCI Analysis of Pi Fractions ......
Effect of Oxygen Concentration on Non-Polar
Reaction Products From JFTOT Testing of
n-Dodecane Using GC/Spllt Injection
Analysis of Entire Samples .................
GC Peak Profiles of JFTOT Stressed Alr
Saturated and Nitrogen Purged n-Dodecane
Samples at 400C Using GC/Spllt Injection
Analysis ...................................
n-Dodecane/Oxygen Reactions in the
Autoxidatlon Temperature Regime (T ! 300C)
Hydroperoxide Decomposition Reactions in the
Intermediate Temperature Regime (300 ! T !
400C) ......................................
Dodecyl Radical (R*) Reactions in the
Intermediate Temperature Regime (300 ! T !400C) ......................................
Effect of Pyrrole on Group If-IV Species in
the P1 Fractions Using GC/OCI Analysis .....
Effect of Pyridlne on Group II-IV Species in
the Pt Fractions Using GC/OCI Analysis .....
Effect of 2,5-Dfmethylpyrrole on Group If-IV
Species in the Pt Fractions Using GC/OCI
Analysis ...................................
Effect of 3,4-Dimercaptotoluene on Group li-
lY Species in the P1 Fractions Using GC/OC[
Analysis ...................................
viii
Page
95
97
101
102
103
106
108
117
llg
128
129
131
135

ix
Figure Page
5.5 Effect of 3,4-Dimercaptotoluene on Group I
and V Species in the Entire Samples Using
GC/Split Injection Analysis (400C samples) 136
5.6 (n-Dodecane + DMT)/Oxygen Reactions in the
Autoxidation Temperature Regime (T < 300C) 137
5.7 Dodecyl (R*) and DMT Radical (D*) Reactions
in the Intermediate Temperature Regimecaoo ! T i 400C) ........................... 138
5.8 Effect of Dibutylsulfide on Group II-IV
Species in the PI Fractions Using GC/OCI
Analysis ................................... 142
5.9 Effect of Dibenzothiophene on Group II-IV
Species in the Pl Fractions Using GC/OCIAnalysis ................................... 145
6.1 Model Fuel, n-Dodecane Derived ROOH versus
TDR Data (Hazlett, 1979) ................... 149
6.2 Actual Fuel, RAF-177 Derived Oxygenated
Product versus TDR Data (Hazlett, 1979) .... 150
6.3 Model Fuel, n-Dodecane Derived n-Alkane
Product versus TDR Data (Hazlett, 1979) .... 151
6.4 Effect of Oxygen Concentration on R* Radical
Derived Non-Polar Products Using GC/Spllt
Injection Analysis of Entire Samples ....... 153
6.5 R* Radical Contributions from ROOH
Decomposition and RH Pyrolysis Reactions ... 154
ABSTRACT
THERMAL STABILITY OF DISTILLATE HYDROCARBON FUELS
KISHENKUMAR TADISINA REDDY
NICHOLAS P. CERNANSKY
RICHARD S. COHEN
Thermal stability of fuels is expected to become a
severe problem in the future due to the anticipated use of
broadened specification and alternative fuels and to
increased demands on air and ground transportation engine
performance. Future fuels will be derived from coal llqulds,
shale oil, and tar sands and will have higher contents of
heteroatomic species (organic compounds containing nitrogen,
sulfur and oxygen atoms) which are reactive constituents and
are known to influence fuel degradation. As the composition
of present fuels is very complex and the degradation
products are numerous, detailed thermal degradation
mechanisms for in-use distillate fuels are not available;
the addition of reactive heteroatoms only complicates a
difficult problem. A detailed description of the mechanisms
occurring during fuel thermal deEradatlon is desired, since
suitable fuel additives then can be added to control the
fuel instabi|ity problem.

xi
One approach for studying the thermal degradation
problem is to understand the detailed behavior of a
prototypical distillate fuel component, i.e., a large
n-alkane, and then extend the study to include binary and
ternary fuel component combinations, etc. Following this
method, the study of a single component model fuel,
n-dodecane, was undertaken, motivated largely by the
simplifications In degradation chemistry inherent in such
systems. To study the degradation chemistry of selected
model fuels, n-dodecane and n-dodecane plus dopants, were
aerated by bubbling air through the fuels and stressed on a
modified Jet Fuel Thermal Oxidation Tester facility
operating at heater tube temperatures between 200-400C. The
resulting samples were fractlonated to concentrate the
soluble products and then analyzed using gas chromatography
and mass spectrometry techniques to quantify and identify
the stable reaction intermediate and product species.
The soluble products consisted mainly of <C12
n-alkanes and l-alkenes, <C12 aldehydes, tetrahydrofuran
derivatives, C12 alcohol and ketone isomers, dodecyl-
hydroperoxlde (ROOH) decomposition products, and C24
alkane isomers. Comparison of relative amounts and shifts in
the distribution of these species with dopant addition led
to inferences about the reaction mechanisms. The data from
the present neat n-dodecane experiments agreed with the work
of Hazlett e__t.ta___l, thereby verifying both sets of data.
Also, new products were detected and identified, leading to

xii
a modification of the existing n-dodecane/oxygen reaction
mechanism.
The modified n-dodecane oxidation mechanism indicates
that alkylperoxyI radical reactions probably dominate in the
autoxidation temperature regime (T ! 300C). The dominant
path is considered to be for the a|kylperoxyl radical, RO=_,
to react bimolecularly with fuel to yield primarily alkyl-
hydroperoxides. The R02* can undergo self termination and
unimolecular isomerization and decomposition reactions, to
yield smaller amounts of C12 alcohol plus ketone products
and tetrahydrofuran derivatives, respectively. Thus, alcohol
and ketone formation in this temperature regime implies that
the main termination step is via R02* self termination
reactions, which refutes an earlier hypothesis that alkyl
radical termination reactions (giving C2_ hydrocarbon
isomers) are important.
In the intermediate temperature regime (300 ! T !
_OOC), the alkyl radical, R* reactions dominate the RO=*
reactions, since the R* radical products such as n-alkanes
and l-alkenes form in greater concentrations than the R02_
products such as ROOH's, C12 alcohols, C12 ketones and
tetrahydrofurans. The R* radicals form mainly via two
sources: (i) ROOH decomposition reactions which yield stable
reaction products such as C12 alcohols, C12 ketones, <C12
aldehydes and a pool of R* radicals; and (ii) direct fuel
pyrolysis. The R* radicals thus formed have two major
reaction pathways; B-scission forming n-alkanes and
×lit
l-alkenes constitutes the dominant path, while R*
radical dimerization reactions forming C24 alkane isomers
makes up the minor reaction path. Small amounts of
tetrahydrofuran products can be explained by R02*
isomerizatlon and decomposition reactions.
Dopant addition showed that the major soluble products
were always the same, with and without dopants, but their
distributions varied considerably. 3,4-dlmercaptotoluene and
dibutylsulflde dopants, individually added to n-dodecane,
interfere with the hydrocarbon oxidation chain at the
alkylperoxy radical and the alky]hydroperoxlde ]ink,
respectively. 2,5-dimethylpyrrole dopant, on the other hand,
introduces cooxidation reactions involving dopant and
oxygen and, consequently, inhibits ROOH formation. Pyrldine,
pyrro|e and dibenzothlophene, individually added to
n-dodecane showed few significant effects.
CHAPTER 1
INTRODUCTION AND OVERVIEW OF THE PRESENT WORK
I.I INTRODUCTION
Fuel stablllty, or more correctly fuel instability, is
a measure of the Eeneral chemical reactivity of a fuel; It
Is specifically the Eum, sediment and/or deposit forminE
tendency associated with exposure of the fuel either to lone
term storaEe at ambient temperatures (commonly referred to
as storaEe instability) or to short term stress at higher
temperatures (commonly referred to as thermal instability).
Both storage and thermal instability form deEradatlon
products that manifest themselves as harmful deposits in
storaEe tanks, distribution systems, fuel tanks, and
combustion systems, ultimately leadln E to fuel system
malfunctions and/or operatln8 difficulties.
The overall mechanism of sediment and deposit formation
is believed to start with fuel reactlnE with oxyEen forminE
hydroperoxldes, proceeding through a series of reaction
steps formln E soluble and insoluble oxidation products, and
culmlnatlnE with formation of surface deposits and/or
sediments. In Eeneral, hIEher temperatures accelerate the
processes. It should be noted that the sediments and surface
deposits usually represent only a small fraction of the
oxidation products formed durln E fuel deEradatlon and also
of the total fuel in use in the affected equipment. The

2
chemical analysis of the fuel deposits found in aircraft
systems and engines, and sediments found in fuel storage
tanks and fuel distribution systems, indicate that oxygen,
nitrogen and sulfur atoms are highly concentrated in the
deposits and sediments, strongly supporting the importance
of those trace inorganic elements in the deposit/sedlment
formation process.
Fuel stability problems are llkely to become more
severe in the future. There is a tendency towards increased
utilization of broadened specification petroleum based fuels
and alternate fuels from tar sands, coal liquids, and/or
shale oil. Further, the availability of distillate fuels is
being expanded by blending cracked stocks from coking,
vlsbreaklng and catalytic cracking with straight-run or
nonprocessed stocks. All of these fuels tend to have higher
amounts of trace metals and lower hydrogen contents, i.e,
contain relatively higher content of oleflns, aromatics and
heteroatomic compounds. (The heteroatoms include nitrogen,
sulfur and oxygen atoms incorporated in organic compounds).
The presence of these reactive constituents contribute to a
decrease in the stability of the fuel.
Storage instability can be a significant problem even
with distillate fuels such as diesel fuels, No. 2 fuel oils,
and some other distillate fuels, e.g. in strategic reserves
primarily for military purposes and for standby and
emergency type applications (Nixcn, 1962; Goetzlnger et al.,
1983). Consequently, these fuels also must resist
3
degradation. During long term storage, fuels can degrade
producing sediments and/or suspended matter which can cause
aircraft and/or storage site problems. For example, filter
blockage by sediments and deposits can result in failure of
engines to start, loss of power in flight, and reduced
refueling rates. Furthermore, chemical degradation products
can remain in the fuel and lead to other problems in air and
ground transportation fuel systems. For example, peroxides
formed In the fuel can severely attack some fuel system
elastomers, causing them to harden, become brittle and
crack. This type of elastomer failure can result in system
malfunction or complete failure to operate.
Thermal instability is a particular problem in high
performance gas turbines which employ commercial and
mllltary aviation fuels, and other applications in which the
fuel is recirculated and used for injector and component
cooling, i.e., diesel and aviation fuel reclrculatlng
systems. In these applications, fuel temperatures can be
elevated for extended periods of time, thereby accelerating
the deterioration process. Thermal instability was first
recognized as a problem in aviation turbine engines in the
Ig50's. During the 1960's, supersonic aircraft operation
exacerbated the thermal Instability problem _ince the fuel
served as the heat sink for cooling the aerodynamically
heated wing surfaces. Moreover, the continuing trend toward
more severe engine operation (i.e., higher pressures and
temperatures) may increase the thermal stress on fuels.

4
Deposition of solids within the fuel systems of aircraft/
diesel engines may lead to fouled heat exchangers, plugged
fuel nozzles, and/or Jammed fuel valves. This could
result in excessive oil temperatures and non-uniform fuel
spray patterns, causing distorted turblne/englne inlet
temperatures and leading to a reduction in turbine/dlesel
engine llfe times (Brinkman et al., 1979; CRC, 1979;
Peat, 1982).
Although considerable research effort has been devoted
to elucidation and solution of the fuel degradation problem
(mostly by the black box approach), knowledge of the
detailed chemistry is lacking. Previous work, emphasizing
research on Jet fuels, diesel fuels, No. 2 fuel oils, model
fuels (including specific alkanes, oleflns, naphthenes,
aromatics, etc.), and deposits (CRC, 1979; Taylor, 1979:
Daniel, 1983; Goetzlnger et al., 1983; Marteney et al.,
1982; Wong and Bittker, 1983; Li and Li, 1985; Mayo and Lan.
1986), has yielded unclear and, at times, contradictory
information regarding the effects of particular species on
fuel degradation. Also, the chemical interpretation of the
fuel stability data is very difficult, since the fuel
composition is very complex and the fuel deterioration
products are many. Clearly there is a need for the testing
of fuels to monitor their degradation, and to test for their
sediment and deposit forming tendencies. In the longer run,
however, an understanding of the mechanism(s) leading to
sediment and deposit formation must be developed so that

5
future fuels and engines can be designed to minimize these
problems.
Degradation mechanisms for multlcomponent distillate
fuels have been postulated based only on the testing of the
single component fuel n-dodecane (Hazlett etal., 1977).
Therefore, detailed reaction mechanism data in relation to
other components and dopants are lacking. In-use fuels
contain many substances including oleflns, aromatics, and
naphthenes, all of which are more reactive than alkanes.
These fuels contain traces of reactive nitrogen, oxygen and
sulfur containing heteroatoms as well.
As noted, the hete roatoms concentrate in the fuel
deposits, indicating that it is important to determine their
effects during the fuel deterioration process. Previous low
tempera'tufa (<300C) reaction mechanism stud les involving
pure hydrocarbon and heteroatom mixtures has shown that
reactive sulfur, nitrogen and oxygen compounds can cause
changes in the hydrocarbon oxidation chemistry by
introducing additional cooxidatlon reactions, radical
formlng/scavenglng reactions, etc., (Reich and Stlvala,
196g). During thermal instability conditions, the fuel is
exposed to temperatures between ambient and 550C and
oxidation can occur. Therefore, the study of the reactions
involving trace heteroatom interactions with major
distillate fuel components is of consider interest as it
leads to heteroatom plus hydrocarbon oxidation chemistry.
The studies can then be extended to more complex mixtures.

6
In order to develop a more general understanding of
fuel degradation mechanlsms, the present Ph.D. thesis work
was undertaken with the following specific objectives:
(1) to determine the relationships between fuel components
and contaminants and the thermal stability of the fuel; and
(2) to determine the mechanlsm(s) of deterioration and to
further understand the complex reactions occurring before,
durlng and after the deterioration process.
The basic approach was to study model distillate fuels
singly and In combination with deleterious trace component
species. Effects to be tested included the influence of
oxygen In and above the fuel and the influence of
organically bound nitrogen and sulfur containing compounds
in the model fuel. Specifically, n-dodecane was chosen as
the model fuel since it Is a prototyplcal component of
distillate fuels and, additionally, its degradation
chemistry was well studied by Hazlett et al. (Ig77). The
fuels, n-dodecane and n-dodecane plus heteroatomlc species,
were aerated by bubbling air through the fuel and then were
stressed using a modified Jet Fuel Thermal Oxidation tester
(JFTOT) operatlng at temperatures up to 400C. The control
and stressed fuel samples were examined by gas chromato-
graphic (GC) and gas chromatography/mass spectrometric
(GCMS) techniques to determine the concentrations and
identities of stable reaction intermediates and end product
species. Analysis of these data led to inferences about the
mechanisms.
7
Chapter 2 gives additional background information about
the general characteristics of distillate fuel stability,
and presents a review of the pertinent literature in the
areas of liquid phase hydrocarbon oxidation chemistry with
and without contaminating organic heteroatoms. The
experimental facility, system protocols and identities of
the n-dodecane derived reaction products are described in
Chapter 3. Neat n-dodecane system verification results and
modified mechanisms are discussed in Chapter 4, while
Chapter 5 presents the results and mechanisms of n-dodecane
spiked with small amounts of sulfur and nitrogen containing
compounds. Finally, the conclusions of the present work and
recommendations for future work are discussed in Chapter 6.
1.2 OVERVIEW OF THE PRESENT WORK
A standard Jet Fuel Thermal Oxidation Tester (JFTOT)
apparatus primarily monitors the coklng and surface
deposition tendency of aviation fuels. For the present work,
the JFTOT was modified to study the formation of soluble
degradation products in model fuels over a temperature range
of ambient to _OOC, so that several individual samples
could be collected with a single filling of the reservoir.
The control (ambient) and stressed fuel samples collected at
heater tube temperatures of 200, 250, 300, 350 and 400C
were examined by GC and GCMS techniques to determine the
concentrations and identities of stable reaction

8
intermediates and end product species. Analysis of these
data led to inferences about the mechanisms.
As noted, n-dodecane was chosen as the model fuel,
since it is a prototyplcal component of distillate fuels
and, additionally, its deEradatlon chemistry was studied by
Hazlett et al. (1977). Preliminary results showed that 99%
purity, as-received grade n-dodecane contained many
impurities and required additional purification; thus a
vacuum distillation apparatus was developed to further
purify the fuels, n-Dodecane with 99.8% purity (percent peak
area basis during GC analysis) could be obtained from the
distillation process. Tetralin, a second fuel desired for
two-component experiments, also had unacceptable levels of
impurities as-received and required cleanup. However, the
tetralln oxidized during distillation and acceptably clean
tetralln could not be produced. Hence, all experimentation
was only with distilled n-dodecane.
No visible deposition was observed on the JFTOT heater
tubes for all the experiments performed. However, analytical
protocols were developed to separate the control and
stressed fuel samples into several fractions, based on a
polarity separation, and into several reaction product
groups (Groups I-V), based on gas chromatographic analysis.
The reaction products consisted mainly of C5-CI0 n-alkanes
and l-alkenes (Group I-nonpolar), C7-C10 aldehydes (Group I-
polar), tetrahydrofuran derivatives (Group If), dodecanol
and dodecanone isomers (Group I I I), dodecylhydroperoxide
9
(ROOH) decomposition products (Group IV), and C2_ alkane
isomers (Group V). Positive peak identifications for Groups
I, [ I, III and V were done using standard compounds,
retention time matching and GCMS techniques. The Group IV
assignment as hydroperoxides was based upon ROOH synthesis
experiments followed by retention time matching. It Is noted
that the total amount of soluble products formed increased
with JFTOT temperature over the range of temperatures
tested.
During GC analysis, the parent n-dodecane elutes as a
broad peak in the middle of the chromatogram, masking
possible products, and also overloading the GC capillary
column. Therefore, in order to obviate n-dodecane
interference, a sample preparation and fractionation scheme
using Silica Sep-pak cartridges was developed. This scheme
separates unreacted n-dodecane and non-polar reaction
product constituents into the non-polar fractions (NP) using
cyclohexane washes, while polar constituents are
fractionated Into the polar fractions (P) using 2-propanol
washes. Group I-NP and Group V, including the unreacted n-
dodecane, are non-polar In nature and consequently elute In
the first non-polar fraction (NPI fraction). Group I-P and
Group If-IV are polar in nature and elute in the first polar
fraction (PI fraction). Further non-polar washes removed
residual dodecane while further polar washes showed that the
P1 wash contained virtually all of the polar products. Thus,
the Sep-pak fractlonation scheme not only removes the

I0
n-dodecane interference, but also separates the reaction
products into its non-polar and polar constituents.
Sample analysis was done using both split injection and
on-column injection, OCl, techniques. The PI fraction
analysis revealed the presence of thermally labile compounds
(Group IV products) during split injection analysis. Since
the OCl injection technique employs low injection
temperatures (50C versus 280C), the PI fractions were
analyzed using this OCl technique, thereby minimizing Group
IV product break down.
Using the protocols noted above, the analysis of the
control and stressed fuel samples resulted in reasonable
reproduclbl]Ity of the Group I-V product concentrations. In
general, the overall reproducibility including sampling and
GC analysis is a function of individual product groups
(Groups I-V) and JFTOT temperature. At low temperatures (T <
250C), product reproducibility is poor due to very low
concentrations, but it improves considerably at higher
temperatures (T _ 300C). Also, one chromatographically
wel l-resolved character impact peak, CIP, from each of the
I-V Groups were chosen to represent the Group based on their
low data scatter; i.e., the error bars using CIP's are lower
than those using total Groups, thereby simplifying data
interpretation. The details of the Group and CIP I-V
reproducibility at various temperatures can be found in
Chapter 3.
II
Once the reproducibility of the neat n-dodecane product
data was confirmed, the detailed n-dodecane/oxygen reaction
mechanism proposed by Hazlett et al. (1977) was used as a
starting point in explaining the present results. The
presence of autoxidatlon (T ! 300C) and intermediate
temperature (300 ! T ! 500C) regimes was confirmed, but
several additional products such as Group I I tetrahydro-
furans, Group I-P aldehydes and Group V C24 alkane isomers
were also detected as a result of our better analytical
sensitivity. Consequently, the available n-dodecane/oxygen
reaction mechanism was modified to include these products.
The details of the modified n-dodecane reaction scheme can
be found in Chapter 4.
After the detailed degradation behavior of a single
component distillate fuel (neat n-dodecane work) was done,
the study was extended to examine the effects of dopants.
Specifically, n-dodecane was doped with sulfur and nitrogen
containing heteroatomic species selected based on their
reported deposition tendencies, and the mixtures were tested
on the modified JFTOT apparatus. A typical dopant sequence
involved baseline, I0 ppm, iO0 ppm, and i000 ppm (molar
ratios) JFTOT experiments; a 150 cc distilled dodecane
flush; followed by a second baseline JFTOT experiment. Also,
prior to the second baseline experiment, the last portion of
the flush was analyzed on the GC and checked for dopant
carry over. If dopant was detected in trace quantities,

12
additional flushes were carried out until no dopant was
detected.
Subsequently, the control and stressed samples were
analyzed for the major soluble oxidation products using GC
and GCMS techniques. The major soluble products were the
neat n-dodecane oxidation products (Groups l-V), but wlth
significant changes in their distributions. No dopant
related products were detected, however, due either to very
low concentrations (ppb levels) or to a polarity mismatch
between the solvents and the dopant oxygenates during Sep-
pak fractlonatlon. Hence, all dopant mechanism inferences
are based on changes in n-dodecane derived Group I-V product
distributions alone.
During n-dodecane plus heteroatcm compound experiments,
it was found that the data from the pre-lO ppm and post-
iO00 ppm 3,4-dlmercaptotoluene (DMT) baseline tests were
not reproducible, indicating possible carry-over and
contamination problems. Further, this irreproduclbillty cast
doubt on all the baseline and dopant experimental data
obtained up to that time. Consequently, the baseline
n-dodecane reproducibility was reexamined, and the DMT
dopant sequence was duplicated to check and verify the
reproducibility of the dopant data and associated trends.
First, eight baseline n-dodecane JFTOT experiments were
performed in series to establish reproducibility of the
neat n-dodecane Group I-V product concentrations, and the
applicability of the analytical protocols that had been

IS
developed and were being used up to this point. Comparison
of the two sets of DMT data showed that the major data
trends were identical, indicating that the dominant dopant
effects are reproducible. For example, the Group IV products
were progressively inhibited with increasing dopant
concentration in both test sequences. On the other hand, the
minor data trends were not always the same. For example, the
previous iO and iO00 ppm DMT derived Group I I product curves
were slightly inhibited relative to the baseline in the 300-
aOOC range, while the corresponding recent data showed no
such inhibition. In any case, since definitive dopant
mechanistic inferences cannot be made with minor data
trends, they do not affect the overall reaction mechanism
conclusions. Hence, based on the agreement in the major data
trends, the mechanism inferences for the dopant data are not
affected.
Finally, based on the changes in the Group I-V product
distributions with fuel compositional changes, extended fuel
degradation mechanisms were developed. The details of the
n-dodecane plus minor component reaction mechanisms can be
found in Chapter 5.

14
CHAPTER 2
BACKGROUND AND LITERATURE SURVEY
The complex chemical and physical processes involved
in the degradation of fuels have been studied extensively
(Nlxon, 1962; CRC, 1979; Taylor, 1979; Peat, 1982;
Goetztnger et al., 1983). The literature cited here is
primarily concerned with the deterioration of distillate
fuels during thermal stressing. However, as noted, the
degradation problems due to thermal stressing are similar to
those following lonE-term storage. Therefore, in addition to
a detailed discussion of thermal stability, aspects of
storage stability wlll be discussed as well, and differences
and similarities will be highlighted. Also, detaiIs of this
literature are incorporated into the analyses and
discussions in subsequent chapters.
2.1 DISTILLATE FUEL STABILITY
The wlde variety of crude oil types and refinery
techniques result in a multitude of compounds in any end
product fuel and a very diverse nature of distillate
hydrocarbon fuel characteristics. Further, there are
variable thermal stresses imposed on the fuel both in
storage and under high temperature conditions. As a result,
the problem of determining the exact nature of the deposit
mechanlsm(s) is extremely difficult. However, after many
15
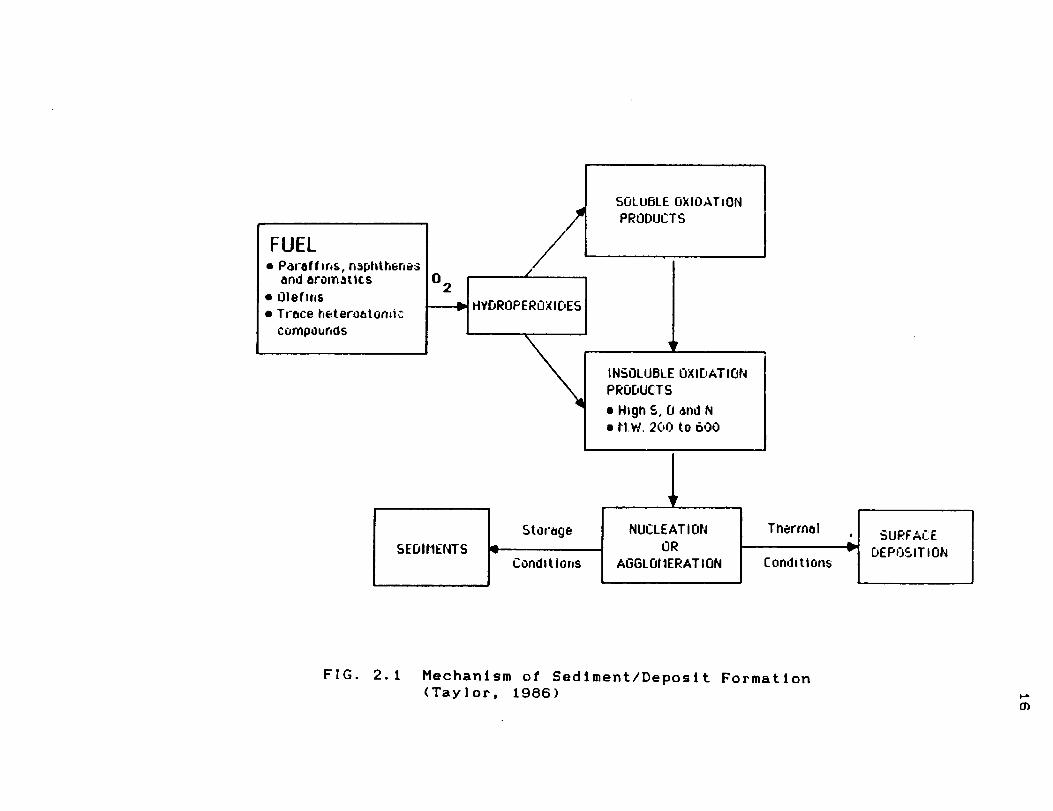
years of investigation, a general theory as to what may
occur has been proposed. Fig. 2.1 illustrates the series of
processes which start with fuel oxidation and lead to
sediments and deposits (Taylor and Frankenfeld, 1986).
2.1.I Genera] Characteristics
It is generally agreed that the reactions between fuel
components and oxygen usually involve complex free radical
autoxidatlve mechanisms (Scott, 1965; Emanuel et al., 1967;
Mayo, 1968). The main features of al I theories include an
initiation reaction of fuel with oxygen to form free
radicals. The free radical reaction rates and products
formed during the free radical chain reactions are dependent
on hydrocarbon structure, temperature, oxygen concentration.
and the presence of catalysts or free radical initiators.
Usually, these free radicals react with oxygen forming
soluble organic hydroperoxides. The hydroperoxides can reach
limiting concentrations and ultimately decompose to form
radicals, which can participate in chain propagating
reactions, and other products. The major hydroperoxide
decomposition products are alcohols_ ketones, aldehydes,
esters, acids and hydroxyketones, dependlng on oxygen
avallability and initial fuel composition (CRC, 1979).
The detailed steps in the converslon of Inltlal
oxidation (soluble) products into insoluble products remains
unclear. However, several hypotheses have been suggested for
the evolution of insoluble products: (1) polymerization -
soluble oxidation products can polymerize resulting in high
16
_o
i
\0
,3)
J
_,rJ
u0
WQe_A
_jo,,-.,
,,..'_
3z_,
_'°
ZuJ
Ov_°
e-
o
Pu')orj
IpZr
0-oE00Ct.
E0(3)
M-,2_v
17
molecular weight compounds, although this may be limited to
dimerlzation and trimerlzatlon (Mayo et al., 1975) ; (li)
increased polarity - reaction products become increasingly
polar as oxidation progresses (supported by high
concentrations of S, O, and N atoms in deposits; Hazlett,
ig81); (Ill) rearrangements and condensation reactions -
studies of heating oil show that thiols can act as catalysts
for oxidation and, after oxidation to sulfonic acids, can
catalyze rearrangements and condensations (Sauer et al.,
1958); and (iv) hydroperoxide thermolysls - studies on Jet
fuel show that the disappearance of hydroperoxldes is
followed by deposit formation (Taylor, 197g).
The composition of these sediments typically includes
low. i.e., 400 to 600, mo|ecuIar weight compounds rather
than polymeric compounds, indicating that oxidized dlmers
and trimers are involved (Mayo and Lan, laSS). Studies
have a|so shown that the quantity of sediments formed is
less than the total quantity of oxidized fuel compounds.
indicating that the solvent characteristics of the oxidized
molecules play a critical role in stability processes. At
storage conditions, insoluble oxidation products must
nucleate and grow in order to form sediment particles large
enough to be trapped by a filter. The evolution of this
process has been followed by light scattering methods (Li
and Li, Ig85).
Examination of surface deposits, on the other hand.
has shown the presence of mlcrospherical particles.
18
typically measuring one to several thousand angstroms in
diameter, which adhere to surfaces and ultimately form thin
solid films (Schirmer, 1970). Metal surfaces are known to
catalyze the deposit formation reaction (Taylor, 1968;
Marteney et al., 1982). For example, Marteney et al. found
that brass surfaces enhance the deposit formation rate
relative to stainless steel and aluminum surfaces. Further,
insoluble oxidized fuel molecules were found to produce
particles whose density was not markedly greater than the
base fuel itself, suggesting that these mlcrospherlcal
particles were formed in liquid phase at or near the metal
surface, perhaps in the boundary layer. The ability of such
particles to adhere to a surface under flowing fuel may also
be a critical property for surface deposit formation
(Taylor and Frankenfeld, 1988). Experimental evidence
supports this hypothesis because with higher flow rates
(i.e., lower bulk fuel temperatures and smaller boundary
layer thicknesses), deposlt formation is lower (Marteney et
a___l., 1982). Thermal stability processes, therefore would be
expected to be significantly influenced by fluid mechanics
including heat and mass transfer effects. Further work is
necessary to elucidate these effects.
Heterogenous catalysls (i.e., metal surfaces) would be
expected to be more important in thermal stability than in
storage stability because of higher temperatures and a
greater surface to volume ratio. Homogenous catalysis (i.e.,
by dissolved metals) can be important in both storage and
19
thermal stability. CoFper has been found to be the most
deleterious metal to fuel stability, while iron, zinc,
beryllium, cadmium, silver and cobalt are less harmful
(Smith, 1967).
Fuel pressure is of significance as it determines
whether liquid or vapor phases predominate at any
temperature. Evidence supports the conclusion that deposits
can form both in the liquid and vapor phases wlth the
presence of both phases causing the greatest amount of
deposits (Marteney et al., Ig82).
During storage instability, color formation in fuel is
often of concern to users, although, color per se is not a
property which affects fuel performance in end-use
equipment. Color is generally measured by light transmission
so that the observed color is the complement of the light
which is adsorbed in the fuel. Species in the fuel which
adsorb in the visual region will thus produce color
depending on their concentration and extinction coefficient
(Nassan, 1983). Fuel molecules which adsorb strongly in the
visual region tend to contain extended aromatic ring systems
and heteroatoms (Nassan, 1983). Since autoxidation of
distillate fuels often involves aromatic heteroatomic
species which are converted to oxidized dlmers and/or
trimers to form extended ring systems, color formation is an
expected result of autoxidation.

20
2.1.2 Effect of Fuel Compos'ttion
Hydrocarbon homologues (i.e., paraffins, naphthenes,
aromatics, olefins, etc.) have been investigated for their
storage and thermal instabilities. The only group which
affected fuel thermal stability was the olefins, with
variable magnitude of deposit formation depending on
structure. The most deleterious unsaturates with respect to
deposit formation included the acetylenes, dl-oleflns and
mono-olefinic aromatics with conjugated side chains (CRC,
1979).
Extensive storage stablllty studles of all distll late
fuels have been performed (Brlnkman e__tta_., 1980; Goetzinger
et al., 1983). Early studies recognized that thermal or
catalytically cracked stocks were more susceptible to
sediment and color formation than straight run fractions.
Oleflns such as conjugated dioleflns or aromatic olefins
were identified as being contributors to instability (Nixon
and Thorpe, 1956).
Heteroatoms were found to exert a strong influenc{) on
surface deposit/sediment formation. In general, heteroatoms
are more easily oxidized than most other hydrocarbons found
in distillate fuels. The ease of oxidation, however, does
not parallel and is not necessarily a guide to the
sedlment/deposlt formation rate. The addition of
heteroatomlc sulfur compounds of the type normally found in
distillate fuels, i.e., thiols, sulfides, disulfides and
condensed thiophene compounds, to straight run fuels such as

21
jet fuel did not increase sediment formation during storage
stability testing (Frankenfeld et al., 1982). However, in
the presence of cracked stocks, the addition of aromatic
thiols causes an increase in sediment and color formation
(Oswald and Noel, 1961). Other sulfur compounds such as
disulfides and polysulfides also increase the rate of
sediment formation in the presence of cracked stocks
(Thompson et al., 1979). Although the role of sulfur
compounds during storage stability testing are partially
understood, thermal stability studies on sulfur compounds
are lacking. Taylor and Wallace (1968) is the only reported
study of sulfur compound effects during thermal stability
testing of aerated Jet fuels. They found that sulfides,
disulfides and thiols accelerate surface deposit formation
while condensed thlophenes had little effect.
Heteroatomic nitrogen compounds have been shown by
a number of investigators to be deleterious to sediment and
color formation at near ambient temperatures (Frankenfeld e___t
al., 1982; Cooney et al., 1988). The nature of the fuel to
which active nitrogen compounds were added influences the
rate of sediment formation, with higher rates being obtained
in diesel fuel than in Jet fuel or n-dodecane (Frankenfeld
et al., 1982). Significant differences in the reactivity of
nitrogen compounds for sediment formation have been
observed. [n general, non-baslc nitrogen heterocycllc
compounds such as pyrrole and indoles have been found to be
harmful for sediment formation whereas other nitrogen

22
compounds such as basic heterocycles of the qulnollne type
are not deleterious (Frankenfeld et al., 1982). Frankenfeld
et al. also noted that the most deleterious species to fuel
stability were a]kylated heterocyclic nitrogen compounds,
and the most reactive of those were compounds with two or
more alky] groups, at least one of which was on a carbon
adjacent to the nitrogen. Sediments formed at high nitrogen
levels (e.g., > 50 ppm N by weight) appear to consist
entirely of oxidized dlmers and trlmers of the reactive
nitrogen compound (Hazlett and Hall, 1981; Frankenfeld et
a__l., 1982). As with sulfur compounds, thermal stability
literature concerning nitrogen compound effects is also
lacking. Taylor and Wal lace (IQ68) and Reynold's (1977) work
appears to be the only reported literature available. They
report that thermal stabillty of Jet fuels spiked with
organic nitrogen compounds enhances the rate of surface
deposit formation. Clearly, there is a need to understand
the thermal instability behavior and chemical mechanisms of
nitrogen compounds (added to other distillate fuels), since
future fuels wl] ! llkeIy have considerably higher contents
of nitrogen relative to fuels in current use.
Heteroatomlc oxygen compounds such as furans,
carboxyllc acids and phenols produced no measurable sediment
formation when added by themselves to jet or dlese] fuel.
However, carboxylic acids interacted with nitrogen
compounds to increase sediment formation in n-dodecane and
jet fuel (Frankenfeld e___ta l., 1Q82). Siml]ar to the

23
situation with sulfur and nitrogen compound literature.
there is a dearth of information regarding the effects of
oxygen compounds during thermal stability testing. Since
binary interactions of oxygen and nitrogen containing
compounds increased sediment formation in model and Jet
fuels (Frankenfeld et al., 1982), it may be worthwhile
studying fuel thermal instability using similar fuel and
dopant combinations.
2.1.3 Effect of Temperature
Storage instability, involving hydroperoxide, color, or
sediment formation at near ambient temperatures over an
extended residence time, is dominated by low temperature (T
< 300C) oxidative reactions. Thermal instability, involving
surface deposition with exposure of fuel to much higher
temperatures over much shorter residence times, is dominated
by intermediate (300 ! T ! 500C) and high temperature (T >
500C) oxidation chemistry. Thus, the importance of various
reactions change as the temperature rises, with pyrolysis
reactions of the more unstable species (especially the free
radicals) competing with oxidation reactions as the
temperature is raised (Hazlett et al., 1977).
2.1.4 Effect of Deoxygenatlon
With the majority of fuels investigated, oxygen removal
improves distillate fuel stability and decreases the amount
of deposits produced in certain aircraft simulator
experiments (Watt et ai.,1968; Faith et al., 1971). However,
several other thermal degradation processes can occur in the
24
absence of oxygen and these can result in fuel degradation
and deposit formation in an oxygen free environment
(e.g., Hazlett et al., 1977).
Studies made to determlne the effects of rue! composi-
tion and environments on deoxygenated systems (Taylor,
1974, 197Ga, 1976b) suggest that deposits are formed by
chemical reactions and physlca| processes different from
those of aerated systems. For example, the effects of adding
specific sulfur compounds are complex. The addition of
sulfldes, disulfides, and thiols increased the rates of
deposit formation in both deoxygenated and aerated fuel
systems, whl]e condensed thiophenes showed no effect with
deoxygenation, the opposite effect to when fuel is aerated
(Taylor and Wal]ace, 1968; Taylor, 1976a). These results
suggest that the deposit formation rate is not always
inhibited with fuel deoxygenation, but also depends on
the type of trace sulfur compounds present in the fuel.
Nitrogen compounds were studied (e.g., pyrro]es, pyridines,
amines, piperdlnes, amides and decahydroqulnollne) and were
found not to promote deposit formation, the opposite effect
to when fuel is aerated (Taylor, 1976b). Oxygen containing
compounds (e.g., hydroperoxldes, carboxylic acids, phenols,
furans, alcohols, ketones and esters) show a variety of
effects, with peroxldlc compounds shown to be highly
deleterious, regardless of structure, even when added at
quite low concentrations (Taylor, 1976b). Also, dissolved

metals were generally less deleterious with respect to
deposit formation in deoxygenated fuels.
2.2 LIQUID PHASE OXIDATION OF HYDROCARBONS WITH AND
25
WITHOUT HETEROATOMIC SPECIES
The study of organic compound reactions with oxygen are
important since they produce energy that drives all life and
most of the mechanical and heat energy used in technology.
Over a wide temperature range, bounded roughly by enzyme-
mediated oxidation at low temperatures and fast combustion
reactions at higher temperatures, are a host of relatively
slow oxidation processes involving free radicals. These free
radical reactions are responsible for the conversion of
hydrocarbons into useful industrial intermediates as well as
for unwanted degradation in fuels, ]Iplds and polymers,
leading to the intensification of environmental pollution.
The fundamental oxidation reactions are typically long
chain free radical reactions which include elementary stages
InvoIvlng chain initiation (the formation of primary free
radicals), chain propagation leading to formation of
hydroperoxides, followed by the molecular decomposition of
the hydroperoxldes, and finally chain termination in which
the active free radicals are destroyed.
The current knowledge of the autcxldatlon of organic
molecules has developed largely from the study of
hydrocarbons, and the reaction schemes are concerned
primarily wlth processes involving oxidative attack either

26
on carbon-hydrogen bonds or on oleflnic double bonds. The
liquid phase oxidation of hydrocarbons at low temperatures
%
(! 300C) have been reviewed extensively (Emanue! et al.,
1967; Brown and Fish, 1969; Mayo, 1968; Mill and Hendry,
1980; Emanuel, 1981).
Interest in hlgh temperature cracking of hydrocarbons
(k 500C) stems from the period during and following World
War I when the rapidly increasing demands for gasoline and
for gasoline of higher octane number led to the development
of a variety of high temperature cracking processes in
petroleum refineries. Scientific interest In hydrocarbon
cracking (pyrolysls) was stimulated by the fact that
hydrocarbon decomposition reactions involved free radicals
as intermediates, and as such, required reaction mechanism
elucidation. Free radical pyrolysis mechanisms were
developed based on studies of low molecular weight
hydrocarbons at atmospheric pressures by Kosslakoff and Rice
(1943). Subsequently, the mechanisms were extended to
include higher molecular weight hydrocarbons and higher
pressures as well (Fabuss et al., 1964).
Even though the autoxldatlon and pyrolysis temperature
regimes have been well studied, information regarding the
intermediate temperature regime (300 ! T ! 500C) is lacking
since the reactions are complex. At these temperatures, the
primary oxygenated product, hydroperoxide, decomposes to
form secondary oxygenated products, i.e., alcohols, ketones,
acids, etc., which are subject to further conversion.

27
For intermediate temperatures, Hazlett et al.'s (1977)
liquid phase n-alkane oxidation study appears to be the only
one of its kind In the literature. Clearly there is a need
to better understand the characteristics of hydrocarbon
oxidation at these temperatures, since the rate of reaction
increases and other secondary reactions become important at
higher temperatures.
Distillate fuels In current use may be considered as
pure hydrocarbon fuels because the heteroatom contents
amount to only a few tenths of one percent. As noted in the
introduction, these trace heteroatomlc species exert
significant deleterious effects on the stability of the
liquid fuels by promoting deposit formation due to storage
and exposure to elevated temperatures. Presently, the role
of. the heteroatoms influencing fuel instability is not well
understood, since distillate fuels contain hundreds of
components which complicate the analysis of the role of
heteroatomlc reaction chemistry. One basic approach is to
study the effects of heteroatoms mixed in model fuel
systems, and then possibly extend the understanding to in-
use fuels. Available literature for model fuel plus
heteroatom systems is restricted to a few selected cases,
i.e., mercaptans and oleflns (Oswald and Ruper, Ig5g),
pyrroles and hydrocarbons (Oswald and Noel, 1981). The
problem is compounded by the fact that the pertinent
literature is concerned only wlth low temperatures.
Information at intermediate and high temperatures, as
28
encountered in thermal stability situations, and the
effects of other heteroatomlc species particularly
deleterious to fuel stability is lacking.
2.2.1 Oxidation of_Hydrocarbons in the Liquid Phase
Durlng the last quarter century, considerable research
has been done on the kinetics and mechanisms of low
temperature liquid phase oxidation by molecular oxygen of
pure hydrocarbons typically found in distillate fuels
(Emanuel et al., 1987; Brown and Fish, 1989; Mayo, 1968;
Mill and Hendry, 1980; Emanuel, 1981).
In many instances, the oxidation takes place in the
presence of various Inhibltors and catalysts, so that the
overall oxidation mechanism is complex. A typical reaction
scheme is shown below:
Initiation
RH
RH +
2RH +
Propagation
R* +
R02* +
--SURFACE--> R* + (*H) (la)
02 --> R* + H02* (Homogenous) (ib)
02 --> 2R* + Hi02 (Homogenous) (lc)
Ot --> ROt*
RH --> ROOH + R*
Decomposition of Peroxide
ROOH
2ROOH
RO* +
ROt* +
ROOH
ROOH
ROOH
(Heterogenous)
--> RO* + *OH
--> RO* + R02* + H,O
--> Products
--> Products
--> Non-radical Products
(4)
(5)
(6)
(7)
(8)
(Fast reaction) (2)
(Slow reaction) (3)

Induced Decomposition of Peroxide
2g
X + ROOH --> Free radlcals (9)
Y + ROOH --> ROH + YO (10)
Z + ROOH --> Inactlve Products + Z (Ii)
M + ROOH --> Free radicals (12)
Self Termination
2R02. --> Inactive products (13)
RH represents the hydrocarbon, ROt* is the corresponding
peroxy radical, and ROOH is the hydroperoxide. X, Y and Z
are three different types of reactants which decompose
organic peroxides, and M is a metal.
Initiation In liquid phase oxidation processes can
occur by heterogenous (Reaction la) and homogenous routes
(Reactions Ib and Ic) forming the alkyl radical. The alkyl
radica'l, R*, reacts rapidly wlth oxygen forming the
alkylperoxy radical, ROt* (Reaction 2). The R02* radical
abstracts a hydrogen from a C-H bond in the hydrocarbon
molecule forming the hydroperoxlde, ROOH, (Reaction 3). The
peroxides can propogate the chain further by
unlmolecular/bimolecular decomposition reactions forming
additional radicals and products (Reactions 4-8).
Metals and certain chemical compounds can accelerate
the decomposition of peroxides at low temperatures, thereby
changing the low temperature autoxidation significantly by
Increasing the initiation and the overall oxidation rate and
also by accelerating secondary reactions (Reactions @-12).

30
The free radicals chain terminate mainly by peroxy radical
self termination (Reaction 13).
For a fixed initiation and termination rate, the rate
of oxidation is controlled by the slow propagation step,
Reaction 3, which ref|ects the strength of the weakest
carbon-hydrogen bond in the hydrocarbon being attacked by a
relatively unreactlve and selective R02. radical. In
general, paraffins and cycloparafflns containing relatively
strong secondary- and tertiary- carbon-hydrogen, C-H, bonds
will oxidize more slowly relative to aromatics wlth weak
benzyllc C-H bonds and oleflns wlth weak allyllc C-H bonds
(Hendry et al., 1974). Also, oleflns can undergo addition of
peroxy radicals (Mayo eta[., 1958) by Reaction 14:
\ I l .
RO0* + C:C ---> RO0-C - C< .... > Products (la)/ \
as well as intermolecular hydrogen transfer from an al lyllc
position to a peroxy radlca!.
C C C
/ \\ / \\ / \\
C C C C C C
: : + : : ---> : :
C C C C 00. C C *
\ / \ / \ /
C C C
C
/ \\
C C
+ : : (15)
C C OOH
\ /
C
This peroxide formed in Reaction 15 is found to be the
principal product (> g5%) under mild temperature conditions
in neat cyclohexane (Mill and Hendry, _980).
[nhibltors, commonly referred to as antl-oxldants, IH.
have been used in a variety of commercial products to slow
deterioration in alr, rubber being among the first to
31
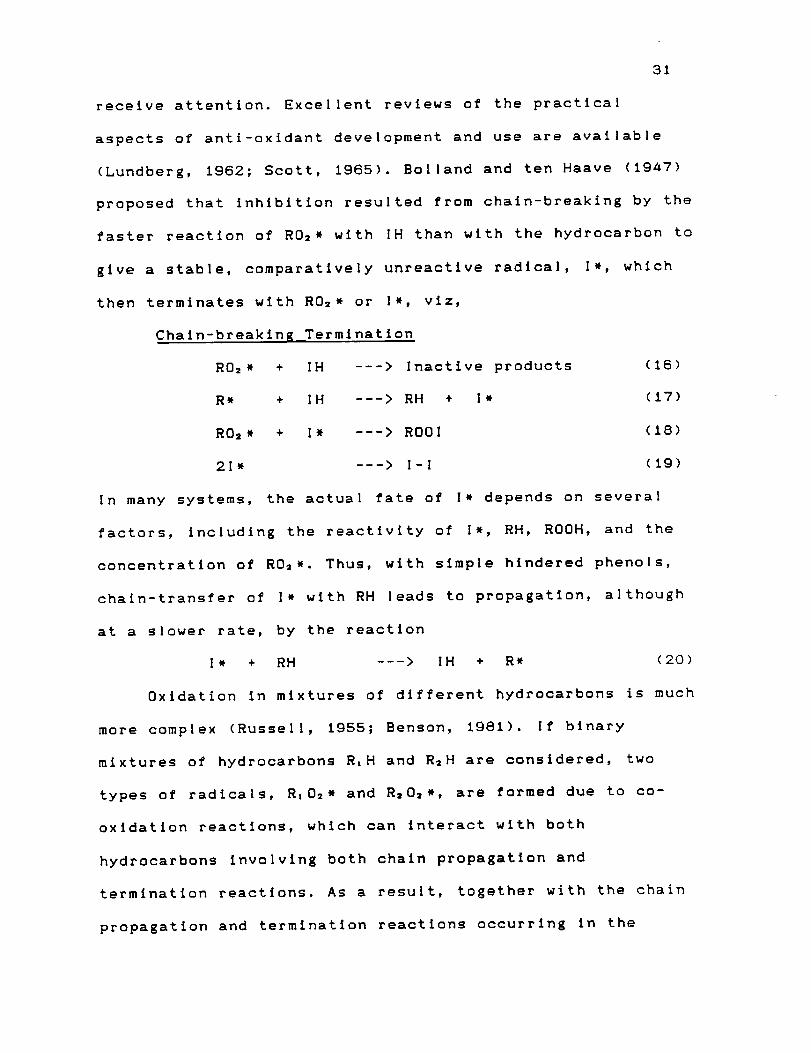
receive attention. Excellent reviews of the practical
aspects of anti-oxidant development and use are available
(Lundberg, 1982; Scott, 1985). Bol land and ten Haave (1947)
proposed that inhibition resulted from chain-breaking by the
faster reaction of R02* with IH than with the hydrocarbon to
give a stable, comparatively unreactive radical, I*, which
then terminates with R02 * or lw, vlz,
Chaln-breaking Termination
RO=* + IH ---> Inactive products (16)
R* + IH ---> RH + I* (17)
RO=* + I* ---> RO01 (18)
2l* ---> I-I (19)
In many systems, the actual fate of I* depends on several
factors, including the reactivity of I*, RH, ROOH, and the
concentration of R02*. Thus, with simple hindered phenols,
chaln-transfer of I* with RH leads to propagation, although
at a slower rate, by the reaction
I* + RH ---> IH + R* (20)
Oxidation in mixtures of different hydrocarbons is much
more complex (Russell, 1955; Benson, 1981). If binary
mixtures of hydrocarbons R,H and R2H are considered, two
types of radicals, R,02* and R=O_*, are formed due to co-
oxidation reactions, which can interact with both
hydrocarbons involving both chain propagation and
termination reactions. As a result, together with the chain
propagation and termination reactions occurring in the

32
oxidation of pure hydrocarbons (R,H and R2H), chain
propagation and termination cross-reactlons also take place:
Cross-Propagatlon
R] 02. + R2H ---> RIOOH + R2* (21)
R202. + RIH ---> R2OOH + R** (22)
Cross-Terminat ion
RL 02" + R202. ---> Products (23)
The cross propagation rate coefficients do not vary
significantly, but the rate of the two self-terminatlon
reactions can vary as much as a factor of 104 . Thus,
as the composition of the mixture is varied from 0-100% of
the other hydrocarbon (R2H), the importance of the various
termination reactions changes accordingly (Russell, 1955).
Additionally, reactions involving alkyl radicals
typically play a significant role in the oxidation of
multlcomponent mixtures at higher temperatures (Rafikova et
a___l., 1971),
R,* + R2H ---> RtH + R2* (24)
R2* + R,H ---> R2H + R,* (25)
whereas at low temperatures the oxygen addition reaction
(R** + 02 ---> R, 02*) dominates due to its low activation
energy relative to Reactions 24 and 25.
As the temperature at which the oxidation occurs is
increased from ambient ]eve]s, the rate of reaction
increases and other secondary reactions become important. In
particular, when peroxides begin to thermally decompose,
they produce alkoxy and hydroxy radicals which are more

33
reactive and less selective compared to peroxy radicals and,
therefore, lead to secondary reactions (Hazlett et al.,
1977). During alrcraft/dlesel engine operation, the
distillate fuels are exposed to relatively high temperatures
(200-400C), making the fuels susceptible to secondary
oxidations. These reactions are known to lead to surface
deposits/sediments in close tolerance fuel system
components, ultimately affecting engine performance. It is
noted that relatlvely few studies dealing with liquid phase
chemistry of large n-alkane hydrocarbons (> C8) at
temperatures higher than those usually encountered during
low temperature autoxidatlon reactions are reported in the
literature.
As temperature increases, additional reaction paths
become important. Above 180C, paraffins in the dlstil late
fuel range can undergo Intramolecular hydrogen abstraction,
or radical Isomerlzatlon, leading to rapid chain branching
(Fish, 196a, 1968; Mil I and Montorsi, 1973; Van Sickle e__t_t
aI., 1973; Jensen et al., 1979; Benson, 1981). These
reactions usually become important only when the competing
intermo]ecular process, notably hydrogen atom transfer and
addition of oxygen, are slow.
The alkylperoxyl radicals abstract a hydrogen from
within the molecule, forming hydroperoxyalkyl radicals,
Reaction 26.

34
-C -(C)n-C .... > -C-(C)n-C ..... > -C-(C)n-C- (26)
00. H 00. ..H OOH
At low oxygen concentrations, the unpaired electron on the
carbon atom of the hydroperoxyalky] radical forms a bond
with the oxygen atom, i.e., C-O bond closure, resulting in
the formation of '0' heterocyclic compounds and hydroxyl
radicals, Reaction 27 (Boss et al., 1973; Van Sickle et al. ,
1973).
\ (C)n / \ (C)n / \ (C)n /
-C' _C .... > -C' _C .... > -C/ \C-
: , \ I \ I
OOH -0-
+ *OH (27)
-O-
OH
At higher oxygen concentrations, especially during
dimethylalkane oxidation (Rust, 1957), the hydroperoxyalkyl
radical can react further with oxygen to yield
dlhydroperoxldes. Jensen e t al. (1979) also reported various
dl- and tri- alkylhydroperoxides during n-alkane oxidation
at 180C.
At higher temperatures, the thermochemistry of peroxy
radical reactions have been evaluated for the gas phase
(Benson, 1965). These data would be expected to be valid for
the liquid phase also, since the intermolecular energies (1-
3 kcal/moI) in relatively non-polar solvents such as
n-alkanes are relatively weak in comparison to the energies
of the covalent bonds (50-100 kcal/mol) (Benson, 1981). The
fraction of the carbon radicals which would be oxygenated if
35
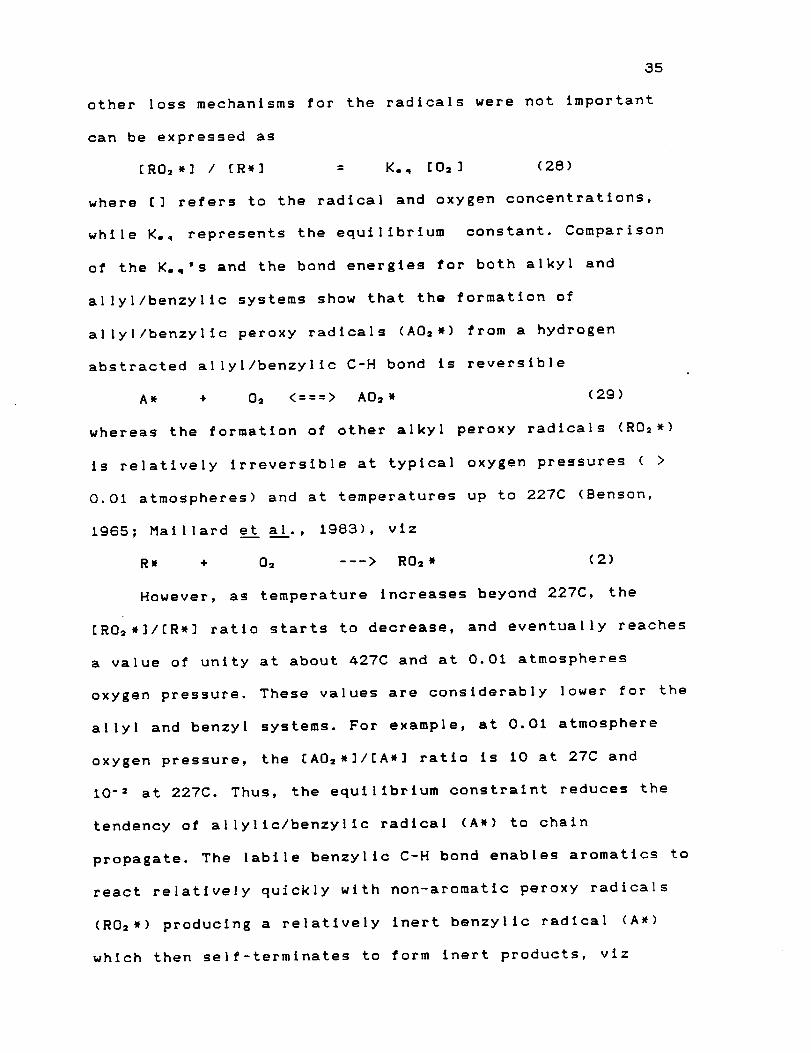
other loss mechanisms for the radicals were not important
can be expressed as
[R02*] / [R*] = K.. [02] (28)
where [] refers to the radical and oxygen concentrations,
while K.. represents the equilibrium constant. Comparison
of the Ko.'s and the bond energies for both alkyl and
allyl/benzyllc systems show that the formation of
allyl/benzylic peroxy radicals (A02*) from a hydrogen
abstracted allyl/benzyllc C-H bond is reversible
A* + 02 <===> A02* (29)
whereas the formation of other alkyl peroxy radicals (R02*)
is relatively irreversible at typical oxygen pressures ( >
0.01 atmospheres) and at temperatures up to 227C (Benson,
1965; Maillard et al., 1983), vlz
R* + O_ ---> R02* (2)
However, as temperature increases beyond 227C, the
[RO,*]/[R_] ratio starts to decrease, and eventually reaches
a value of unity at about A27C and at 0.01 atmospheres
oxygen pressure. These values are considerably lower for the
allyl and benzyl systems. For example, at 0.01 atmosphere
oxygen pressure, the [AO,*]/[A*] ratio is 10 at 27C and
10 -2 at 227C. Thus, the equilibrium constraint reduces the
tendency of allyllc/benzyllc radical (A*) to chain
propagate. The labile benzylic C-H bond enables aromatics to
react relatively quickly with non-aromatlc peroxy radicals
(RO,*) producing a relatively inert benzyllc radical (A_)
which then self-termlnates to form inert products, viz

36
A02* ---> A* + 02 (2gr)
AH + R02* ---> ROOH + A* (16)
A* + A* ---> A-A (19)
The net result is that aromatics with allylic/benzylic C-H
bonds can slow the rate of oxidation of more reactive
species such as normal paraffins at higher temperatures. For
example, toluene, p-xylene, ethylbenzene and cumene were
found to inhibit the rate of oxidation of n-heptane at 350
to 540C, while benzene has no effect (Walling, 1968;
Giammaria and Norris, 1962). These results indicate that, at
temperatures typical of thermal stability conditions,
aromatics wlth benzylic C-H bonds can function as weak
inhlbitors for the oxidation of compounds such as paraffins.
This appears to explain the effect of aromatics on thermal
stability surface deposit formation in pure blends (Taylor,
1969; Hazlett, 1979). Thus, hydrocarbon oxidation at thermal
stability temperatures is much more complex than oxidation
at ambient storage stability temperatures.
At very high temperatures, e.g., greater than 500C,
fuel pyrolysis reactions become important (Kossiakoff and
Rice, 1943; Fabuss et al., 196a). In essence, the first
reaction of the chain is the abstraction of a hydrogen atom
from the hydrocarbon molecule giving a new radical, Reaction
30. This is followed by the unlmolecular decomposition of
the new radical into particular fragments. Since C-C bonds
are much weaker than C-H bonds, the splitting is always at a
C-C bond (at the second C-C bond adjacent to the C-atom from
37
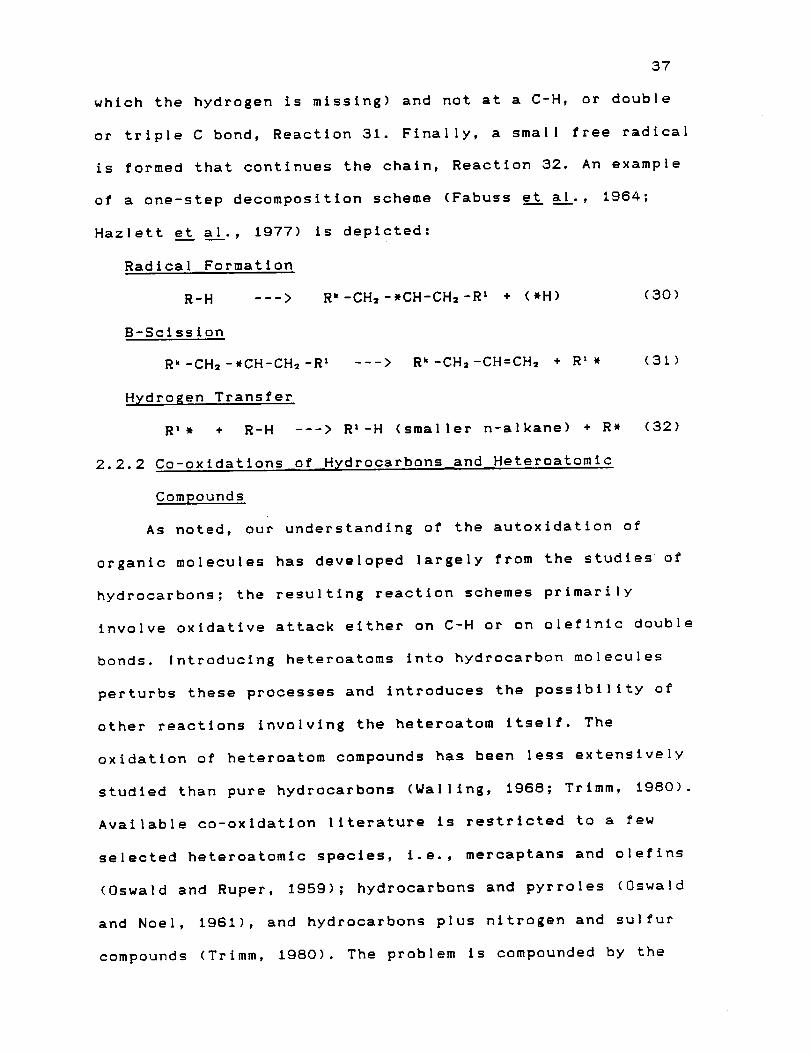
which the hydrogen is missing) and not at a C-H, or double
or triple C bond, Reaction 31. Finally, a small free radical
is formed that continues the chain, Reaction 32. An example
of a one-step decomposition scheme (Fabuss et al., 1964;
Hazlett et al., 1977) is depicted:
Radical Formation
R-H ---> R'-CH,-_CH-CH,-R* + (*H) (30)
B-Scission
Rk-CH2-,CH-CH2-R ' ---> Rk-CH2-CH=CH2 + R** (31)
Hydrogen Transfer
R'* + R-H ---> R'-H (smaller n-alkane) + R* (32)
2.2.2 Co-oxidations of_Hydrocarbons and Heteroatomlc
Compounds
As noted, our understanding of the autoxidatlon of
organic molecules has developed largely from the studies of
hydrocarbons; the resulting reaction schemes primarily
involve oxidative attack either on C-H or on olefinlc double
bonds. Introducing heteroatoms into hydrocarbon molecules
perturbs these processes and introduces the possibility of
other reactions involving the heteroatom itself. The
oxidation of heteroatom compounds has been less extensively
studied than pure hydrocarbons (Walling, 1988; Trimm, 1980).
Available co-oxidatlon literature is restricted to a few
selected heteroatomlc species, i.e., mercaptans and olefins
(Oswald and Ruper, 1959); hydrocarbons and pyrroles (Oswald
and Noel, 1981), and hydrocarbons plus nitrogen and sulfur
compounds (Trlmm, Ig80). The problem is compounded by the

38
fact that the bulk of the available literature concentrates
on the low temperature chemistry. Research at intermediate
temperatures, as encountered in fuel thermal stability
situations, including the effects of other particularly
deleterious heteroatomic species, is lacking.
2.2.2.1 Effect _f Heteroatoms on Neighboring C-H bonds:
In the familiar hydroperoxide chain mechanism for
hydrocarbon autoxldation, with propagation steps
R* + O, ---> R02* (Fast Reaction) (2)
R02* + RH ---> ROOH + R* (Slow Reaction) (3)
Reaction 3 determines the point of oxidative attack on a
molecule and, since it is slow and rate determining, it
strongly influences the over-all rate. Even when they play
no other role, heteroatoms should be expected to affect the
reactivity of neighboring C-H bonds, either by resonanoe
stabilization of the resulting radical or by altering the
polar properties of the transition state. In practice, the
latter is usually the dominant effect (Wailing, 1968).
Oxygen containing heteroatom compounds such as aldehydes and
ethers undergo rapid low temperature autoxldatlon, presum-
ably as a result of the heteroatom affecting the reactivity
of the neighboring C-H bond (Walling, 1988). Autoxldatlon of
sulfides is postulated to occur preferentially at the alpha-
hydrogens (Trlmm, 1980), although Mushrush et al. (198G)
observed a different effect in that the sulfur molecule is
attacked first, forming mainly sulfoxldes.

39
2.2.2.2 Attack on Heteroatom-Hydrogen Bonds: The
feasibility of reactions similar to Reaction S, but
involving attack on hydrogen bonded to an atom other than
carbon, depends initially on the energetics of the process.
Since D(ROO-H) seems to be _ 90 kcal/mol, regardless of R, a
bond strength for hydrogen of this order or lower becomes a
requirement for fast reaction. Table 2.1 lists some bond
dissociation values for isoelectronlc molecules (Walling,
1968).
In the second row elements of the periodic table, the
D(N-H) and D(Q-H) bond energies are large (actually greater
than C-H), and since, as we have already noted, these atoms
facilitate peroxy radical attack on neighboring carbon, it
is not surprising that direct oxidation of amino and alcohol
functions is not usually accomplished by molecular oxygen.
Heteroatom-hydrogen bonds in aromatic compounds such as
aromatic amines, thlols and phenols are relatively weak and
lead to the formation of the corresponding radical.
AQH + RO0_ ---> ROOH + AO_ (33)
A2NH + RO0_ ---> ROOH + A2N_ (34)
However, such heteroatom radicals wil[ not add oxygen to
form a peroxy radical; thus, they wil] not chain propagate
and their reactivity results in their being strong
Inhlbitors of hydrocarbon oxidation. [t is noteworthy that
Reactions 33 and 34 are much faster than 3, even when the
overall energetics appear comparable. Apparently reactions
forming and breaking C-H bonds tend to be slower than iso-
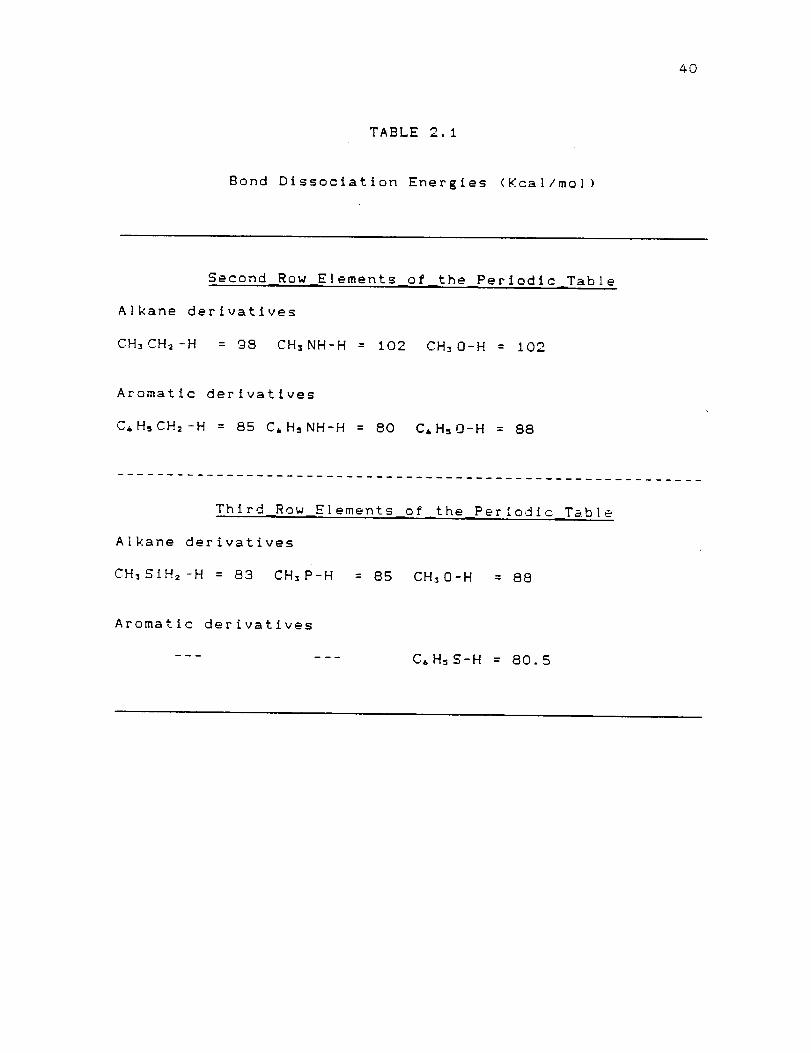
4O
TABLE 2.1
Bond Dissociation Energies (Kca]Imol)
Second Row Elements of the Periodic Table
Alkane derivatives
CH=CH2-H = 98 CH=NH-H = 102 CH=O-H = 102
Aromatic derlvatlves
C_H_CH2-H = 85 CIH_NH-H = 80 C.H=O-H = 88
Third Row Elements of the Periodic Table
Alkane derivatives
CH=SfH2-H = 83 CH=P-H = 85 CH=O-H = 88
Aromatic derivatives
C6H_S-H = 80.5

41
energetic processes involving hydrogen bonds to most other
elements of the periodic table, suggesting easier peroxy
radical attack. However, examples of simple hydroperoxlde
chain processes are relatively few.
Autoxidation of mercaptans, RSH, gives rise to thiy]
radicals (RS*), but these, llke phenoxy radicals, are inert
toward oxygen and normally dlmerlze to disulfides.
RS* + RS* ---> RS-SR (35)
In the presence of olefins, however, mercaptans participate
in co-oxidatlve chain reactions in which the thiyl radicals
add to the oIefins to form a hydroperoxlde (Kharasch et al.,
1951).
RS* + CH2 = CHR' ---> RSCH2 CHR' (36)
00"
RSCH2CHR' + 02 ---> RSCH2CHR' (37)
00. OOH
RSCH2CHR' + RSH ---> RSCH2CHR' + RS* (38)
It is generally found that the hydroperoxide initially
formed undergoes further reaction. The co-oxidation
reactions of thiols and olefins appear to be responsible for
the deleterious effect of aromatic thiols on fuel storage
stability (Oswald et al., 1962).
It is generally accepted that certain alkyl and aryI
mono-, di-, and poly-sulfldes act as antl-oxldants and
prevent the free radical oxidation of hydrocarbons (Scott,
1965). The antl-oxldant mechanism of these compounds has
been the focus of considerable research which has shown that

42
sulfides can act both as hydroperoxide decomposers
(KoelewlJn and Berger, 1974), and free radical scavengers
(Koelewijn and Berger, 1972). The mechanism for
hydroperoxide decomposition is not certain, but is generally
accepted to be:
R, SR, + ROOH ---> R, SOR_ + ROH (39)
The sulfide R, SR2, reacts with ROOH, forming sulfoxide,
R, SOR2, and an alcohol. Previous work has established
that (1) the effect of the sulfide is catalytic, and (it)
the catalyst that decomposes the hydroperoxldes is
not the sulfide but a product that is formed from the
su|flde. Circumstantial evidence has indicated that the
catalyst is sulfur dioxide (Bridgewater and Sexton, 1978).
The sulfide will be a free radical scavenger if the
sulfur-oxygen compound that is formed by oxidation can
decompose to form a sulfenic acid. Thus, if the sulfoxide
formed via Reaction 39 is active, it becomes the precursor
to the real antl-oxidant, a su|fenlc acid (R, SOH), via
Reactions 40-42.
R, SOR, ---> R, SOH + R2" (40)
R, SOH + RO0* ---> ROOH + R, SO. (41)
R, SO* ---> Inert Products (42)
The antl-oxldant nature of sulfides at low temperatures
appears to explaln the neEliEible effect of sulfides on
model fuel storaEe stability (Frankenfeld etal., 1982).
These results are in sharp contrast to the results of
therma| stability studies (Taylor and Wallace, 1968), in
43
which sulfide and disulfides were quite deleterious to Jet
fuel stability. The formation of deposits under high-
temperature conditions apparently proceeds by reaction
pathways different than in the ambient storage conditions.
Heterocycllc compounds containing a flve-membered ring
with one nitrogen atom such as pyrroles, Indoles, and
carbazoles in the form of alkylated derivatives are found in
small quantities in petroleum products. The oxidation of
these compounds is suggested to occur by molecular oxygen
involving peroxldlc intermediates (Oswald and Noel, 1961).
Sediments resulting from co-oxldations of 2,5-dlmethyl-
pyrrole (DMP) and n-decane show that they are made
of repeating units of oxidized DMP. This result suggests
that DMP derived oxide radicals, DMPO*, are involved in
self-condensatlon reactions (Frankenfeld et al., 1982),
which supports the peroxidatlon theory postulated by earlier
workers. The position of substltuents on the nitrogen
heteroatoms greatly influences their reactivity; alkylation
adjacent to the nitrogen atom is the easiest to oxidize,
while nltrogen-alkylatlon appeared to be relatively stable
towards air oxidation. The reactivity of nitrogen hetero-
cycles towards oxygen was suggested to parallel sediment
formation in model fuels (Frankenfeld et al., 1982).
2.3 CLOSURE
In summary, the available literature shows that the
autoxidation (! 300C) and high temperature (_ 500C) liquid

44
phase oxidations of hydrocarbons have been studied
extensively, while information regarding the intermediate
temperature regime (300 ! T ! 500C) is lacking. This
temperature regime needs to be investigated further, since
distillate fuels are being exposed to such temperatures
during alr/ground transportation engine operation, causing
sedlment/deposlt formation and adversely affecting engine
operation. Previous work in thls temperature regime has
shown that the reactions are very complex. In particular,
the primary oxygenated product, hydroperoxide, decomposes
to form secondary oxygenated products, i.e., alcohols,
ketones, acids, etc., which are subject to further
conversion. In this regard, Hazlett et al.'s (1977) C12
n-alkane oxidation study appears to be one of the few cited
works at intermediate temperatures. Clearly, there is a need
to expand the current understanding of the fundamental
hydrocarbon oxidation chemistry at the intermediate
temperatures.
As noted in the introduction, heteroatomlc trace
species exert significant deleterious effects on the
stability of the liquid fuels by promoting deposit formation
due to storage and exposure to elevated temperatures.
Presently, the role of the heteroatoms influencing fuel
instability is not well understood, since In-use distillate
fuels contain hundreds of components which complicate the
understanding of the heteroatomlc reaction chemistry.

45
Available literature for model fuel plus heteroatom systems
is restricted to a few selected cases, i.e., mercapton and
oleflns, pyrroles and hydrocarbons, sulfides and
hydrocarbons. The problem is compounded by the fact that the
pertinent literature is concerned with only low
temperatures. Information at intermediate and high
temperatures, as encountered in thermal stability
situations, and the effects of other heteroatomlc species
particularly deleterious to fuel stability Is lacking. Thus,
the current study of n-dodecane as a model fuel alone and in
combination wlth harmful heteroatomlc species, tested
between ZO0-_OOC, was designed to fill in some of the gaps
in the current knowledEe.

46
CHAPTER 3
EXPERIHENTAL FACILITY AND ANALYTICAL HETHOD DEVELOPHENT
The experimental facilities and analytical methods for
enhancing and ensuring the detection of fuel derived soluble
degradation products are discussed in this chapter. The
modified Jet Fuel Thermal Oxidation Tester (JFTOT) facility
and its operation is discussed in Section 3.1. Analytical
methods such as Gas Chromatography (GC), chemical separation
and Gas Chromatography/Mass Spectrometric (GCHS) techniques
employed to isolate, detect and identify individual
degradation products are dealt with in Sections 3.2 and 3.a.
The sample handling techniques adopted for minimizing contam-
ination of control and stressed fuel samples are discussed
in Section 3.3. Finally, the short-term and long-term overall
system reproducibility results are dealt with in Section 3.5.
3.1JFTOT MODIFICATION AND OPERATION
The standard JFTOT apparatus is used to determine if an
aviation turbine fuel meets the current thermal stability
requirement as per ASTH method D-3241. For the present work,
the JFTOT was not used to estimate the amount of deposits
formed in a test, but was modified to study the formation of
soluble degradation products in model fuels over ambient to
400C temperatures. Using the standard JFTOT procedures with
sample collection from the stressed fuel reservoir, cross-
contamination of fuel samples between runs was observed,

47
even with extensive cleaning of all the fuel lines and
purEing of dead volumes. Consequently, modification of the
JFTOT and its operating procedures was required in order to
eliminate this cross-contamination problem.
To accomplish this, a special sample collection tee was
placed in the fuel return line after the heater tube but
prior to any stagnant lines or dead volumes, Fig. 3. I. To
ensure proper flushing of the tee and transfer lines before
sample withdrawal, the sampling tap was kept cracked open
throughout the experiment and several minutes were allowed
before actual sample collection at each operating condition.
This procedure increased the total instrument flow from
3 m]/minute to approximately 3.75 - _.0 ml/mlnute; this
higher flow rate is expected to result in slightly lower
deposit formation (Vranos and Marteney, 1980) due to the
shorter residence times and lower bulk fuel temperatures
across the heater tube. In addition to providing clean
samples, this modification permitted several samples to be
collected in a single JFTOT run with one filling of the fuel
reservoir. This was accomplished by changing the heater tube
temperature in several increments (e.g., 200 to _OOC in 50C
steps) over the course of the run, with collection of valid
samples at each temperature condition after system stabili-
zation and adequate flushing of the sample llne and tee with
fresh sample (15 minutes combined time). Details of the
modified JFTOT operating procedure are given in Appendix A.

48
METERING PUMP
TESTFILT_
I
!I
PREFILTI_I
L T_T FUI_
FIG. 3.1 Modified Jet Fuel Thermal Oxidation Tester
(JFTOT) wlth Sample Withdrawal System
49
It is noted that the heater tube temperatures quoted in this
thesis work are maximum wal I temperatures attained at the
center of the 2 3/8 inch aluminum tube over a 3 to 5 mm
length. The fuel temperature at the location of the
thermocouple (placed inside the heater tubes) is much less,
perhaps 50-75C lower at that point. The bulk fuel
temperature averaged over the entire span of the heater tube
may be even lower, being approximately IOOC less than the
quoted heater tube temperatures.
3.2. CHROMATOGRAPHIC/SEPARATION METHODS
Attempts to analyze the JFTOT stressed samples were
first made using liquid chromatographic (LC) techniques. UV
detection at 220 and 254 nm was not successful in following
the deposit precursors in the stressed samples, due to the
low concentrations of detectable products. Subsequently, the
JFTOT samples were analyzed on a Varian 3700 Gas
Chromatograph (GC) equipped with both split and on-column
injectors and flame ionization detection (FID). The
analytical column was a fused silica DBI (SE-30 type) bonded
phase caplllary column - 0.25 mm diameter x 30 meters long
(J & W Scientific Co., California). During split injection
analysis, breakdown products of thermally unstable species
were detected; hence the cold on-co|umn injection (OCI)
technique was employed, wherever possible, to minimize
sample breakdown. Additionally, since the soluble
degradation products were at trace level concentrations, a
5O
Sep-pak fractionation scheme, based on polarity sepaKatlon,
was employed to separate and enhance detection of the non-
polar and polar constituents of interest.
3.2.1GC Parameters
GC split injection techniques provided reasonable
sensitivity for monitoring soluble product formation.
However, sample volumes were restricted to 0.8-1.4
microliters (pl) due to capacity constraints on the
capillary column. The GC split and on-column injector
conditions employed throughout the work are given in
Table 3.1.
3.2.2 Peak Profile Analysis Technique
Peak profiling is a technique for monitoring the
compositional changes occurring in the fuel by graphing a
number of sample chromatograms on a single plot. Figure 3.2
shows representative GC split injection results of samples
collected in a single modified JFTOT run. Each rectangle, is
a replotted chromatogram which represents the fingerprint of
the fuel at the noted JFTOT heater tube temperature. The x-
axis gives the time of elution of the mixture components in
minutes (linear scale), while the y-axis gives species
concentrations in peak area counts (logarithmic scale).
Each llne in the rectangle represents a single compound or
group of compounds with the height being proportional to the
concentration. One can then monitor the changes occurring in
the composition of the parent fuel as the stressing level is
increased. Degradation product species can be easily

51
TABLE 3.1
GAS CHROMATOGRAPHIC CONFIGURATION AND OPERATING CONDITIONS
Gas Chromatograph
Analytical Column
:Varian 3700
:0.25 mm I.D.;30 meter DBI (SE-30
type) bonded phase capillary column
Oven Temperature Program :50C - I0 mlns., 3C/mln., and
275C - 15 mins.
Carrier Gas Flow Rate
FID Temperature
FID Sensitivity
FID Gas Flow Rates
Integrator
Integration P_rameters
Split Injection
Injector Temperature
Injector Split Ratio
:HydYogen; I cc/mln.
:300C
:I x i0 E-12 amps/mV
:300130 cc/mln. (Air/Hydrogen)
:Spectra Physics 4200
:Peak Threshold - 50;
Peak Width - 3 secs.;
Signal Attentuatlon - 4
Chart Speed - I, 5 cm/min.
:280C
:45:1
Sample _nJection Volumes :0.8 - 1.4 mlcrollters (_l)
On-Column Injection
Injector Temperature
Program
Injection Volume
:50C - 0 mins. ; lOOC/min. :
280C - 50 mins.
:0.5 _1
Note: 02, CO. C02, H2 gases were not analyzed due to
column and detector limitations.

52
(A _
39e c
258 C
2e8 C
3e C
IE2
0 4 8 12 16 2Q 24 28 32 30 4_ 44 48 52 _6 60 G4 68 72 76 88 84 88 92 98 I_Q
- DOD(CAN( ELUTZON R(TE.NTZON TZM_ (MZN)
FiG. 3.2 GC Peak Profiles of JFTOT Stressed, Distilledn-Dodecane
53
observed, since the retention times of the new species will
be different from that of the parent fuel (shown by the
asterisk). Based on retention time bands, the major soluble
products appear in five retention time ranges of the GC
chromatogram and were designated as Groups I, I[, II |,
IV and V, respectlve[y, thus enabling simplification of
data interpretation and analysis.
During split injection analysis, n-dodecane elutes as a
large peak covering 7-I0 minutes of all GC ohromatograms,
shown as asterisks in Fig. 3.2, thus overloading the
capillary column and masking possible products in that time
range. To overcome t_is n-dodecane interference, a sample
preparation and fractlonatlon scheme using Sep-pak
cartridges (Waters Associates, Milford, Massachussetts) was
devel'oped.
3.2.3 Sep-pak Fractionation Scheme
The Sep-pak fractlonatlon scheme is a technique for
separating the non-polar and po|ar constituents based on
species polarity. A procedure developed earlier (Sha]a,
Ig83) was modified for this study. One ml of the sample is
adsorbed onto a silica Sep-pak cartridge and the non-polar
and polar compounds are selectively stripped off by eluting
using cyclohexane (NP1, NP2, NP3 fractions) and 2-propanol
(NP/P, PI, P2, P3 fractions) respectively as solvents. In
all, seven elutlons are performed for a given sample; the
details of the scheme are shown in Table 3.2.
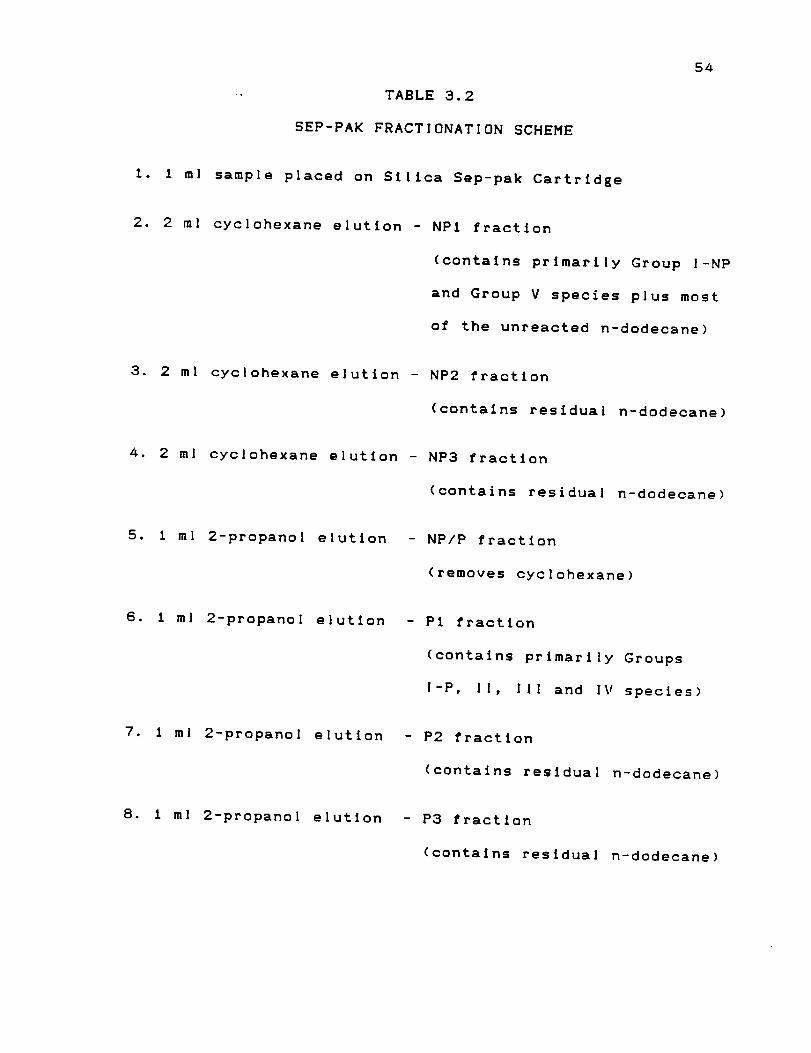
54
- TABLE 3.2
SEP-PAK FRACTIONATION SCHEME
1. I ml sample placed on Silica Sep-pak Cartridge
2. 2 ml cyclohexane elution - NPI fraction
(contains primarily Group I-NP
and Group V species plus most
of the unreacted n-dodecane)
3. 2 ml cyclche×ane elutlon - NP2 fraction
(contains residual n-dodecane)
4. 2 ml cyclohexane elutlon - NP3 fraction
(contains residual n-dodecane)
5. I ml 2-propanol elution - NP/P fraction
(removes cyclohexane)
6. I ml 2-propanol elutlon
7. 1 ml 2-propanol elution
8. I ml 2-propanol elutlon
- P1 fraction
(contains primarily Groups
l-P, II, III and IV species)
- P2 fraction
(contains residual n-dodecane)
- P3 fraction
(contains residual n-dodecane)

55
Using GC analysis on the fractions obtained in this
way, it was found that Group V and a major part of Group I
products (designated as Group I-NP), including the unreacted
n-dodecane, elute in the NPI fraction, while Groups I I-IV
and a minor part of Group l products (Group l-P) elute in
the first polar fraction, PI, Fig. 3.3. The other fractions
contained primarily residual n-dodecane and were of little
interest.
Reproducibility of the Sep-pak procedure was checked by
collecting a duplicate set of fractions from the same
stressed JFTOT sample (8_/7/400C sample) and comparing the
two data sets, Figs. 3.3 and 3.4. The respective NPI, NP2,
NR/R, Pl, and P2 fraction profiles were identical, implying
that the fractionation procedure was reproducible.
3.2.4 Development of GC/On-column In_ection Technique
GC/FID results of the baseline Pl fractions performed
using split injection analysis were not always good for
quantification, since a number of degradation products were
at the limits of FID detection under the prevailing sample
size restrictions. Thus, on-column in_ectlon (OC|) was also
employed to attain improved sensitivity and reproducibility.
In this case, the peak areas of the degradation products
were large enough to be integrated and reported with only a
0.5 _I sample size. Additionally, OC[ was far superior to
split injection in detecting thermally labile species, since
the thermal breakdown of labile compounds (e.g., Group |V
compounds) is minimized using OCI at 50C relative to

56
oJo.wQ
.
-4
._4..j....L...
it
s
l.J.JIJ.l.m
.l-_
0.Z
._L_
..-L.J._.4.m
(MQ.
Z
te
..--I..--L.--L
_.
tl.l.Ll
N
!J:l
NT
mOOII!IIOIIIIO0"1
GN

5"1
a.
!
Q.
O.
Z
mO.
Z
_r
m
OD
(D (DCO
CO
Too
011II!Qm0000
N

58
the split injection at 280C. This results in higher
sensitivity and larger peaks appearing on the OCI generated
chromatograms. Hence, all polar fraction analysis was done
with the OC[ technique only. Thus, the two techniques are
complimentary and both were employed for monitoring the
Group I-V products.
3.2.5 Character Impact Peak Representation
One chromatographically well-resolved character impact
peak, CIP, was chosen from each of the Group I-P and Groups
I I-IV to represent that product Group based on the CIP's
low data scatter (smaller error bars). It was found that the
ratio of the CIP area to the total Group peak area remains
constant over the 200-400C temperature range:
CIP I-P/Total I-P = 0.3127+ 0.044 (+ 14.0%)
CIP II/Total II = 0.1660+ 0.015 (+ 8.12%)
CIP Ill/Total Ill = 0.1237+ 0.017 (+ 13.9%)
ClP IV/Total IV = 0.2525+ 0.021 (+ 8.1i%)
This implies that the baseline Group I-P and Groups II-IV
data can be adequately represented by using only one peak,
thereby simplifying data analysis and interpretation.
3.2.8 Limitations of the Sep-pak Fractionatlon Protocol
While the Sep-pak fractionation scheme is successful in
separating the oxygenated compounds of interest, it did not
concentrate the dopant compounds in the P1 fraction (the
fraction of interest) due to their limited solubility in the
cyclohexane and 2-propanol solvents (for example,
3,4-dimercaptotoluene is partially soluble in both

59
solvents). However, as the solubility characteristics and
polarity differences between cyclohexane and 2-propanol
works adequately in separating the major non-polar and polar
type compounds in the baseline n-dodecane and n-dodecane
plus dopant samples, the scheme was used for monitoring
Group l-P, If, Ill and IV products. Sample isolation
techniques employing other Sep-pak methodologies were not
attempted since each dopant species would require a unique
Sep-pak protocol due to different solubility characteristics.
3.3 SAMPLE HANDLING
Preliminary JFTOT stressing of n-dodecane resulted in
very low to trace concentrations of soluble degradation
products. It was noted that the concentrations of the
soluble degradation products were comparable to those of the
impurities present in the as-recelved n-dodecane. This led
to the examination of the system protocol under use. The
sample handling phases of the system protocol which
contributed the most to variations and errors were Ide_ti-
fled as sample vlal contamination and n-dodecane purity.
A GC peak profile plot of JFTOT stressed, as-recelved
n-dodecane is shown in Fig. 3.5. The figure shows formation
of new species in the 300 and 400C plots in the 0-20, 28-42,
and 46-70 minute retention time ranges. This plot also shows
the presence of impurities spread over a wide range of
retention times in the unstressed fuel (control sample),
indicating the need to purify the n-dodecane before use.

6O
WW
m
mm
mnm
a
qtU0Q
W_
|
|
mm
I
m
m
Uo0WN
|
mm
_W
W_
t3_9Xt3a
|
_Wklld
3Al[l_r't_
i
mi
m
M
w
"8
MI-
--.g---.--
W
0I(lJI11f,.,
Q[-,[.Looliii
0
m0
L)
lL9
r"
LO
b.

61
This led to the development of a vacuum distillation
apparatus, as described in the next section.
It was found that the set of lines spaced at equal
intervals in the 60-100 minute retention time range observed
in the 300 and 400C samples, Fig. 3.5, originate from vials
used for sample collection and storage. Thereafter, the
vials were cleaned by washing with soap and water, distilled
water, 50/50 (volume percent) water/hydrochlorlc acid
mixture, dlstilIed water, methanol, and cyclohexane,
followed by oven baking. The above procedures result in
acceptable sample collection and handling techniques.
3.3.1 Vacuum Distillation Szstem and Operation
Fuel purification requirements necessitated development
of a vacuum distillation system. The system consists of a
heating pot, distillation column packed wlth glass helices,
distillation head, product receiver, vacuum system and
heating element as shown in Fig. 3.8. The heating pot is a
large glass globe located at the bottom of the column and
contains the material to be distilled. The bowl shaped
heating element is placed under the heating pot and the rate
of heating is controlled manually through a rheostat. The
column is a long glass tube packed with glass helices to
provide increased surface to volume contact area. The
dlstillation head is an intricate piece of glassware located
at the top of the column which condenses the vapors and has
the ability to send the condensate either back to the column
or to a product receiver (erlenmeyer flask) via a thin tube.

G2
FIG. 3.6 Vacuum DlsttllatLon Apparatus

63
A two way valve permits isolation, evacuation and
repressurlzatlon of the receiving section without affecting
the column. Vacuum is also connected to the system via a
port on the distillation head. Two ice cooled vapor traps in
series prevent any heavy hydrocarbons from entering the
pump. A cartesian manostat is also connected in this llne to
accurately control the pressure. The assembled apparatus is
sealed using ground glass Joints (tapered Joints, size
2a/40) to prevent air entering into the system. A standard
procedure for n-dodecane distillation has been developed and
may be found in Appendix B.
Distillation using the apparatus is successful in
removing most of the impurities in n-dodecane. GC chromato-
grams of n-dodecane samples before and after distillation.
Fig. 3.7, showed the removal of nearly al I species in the @-
22 and 30-100 minute retention time range. The purity, as
revealed by capillary GC, was 99.8% on a peak area percent
basis. However, for sensitive detection of the JFTOT
stressed soluble degradation products, large amounts of n-
dodecane (0.8-1.4 ul at 45:1 injector split ratio) must be
injected into the capillary column. This large injection of
n-dodecane solvent overloads the capillary column and
results in undetermined peaks appearing before and after the
n-dodecane elutlon (20-27 minute retention time range).
Nonetheless, the use of distll led n-dodecane and clean
sample vials virtually eliminated al 1 the spurious peaks in
the 2-18 and 30-100 minute ranges, and enabled better

64
WW..J
m
W
1,4
II
II
la.I
f_
¢Nh.
m
II
!
W
_TW
mO
W14-
_N
_W
E
__T
*-4I'-
T
z--T
Q--IWZWO
m
I
NW
mmq-4
eQ>Qo!mq._
0®0
e
_.
0C
GI.E.
65
observation of the fuel derived degradation products as
shown in Fig. 3.2. Thus, all subsequent n-dodecane and
n-dodecane plus dopant experiments were performed with
distilled n-dodecane.
Attempts to purify tetralin, a typical aromatic
compound found in Jet fuels and contemplated for two pure
component mixture (n-dodecane/tetralin, 90/10 volume
percent) experiments in this program, were not successful.
After distillation, tetralln oxidizes very rapidly, forming
a dark residue at the bottom of the product flask and
showing impurities over a wide GC retention time range.
Consequently, unless'the distilled tetra[In can be isolated
from atmospheric air or otherwise stabilized, it cannot be
used for JFTOT experiments.
3.4 IDENTIFICATION OF n-DODECANE DERIVED REACTION PRODUCTS
The GCMS instruments employed for identification
purposes were Finnigan (Model # 4023) and Hewlett-Packard
(Model # 5970) systems. The major products in each of the
fractions and Product Groups were identified initially by
matching the GCMS derived mass spectra with NBS spectra, and
subsequent|y by positive peak identification using retention
time matching with commercla[ standards.
Group I consists mainly of non-polar C5-CI0 n-alkanes
and l-alkenes (I-NP), and polar C7-CI0 aldehydes (I-P).
Group I | species were tentatlve|y identified as
tetrahydrofurans (THH's) with different alkyl substituent

66
groups such as methyl, propyl, and pentyl groups attached at
the 2- and 5- positions. Standards necessary for positive
identification of Group II species were not available, but
the similarity of mass spectras obtained with that of 2,5-
dimethyltetrahydrofuran ]ends support to the GCMS Identlft-
cation. Group Ill products were positively identified as 6-,
5-, 4-, 3-, 2- dodecanone and 5-, 4-, 3-, 2- dodecanols.
Group V products are tentatively identified as tetracosane
(C=4H, o) isomers with no oxygen present.
The Group IV products are thought to be the
dodecylhydroperoxldes, ROOH's, or their most probable
decomposition and/or GC capillary column derlvatlzation
products. However, Group IV GCMS identity matches with the
NBS data do not yield ROOH's, since no ROOH's higher than C7
are reported in the NBS mass spectral data base.
Neverthe|ess, with concentrations two to three times greater
than Group I-P, |I and [ I I products, the Group IV components
appear to be primary oxidation products. Many literature
sources cite ROOH's as the primary oxidation product formed
during low temperature hydrocarbon autoxldation, with small
concentrations of secondary oxidation products via ROOH
decomposition, i.e., alcohols, ketones, esters, acids and
hydroxyketones also possible, depending on the oxygen
availability and Initia| fuel composition (CRC, 1979). Also,
tentative GCMS identification of two Group IV products as
trlmethy]nonano] (C12 alcohol) and 3-hydroxydodecanolc acid
(C12 acid) are another indication that Group IV species

67
are ROOH's. Acid and alcohol species are known thermal
decomposition products of ROOH.
Since positive identification of n-Cl2 ROOH's is not
possible using the NBS mass spectra data base, the n-alkane
hydroperoxldes were synthesized using a modified
tetrallnhydroperoxlde preparation technique (Knight and
Swern, 1954). This synthesis involved placing 5-10 ml of
distilled n-dodecane in a Kuderna-Danlsh (KD) flask and then
putting the flask in a constant temperature bath at 90C.
A stream of oxygen is passed through the n-dodecane for 2
hours ensuring that there is minimum contact with ambient
air. The reaction temperature and time of SOC and 2 hours,
respectively, were selected based on the detection of
oxidation products from the synthesis. The procedure
involves separating the polar, oxygenated species from the
unreacted n-dodecane using the Sep-pak fractlonation scheme
and subsequently detecting them employing the GC/OCI
analysis. The object was to synthesize and form only the
primary oxidation products, i.e., ROOH's, by selecting the
lowest possible reaction temperatures and times and thereby
minimize the formation of secondary oxidation products such
as alcohols and ketones, etc.
The effect of reaction time on n-dodecane + 02 product
synthesis using GC/OCI analysis of the P1 fractions is
depicted in Fig. 3.8. This peak profile plot shows
chromatograms of the baseline n-dodecane, two synthesized
samples at reaction times of 2 hours and 3 hours

68
PIV)I'--Z
(:Dt.J
I.In,
LIJOO2:0Q.V)hir.,
(J(.5
l E6
I 3IL;6
I E3
{3
n-CI2
II
n-el2
I 1 ,
i i I I !- I I I8 ! 2 16 28 24 28 32 36
RETENTION TTME (MTN)4e
FIG. 3.8Effect of Reactlon Time on n-Dodecane + O=
SynthesLs Usln E GC/OCI Analysis of PI Fractlons
69
respectively, and a typical JFTOT stressed n-dodecane sample
P1 fraction as a calibration standard. It can be observed
that the retention times of the major products formed during
the 2 hour (and 90C) synthesis match with the JFTOT derived
Group IV products, indicating that Group IV products may be
ROOH's. As the reaction time of the n-dodecane + 02
synthesis is increased to 3 hours, the major products are
again within the Group IV retention time band, but secondary
oxidation products such as Group I| I alcohols and ketones
also form in small quantities. Hence it appears that ROOH
synthesis is best achieved at reaction temperatures and
times of QOC and 2 hours.
Since ROOH's are thermally unstab|e and subject to
decomposition, storage effects of the synthesized samples
were also studied. Figure 3.9 plots peak profiles of the
n_Cl2 + 0,, 2 hour synthesis sample Pl fraction analyzed
after O, 4 and 14 days of storage, respectively. The sample
chromatograms after 4 and 14 days of storage show that a
small quantity of Group IV products break down to form Group
I| I alcohols and ketones, thereby skewing the original Group
IV product distributions. Hence it is inferred that the
synthesis and JFTOT stressed P1 fraction samples should be
analyzed as soon as possible (between 0-4 days). Also, it is
noted from Figs. 3.8 and 3.9 that Group [ I tetrahydrofurans
were not detected during either the n-el2 + 02 syntheses
experiments or during the stressed sample storage stability
experiments. This implies that the Group I I products
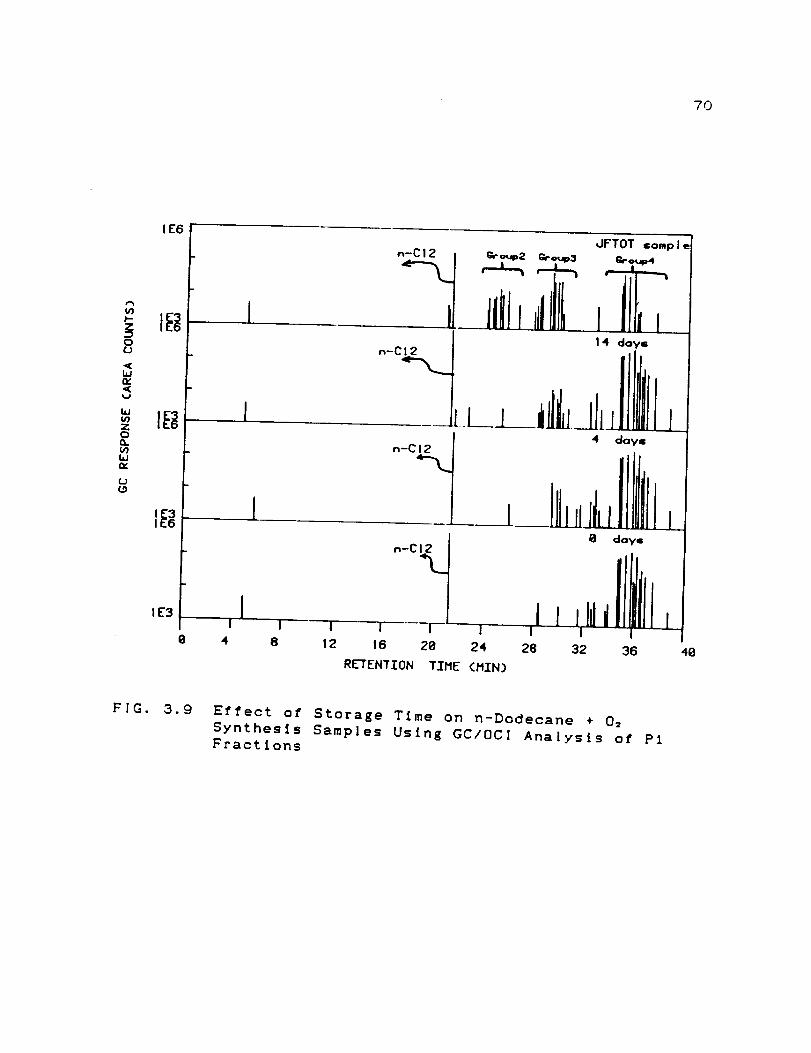
7O
! E6
v)p-=z¢)0
hin..
bJgOZ0
_qbJrv
(JL_
! 3
JFTOT "=ompl •
,.__L.___ • -,_ till1, In-CI2
1 I
.-CI_
I I I I _---- I I0 4 8 12 16 2@ 24 28
RE-rENTION TTME (MIN)
1 4 day=
4 o_oy,-
0 doy=
,, I//Ifln,I I
32 36 48
FIG. 3.g Effect of Storage Time on n-Dodecane + 02
Synthesis Samples Using GC/OCI Analysis of P1Fractions

71
observed in the JFTOT samples probably form due to the JFTOT
stressing conditions alone and are not artifacts arising from
the Sep-pak fractionation and GC/OCI analysis protocols.
Since the JFTOT derived Group IV products are
presumed to be ROOH's, based on identical GC retention
times, the next step involved comparison of the GC/MS mass
spectra for the synthesis and JFTOT stressed Group IV
species. The tentative GC/MS identification of 3-
hydroxydodecanolc acid for one of the synthesized Group IV
species is identical with the corresponding JFTOT derived
species, indicating a very good match. The library search
results for the other four Group IV species were not the
same, but a number of identical matches appeared on the llst
of top ten NBS library matches. For example, the other four
Group |V species from the synthesized samples had 6, I, 5
and 8 identities in common with the top ten NBS library
matches identified for the corresponding JFTOT stressed
species. A ten out of ten (I0/i0) is a good NBS library
match even though the rankings are not identical, while I/I0
can be considered a poor match.
3.5 SYSTEM REPRODUCIBILITY
Optimization of the GC analytical parameters provided
the added benefit of verifying the overall system
reproducibility which includes modified JFTOT operation,
sampling, sample storage, and GC analysis. The sampling
reproducibility within a single JFTOT run (at a constant

72
temperature) is discussed in Section 3.5.1, while the
reproducibility of multiple JFTOT runs, performed over the
entire range of test temperatures (200 - 400C), is
discussed in Section 3.5.2. Additionally, the long term
JFTOT system reproducibility is discussed in Section 3.5.3.
3.5.1 Reproducibillty_Withln a JFTOT Experiment
The reproducibility of the system at a given JFTOT
temperature including sampling and GC analysis technique
were checked by collecting 300C samples from one JFTOT run
at six different times and comparing the peak profiles, Fig.
3.10. It is observed from the plot that similar products
appear in all the chromatograms, and that the
reproducibility for some of the products appearing below
I000 (IE3) relative peak area counts is poor, since the
concentrations are near the limits of FID detection. The
average percent relative standard deviation values (%RSD =
standard devlation/mean value x I00) for GC retention time
and product response (area counts) were 0.15% and 28%,
respectively. When the above samples were Sep-pak
fractlonated and the resulting Pi fractions analyzed, the
corresponding %RSD values were 0.7% and 18%, respectively,
indicating that sample fractionatlon improves peak area
reproducibility, but retention time reproducibility worsens
somewhat. Also, at higher temperatures, the product peak
area reproducibility improves; for example, a similar
reproducibility analysis for a 400C sample yielded %RSD
values of 8% (compared to 28 and 16%) due to higher product

Zt-d
O}|m
ZI,-d
's"
mJw,,
Z'r
(3O
_qt,u
t_
t_
Z'qr
QOI
ZZ
m
_(0_)
_(Z)
TaD
_CD
_)
_(1[:)
_N
_aO(0
I-IVI-
N_r
CD
(ME)
(Mhl.I
hi

74
concentrations, thereby enablln E better detection of the
products and lower data scatter.
3.5.2 Reproducibility of Multiple JFTOT Experiments
The JFTOT run-to-run reproducibility of n-dodecane
baseline product data was determined by running six
successive baseline experiments, performing GC analyses,
and subsequently calcu]atlng the peak area means and
standard deviations of the Group I-V data. The phases of the
experimentation which could contribute the most to
variations and errors were identified as follows: the batch
to batch variability of commercially available n-dodecane,
the filtration procedure, the distillation procedure, the
modified JFTOT operation, the order of experimentation,
sample handling, the Sep-pak fractlonatlon procedure, and GC
analytical techniques. In order to obtain reproducible
baselines, certain experiments were designed to identify the
sources of error and minimize them. The experimental program
was as follows:
A. Distill n-dodecane in three I000 cc lots, and run two
JFTOT baseline experiments from each lot to verify lot to
lot reproducibility.
B. Select and optimize a GC technique (split and/or OCl) for
analyzing stressed n-dodecane samples.
C. Utilize the optimized GC parameters to obtain baseline
data as product concentration profiles (versus JFTOT stress
temperature) and lot number.
D. Mimic the last part of a typical dopant sequence and

75
verify if dopant cross-contamination affects the baseline.
(Each set of dopant experiments was performed in the
following sequence: n-dodecane baseline, n-dodecane + i0 ppm
dopant, n-dodecane + i00 ppm dopant, n-dodecane + I000 ppm
dopant, a 150 cc n-dodecane flush followed by a n-dodecane
baseline). The last part of the dopant sequence includes the
n-dodecane + i000 ppm dopant experiment, the 150 cc flush
and the post dopant baseline experiment.
E. From the acquired baseline data, perform statistical
analysis on product concentrations to get mean, standard
deviation, %RSD, and 95% confidence intervals, and, based on
probability theory and cumulative distribution function
analysis, establish a criteria for accepting/rejecting a
baseline n-dodecane experiment.
The results of the above experiments can be summarized
as follows: initially, lot to lot reproducibility was
assumed to be valid a priori, since optimization required
statistical ca]culatlons (mean, standard deviation and %RSD
values) from the baseline data. To verify lot to lot
reproducibility, the n-dodecane stressed samples were
analyzed by GC split injection techniques. The above results
are summarized in Table 3.3 which shows that the %RSD values
are high when product concentrations are low, near the
detectability |imits of the flame ionization detector (FIDe.
Hor example, at 250C, the %RSD values for Group l-IV data
are high due to low product concentrations. Similar|y. at
350C, the %RSD va|ues for Groups |-V are low. but a high

76
TABLE 3.3
Reproducibility of the GC Spilt Injection Analysis Technique
for n-Dodecane Samples Collected at 250. 300, 350 and 400C
JFTOT
Temperature%RSD Values for Stressed Sample Product Groups
I II Ill IV V
250C 56.0 27.4 43.6 23.5
300C 8.5 11.3 10.8 IS.5
350C 11.8 9.0 12.0 24.2 45.4
400C 14.4 26.0 13.3 >100.0 !4.3
Note: %RSD implies percent relative standard devlatlcn
(%RSD = standard deviatlon/mean value x I00)
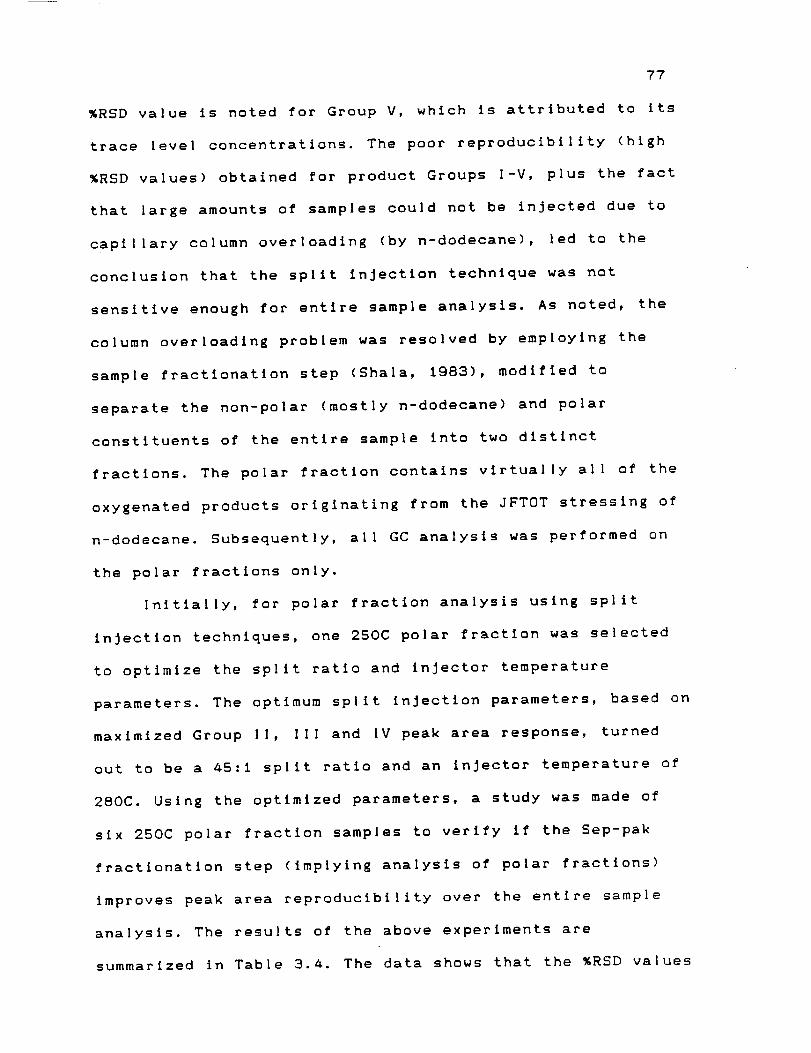
77
%RSDvalue is noted for Group V, which is attributed to its
trace level concentrations. The poor reproducibility (high
%RSD values) obtained for product Groups I-V, plus the fact
that large amounts of samples could not be injected due to
capillary column overloading (by n-dodecane), led to the
conclusion that the split injection technique was not
sensitive enough for entire sample analysis. As noted, the
column overloading problem was resolved by employlng the
sample fractionation step (Shala, 1983), modified to
separate the non-polar (mostly n-dodecane) and polar
constituents of the entire sample into two distinct
fractions. The polar fraction contains virtually all of the
oxygenated products originating from the JFTOT stressing of
n-dodecane. Subsequently, all GC analysis was performed on
the polar fractions only.
Initially, for polar fraction analysis using split
injection techniques, one 250C polar fraction was selected
to optimize the split ratio and injector temperature
parameters. The optimum split injection parameters, based on
maximized Group If, [II and IV peak area response, turned
out to be a 45:1 split ratio and an injector temperature of
280C. Using the optimized parameters, a study was made of
six 250C polar fraction samples to verify if the Sep-pak
fractlonatlon step (implying analysis of polar fractions)
improves peak area reproducibility over the entire sample
analysis. The results of the above experiments are
summarized in Table 3._. The data shows that the %RSD values

7,9
TABLE 3.4
Reproducibility of GC/OCI and GC/SpItt Injection Techniques.
for n-Dodecane Samples Collected at 250C
%RSD Values for JFTOT Samples Collected at 250C
GC INJECTION TECHNIQUE
GROUPS
II III IV
SPLIT INJECTION
Entire Sample Analysis 27.O 43.6 23.5
Polar Fraction Analysis 22.8 21.9 26.0
ON-COLUMN INJECTION
Polar Fraction Analysis 18.7 16.9 25.6

79
obtained from polar sample analysis were lower than those
employing entire samples, indicating that Sep-pak
fractionation involves negligible error and improves
reproducibility.
Attention was turned next to OCl analysis to check if
further lowering of %RSD values could be achieved, since it
is widely reported in chromatography literature that OCl is
more sensitive than the split injection techniques. The six
250C polar samples previously used for split injection
studies were analyzed using GC/OC[ techniques. The results
from the OCI experiments are included in Table 3.4. The OCl
analysis yielded lower %RSD values than split injection
analysis, implying that the OCl technique is better suited
for polar sample analysis.
Once the GC/OCI analysis technique was found to be
better suited for polar fraction analysis, the
reproducibility of the GC/OCI technique itself was
evaluated. This was accomplished by analyzing one polar
fraction sample six times. Repetitive analysis of the polar
sample showed that the %RSD values for the total Group I I,
I I I and IV areas were _ 9._%, _ 18.0%, and _ 8.0%,
respectively. Selected, wel l-resolved character impact peaks
from each of the product Groups further reduced the %RSD
values to t 2.0%, L 8.0%, and t 8.0% respectively,
indicating that the character impact peak (CIP)
representation introduces fewer integration errors than
using the total Group area representation. The Group I I I

80
reproducibility (CIP and total area) is poor relative to
Group II and IV data due to the presence of C12 alcohol and
ketone isomers which have nearly identical boilin8 points
and, hence, elute as fused peaks on a non-polar DBI column,
causin8 large integration errors. Thus, a part of the error
arlsln8 during GC/OC! analysis was identified and minimized
usln8 the CIP representation.
An added reason for employln 8 the GC/OCI analysis
technique for polar fraction analysis was to aid the
detection of thermally unstable compounds in the polar
sample constituents. Since the OCl technique is a cold
injection technique and employs low injector temperatures
relative to split injectors, it is ideally suited for
analysis of thermally unstable compounds. In the present
work, thermally labile compounds were detected during
analysis of an identical polar fraction sample using both
split and OC! techniques and by noting changes in the
normalized Group If-IV product distributions (The Group If,
Ill and IV peak areas were normalized with respect to the
internal standard peak area). The results of the above
experiments are summarized in Table 3.5. Group IV products
were inferred to be thermally labile compounds since the
combined area for a]I peaks in the group using the OCI
analysis was higher than that obtained by the split
injection analysis by 0.46 (arbitrary units relative to the
internal standard), indicating that they break down during
split injection analysis. At the same time, the Group II

81
TABLE 3.5
Changes in Normalized Group I I-IV Peak Areas with Injection
Technique
INJECTION - GROUP II GROUP III GROUP IV GROUP (II+III+IV)
TECHNIQUE
SPLIT - 1.144 0.764 1.340 3.248
OCI - 0.703 0.825 1.800 3.328
(SPLIT-QCI) +0.441 -0.061 -0.460 -0.080
Note: Group areas are normalized with respect to the
internal standard peak area.

82
areas obtained by OCl were lower than those using split
injection analysis by 0.441 arbitrary units, implying that
the Group IV compounds that break down in the split injector
form primarily Group I I compounds. Normalized Group I I I
product areas obtained by split injection ana]ysls were
0.081 arbitrary units lower than those using the OC!
analysis. The difference is due either to a small fraction
of Group III products breaking down in the split injector
forming Group II components, or to the difference in the
Group (I [+I I I+IV) normalized area = 0.080 units between the
spllt and OCl injection techniques (column 4 in Table 3.5).
Even though the split injection technique was found to
be unsuitable for polar fraction analysis due to the
presence of thermally unstable compounds, it can sti| I be
employed for Group [ and V analysis using entire samples.
The %RSD values obtained with the above technique are
comparable with those obtained by OCl analysis with polar
fraction injection. On the other hand, Group l-P, II, III
and IV polar fractions from the Sep-pak fractionatlon should
always be analyzed using OCI.
Similar OCI analysis, performed on the polar fractions
of the 300C, 350C and 400C samples, showed that the peak
area reproducibility is a function of product Group and
temperature. All %RSD values for OCl were lower than the
corresponding values using split injection. The highest
%RSD's occurred at 4OOC, where the Group IV %RSD values
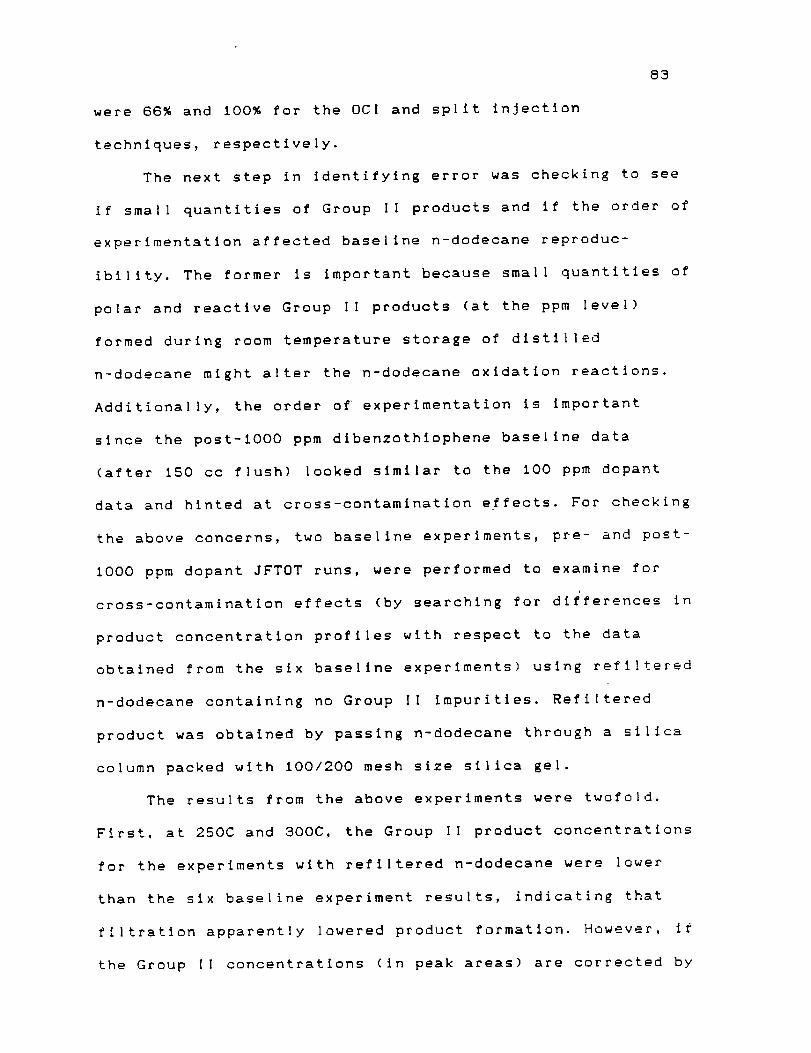
8S
were 66% and 100% for the OCl and split injection
techniques, respectively.
The next step in identifying error was checking to see
if small quantities of Group I ! products and if the order of
experimentation affected baseline n-dodecane reproduc-
ibility. The former is important because small quantities of
polar and reactive Group | I products (at the ppm level)
formed during room temperature storage of distilled
n-dodecane might alter the n-dodecane oxidation reactions.
Additionally, the order of experimentation is important
since the post-lO00 ppm dlbenzothlophene baseline data
(after 150 cc f|ush) |ooked similar to the I00 ppm dopant
data and hinted at cross-contamlnation effects. For checking
the above concerns, two baseline experiments, pre- and post-
I000 ppm dopant JFTOT runs, were performed to examine for
cross-contamination effects (by searching for di{ferences in
product concentration profiles with respect to the data
obtained from the six baseline experiments) using refiltered
n-dodecane containing no Group I! impurities. Refi|tered
product was obtained by passing n-dodecane through a si|Ica
column packed with 100/200 mesh size silica gel.
The results from the above experiments were twofold.
First. at 250C and 300C, the Group I ! product concentrations
for the experiments with refiltered n-dodecane were lower
than the six baseline experiment resu|ts, indicating that
filtration apparently lowered product formation. However, if
the Group l I concentrations (in peak areas) are corrected by

84
subtracting their initial concentrations (at room tempera-
tures), the reproducibility improves, as evidenced by the
substantial decrease in the %RSD values. For example, the
%RSD values at 250C and 300C using unsubtracted C[P II
data is _ 54% and _ 29.6%, respectively. When the C[P
concentrations were corrected to exclude initial CIP
concentrations the corresponding %RSD values decreased to
36.5% and _ 14.2%, respectively, implying that small
concentrations of Group [ [ products present at ambient
conditions do not affect baseline reproducibility. (The %RSD
values for Group II data is very similar to the CIP I I data).
Secondly, cross-contamlnatlon effects are ruled out since
the product profiles resulting from the latter two
experiments are similar to the data obtained from the six
baseline experiments, i.e., the peak areas are within the
data scatter of the six baseline experiments.
Once the total Group I I, I I I and IV peak area and the
corresponding CIP area means were calculated at JFTOT
temperatures of 250, 300, 350 and 400C, a matrix of 24
means (6 x 4 means) was created with corresponding 95%
confidence interval values. Since a new baseline experiment
generates 24 means, a baseline acceptance/rejection criteria
based on the number of data points, which can lle outside
the 95% confidence intervals of 24 calculated mean values,
was necessary. Using independent probability theory, the 95%
probability of a]I 24 means (considered as 24 independent
events) to fa[i within the calculated 95% confidence

85
intervals (CI) is 29.2%. The event of one mean value falling
within the calculated 95% CI constitutes a hit, whereas the
possibility of the same mean value lying outside of the 95%
CI i$ considered as a miss. If the independent and
cumulative event probabilities for the sequence of events
are calculated, the results are as follows:
COMBINATION OF EVENTS
All 24 hits (0.95) =" X (0.05)°X1
23 hits + I miss (0.95)2=X(O.O5)'X 2422 hits + 2 misses (0.95)22X(O.O5)=X24X23/221 hits + 3 misses (0.95)_IX(O.O5)3X24X23X22/8
PROBABILITY
Indep- Cumul-endent ative
29.2% 29.2%38.9% 66.1%22.3% 88.4%8.9% 97.0%
Since the above events are not independent, the 95%
(and greater) cumulative probability requiring a minimum of
21 hlts (or a maximum of 3 misses) was chosen as the
baseline acceptance criteria. When this criteria was applied
to the eight experiments performed for the method
development studies, the baseline data obtained from Run #i
were rejected since more than three data points were outside
the 95% confidence intervals of the 24 mean values.
Consequently, the statistics were corrected to include Runs
#2 through #8 only, and are shown in Table 3.8. The results
of baseline experiments (Runs #2 through 8) are also
represented in Figs. 3.11 and 3.12 which plot CIP and total
Group peak area response on the y-axls and JFTOT
temperatures on the x-axls. Fig. 3. II shows the CIP I-P, I I,
I I I and IV areas and their associated 95% confidence

86
TABLE 3.6
Reproducibility of the GC/OCI Analysis Technique for
n-Dodecane Polar Fraction Samples Collected Between200-400C
%RSD VALUES FOR STRESSED SAMPLE PRODUCT GROUPS If-IV USING
TOTAL GROUP AND CIP REPRESENTATION
TEMPERATURE CIP GROUP
II III IV II III IV
200C 00.00 00.00 00.00 00.00 00.00 00.00
250C 38.50 50.60 30.36 30.90 34.80 31.25
300C 14.2 10.20 4.93 17.18 16. I0 5.S2
350C 5.6 14.30 12.80 7.78 21.82 12.09
400C 9.4 6.93 32.26 14.82 7.71 34.48
Note: Calculations are based on Runs # 2 throu8h # 8 only.

87
100000
T (T is Heater Tube Temperature in "C)
400 350 300 250 200I I I I
IO00/T (T is Heater Tuba TemDerature in K]
_X_cIP I---4P-- CIP lI_&_CIP ll[_IF--- CIP IV
FIG. 3.11 Selected Group I, II, Ill and IV Impact SpeciesFrom Testing of Aerated n-Dodecane

88
500000
T (T is Heater Tube Temperature'in "¢)
400 350 300 250 200[ 1 I I I
= 400000-c
og
300000-L
z 200000"0
u 100000-
I1.4
T
1.6 1.8 2.0
IO00/T (T is HeaLer Tube TempePa_ure in K]
_X_GROUP I (Aldehydes)_GROUP II (Tetrahydrofurans)_&_ GROUP [[I (Alcohols + Ketones)
_V_ GROUP rV (Hydroperoxtdes)
2.2
FIG. 3.12 Total Group I, II, III and IV Products From JFTOTTesting of Aerated n-Dodecane

89
intervals (as a function of JFTOT temperature). Fig. 3.12
shows that the total Group l-P, If, [ I I and IV area
reproducibility between the 200-400C range of test
temperatures is good with the exception of Group III peak
areas (at 350C), which is poor due to the fused nature of
the co-elutlng dodecanol and dodecanone isomer peaks. The
large total Group I I I area variability observed at 350C is
minimized using the CIP representation, Fig. 3.11.
The baseline criteria, developed above, also was
applied to the baseline data generated as part of the dopant
experiments. Only the baseline data for the post-t000 ppm
dlbenzothlophene experiment was rejected, due either
to improper JFTOT operation or to use of poor quality
n-dodecane.
3.5.3 Long Term JFTOT System Reproducibility
Pure n-dodecane baseline runs performed after one year
showed the same Group [-V products profiles and
distributions as in the earlier work, Fig. 3.13. Although
there were slightly different yields, these data verify the
long term reproducibility of the modified JFTOT operation
and the analytical protocols. The differences in the yields
may be due to slight changes in F[D detector sensitivity.
Overall, the reproducibility in peak profiles of n-dodecane
samples collected at a single temperature (within a JFTOT
run), short term JFTOT operation, and long term JFTOT runs
gave confidence in the modlfled 3FTOT operation, sampling,
and GC analysis procedures. Another good indicator of

9O
125000
_O0000-C
0u
= 75000-L
Wm 50000-Z0
u gSO00-
Ol1.3
T (T is Heater Tube Temperature In *C)
400 350 300 250 200,I l l I l
_.5 _.7 _.9 2._
tOOO/T (T _s Heater Tube Temgerature _n K)
--X-- CIP I
CIP II
CIP Ill--V-- CIP IV
r
T
FIG. 3.13 Selected Group I, If, Ill and IV Impact Species
From Testing of Aerated n-Dodecane After One Year
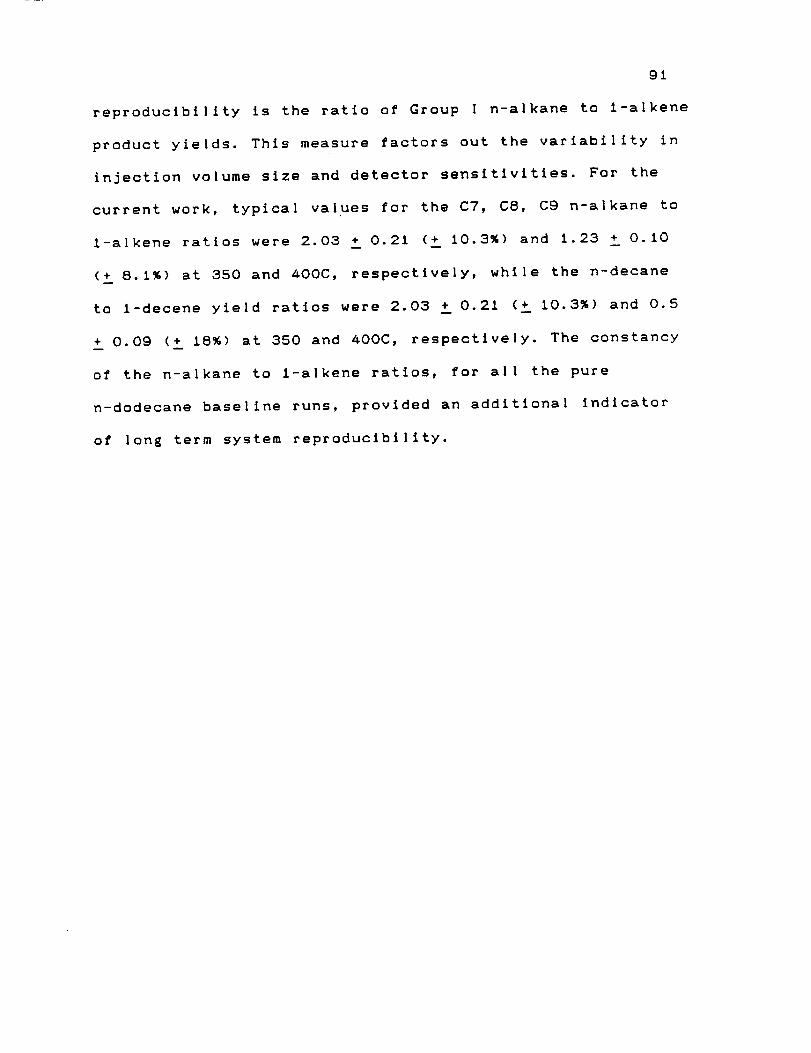
91
reproducibility is the ratio of Group I n-alkane to l-alkene
product yields. This measure factors out the variability in
injection volume size and detector sensitivities. For the
current work, typical values for the C7, C8, C9 n-alkane to
l-alkene ratios were 2.03 ! 0.21 (_ 10.3%) and 1.23 _ 0. i0
(+ 8.1%) at 350 and 400C, respectively, while the n-decane
to l-decene yield ratios were 2.03 _ 0.21 (_ 10.3%) and 0.5
+ 0.09 (+ 18%) at 350 and 400C, respectively. The constancy
of the n-alkane to 1-alkene ratios, for all the pure
n-dodecane baseline runs, provided an additional indicator
of lone term system reproducibility.

92
CHAPTER 4
NEAT n-DODECANE RESULTS AND MECHAN|SM DISCUSSION
In this chapter experimental results and discussion of
n-dodecane oxidation characteristics are presented. Pure
dodecane experiments were undertaken primarily to establish
a baseline neat n-dodecane data base, which provided the
added benefit of comparing our results wlth previous
n-dodecane work performed at the Naval Research Laboratory,
NRL (Hazlett et al., 1977). The temperature dependence of
the n-dodecane derived reaction products is examined in
Section 4.1 and comparisons with past work are presented in
Section 4.2. The effects of fuel aeration on the oxidation
behavior is examined in Section 4.3 and the modified
n-dodecane/oxygen reaction mechanism(s) in the autoxidative
(T ! 300C) and intermediate temperature regimes (300 < T
! 400C) are presented in Section 4.4.
4.1 TEMPERATURE DEPENDENCE OF THE REACTION PRODUCTS
The polar product Groups I-P, II, Ill and IV and their
reproducibility as a function of JFTOT temperature are
presented in Figure 4.1. Group I-P aldehydes form at SOOC,
and increase in concentration as the JFTOT temperature
increases. Group II product concentrations (corrected to
exclude reactant contributions) increase up to 350C and
stay constant thereafter. The Group Ill product build-up is
faster than Group I-P and II products at all temperatures.

93
400000
T (T Is Heater Tube Temperature In *C)
400 350 300 250I I I I
200I
1.4 I .6 t .8 2.0 2.2
*.O00/T [T Is Heater Tube Temperature In K)
_X_ GROUP ! (Aldehydes)GROUP I[ (Tetrahydroturans)GROUP 1[I (Alcohols + Ketones)
_ GROUP IV (Hydroperoxides)
FIG. 4.1 Polar Reaction Products From JFTOT Testing of
Aerated n-Dodecane Using GC/OCI Analysis
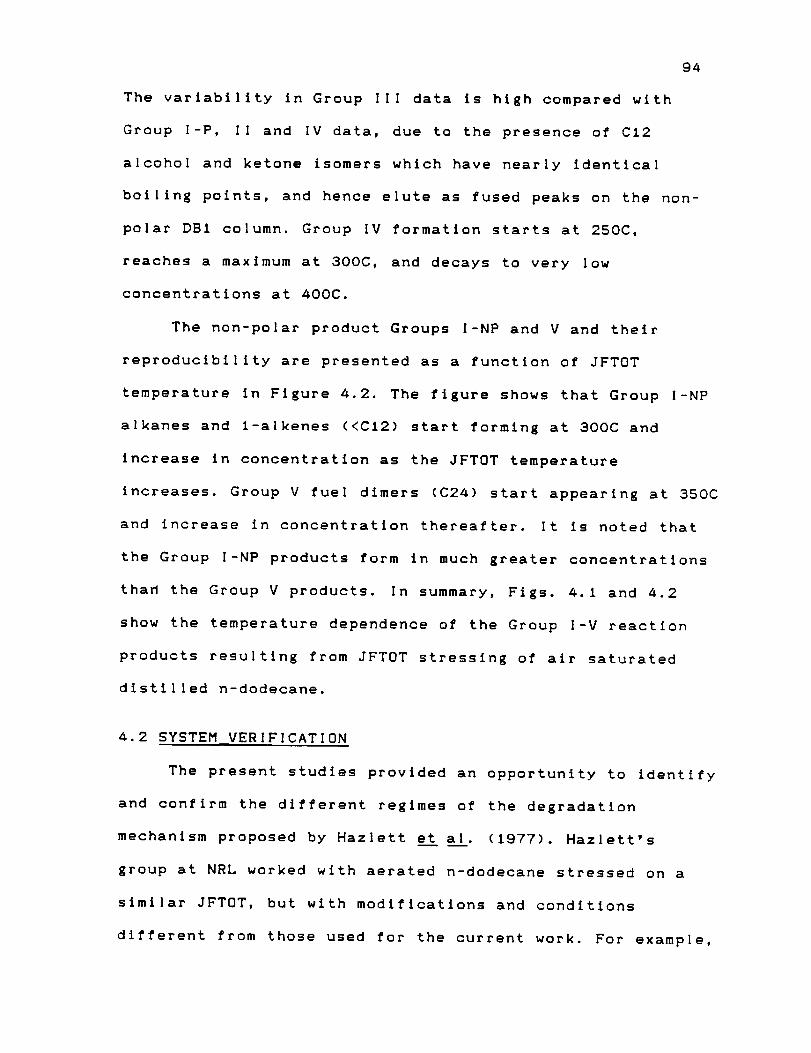
94
The variability in Group III data is high compared with
Group X-P, Xl and IV data, due to the presence of C12
alcohol and ketone isomers which have nearly identical
boiling points, and hence elute as fused peaks on the non-
polar DBI column. Group IV formation starts at 250C,
reaches a maximum at 300C, and decays to very low
concentrations at 400C.
The non-polar product Groups I-NP and V and their
reproducibility are presented as a function of JFTOT
temperature in Figure 4.2. The figure shows that Group I-NP
alkanes and l-alkenes (<C12) start forming at 300C and
increase in concentration as the JFTOT temperature
increases. Group V fuel dlmers (C24) start appearing at 350C
and increase in concentration thereafter. It is noted that
the Group I-NP products form in much greater concentrations
tha_ the Group V products. In summary, Figs. 4.1 and 4.2
show the temperature dependence of the Group I-V reaction
products resulting from JFTOT stressing of air saturated
distilled n-dodecane.
4.2 SYSTEM VERIFICATION
The present studies provided an opportunity to identify
and confirm the different regimes of the degradation
mechanism proposed by Hazlett et al. (1977). Hazlett's
group at NRL worked with aerated n-dodecane stressed on a
similar JFTOT, but with modifications and conditions
different from those used for the current work. For example,

95
t50000 _
m
ctO0000"0
u
amL
W
Z0
m 50000-
U
T (T is Heater Tube Temperature in "C)
400 350 300 250 200I 1 I I t
0
T -,--B-,-6ROUP1 n-ALKAHE5 AND i-ALKENES---4p.--.GROUPV DZHERS
\
\ JI
i.4 t.8 i.8 2.0 2.2
iO00/T [T Is Heater Tube TemDeretura in K]
FIG. 4.2 Non-Polar Reaction Products From JFTOT Testing
Aerated n-Dodecane Using GC/SplIt Injection
Analysis

gS
their study employed longer JFTOT heater tubes (5 inches
versus 2 3/8 inches) and lower fuel flow rates (3.0 ml/min
versus 3.75-4 ml/mln), consequently increasing the
fuel/heater contact times to 28 seconds relative to the 9
seconds experienced in the present work. Also, no tube
deposit rating (the deposits are rated on a scale of 0-4
based on a light reflectance principle) correlations were
done in the present work, since our procedure was to use one
tube for several temperature conditions.
The two sets of data are displayed in Figure 4.3. The
data could not be compared for temperatures greater than
400C (IO00/T < i.45) due to JFTOT operating limitations with
the present setup. Further, since no absolute concentration
measurements were attempted in the present study, the NRL
data was scaled to match the present data by setting their
ROOH curve maximum to be equal to the Group IV curve
maximum. Subsequently, all of their data was normalized
using this ROOHo°. as the normalizing factor. Comparing the
two data sets shows that the temperature histories of Group
I I I and IV data (present study) closely resemble the
corresponding [ROH + Ketones] and [ROOH] curves (NRL data),
although the Group IV maximum is shifted to a higher
temperature. The NRL work has shown that metals have an
effect on ROOH formation; aluminum tubes form ROOH the
slowest while 30a stainless steel tubes (employed in their
work) form ROOH the fastest; thus the shift may be due to
the use of aluminum heater tubes in this study. The
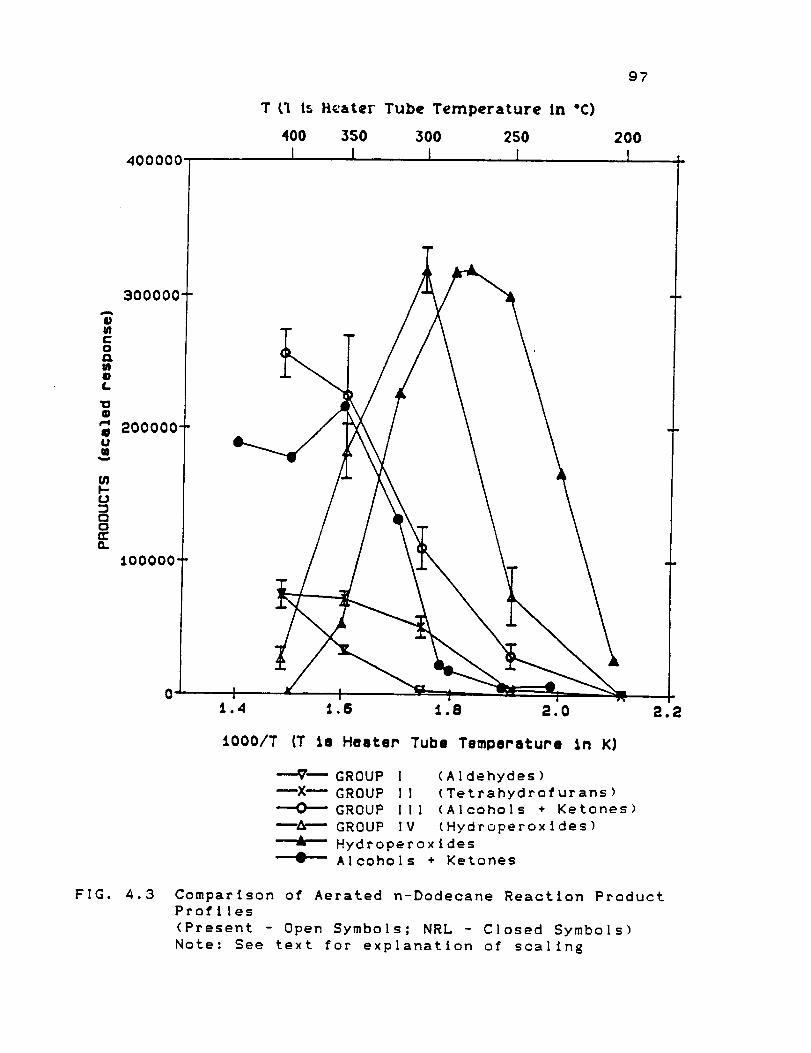
97
400000
300000-
WCO
mmL
m
m 200000-Um
k-
t3¢3rra,.
:tO0000-
o
T (1 Is Heater Tube Temperature In "C)
400 350 300 250 200I I i I 1
iO00/T (T 1= Heater Tube Temperature in KJ
---_-- GROUP i (Aldehydes)--X--GROUP II (Tetrahydrofurans)"--_ GROUP Ill (Alcohols + Ketones)
--_---- GROUP IV (Hydroperoxldes)
A HydroperoxldesA
" -- Alcohols + Ketones
FIG. 4.3 Comparison of Aerated n-Dodecane Reaction Product
Profiles
(Present - Open Symbols; NRL - Closed Symbols)
Note: See text for explanation of scaling

98
agreement in the Group Ill and IV product curves with the
ROH + Ketches and ROOH curves verifies that the results
obtained from the current work are consistent with the NRL
results. It was deduced earlier that Group IV species were
ROOH's or their decomposition products. The agreement tn the
Group IV and ROOH data provides additional evidence to
support this deduction.
The presence of the Group II products is not explained
by the existing n-dodecane degradation mechanism (Hazlett et
a__L]., 1927), which does not Inc|ude tetrahydrofurans. Since
they were detected and measured in the current work,
tetrahydrofuran products should be included in the
n-dodecane/oxygen degradation mechanism. Also, Group I-P
aldehydes were measured in this work, but were not detected
by Hazlett e___ta_J_1.However, they did postulate aldehyde
formation via ROOH decomposition reactions based on the
presence of carbon monoxide in their system, which is
thought to originate from aldehydes. Obviously, the better
ana|ytical sensitivity of the current study is enabling some
of the lower concentration intermediates to be detected and
quantified. In particular, the aldehydes and tetrahydrofuran
products were probably not observed previously due to the
lower detection sensitivity of the GC/packed column/detector
analytlcal configuration employed in their work compared to
the current work. It is also possible that the longer
residence times and higher bulk fuel temperatures involved
in the JFTOT operation played a role in this difference.
99
As noted in Section 3.5.3, another good indicator of
the system performance is the ratio of the individual
Group I-NP n-alkane (paraffin) to l-alkene (olefin) products
(P/O ratio). This measure eliminates the variability in
injection volume size and detector sensitivities. In the
present work, typical values for the C7, C8 and C9 P/O
ratios were 2.03 _ 0.21 (_ 10.3%) and 1.23 _ O.i (_ 8.1%) at
350 and 400C, respectively, which match quite closely with
the NRL P/O ratios of 2.0 and I.i at 345 and _30C,
respectively. Additionally, the present work shows a CIO
P/O ratio of 0.5 _ 0.09 (_ 18%) at 400C, while the
corresponding CIO P/O ratio at NRL was 0.5 at 430C.
Thus, the agreement in the P/O product ratios provide an
additional source of system verification.
a.3 EFFECT OF DISSOLVED OXYGEN
Experiments with deoxygenated fuels have been carried
out by various researchers (e.g., Taylor, 1974). Results
indicated a decrease in the deposit formation relative to
air saturated fuel experiments for the majority of fuels
investigated. In the present work, in addition to the
aerated neat n-dodecane experiments, an oxygenated and a
deoxygenated experiment were performed to examine the effect
of oxygen concentration on the soluble product formation.
These experiments also answered the question of what
products form directly from alkylhydroperoxlde (ROOH)
decomposition.

tO0
Usually, the aerated n-C12 experiments are performed
with 800 cc n-dodecane air saturated with 9 liters of air.
The oxygenated experiment was performed by saturatlnE n-C12
with 9 liters of oxygen and the deoxygenated experiment was
performed by purging n-Cl2 with 22.5 liters of nitrogen. In
all oases, no attempt was made to measure the dissolved
oxygen content. The results are presented in FIEs. 4.4-a.6.
Overall, soluble product formation is directly related
to the amount of dissolved ozygen present in the fuel.
FIEs. 4.4 and 4.5 show the effect of deoxyEenatlo n and
oxyEenatlon, respectively, on polar product distributions
relative to the aerated case. Fi E . 4.4 shows that fuel
deoxyEenation decreases the concentration of the polar
o×ygenated products (Groups l-P, I I, I I ! and IV). This is
not surprlsln E since o×yEen trIEEers the formation of the
o×yEenated products. The product concentration ratios for
the aerated case relative to the deoxyEenate d case (A/D
ratio), show that ROOH formation is greatly retarded
compared to the other oxyEenated products, i.e., aldehydes,
tetrahydrofurans, and alcohols + ketone (A+M) products,
indlcatin E that they are most sensitive to o×yEen
concentration. This is to be expected because C12 ROOH's are
the primary oxyEenated products arising from n-Cl2
oxidation. The A/D A+K product ratio increases as
temperature increases, beEinnln E from a ratio of 2.21 + 1.31
at 250C and attaining a ratio of S.92 _ 1.25 at 400C,
indlcatln E that A+K product formation is sensitive to

101
500000
200 250 300 350 400
UFTOT TUBE TEMPERATURE (C)
_ GROUP I (Aldehydes)
--A-- GROUP II (Tetrahydroturans)
_ GROUP {II (Alcohols + Ketones)O GROUP IV (hydrope_oxides)
FIG. 4.4 Effect of Deoxygenatlon on Polar Reaction Products
From JFTOT Testin 8 of n-Dodecane Using GC/OCI
Analysis of PI Fractions
(Air Saturated - Open Symbols;
Nitrogen Purged - Closed Symbols)
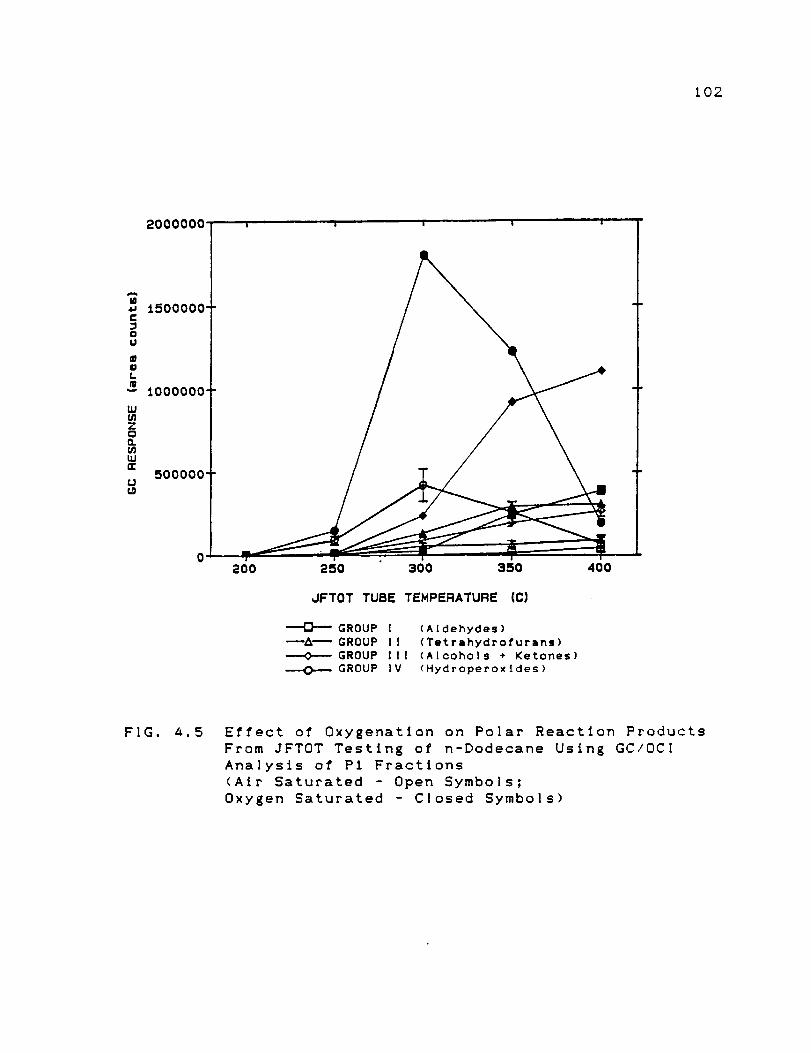
102
2000000
200 250 300 350 400
dFTOT TUBE TEMPERATURE (C)
---Q---" GROUP [ (Aldehydes)
_&_ GROUP II (Tetrahydroturans)----<>---GROUP llI (Alcohols + Ketones)
O GROUP IV (Hydroperoxides)
FIG. 4.5 Effect of Oxygenation on Polar Reaction Products
From JFTOT Testing of n-Dodecane Using GC/OCI
Analysis of PI Fractions
(Air Saturated - Open Symbols;
Oxygen Saturated - Closed Symbols)

103
300000
200 250 30O 350
dFTOT TUBE TEHPERATURE It]
400
FIG. z_.6 Effect of Oxygen Concentration on Non-PolarReaction Products From JFTOT Testing of n-Dodecane
Usln 8 GC/SpIit Injection Analysis of Entire Samples
(Air Saturated - Open Symbols;
Oxygen Saturated - Closed Symbols;
Nitrogen Purged - Dashed Lines)

104
temperature. At and beyond 300C, it is known that ROOH
decomposes primarily to yield A+K products; consequently,
aerated fuel with relatively high ROOH concentrations
decompose primarily to A+K products (beyond 300C), while
deoxygenated fuel with low ROOH concentrations keeps A+K
concentration fairly constant. Also, deoxygenatlon greatly
inhibits the formation of the primary oxidation product,
ROOH, which is a precursor for A+K formation. Therefore,
the A/D ratio increases with temperature.
Similarly, when the dissolved oxygen concentration
increases relative to the aerated case, Fig. 4.5, the
oxygenated product formation increases. As woOld be
predicted from the deoxygenated case, the ROOH
concentrations are increased, even higher than the other
products, relative to the aerated case, indicating that they
are the primary oxidation products most sensitive to oxygen
concentration.
Fig. 4.6 shows the effect of oxygen concentration on
non-polar reaction products (Group I and Group V) from JFTOT
testing of n-dodecane. Even though these products do not
contain any oxygen, a decrease in oxygen concentration
inhibits their formation, indicating that oxygen plays a key
role in their formation. Additionally, the Group I A/D
ratios, and the corresponding product concentration ratios
for the oxygenated case relative to the aerated case (O/A
ratio), both decrease as temperature is raised from 350 to
400C (the A/D ratios are 5.01 + 0.62 at 350C, and 2.88 +
I05
0.45 at 400C; and the O/A ratios are 3.53 _ 0.45 at 350C,
and 2.56 + 0.41 at 4OOC). With increasing temperature, the
Group [ A/D and O/A ratios decrease since fuel pyrolysis
reactions start to dominate, consequently decreasing their
dependence on oxygen concentration.
With deoxygenatlon (at 400C), the yield of Group I
products, although smaller, exhibits patterns similar to the
air saturated experiments, Fig. 4.7. This observation, along
with the above results, leads to the conclusion that Group
]-V products, which other workers have postulated as
precursors of deposit formation, are al I affected by oxygen
concentration, in agreement with earlier work.
A.a MODIFIED n-DODECANE/OXYGEN MECHANISM
As described in the last section, the present study
confirmed the presence of the autoxldatlon and intermediate
temperature regimes postulated by the NRL group. Thus, their
mechanisms were used as a starting point in explaining the
current results. Since no testing was done above 400C, the
pyrolysis scheme of reactions cannot be addressed.
4.4.1Autoxidatlon Regime (T ! 300C):
The autoxidatlon scheme of reactions, Reactions 1-3 and
8-8, have been well established as a result of many |lquld
phase oxidation studies (e.g., Emanuel et al., 1967; Brown
and Fish, 1969; Benson and Shaw, 1972). The extent to which
each of these steps, including additional Reactions 4, 5a
and 5b, describe the oxidation of n-dodecane at temperatures

106
z
2
mo
_0f_u1n
t/I01
.,..,
[.LI
.,-,0
0_
""_
00_
D_
_.O_
__D
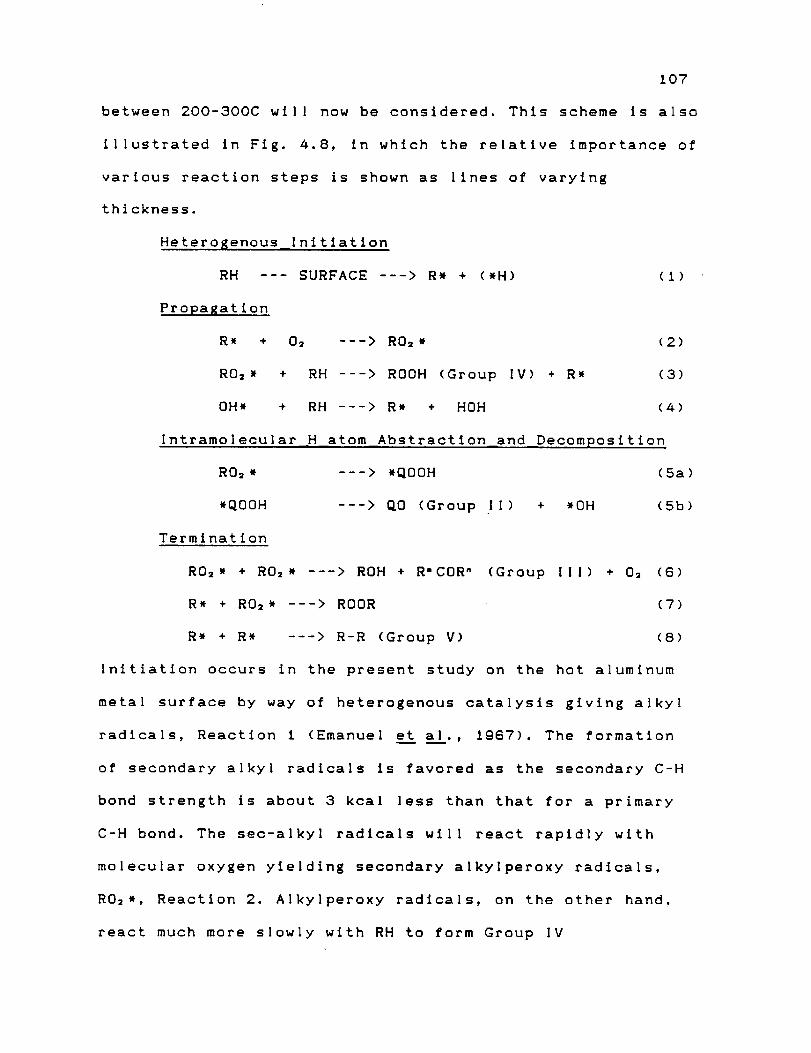
107
between 200-300C will now be considered. This scheme is also
illustrated in Fig. 4.8, in which the relatlve importance of
various reaction steps is shown as lines of varying
thickness.
Heterogenous Initiation
RH --- SURFACE ---> R* + (*H) (I)
Propagation
R* + 02 ---> R02* (2)
R02* + RH ---> ROOH (Group IV) + R* (3)
OH* + RH ---> R* + HOH (4)
Intramolecular H atom Abstraction and Decomposition
R02* ---> *QOOH (5a)
*QOOH ---> QO (Group IX) + *OH (5b)
Termination
R02* + R02* ---> ROH + R=COR" (Group III) + 02 (6)
R* + R02* ---> ROOR (7)
R* + R* ---> R-R (Group V) (8)
Initiation occurs in the present study on the hot aluminum
metal surface by way of heterogenous catalysis giving alkyl
radicals, Reaction I (Emanuel eta|., ig87). The formation
of secondary alkyl radicals is favored as the secondary C-H
bond strength is about 3 kca| less than that for a primary
C-H bond. The sec-alkyl radicals wil! react rapidly with
molecular oxygen yielding secondary alkylperoxy radicals,
RO2*, Reaction 2. Alkylperoxy radicals, on the other hand,
react much more slowly with RH to form Group IV
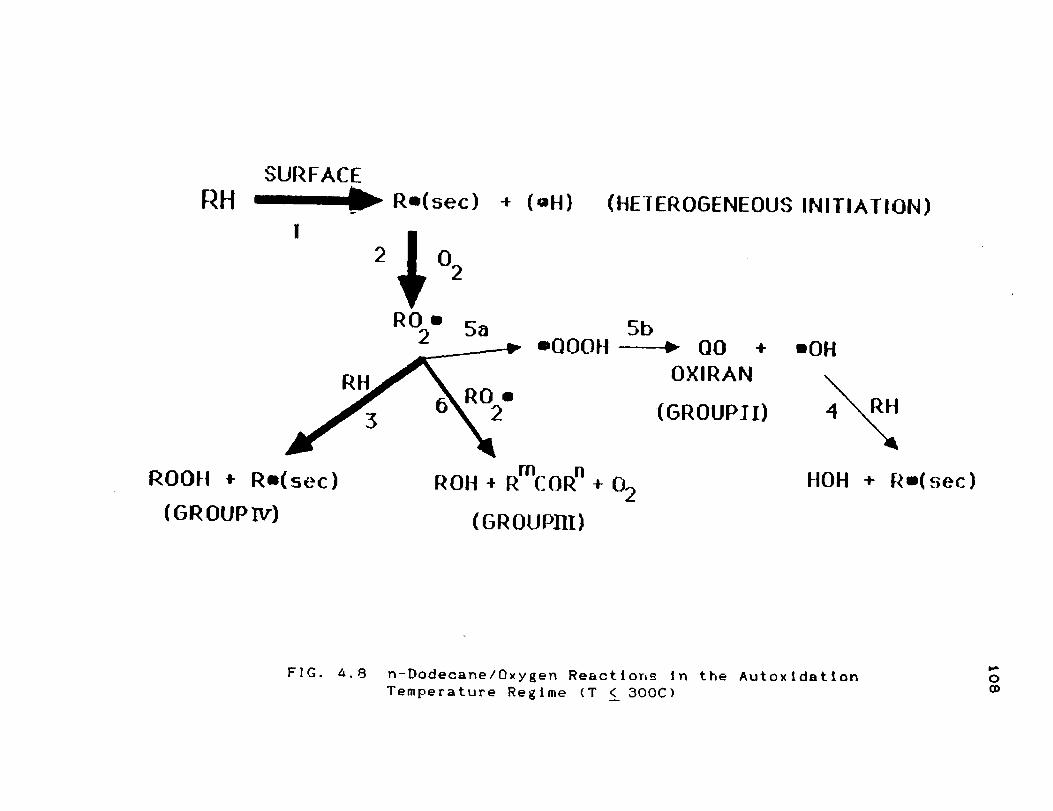
b_
Z0mmmZm0ZI..Q
0I,.Q
VV"t-
uV"w
O_
A
y.0
__u_II
X
?°00OI
b.4
0m,
LOv
+0
0
-I.-v
V_0
CD
0,...
1080.ca
"oXomO
_-0O_
._vlE
0U0_',
109
alkylhydroperoxides, ROOH's, Reaction 3. This step is slow
and is usually the rate controlling propagation reaction.
The presence of Group II O-heterocyclic products,
tetrahydrofurans (THF's), indicates the occurrence of RO_
intramolecular H-atom abstraction reactions via Reactions 5a
and 5b, which compete with the bimolecular R02 *
intermolecular H-atom abstraction, Reaction 3. The low
Group I I THF concentrations relative to the Group IV ROOH's
implies that abstraction reactions are predominantly
intermolecular, since the high RH concentrations (> 99.0%)
favor bimolecular reactions. In |iquid phase reactions, R02,
intermolecular hydrogen abstraction reactions are possible
if the high activation energy requirements are met (Fish,
1970; Mill and Hendry, 1980). Also, Benson (1985, 1972) has
shown that with molecules consisting of six carbon atoms or
greater, the intramolecular isomerization sequence becomes
more feasible due to higher collision frequency factors and
smaller activation energies. In the present case, THF
formation starts at 250C with increasing concentration at
higher temperatures, indicating that sufficient ROOH is
present and that the activation energy barrier required for
intramolecular reaction is overcome at least by 250C.
The formation of cyclic ethers such as THF is explained
by the alkylperoxy isomerization and decomposition scheme
(APRID scheme - Fish 196a, 1968), shown below.

H H H
-C-C-(CH: ).-C-
H 00. H
H H H
---> -C-C-CH2-CH2-CH-(CH2)._=-C
H 0 - 0 ... H H
K5a
110
H H H
-C-C-CH2 -CH2 -CH- (CH2).. , -C
H OOH H
KSb
>
H H CH_ - CH= H
I \I \ I
-C-C (THF) CH-(CH2).__-C- + *OH
l \ / IN \ --0--I H
The see-R02, radical intramolecular H-atom abstraction
starts initially with the formation of a seven-centered
transition ring involving the unpaired electron on the
oxygen atom and the gamma hydrogen. In fact, previous
experlmenta] data on 5- and 7- center reactions using 2,3-
dimethylbutane (Mill and Montorsl, 1973) and 2,5-
dlmethylhexane (Rust, 1957) show that the 7-centered
transition states are favored over 5-centered states. The 7-
centered state changes via internal H-atom transfer into the
hydroperoxyalkyl radical, *QOOH, Reaction 5a, subsequently
followed by C-O ring closure giving the five membered ether,
THF, with a|kyl substltuents such as methyl, propyl, and
pentyl groups attached at the 2- and 5- positions, and an
hydroxyl radlcaI, Reaction 5b.
Different classes of intramolecular products have been
experimentally observed and confirmed in liquid phase
n-alkane oxidation studies by Boss and Hazlett (1969)(n-C12

111
oxidation); Van Sickle et al. (1973) (n-C5 and n-C8
oxidation); and Jensen et al. (1979) (n-Cl6 oxidation). Van
Sickle et al. found that the absolute rate of Intramolecular
abstraction by sec-pentylperoxy radicals (secondary C-H
bonds) is one-eightieth of that of 2,4-dlmethyl-2-pentyl-
peroxy radicals (tertiary C-H bonds) and postulated reaction
steps 5a and 5b to explain such products. In contrast,
Cullis et al. (1981). working with liquid phase oxidation
of decane between 172-192C, were unable to detect any
O-heterocyclic compounds due to the lower test temperatures
employed relative to the present case (200 - 400C).
Apparently, the high activation energy required for R02*
Intramolecular isomerizatlon involving secondary C-H bonds
was not met at their test temperatures.
Further oxidation of the hydroperoxyalkyl radicals
(.QOOH) giving bifunctional oxygenated products, such as
dlhydroperoxldes and dlols, will be slow due to the low
oxygen and hydroperoxyalkyl concentrations present. Boss _t
al. (1973) employed similar low oxygen pressures as
encountered in the JFTOT experiments, and showed that RO=*
intramolecular H-atom transfer results in small quantities
of monofunctlonal oxygenated products (such as cyclic ethers
and oxetanes) during n-dodecane oxidation experiments.
However, they did not detect any blfunctlonal products. On
the other hand, Brown and Fish (1969) and Jensen et al.
(1979) detected the presence of mono- and bl- functional
oxygenated products.

112
The hydroxyl radical arising from Reaction step 5b
attacks the fuel, RH, to form water and alkyl radicals,
Reaction 4. The activation energy for Reaction 4 is only 1
to 2 kcal/mol (Berces and Trotman-Dickenson, 1961). As a
result, the attack of a hydroxyl radical on an alkane
molecule is almost independent of the C-H bond broken and,
consequently, far less selective than attack by an
alkylperoxy radical (Brown and Fish, 1969). This reaction
provides a small, additional route for alkyl radical
formation.
Of the three termination steps, Reactions 6-8,
Reactions 6 appears to be the dominant process since Group
Ill alcohols and ketones were detected at 300C and below.
Since no dimers (R-R) were detected, Reaction 8 is not
important. Therefore, Group Ill alcohols and ketones
detected in the present work can be accounted for by the R02*
self termination Reaction 6 (Van Sickle et al., 1973; Mill
et aJ_l., 1972). Reaction 8 is probably of small order as
compared to Reaction 6 due to the very low R* concentrations.
In summary, the modified n-dodecane oxidation mechanism
requires that alkylperoxyl radical reactions dominate in the
autoxidation temperature regime (T ! 300C). The dominant
path is for the alkylperoxyl radical, R02*, to react
bimolecularly with fuel to yield primarily alkylhydro-
peroxides. The R02* also undergoes self termination
and unimolecular isomerization and decomposition reactions,

113
to yield smaller amounts of C12 alcohol plus ketone products
and tetrahydrofuran derivatives, respectively. Thus. alcohol
and ketone formation in this temperature regime implies that
the main termination step is via R02* self termination
reactions, which refutes an earlier hypothesis that R*
radical termination reactions (giving C24 hydrocarbon
isomers) are importan_ (Hazlett et aI., 1977).
4.4.2 Intermediate Temperature Regime (300 ! T ! 400C) :
In the intermediate temperature range, between the
autoxldatlon and the pyrolysis regimes, molecular oxygen
does not play a dominant role. Hazlett eta|. (1977),
working with n-dodecane oxldation using stainless steel
JFTOT tubes, showed that the fraction of oxygen reacted
reaches 100% at 260C and beyond, implying that near|y all
the available oxygen is used up. Since no direct oxygen
measurements were attempted in the present study, the
[ROOH]... temperature of 300C was taken as the 100% oxygen
consumption temperature. Therefore, at 300C and beyond,
nearly al I available oxygen is reacted quickly, creating a
reducing environment. The shift in the 100% oxygen
consumption temperature from 260C to 300C is attributed to
the aluminum tubes used in the present study, which, as
noted earlier, form ROOH more slowly than 304 stainless
steel tubes.
In addition to nearly all available oxygen being used
up at higher temperatures (T _ 300C), the relative rates of
various reactions change. For example, at higher
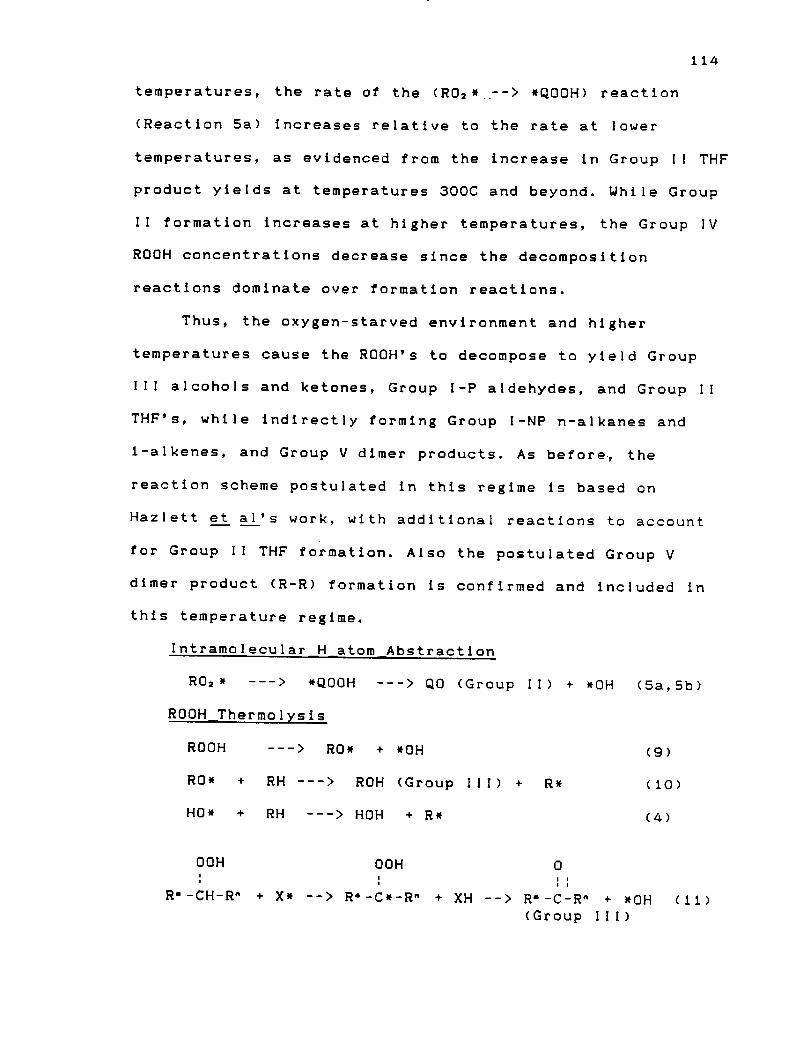
114
temperatures, the rate of the (R02* .--> *QOOH) reaction
(Reaction 5a) increases relative to the rate at lower
temperatures, as evidenced from the increase in Group II THF
product yields at temperatures 300C and beyond. While Group
II formation increases at hlgher temperatures, the Group IV
ROOH concentrations decrease since the decomposition
reactions dominate over formation reactlons.
Thus, the oxygen-starved envlronment and hlgher
temperatures cause the ROOH's to decompose to yield Group
Ill alcohols and ketones, Group I-P aldehydes, and Group II
THF's, while indirectly forming Group I-NP n-alkanes and
1-alkenes, and Group V dlmer products. As before, the
reaction scheme postulated In thls regime is based on
Hazlett et al's work, with additional reactions to account
for Group II THF formation. Also the postulated Group V
dimer product (R-R) formation is confirmed and included in
thls temperature regime.
Intramolecular H atom Abstraction
R02* ---> *QOOH
ROOH Thermolysls
ROOH ---> RO*
RO* +
HO* +
---> QO (Group If) + *OH (5a,5b)
+ *OH (9)
RH ---> ROH (Group III) + R* (I0)
RH ---> HOH + R* (4)
OOH OOH 0
R'-CH-R" + X* --> R'-C*-R" + XH --> R°-C-R" + *OH
(Group Ill)
(11)

B-Scission
O* 0
R=-CH-R - --> R=-CH (Group I-P) + R"*(pri)
Solvent Induced ROOH Decomposition
ROOH + RH ---> RO* + R* + H20
Heterogenous Initiation
RH --SURFACE--> R* + (*H)
R* Radical Formation via ROOH Decomposition
I15
(12)
(13)
(I)
RH + Y* ---> R* + YH (4.10.15)
(where Y* is ROOH derived RO*. OH* and R"* radicals)
B-sclssion
Rk_CH2-CH,-CH_-R l --> R.-CH_-CH=CH2 + R'*(pri) (14)
(Group I-NP)
Hydrogen Transfer
R'* or R"* + RH --> R'H or R"H + R*(sec) (15)
(Group I-NP)
Main Termination Step
R*(sec) + R*(sec) ---> R-R (Group V) (8)
The R02* radicals, as noted above, isomerize and
decompose into a THF and a hydroxyl radical via the APRID
scheme, Reactions 5a and 5b. This scheme is energetically
favored at intermediate temperatures relative to low
temperatures, because the higher temperatures provide more
RODH and further overcome the activation energies associated
with Internal R02* rearrangement. This explains the
increase in Group I I THF concentrations at temperatures

I16
greater than 300C. The hydroxyl radicals, produced from
Reactions 5b (and Reactions 9 and II), can also propagate
the chain by abstracting a hydrogen from RH to form water
plus an alkyl radical, Reaction 4 (Hazlett et al., 1977).
The thermal decomposition of a hydroperoxide is a
complex process since different reactions can occur
simultaneously and, in addition, the influence of the
solvent may be important (Brown and Fish, 1969). The various
ROOH decomposition paths and ensuing reaction steps are
illustrated in Fig. 4.9. First, the simplest type of
decomposition involves the unimolecular homolysis of the 0-0
link giving RO* and *OH radicals, Reaction g "(Tobolsky and
Mesrobian, 1954; Hiatt, 1972). Secondly, ROOH reacts with
the solvent, RH, giving ROw, Rw and H20, Reaction 13
(Emanuel, 1982). If the activatlon energies of the above
reactions are considered, _H, = D(,._.._ m35 kcal/mol
(Ingold, 1961), while AH,, = D,c-., + D,o-o, - D,.-o., =94 +
35 - 120 _9 kcal/mol for a secondary C-H bond. Brown and
Fish (1969) experlmental ly determined an overall activation
energy of ROOH decomposition. The occurrence of the
bimolecular ROOH decomposition step cannot be confirmed
experimentally because the R*(sec) and RO* radicals
resulting from this decomposition form the same products as
those resulting from unlmolecular ROOH decomposition (i.e.,
ROH, RCHO and R"H). A third ROOH decomposition path involves
ROOH collision with an X* radical yielding a C12 ketone and

117
ROOH
Rm CO Rn + ×H ROe + aOH Ra(sec) + ROI + HOH
(GROUPIII) 1
ROH + Ra( J t_-_cr_esec)\ion
(GROUPIII) 12 \ HOH + Ro(sec)
nRCHO + RI(pri)
(GROUP I-P) /
15 _ RH
n-ALKANE + Ro(sec)[GROUP [-NP)
FIG. 4.9 Hydroperoxlde Decomposition Reactions In the
Intermediate Temperature Regime (300 < T < 400C)m

118
a hydroxyl radical, Reactlon 11 (Emanuel et al., 1967;
Hazlett et al., 1977).
The sec-alkoxy radicals, RO*, produced from Reaction
steps 9 and 13, primarily abstract a hydrogen to form Group
Ill dodecanols, Reaction I0 (Brown and Fish, 1969).
Secondly, at 300C and above, some of the alkoxy radicals
decompose by B-sctssion forming a Group I-P aldehyde and a
primary alkyl radical, Reaction 12 (Emanuel et al., 1967;
Brown and Fish, 1969; Hazlett et at., 1977). The primary
radicals formed in step 12 produce a Group I-NP n-alkane and
a secondary alkyl radical via intermolecular H-atom
abstraction from an RH molecule, Reaction 15. Alkoxy
radical, RO*, reaction wlth ROOH to form ROH and a RO_*
radical (Brown and Fish, 1969) is unlikely in our case.
since the energy required to break an ROO-H bond (forming an
R02* radical) is far greater than that necessary to break
the RO-OH bond, i.e., D,o.., > Dco-o, . Another reason thls
reaction is not feasible is because of the relatively hlgh
RH concentrations compared to the ROOH concentrations, which
makes RH reactions (RO* + RH ---> ROH + R*) more llkely than
ROOH reactions (ROOH + RO* ---> ROH + R02*).
The sec-alkyl radicals, R*, can form in two ways. The
two R* radical formation paths and ensuing reaction steps
are illustrated in Fig. a. lO. First, a pool of R* radicals
is provided vla RH heterogeneous metal initiation, Reaction
1. Secondly, at these elevated temperatures (T k 300C),
ROOH decompositlon results in RO*, OH* and R"* radicals

11g
SURFACE•_ ( ) ( H);,,_ Re sec + •.<,RH y ,..__r
4,10,13,15
HETEROGENEOUSINITIATION
nRe(sec) + HY; Y = ROe, OHI, R • (pri)
RADICAL INITIATION}
R*(sec)
I-OLEFIN + Rn•(pri)
(GROUP I-NP) 15 _RH
(GROUP V)
n-ALKANE + R•(sec)(GROUP ]:-NP)
FIG. 4.10 Dodecyl Radical (R*) Reactlons in the Intermediate
Temperature Reglme (300 _ T _ 400C)

120
which react, in turn, with the fuel, RH, giving R* radicals
via Reactions 4, 10, and 15. The fraction of R* radicals
formed due to ROOH decomposition versus heterogeneous metal
initiation of the fuel can be inferred by comparing the
n-dodecane derived Group I products from normal aeration
experiments (g liters of air passed through 600 cc of n-Cl2)
with deoxygenation experiments (22.5 liters of nitrogen
purged through 600 cc of n-Ci2), Fig. 4.6. As noted, the
figure shows that deoxygenatlon greatly inhibits Group I
n-alkane and l-alkene product concentrations relative to the
aeration case, indicating that oxygen plays an important
role in Group I formation. Since Group I products form via
R* radical reactions, this result implies that R* radical
formation via oxygenated products, ROOH, dominates over
heterogeneous metal initiation.
The R* radicals, formed by the radical and
heterogeneous metal initiation steps, either decompose to
form smaller l-alkenes (< C12) and additional primary alkyl
radicals via B-scisslon, Reaction 14, or self terminate to
form dlmers via Reaction 8. Subsequently, the primary alkyl
radical formed via B-scission abstracts an H-atom from a
fuel molecule to form a smaller n-alkane (< C12) and
regenerates the R* radical, Reaction 15 (Hazlett et al.,
1977). The sequence of reactions I, 14 and 15 constitute a
modified form of the single step Fabuss-Smith-Satterfleld
fuel pyrolysis scheme (Fabuss e__t_tal., 1964). Reactions 14
and 15 comprise propagating steps of a free radical chain

121
which afford more product than a l:l relationship to the
ROOH decomposition step would indicate.
The higher concentrations of the Group I-NP, l-alkenes
and n-alkanes relative to the Group V n-Cl2 dimers indicates
that Reaction 14 dominates over the termination step,
Reaction 8, and becomes increasingly important as the
temperature is raised from 350 to aOOC. Dimer formation
via alkyl radical recombination starts at 350C and
increases as temperature is raised to aOOC. Brown and Fish
(1969) postulated that high temperatures favor alkyl radical
formation relative to the R02* radicals. Therefore, it is
not surprising that the R* radical derived products dominate
at higher temperatures (T h 300C). Also, Hazlett et al.
(1977) postulated that the main termination reaction at
these elevated temperatures is via R* radical self
termination, yielding R-R dimer products. In the present
work, dlmer product detection confirms the R* radical self
termination hypothesis.
In summary, in the intermediate temperature regime (300
< T < 400C), the R_ alkyl radical reactions dominate
the R02* reactions, since the R* radical products such
as n-alkanes and l-alkenes form in greater concentrations
than the R02* products such as ROOH's, C12 alcohols, C12
ketones and tetrahydrofurans. The RN radicals form mainly
via two sources: (i) ROOH decomposition reactions, which
yield stable reaction products such as C12 alcohols, C12
ketones, <C12 aldehydes and a pool of R# radicals; and (ii)

122
direct fuel pyrolysis. The R* radicals thus formed have two
major reaction pathways. B-scission forming n-alkanes and
l-alkenes constitutes the dominant path, while R* radical
dimerizatlon reactions forming C24 alkane isomers makes up
the minor reaction path. Small amounts of tetrahydrofuran
products can be explained by R02* Isomerlzatlon and
decomposition reactions.
4.5 CONCLUSIONS
In summary, the system verification studies showed that
the < C12 n-alkanes and l-alkenes, C12 alcohols and ketones
and ROOH (hypothesized) product profiles agree with the NRL
data. However, additional < C12 aldehydes, tetrahydrofurans
and C24 isomers were detected due to the better sensitivity
of the analytical instrumentation and protocols employed in
this work. Consequently, the existing n-dodecane degradation
mechanisms were modified to include these products.
The modified n-dodecane oxidation mechanism requires
that alkylperoxyl radical reactions dominate in the
autoxidatlon temperature regime (T < 300C). The dominant
path is for the alkylperoxyl radical, R02*, to react
blmolecularly with fuel to yield primarily alkylhydro-
peroxides. The R02* also undergoes self termination and
unlmolecular Isomerlzatlon and decomposition reactions, to
yield smaller amounts of C12 alcohol and ketone products and
tetrahydrofuran derivatives, respectively. Thus, alcohol and
ketone formation in this temperature regime implies that the

123
main termination step is via RO_* self termination
reactions, which refutes an earlier hypothesis that R*
radical reactions (giving C24 isomers) are important
(Hazlett et al., 1977).
In the intermediate temperature regime (300 _ T _ 400C),
the R* radical reactions domlnate the R02* reactions. The
main supply of R* radlcals comes from ROOH decomposition
reactions, while heterogeneous metal initiation constitutes
the secondary source. The R* radicals, in turn, decompose to
form n-alkanes and l-alkenes (< C12) and trace amounts of
C2_ isomers.

124
CHAPTER 5
n-DODECANE PLUS DOPANT RESULTS AND MECHANISM DISCUSSION
Polar heterocyclic compounds containing sulfur,
nitrogen and oxygen atoms, unavoidably present in the fuel,
are involved In many of the chemical processes affecting
fuel thermal instability. In order to study dopant effects,
a few compounds were selected based on their reported
deposition tendency, and added to the n-dodecane model fuel;
the resulting mixtures were tested on the modified JFTOT
apparatus. The sulfur compounds selected were: 3,4-
dlmercaptotoluene (high deposition tendency), dIbutylsulflde
(low deposition tendency) and dlbenzothlophene (no effect on
deposition), while the nitrogen compounds chosen were
pyrrole (hlgh deposition tendency), 2,5-dlmethylpyrrole
(hlgh deposition tendency) and pyrldlne (low deposition
tendency). A typical dopant test sequence involved:
baseline, I0 ppm, I00 ppm, I000 ppm (molar ratios) JFTOT
experiments; a 150 cc distilled n-dodecane flush; followed
by a second baseline JFTOT experiment. Also, prior to the
second baseline experiment, the last portion of the flush
was ana|yzed on the GC and checked for dopant carry over. If
any trace of dopant was detected, additional flushes were
carried out until no dopant was detected.
Following these experiments, the control and stressed
samples were analyzed for the soluble oxidation products

125
using GC and GCMS techniques. The soluble products detected
were the same as for neat n-dodecane oxidation (Groups I-V),
however changes in their distributions were noticed. The
dopant derived product distributions relative to the
baseline could be classified into three categories: no
significant differences, differences with no dlscernable
trends, and differences with definite trends. The first case
indicates that dopant addition introduces virtually no
changes in the neat n-dodecane reaction mechanism. The
second case implies that the reaction rates for some of the
product Groups change relative to the baseline, due to
dopant addition. The third case indicates that definitive
mechanism inferences relative to the baseline can be made
due to the product trends observed with changes either in
temperature and/or dopant concentration.
No dopant related products were detected, however, due
either to very low concentrations (ppb levels) or to a
polarity mismatch between solvent and dopant oxygenates
during Sep-pak fractlonation. Hence, all dopant mechanism
inferences are based on changes in n-dodecane derived Group
I-V product distributions alone. As noted, since all changes
in product distributions with dopant addition are relative
to the baseline results, the modified n-dodecane mechanism
discussed in Section _.a serves as the starting point for
exp|ain_ng the n-dodecane plus dopant results, with new
reactions involving dopants and n-dodecane having reaction
numbers starting with 18.

126
5.1 NITROGEN DOPANT EXPERIMENTS
Nitrogen heterocycllc compounds commonly occurring
in distillate fuels include alkylated pyridlnes, quinolines,
tetrahydroquinollnes, indoles, pyrroles and carbazoles. In
this study, pyrrole and pyrldine were chosen to study the
effect of a five- and six- membered N containing heteroatom,
respectively. An alkylated pyrrole (2,5-dlmethylpyrrole,
DMP) was also examined for the following reasons: (a) alkyl-
pyrroles have been detected in hlgh-nitrogen middle
distillate fractions, (b) highly pure DMP is commercially
available, (c) alkylatlon adjacent to the nitrogen atom in
an active heterocycllc nucleus is very influential in fuel
instability, and (d) DMP promotes the formation of
significant amounts of insoluble material during storage
stability testing of diesel and Jet fuels (Cooney et al.,
1986; Frankenfeld et al., 1981 and 1982).
n-Dodecane was individually doped with pyrrole.
pyridine and DMP and tested using the protocols described
above. As noted, the major soluble degradation products were
the n-dodecane derived Group I-V products, but with shifts
in their distributions. Major differences were observed with
DMP, but the addition of pyrrole and pyrldlne changed the
degradation product distributions only slightly. Therefore,
a detailed analysis was performed only for the DMP data,
while a more qualitative analysis was made for the latter
two dopant species.

127
5.1.1Pyrrole
With pyrrole addition, the Group II-IV product
distributions change as seen in Fig. 5. I. The Group I I
product curves follow a I0, I000 ppm > baseline > I00 ppm
trend at al I temperatures tested, indicating that a decrease
in product formation occurs at the intermediate pyrrole
concentration of I00 ppm, Flg. 5.1a. In the 200-300C
autoxldation temperature range, Group I| I products fol low a
I000 ppm > I00 ppm > 10 ppm > basellne trend, imp]ylng that
pyrrole addition accelerates the R02* self termination
reactions, enhancing Group I I| formation. At 350C this
trend changes, since the Group Ill products follow a I000
ppm > baseline > I0 ppm > lOOppm trend, indicating that
pyrro|e addition at I0 and I00 ppm levels appears to inhibit
Group I I I formation, while the I000 ppm dopant level still
promotes their formation, Fig. 5.1b. The I0 ppm Group IV
curve shows higher levels in comparison with the baseline
curve at all temperaures tested indicating that addition of
I0 ppm pyrrole enhances Group IV product formation, but
higher dopant levels decrease Group IV formation below
baseline results, Fig. 5.1c. (The Group IV 300C, I000 ppm
data is not valid due to improper sample collection).
5.1.2 Pyrldine
Pyrldlne experiments were carried out only at I0 and
I000 ppm levels, with Group II and IV product distributions
changing as seen in Fig. 5.2. The Group [ I formation appears
to be delayed to 250C (relative to 200C for the baseIlne

128
i i i A a
-=-0--- li_ liD. INI[,=--dr--tO
i _JP-- tOO P,eu
|
o aio ,io _io _io ,oo
_I'TOY Y3JIJ_ I'Y_UIIAT%,gl( I_
(a) GROUP II
I &N(NIO i i i
--..@-=- l_iXa.J_l
_11-=- 800 _
OI -
i-%: °,'°'
_le_ 800
i 0 tOO0
i
'" Ho ,io 3_o a.o ,_o--
(c) GROUP IV
FIG. S.1 Effect of Pyrrole on Group ll-lV Species in the P1Fractions Using GC/OCI Analysis

i 10000"
I I I I
---¢>-- l_ll_IJ_l
--X-,,-- tO00 Pl_
]04) _lO ]00 380 400
jrl'Irf 11.111 lllllDlglllIJlll I¢!
(a) GROUP I[
I I I I I
F ---l>.-- I_IILII41
°Iw
(b) GROUP III
i ?'J400
_ 111_IIJIII I¢I
(c) GROUP IV
t29
FIG. 6.2 Effect of Pyrtdtne on Group If-IV Species In the PtFractions Using GC/OCI Analysis

130
case) in the presence of pyridine, indicating possible
inhibition of R02* isomerlzatlon and decomposition rates.
However, as the temperature is raised to 250C and then to
300C, the pyrldlne causes Group XI formation to increase
relative to the baseline case, while the opposite occurs in
the 300-350C region, Fig. 5.2a. A slight inhibition of
Group I X I products is observed in the 300-400C range, Fig.
5.2b. The addition of I000 ppm pyridlne appears to
consistently show Group IV concentrations higher than the
basellne and I0 ppm runs, indicating that pyridine promotes
ROOH formation, Fig. 5.2c.
5.1.3 2r5-Dimethylpyrrol e (DMP)
With DMP dopant addition, the Group I I-IV product
distributions change as seen in Fig. 5.3. In the 200-300C
autoxldation temperature regime, high DMP concentrations
(added at the I00 and I000 ppm levels) appear to inhibit
Group IV (ROOH) formation, relative to the baseline and
i0 ppm DMP cases, implying that DMP molecules successfully
compete with n-dodecane for the avai]able oxygen through
cooxldatlon reactions, Fig. 5.3c. This is explained by the
fact that at low temperatures the energy required to break a
(C4NH3)(CH2-H) bond is about 85 kcal/mo|, which is
i0 kcal/mo] less than that of the secondary C-H bond in the
n-dodecane molecule (95 kcal/mol). The decrease in ROOH
formation (with addition of the more reactive DMP to
n-dodecane) agrees with the work done by Mayo et al. (1983),
who showed that smaII amounts of fast-oxldlzing Indene (a
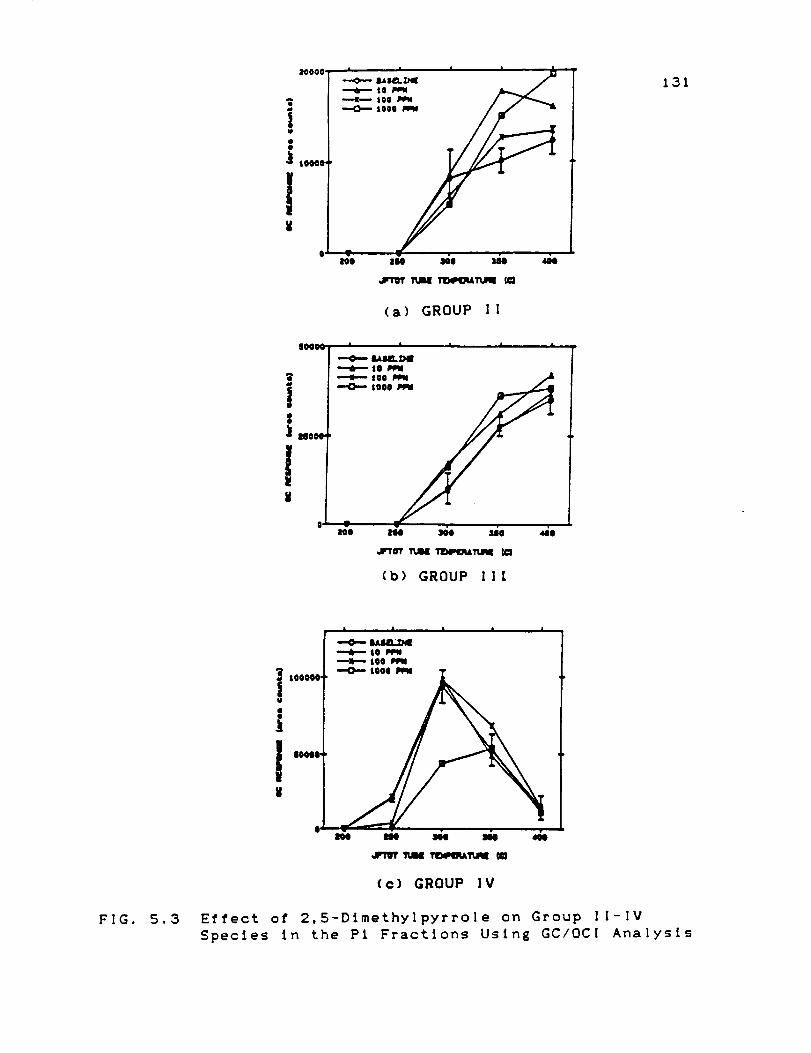
i 100410
o _'o =aTo _o a_o
(a) GROUP II
131
--'0.,.-- 1_143.ZN8_tO*rot--'* 800 _ j,K
$000
"'lIO0 imO _JO4J XiO 4410
jr'rrr 3'uNt _'13.p18 K:I
(b) GROUP II[
FIG. 5.3 Effect
SpecLes
I I i I I
"i" lO PPI--k 10l PPM
i
i |00000' --"O..-- t00t P.PII_
IN)ql NO _ INNI 400
.JPrVm' 'nJI TIDeu, B_TUq8
(c) GROUP IV
of 2,5-Dimethylpyrrole on Group If-IV
tn the P1 Fractions Using GC/OC[ AnaLysls
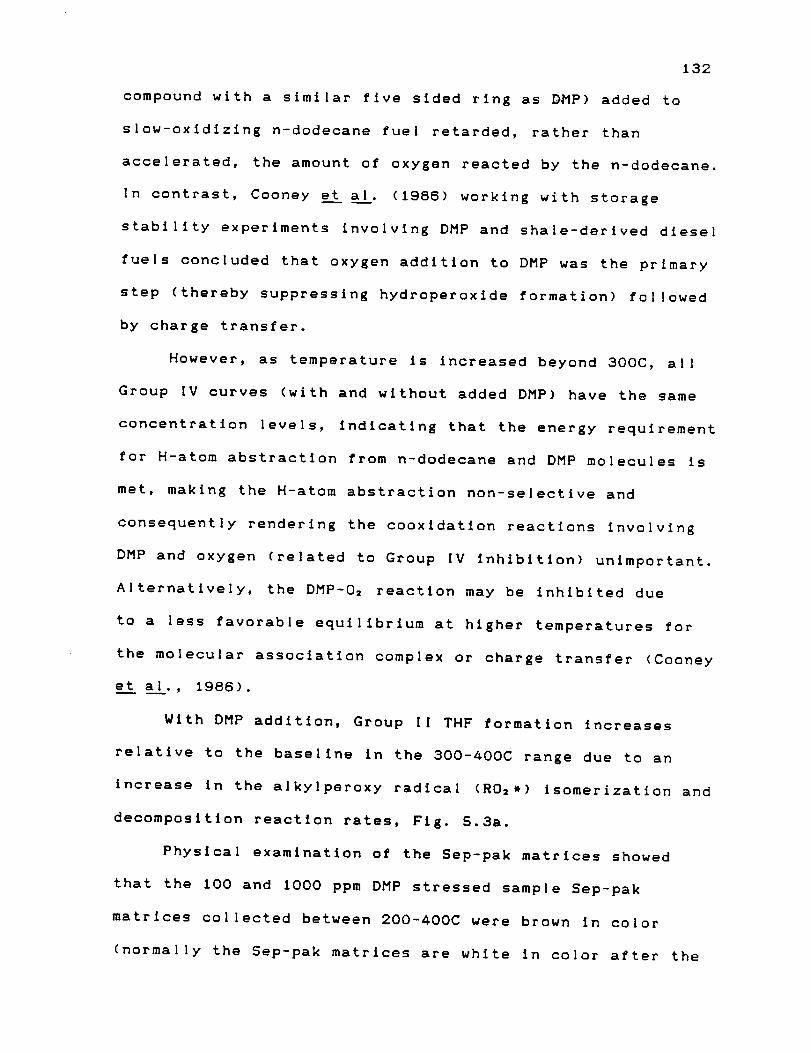
132
compound with a similar five sided rlng as DMP) added to
slow-oxldlzlng n-dodecane fuel retarded, rather than
accelerated, the amount of oxygen reacted by the n-dodecane.
In contrast, Cooney et al. (1986) working with storage
stability experiments involving DMP and shale-derlved diesel
fuels concluded that oxygen addition to DMP was the primary
step (thereby suppressing hydroperoxlde formation) followed
by charge transfer.
However, as temperature is increased beyond 300C, all
Group IV curves (with and without added DMP) have the same
concentration levels, indicating that the energy requirement
for H-atom abstraction from n-dodecane and DMP molecules is
met, making the H-atom abstraction non-selective and
consequently rendering the cooxidation reactions involving
DMP and oxygen (related to Group IV inhibition) unimportant.
Alternatively, the DMP-O_ reaction may be inhibited due
to a less favorable equilibrium at higher temperatures for
the molecular association complex or charge transfer (Cooney
et al., 1988).
With DMP addition, Group II THF formation increases
relative to the baseline in the SO0-400C range due to an
increase in the alkylperoxy radical (R02*) Isomerization and
decomposition reaction rates, Fig. 5.Sa.
Physical examination of the Sep-pak matrices showed
that the I00 and 1000 ppm DMP stressed sample Sep-pak
matrices collected between 200-400C were brown in color
(normally the Sep-pak matrices are white in color after the
133
fractionation procedure), indicating that highly polar,
chromophoric products are formed which do not coelute with
the n-dodecane derived Group If-IV products in the P1
fractions. The highly polar products are yet to be
identified.
5.2 SULFUR DOPANT EXPERIMENTS
Daniel et al. (ig83) carried out storage stability
experiments involving Jet 'A' fuel doped with sulfur
compounds. They found that thiols and thiophenes increased
deposit formation relative to a pure Jet fuel, and that the
rate of deposition was a function of the concentration of
the added sulfur compound. In contrast, alkyl sulfides and
disulfides decreased the deposit formation rate. Frankenfe[d
et al. (1982) evaluated a variety of organic sulfur
compounds for their tendency to promote sediment formation
in hydrocarbon fuels under accelerated storage conditions.
They found that, with the exception of sulfonic acids and
aromatic thio|s, none of the sulfur compounds produced
sediments during storage at ambient or near ambient
conditions when tested by themselves. These findings are in
sharp contrast with the results of thermal stability studies
(Taylor and Wallace, ig68) in which many sulfur compounds
were quite deleterious to Jet fuels tested between g3-232C.
In particular, thioIs, sulfides, disulfides and condensed
thiophenes (at I000 ppm S levels) increased the rate of
deposit formation, while diphenylsulfide and

134
dibenzothiophene did not affect the rate of deposit
formation. The formation of deposits under high temperature
conditions apparently proceeds by different pathways than in
the case of ambient or near ambient storage.
In order to clarify the effects of sulfur compounds
during high temperature testing, three dopant test sequences
involving a sulfide (dlbutylsulflde), a thlol (3,4-
dimercaptotoluene or 3, a-toluenedlthiol) and a thlophene
(dlbenzothiophene) were performed using the protocols
described above. The major soluble degradation products were
n-dodecane derived Group I-V products, but with shifts in
their distributions with 3,4-dlmercaptotoluene and
dibutylsulflde addition.
5.2.1 3,4-Dimercaptotoluene (DMT)
With DMT addition, the soluble oxidation product
distributions (Groups I-V) change relatlve to the baseIlne
case as illustrated In Fig. 5.4. Also, Fig. 5.5 gives the
peak profiles of the chromatograms from the baseline and
dopant samples at 400C and shows that Group l and V
products are selectively inhibited with dopant addition,
with the 1-alkene species being inhibited to a greater
extent than the other Group I species.
In order to explain this behavior, the neat n-dodecane
reactlon scheme was modified to include DMT dopant (DH)
reactions, Figs 5.8 and 5.7. In the autoxidation regime, the
modified scheme is (Fig. 5.6):

|0000-
i 40000,
V
I i i I "
•---_J----iO PPN
_X---" tOO PPN1000 PPN
H0 NO NO ,M0 400
dr_r TUN _4q_TU_
(a) GROUP I I
135
40000, n i n I a
I _ log p,me //
1ozoooo
O'IlOCl MO _O _ 400
_lrl'lT _ TII41111A_III II1
(b) GROUP I II
FIG. 5.z_
I i i i I
Ot --"0'_ I_II_.M
---6--- $o Pl_
. --X--- tOO _ T
i $OOOO
1
(c) GROUP IV
Effect of 3,4-DLmercaptotoluene on Group II-IV
Species In the PI Fractions Using GC/OCI Analysis
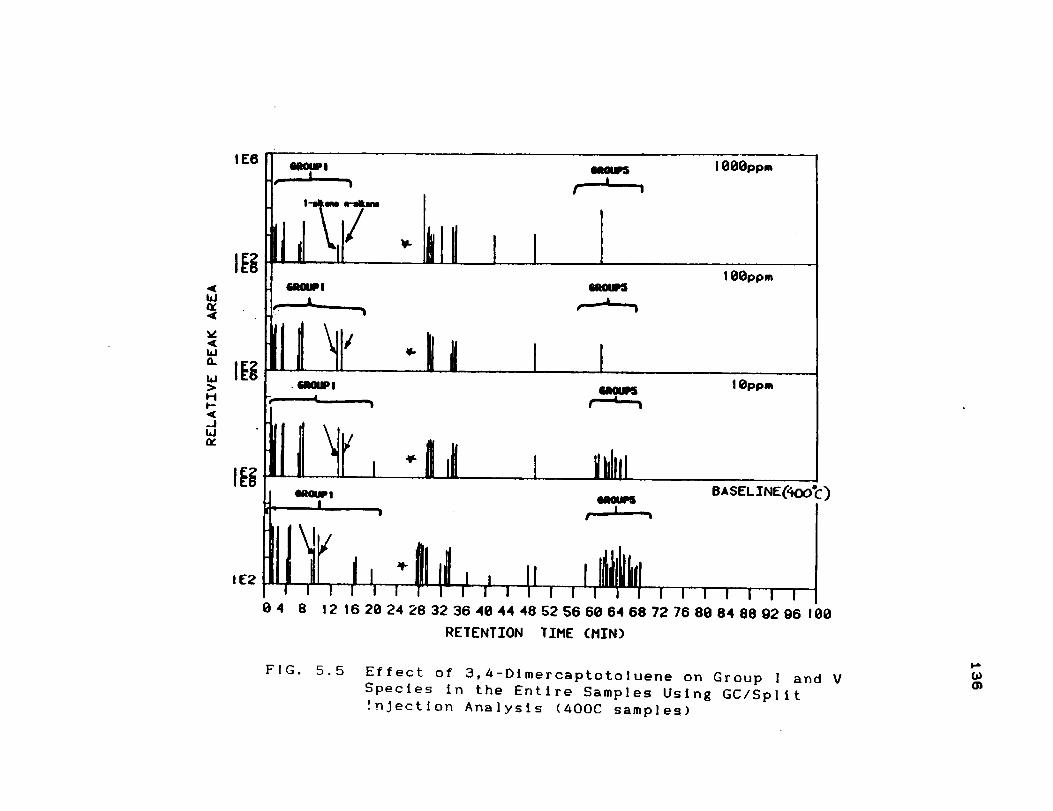
136
£O.
O,
I
£O.
GL
|O.
m
WZt.'4
W
--mCO
TCO
.T _r"
H
Y3UY
_Y3d
3ArlY73_
N
O.
OL)
LOC
C_(_
0(..,-,
CO
,(
00
(J-_
(J
_bO
-.
UO
6O
U.
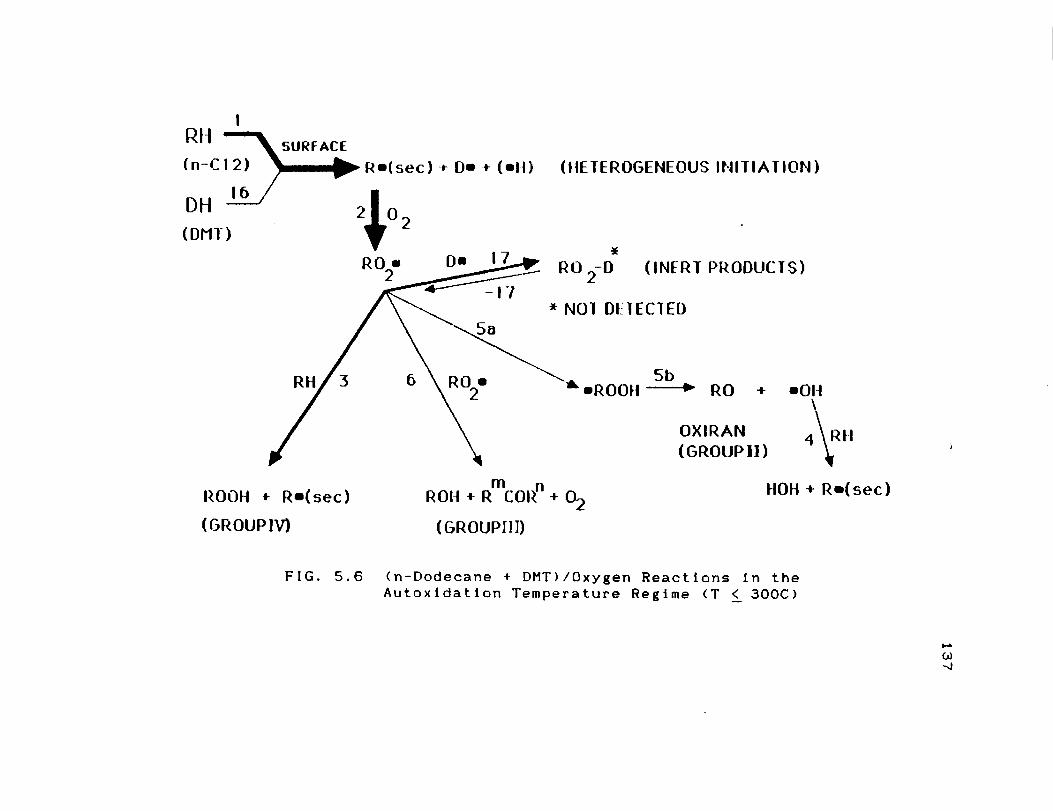
_137
A
_o
oZ_
vl
z_
O_
0_D
x0÷0×
ZD
_D
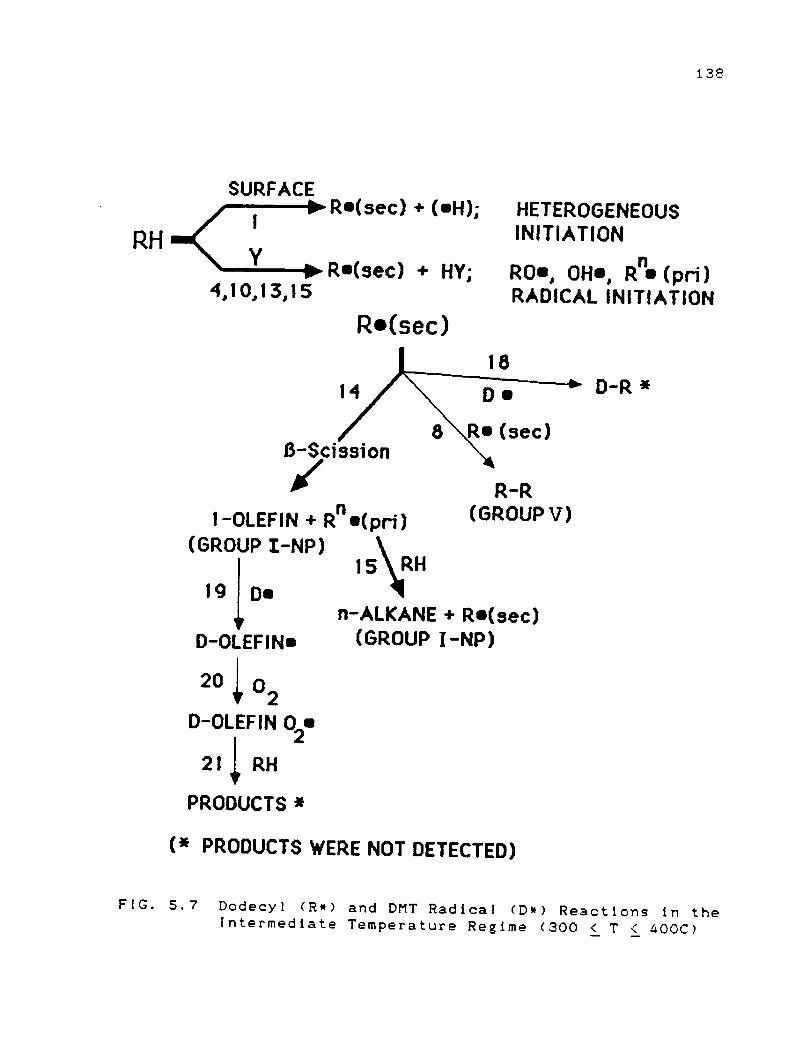
t38
RH y
SURFACERm(sec) + (oH); HETEROGENEOUS
INITIATION
Rm(sec) + HY; ROe, OHm, Rn (pri]4,1 0,1 3,1 5 RADICAL INITIATION
Ro(sec)
6-Scission
lI-OLEFIN + Rn=(pri)
(GROUP Z-NP)
15_RH19 IDa=
D-OLEFINm
20_ 02
D-OLEFIN 02==
21_ RH
14_ 18
8 _ (eec)
R-R(GROUP V)
"-_ D-R*
n-ALKANE + Re(sec)(GROUP ] -NP )
PRODUCTS *
(* PRODUCTS WERE NOT DETECTED)
FIG. 5.7 Dodecyl (R*) and DMT Radtca] (D*) Reactions In the
[ntermedtate Temperature Restme (300 < T < 400C)

Heterogenous Initlatlon
RH --SURFACE--> R*
DH --SURFACE--> D*
Propagation
R* + 02 --> R02*
Termination
R02* + D* -->
139
+ (*H) (i)
+ (*H) (16)
(21
ROOD ^ (171
(^ Products were not detected)
At low temperatures, surface catalyzed radical initiation is
possible for DMT molecules, since the S-H bond energy (in
DMT) is lower than the C-H bond energy (RH - primary and
secondary) in n-dodecane. This implies that the DMT radical
(D*) formation competes with dodecyl radical (R*) formation,
even though DMT concentrations are much lower than RH
concentrations, Reaction 18. The D* radicals do not react
with oxygen to form the corresponding peroxy radical, DO2 _
(Taylor and Frankenfeld, 198S), but react with the
alkylperoxy radical (R02_) forming the inert product, ROOD,
Reaction 17 (Denisov, 1973). The ROOD product formation
decreases the available supply of RO_* radicals,
consequently decreasing Group II and IV concentrations in
the autoxidatlon temperature regime with increasing DMT
concentrations, Figs. 5.4a and 5.4c. The Group I I I data,
however, is not consistent with this decreasing trend with
increasing DMT addition, Fig. 5.4b. This effect is yet to be
understood.
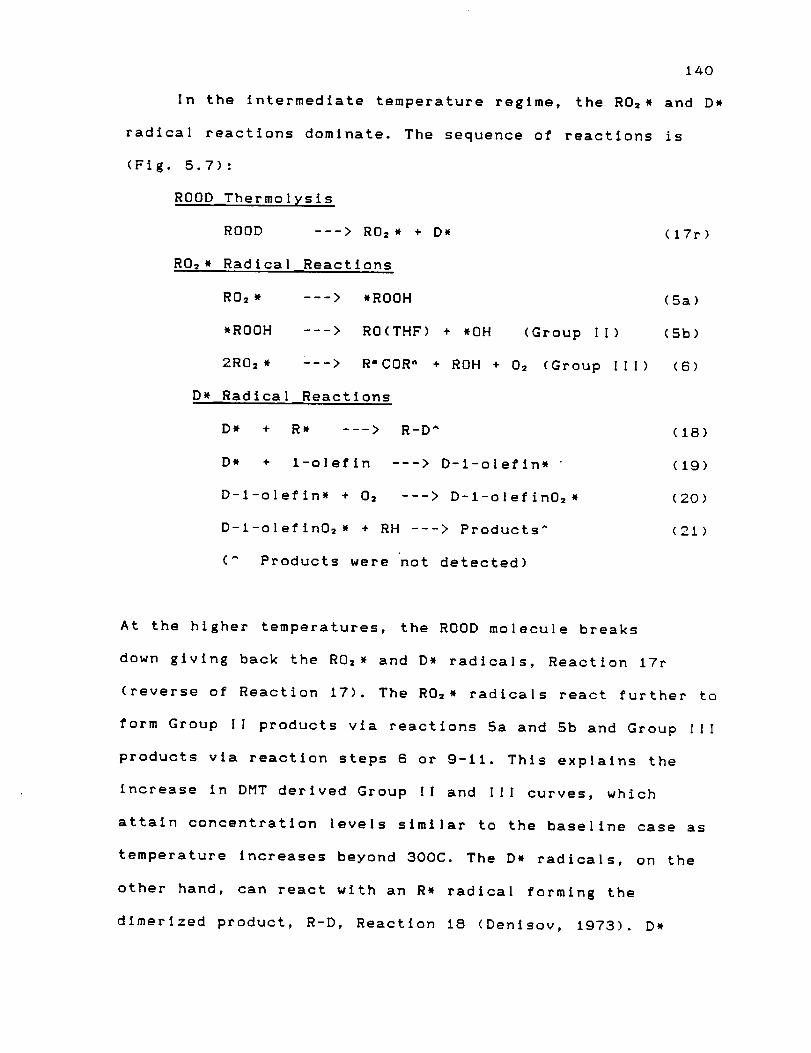
140
In the intermediate temperature regime, the R02* and D*
radical reactions dominate. The sequence of reactions is
(Fig. 5.7):
ROOD Thermolysis
ROOD ---> R02* + D*
R02* Radical Reactions
R02* --->
*ROOH --->
2R02. --->
D* Radical Reactions
D* + R* --->
D* + l-olefin
D-l-olefln* + 02
(17r)
*ROOH (5a)
RO(THF) + *OH (Group I[) (5b)
R'COR" + ROH + 02 (Group lIl) (6)
R-D ^
---> D-l-olefin*
---> D-l-olefin02*
D-l-olefln02* + RH ---> Products ^
(^ Products were not detected)
(18)
(19)
(20)
(21)
At the higher temperatures, the ROOD molecule breaks
down giving back the R02* and D* radicals, Reaction 17r
(reverse of Reaction 17). The R02* radicals react further to
form Group II products via reactions 5a and 5b and Group I l !
products via reaction steps 6 or 9-11. This explains the
increase in DMT derived Group I l and I [ I curves, which
attain concentration levels similar to the baseline case as
temperature increases beyond 300C. The D. radicals, on the
other hand, can react with an R* radical forming the
dlmerized product, R-D, Reaction 18 (Denlsov, 1973). D*

141
radical dimerization reactions involving two D* radicals
(and giving D-D product) are not likely since the D*
radical concentrations are considerably lower than the R*
radical concentrations. Alternatively, the D* radicals can
react with reactive Group I l-alkenes forming D-Olefin*
radicals which subsequently oxidize to form other prQducts.
Reactions 19-21. This route is preferred, since this
sequence of reactions constitutes the well known
"sweetening" process employed commercially for decreasing
mercaptan odor (Oswald et al., 1983). Further evidence for
the presence of these reactions is an observed decrease in
l-alkene concentrations relative to the other Group I
constituents (e.g., n-alkanes), Fig. 5.5, indicating
selective reactions of l-alkenes.
Group I and V products also are selectively inhibited
with increasing DMT concentration, indicating that the
available dodecyl radical supply (responsible for Group I
and V product formation) is decreased. This results either
from a decrease in alky! radical (R*) formation as a
byproduct of decreased R02* radical concentrations (which,
in turn, produce R* radicals) or from reactions involving
dodecyl radicals (R*) and D* radicals. The dominant cause
cannot be determined at this time.
5.2.2 Dibutylsulfide (DBS)
With DBS addition, the Group If-IV product
distributions change, as seen in Fig. 5.8. In the
autoxidation temperature regime, the sulfide interferes with

ISOG" 1 -==0--- IIAIllLX_II _l II --,p. so_,v T_ J l
|v t
iI I00 _ 3O0 ldiO 4OO
,aPTlY 1'UlIi TI)aPI_TWai ¢Cl
(a) GROUP II
194v._
i 100040
l-!8
i i i I
_x--- soo_ / I \ / "--'_'" .- .
(hi GROUP !l]
I I I i I
--o-- _s_._ 1_11-==.- 100 _ Jl\-0-,-- /-\
1
142
(c) GROUP IV
FIG. 5.8 Effect of Dtbutylsulfide on Group If-IV Species inthe PI Fractions Using GC/OCI Analysis

143
the hydrocarbon oxidation chain at the hydroperoxide step
(Bateman and Hargrave, 1954), vlz.
ROOH Interference Reactions
R'SR" + ROOH ---> R,SOR "^ + ROH (22)
R'SR" + ROOH ---> R,SOR -^ + Ro-CO-R - (23)
(^ Products were not detected)
This decreases Group IV (ROOH) concentrations and,
consequently, increases Group If! alcohol and ketone
formation, Figs. 5.8b and 5.8c.
As temperature increases (T _ 300C), the dopant
derived Group II! product curves show curve maxima occurring
at a critical temperature (Tc), wlth the locus of the curve
maxima (Tc) shifting to lower temperatures as dopant
concentrations are increased, Fig. S.8b. For example, at
I000 ppm DBS, Tc occurs at 300C and shifts to about 325C for
the I00 ppm DBS curve. No Tc is observed for the Group ll!
i0 ppm DBS curve, with the Group Ill product concentrations
increasing monotonically between 300C and 400C. The shift in
Tc to lower temperatures with increasing DBS concentrations
may be explained by the reaction
DBSO^ + ROH(R°COR-) > Products ^ (24)
(T > Tc)
(^ Products were not detected)
This reaction occurs only when the temperature is greater
than Tc. Thus, Tc depends on DBSO concentration, which in
turn depends on the initial DBS concentration.
144
5.2.3 Dibenzothlophene (DBT)
Wlth DBT addition, the Group If-IV product distribu-
tions change only slightly, as seen in Fig. 5.9. The Group
II product curves are inhibited relative to the baseline
curve In the 250-350C range, indicating that DBT addition
inhibits tetrahydrofuran formation, Fig. 5.9a. At 250C, DBT
addition promotes Group IV relative to the baseline case,
but at 300C and beyond, the I00 and I000 ppm curves are
inhibited to concentrations slightly lower than the baseline
and i0 ppm curves, Flg. 5.9c. This indicates that DBT
promotes Group IV formation up to 250C, but starts acting
as an inhibitor at the I000 ppm concentrations as
temperature increases to 300C and beyond. Additionally,
Group II and IV product distributions appear to be related
somewhat at 250C. With DBT addition, the Group |V products
appear to increase wlth a corresponding decrease in Group II
products relative to the baseline data at 250C, indicating
that DBT promotes the (R02* + RH ---> ROOH + R*) reaction
(Reaction 3) while inhibiting the (R02* --> *ROOH --> RO +
OH*) reactions (Reactions 5a and 5b) at thls temperature. At
250C, the Group Ill product curves follow a I000, I00 ppm >
baseline > I0 ppm trend, implying that hlgh DBT
concentrations promote Group Ill formation, while low
concentrations tend to inhibit their formation, Fig. S.9b.
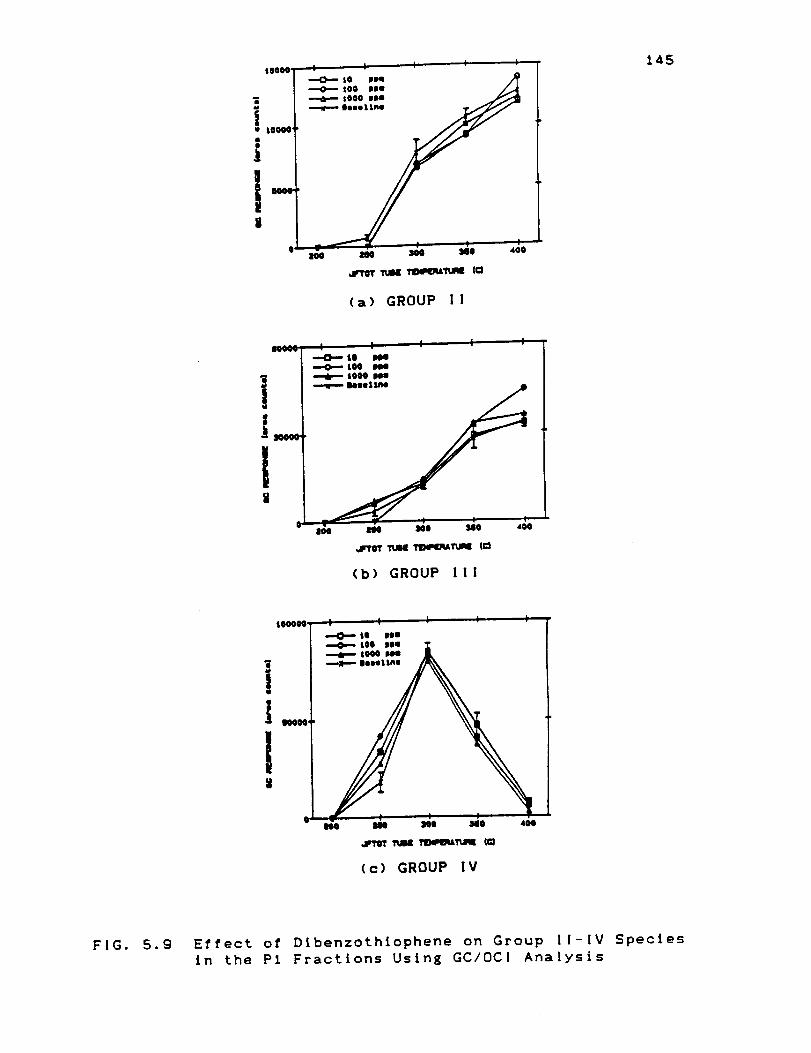
t 8006 T ! I I I !| _ $0 plDI 2/ ---o--ioo ,me //4
oL- = _ ' i ,,ioIt04) Ill JO(J 380
_ _11,lq8 ¢C3
(a) GROUP I!
145
(b) GROUP III
8000OOF I i I I I/ --,OntO No/ --0"-- tOO DOm Z/ _ tooo ne Jk
IO00(J --I,-,,-Oeee_lnei--_o n6o m _o "
,rTelr TuII I'INMn_A_
(c) GROUP IV
FIG. 5.9 Effect of Dtbenzothtophene on Group II-lV Speciesin the P1 Fractions Using GC/OCI Analysis

5.3 CONCLUSIONS
Dopant addition showed that the major soluble products
were always the same, with and without dopants, but that
their distributions varied considerably. No dopant derived
products were detected, however, due to low product
concentrations and analytical difficulties. 3,_-dimercapto-
toluene and dlbutylsulflde dopants individually added to
n-dodecane interfere with the hydrocarbon oxidation
chain at the alkylperoxy radical and the alkylhydroperoxlde
llnk, respectively, and alter the n-dodecane derived product
distributions (Group I-V). 2,5-dlmethylpyrro|e dopant, on
the other hand, introduces cooxldation reactions Involvlng
dopant and oxygen and, consequently, inhibits ROOH
formation. Pyrldlne, pyrroIe and dlbenzothiophene
individually added to n-dodecane showed few significant
mechanistic effects.

147
CHAPTER 6
DISCUSSION, CONCLUSIONS AND RECOMMENDATXONS FOR FUTURE WORK
A comparison between previous in-use fuel deposit
and gum formation studies and the fuel degradation
mechanism postulated from this study is discussed in
Section 6.1. The summary and concluslons are presented in
Section 6.2, while recommendations for future work are
presented in Section 6.3.
6. I FUEL DEGRADATION MECHANISM: CORRELATION WITH
ACTUAL DEPOSIT AND GUM FORMATION STUDIES
The standard JFTOT was modified to collect various
control and stressed fuel samples exposed to temperatures
over the range from ambient to 400C with a single filling
of the JFTOT reservoir. With this mod'iflcation, surface
deposition on the heater tubes (tube deposit rating, TDR)
and gum formation (measured as AP across test filter) could
not be quantified. However, because of the low stress
conditions utilized in this study, the model fuel and dopant
combination experiments did not show any surface deposition.
Previous studies of fuel thermal stability were
performed at the Naval Research Laboratory (Hazlett, 1979).
Their data consists of TDR, [ROOH], [CO], and [n-alkanes]
versus JFTOT tube temperature for a model fuel (n-dodecane)
and an actua! fuel (RAF-IT7). The NRL conclusions were:
(i) in n-dodecane systems, deposits correlated with ROOH
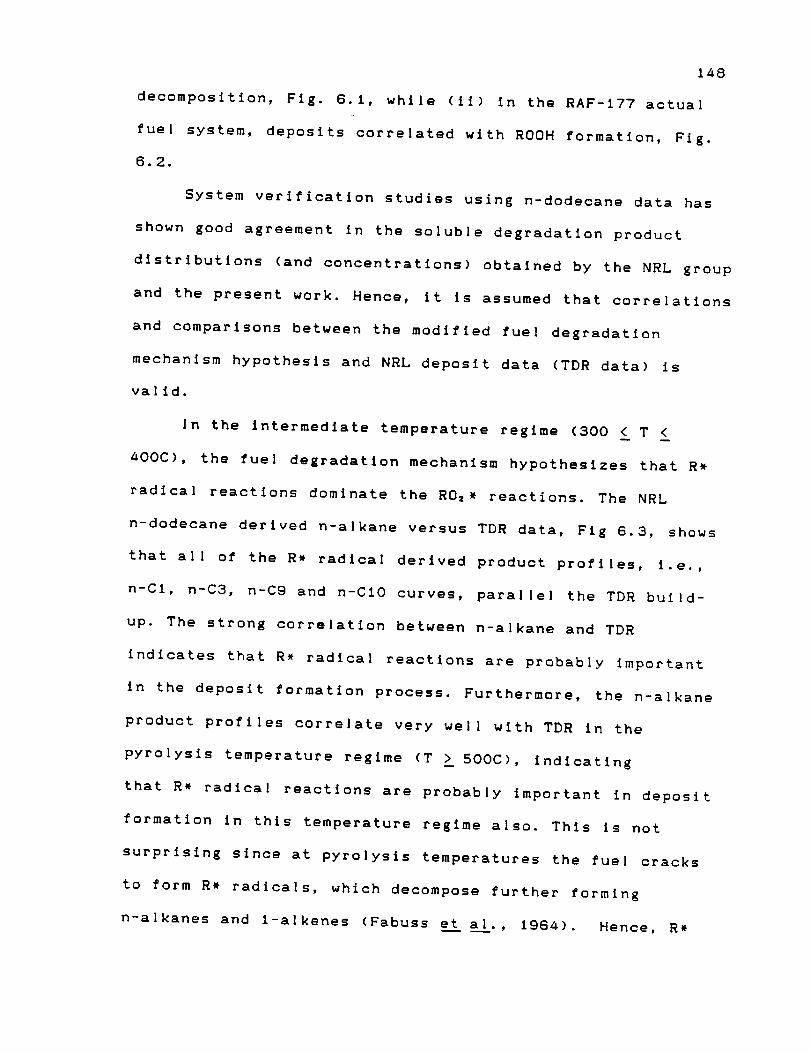
148
decomposition, Fig. 6.1, while (li) in the RAF-177 actual
fuel system, deposits corre|ated with ROOH formation, Fig.
6.2.
System verification studies using n-dodecane data has
shown good agreement in the soluble degradation product
distributions (and concentrations) obtained by the NRL group
and the present work. Hence, it is assumed that correlations
and comparisons between the modified fuel degradation
mechanism hypothesis and NRL deposit data (TDR data) is
valid.
In the intermediate temperature regime (300 < T <
400C), the fuel degradation mechanism hypothesizes that R*
radical reactions dominate the R02* reactions. The NRL
n-dodecane derived n-alkane versus TDR data, Fig 6.3, shows
that all of the R* radica| derived product profiles, i.e.,
n-el, n-C3, n-C9 and n-ClO curves, parallel the TDR build-
up. The strong correlation between n-alkane and TDR
indicates that R* radical reactions are probably important
in the deposit formation process. Furthermore, the n-alkane
product profiles correlate very well with TDR in the
pyrolysis temperature regime (T _ 500C), indicating
that R* radical reactions are probably important in deposit
formation in this temperature regime also. This is not
surprising since at pyrolysis temperatures the fuel cracks
to form R* radicals, which decompose further forming
n-alkanes and l-alkenes (Fabuss et al., 1964). Hence, R*
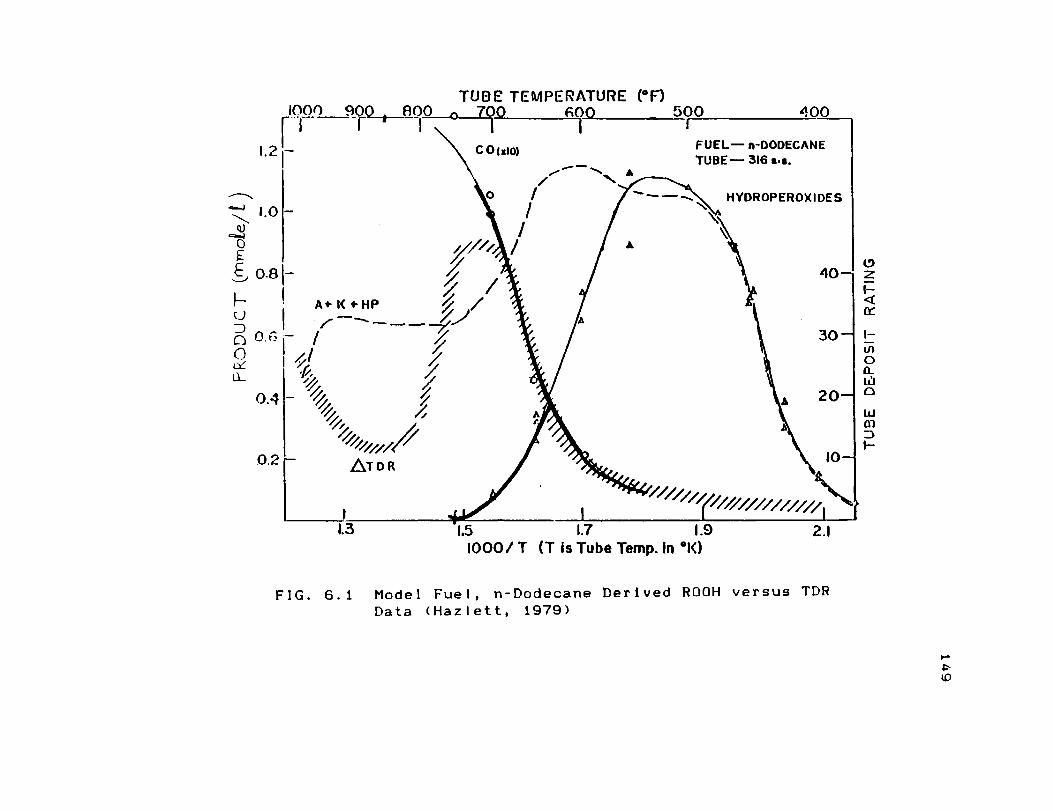
tz_9
ooooI
//-,
\\
9NI/V
_I..IS0d-3(3
":l_rlJ..
0
\\
(M
0ag.
(:-
0C)
do
@1
3>0O"oe:)@E0O3
@1"-
"OO'}
O!*
Nv
LI.,

_t50
9NIJ.V
_llSO_3_
3801
CJ

151
0
EE
I-_.)
Q0G:Q.
0,I
_' I ' I' 'I
0 500 450 400 350
\
- O
- ®--"'o\\ C 0 (xlO)
\
Cs \_\
0\ ,-- \
J
m
m
m
0.01I.,_
\
<>Co ;K0 \
\
A TDR C \e8
0I-
Z
4Q:
I-
0
W0
W
I,-
FIG. 6.3 Model Fuel, n-Dodecane Derlved n-Alkane Product
versus TDR Data (Hazlett, Ig7g)

152
radicals are probably responsible for deposit formation in
the pyrolysis range of temperatures.
In the zone of minimum reactivity situated between the
intermediate and pyrolysis range of temperatures (400 < T <
500C), the TDR curve dips down, while all of the n-alkane
curves show a slight increase (or stay the same). This
indicates a poor correlation between TDR and n-alkane
concentration. A posslb[e explanatlon for this behavior is
that ROOH is depleted to near zero concentrations, Fig. G.l.
This causes a sharp decrease in the available R* radical
pool, since RH pyrolysis becomes the sole source of R*
radicals.
The relative R* radical contributions via ROOH decom-
position (R%) and RH pyrolysis (P%) reactions in the inter-
mediate range of temperatures can be inferred from the Group
I-NP (n-alkane and l-alkene) profiles using the air
saturated and nitrogen purged n-dodecane data, Fig.8.4. The
air saturated Group I-NP data is a summation of the (R+P)
data, while the nitrogen purged data includes contributions
from P alone. It is observed that both R and P (absolute)
increase from 300C to _OOC. If the same data is replotted
with R% and P% on the y-axis and temperature depicted on the
x-axls, it Is noted that R% decreases from 100% to 65% while
P% increases from 0% to 35% between 300 and aOOC, Fig. 6.5.
In the zone of minimum reactivity, it is known that ROOH
concentrations are near zero, Fig. 6.1, Implylng that R% Is
also close to 0%. This implies that P% should attain 100%
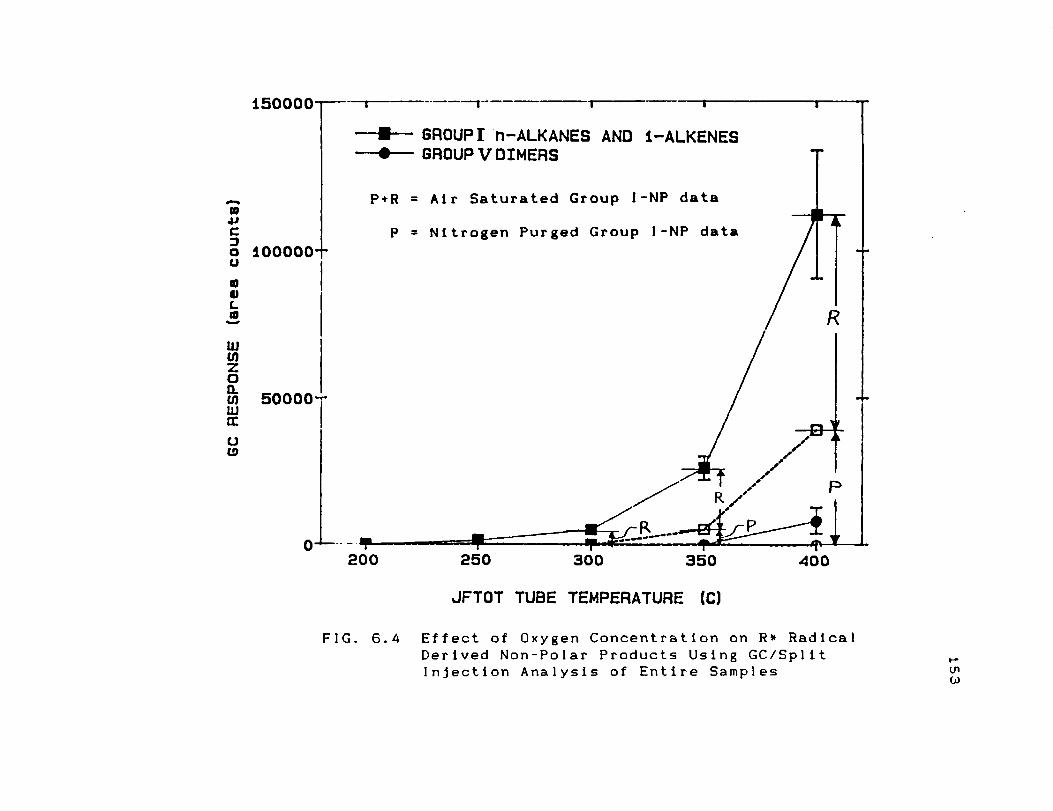
153
II
It
00
o0
00
00
00
00
qrl_rl
(s_unooeaJe)
_SNOdS
3_09
10
L)wWrrCL
LUi-ILlmI--F-ob.-3
U-rj,.,.4
_.._
_,._0
tm•._
@
_11,1
,,,-_
O0
'_-,C:
_.,0
0,'10
,,-Z
1=0
0"0
".-,
0>
O
b.
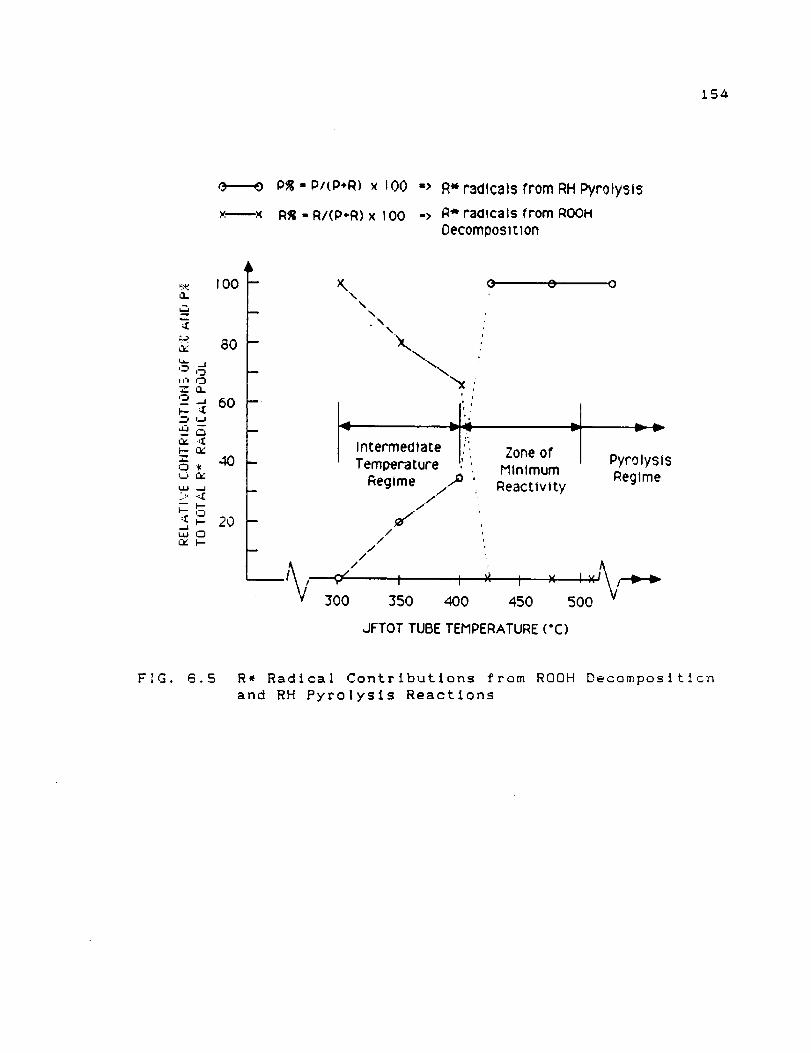
Pi_ - P/(P+Q) x 100
R_ - R/(P+R) x I00
"_ R* r3dlcals from RH Pyrolysis
.> _* radicals from ROOHDecomposition
_. IO0n
L--J
_: 80
Z t_
'-_ 60--f _,,,j
_2_5
•- 40:i_ tc
.:- °:,[
¢_- 20uu 0
m
m
I
X_.
\\
\
m
m
m
__1\/_"-- 300
",x
, _1":,otermeo,ateTe oer,t°re,Regime /,,_a
/.f
//
//
0 0 0
"3 w
Zone of / PyrolysisMinimum
RegimeReactivity
I i _ i x
350 400 450 500
JFTOT TUBE TEMPERATURE ('C)
FIG. 6.5 R* Radical Contributions from ROOH Decompositionand RH Pyrolysis Reactions
155
Just when ROOH's are completely depleted. Additionally, from
available fuel pyrolysis mechanisms, it is known that P% is
100% and R% is zero at temperatures greater than 500C.
Therefore, with the additional information regarding the
pyrolysls and the minimum reactivity range of temperatures,
Fig. 8.5 can be extended to include all temperatures greater
than 300C.
In the zone of minimum reactivity, it is noted that R%
decreases sharply from G5% at _OOC to 0% when ROOH
concentrations reach zero. On the other hand, P% increases
from 35% to 100% when the R% contribution goes to zero. The
dip in the TDR data observed in Fig. 8.2 is probably due to
the sharp decrease in the available R* radical pool caused
by the elimination of the major R* supplier (R% --> O) and
the absolute P contribution being of a small order relative
to the absolute R contribution. Thus, R* radical
concentrations appear to correlate with surface deposition
(TDR data) in the intermediate, minimum reactivity and
pyrolysis range of temperatures (T _ 300C). Additionally, R_
radical derived products such as n-alkanes (Group I-NP) are
better correlated with TDR profl]es than ROOH decomposition
as cited in the NRL work. Therefore, n-alkanes appear to be
better correlators of surface deposition than ROOH's, with
the added advantage of easier detection and quantification.
The postulated fuel degradation mechanism developed from the
n-dodecane work at T > 300C appears to work reasonably wel]
for the RAF-177 actual fuel data, since n-alkanes again
156
correlate with TDR between 620 - 720F (327 - 382C). However,
beyond 720F (382C), the TDR does not correlate with the n-
alkane profiles, possibly due to the presence of several
other hydrocarbons, heteroatomic species, metals, natural
and artificial Inhlbitors, etc. These species may react with
the n-alkanes or possibly inhibit fuel pyrolysis reactions,
thereby skewing the TDR versus n-alkane correlation.
At temperatures less than 300C where autoxidatlon
predominates, the modified fuel degradation mechanism
hypothesizes that R02* radical reactions are more
important than R_ reactions. To verify if R02_ radical
reactions are important in fuel deposition processes (at
T ! 300C), the NRL data for [ROOH] plotted with
respect to TDR for n-dodecane and RAF-177, Figs. 6.1 and
6.2, were examined. Figs. 6.1 and 8.2 show that the model
fuel ROOH data does not correlate wlth TDR, but the actual
fuel ROOH formation curve parallels the TDR curve,
suggesting that the RO,_ radicals probably contribute to
deposits at autoxldation controlled temperatures. The
anomalous TDR versus ROOH behavior in the case of the model
fuel is attributed to the absence of other fuel constituents
(major and minor species) which are probably important and
significant in the overall deposit formation process.
In addition to JFTOT apparatuses, static reactors were
used by Mayo and Lan (1986) to study the gum and deposit
formation using model and actual fuels. They measured the
rates of oxygen absorption (Ro) and soluble gum formation

157
(Rg) at 130C for both model and actual fuels, and found that
the actual fuels generated more gum for the oxygen absorbed
than pure hydrocarbon fuels (high Rg/Ro values). It was
concluded that the low Rg/Ro values observed for model fuels
is due to the absence of minor constituents in these fuels
which are important in the gum and deposit formation
processes. Since soluble gums are precursors of insoluble
gums and deposits, the relatively lower amounts of gums
observed in the case of model fuels (Mayo and Lan, 1986)
agrees with the low TDR observed for n-dodecane at
autoxldatlon temperatures (Hazlett, 1979). This implies that
the fuel degradation hypothesis developed using a flow
reactor (modified JFTOT) is applicable to static reactor
systems. Admittedly, Mayo and Lan's experiments were
performed at 130C while the temperatures cited in the JFTOT
studies are much higher. However, the actual bulk fuel
temperatures in the JFTOT may be 50-I00C lower as discussed
in Chapter 3.
In summary, the R02* radical reactions appear to
be important in the deposit formation processes at the
autoxldatlon range of temperatures ( T ! 300C), while
the RN radicals appear to be responsible in the intermediate,
minimum reactivity and pyrolysis range of temperatures (T
300C). Therefore, if the R02* and R* radicals can be
suitably scavenged in the appropriate temperature regimes
using anti-oxldants, inhlbltors, radical scavengers, etc.,
the fuel degradation process probably can be inhibited/
158
modified or arrested. If the the fuel degradation problem
cannot be solved due to pre-existing deposits, the fuel can
be analyzed for the R02* derived product (ROOH) and/or the
R* derived product n-alkane) to get a rough estimate of the
surface deposition (TDR).
6.2 SUMMARY AND CONCLUSIONS
The thermal stability characteristics of hydrocarbon
fuels have been studied. The fuels, n-dodecane and
n-dodecane plus dopants, were aerated by bubbling air
through the fuels and stressed on a modified JFTOT facility
between 200-400C. The resulting samples were fractionated to
concentrate the soluble products and then analyzed using gas
chromatography and mass spectrometry techniques to quantify
and identify the stable reaction intermediate and product
species.
The modified JFTOT operation and analytical protocols
employed in the present work are reproducible and capable of
monitoring the changes in soluble product distributions with
temperature and fuel compositional changes. Data analysis
using product Groups and character impact peaks from each of
these Groups produced more accurate, reproducible and
simpllfled analysis without losing any fundamental
information.
System verification results using neat n-dodecane
oxidation showed that the <C12 n-alkane and i-alkenes,
a[kylhydroperoxides and C12 alcohol plus ketone data trends

159
agree with the NRL data, thereby verifying both sets of
data. However, additional products, i.e., tetrahydrofurans
and C24 a|kane isomers (fuel dimers), were detected in this
work as a result of better analytical sensitivity.
Consequently the existing n-dodecane degradation mechanisms
were suitably modified to include these new products.
The experimental results for n-dodecane show a clear
transition in the oxidation chemistry from autoxidatlon
temperature (T ! 300C) to intermediate temperature (300 ! T
< 400C) regimes. The main features of the oxidation
mechanisms were discussed. The autoxldatlon temperature
regime is dominated by alkylperoxyl radical reactions. The
dominant path is for the alkylperoxyl radical, R02*, to
react blmolecularly with fuel to yield primarily alkylhydro-
peroxides. The R02_ also undergoes self termination and
unimolecular isomerization and decomposition reactions to
yie|d smal |er amounts of C12 alcohol p|us ketone products
and tetrahydrofuran derivatives, respectively. Thus, a|cohol
and ketone formation in this temperature regime implies that
the main termination step is via RO=_ self termination
reactions. This observation refutes an earlier hypothesis
that R* radical termination reactions (giving C2_ alkane
isomers) are important at low temperatures.
|n the intermediate temperature regime (300 ! T !
aOOC), the R* radica| reactions dominate the R02 * reactions.
The major supply of R* radicals is via ROOH decomposition
reactions whi|e heterogeneous metal i_Itlation constitutes
ISO
the secondary source. The R* radicals, in turn, decompose
to form smaller n-alkanes and 1-alkenes (<C12), and small
amounts of C24 isomers.
Dopant addition to n-dodecane showed that the major
soluble products were always the same, with and without the
dopants, but that their distributions varied considerably.
The relative amounts and shifts in the distribution of these
species with dopant addition led to inferences about the
reaction mechanisms. No dopant derived products were
detected, however, due to low product concentrations.
3,4-dlmercaptotoluene and dlbutylsulflde interfere with the
hydrocarbon oxidation chain at the alkylperoxy radical and
the alkylhydroperoxlde llnk, respectlve]y, and alter the
n-dodecane derived product distributions (Groups l-V).
2,5-dlmethylpyrrole dopant, on the other hand, introduces
co-o×idatlon reacti'ons involving dopant and oxygen, and
consequently inhibits ROOH formation. Pyrldlne, pyrro]e and
dlbenzothlophene individually added to n-dodecane showed no
significant mechanistic effects.
In relating the findings of this work to the fuel
degradation problem, the R02* radical reactions appear to be
important in the deposit formation processes at the
autoxldation range of temperatures ( T ! 300C), while the
R* radicals appear to be responsible in the intermediate,
minimum reactivity and pyrolysis range of temperatures (T >
300C). Therefore, if the RO=, and R* radicals can be
suitably scavenged in the appropriate temperature regimes

161
using anti-oxidants, inhibitors, radical scavengers, etc.,
the fuel degradation process can probably be arrested. If
the fuel degradation problem cannot be solved due to
pre-existing deposits, the fuel can be analyzed for the RO_ _
derived product (ROOH) and/or the R* derived product
(n-alkane) to get a rough estimate of the surface deposition
(TDR). If the ROOH's and/or the n-alkanes are found in high
concentrations, the rue| should be downgraded and mixed with
a lower (and heavier) distillation cut.
It is concluded that this research has led to a better
understanding of the reaction mechanisms associated with
fuel degradation. The mechanisms derived appear to explain
the work of other investigators. It has also formed the
basis for future research to address other aspects of the
fuel degradation problem.
6.3 RECOMMENDATIONS FOR FUTURE WORK
The current llne of research should be pursued, since a
start has been made in understanding the decomposition of
mode| fuels singly and in combination with deleterious
sulfur and nitrogen heteroatomic compounds, which are known
precursors of fuel deposits. Based on the identification of
stable and intermediate reaction species, fuel degradation
mechanism information has been obtained. Additional testing
can lead to a more comprehensive fuel degradation mechanism.
Two or more dopants added to the model fuel simultaneously
will be of interest, since the possible synergistic/

t62
antagonistic effects and resulting changes in reaction
mechanism(s) relative to the single dopant cases
can be studied. Attention can be turned, next, to the
testing of binary and ternary model fuel mixture
combinations doped with deleterious sulfur, nitrogen, and
oxygen heteroatom species. In this way, the testing of fuel
and dopant combinations will yield a more 8eneral fuel
degradatlon mechanlsm(s) than is Currently available. The
flow of information starting with basic research followed by
bench scale studies can move on to simulative studies,
eventually leading to the use of thermally stable fuels in
actual aircraft and diesel ensines.
In view of the research work conducted in this thesis,
some specific recommendations for improving the experiments,
enhancin E the data to be collected, and some interestin E
experiments are as follows:
i. Currently the amount of deEradation products beln 8
formed is very small, making sample handllng,
chromatographic analysis, and data interpretation difficult.
Higher oxyEen pressures and addition of radical initiators
such as tertiarybutylhydroperoxldes to the model fuels
should be tried out to alleviate this problem.
2. With dopant addition, co-oxldatlon and radlca]
forming/scavenging reactions become important, makln E
identification of dopant derived products (ppb to ppm
concentration range) necessary to follow chanEes occurrlng
in the fuel degradation mechanism. Therefore, it would

163
be desirable to use improved sample enrichment techniques
such as Kuderna-Danish techniques, Sep-pak materials
(i.e., amine-, hydroxy- bonded Sep-paks, etc.) and other
non-polar and polar solvent combinations to handle the
low product concentrations in a variety of sample matrices.
3. A byproduct resulting from the current research is
the study of thermally stressed samples under storage. The
sample product concentrations can be followed by employing
GC techniques to observe differences (if any) in the product
profiles and distributions relative to the time of original
storage. The above analysis can yield information about the
long term effects of intermediates formed during thermal
stressing.
4. More recent chemical techniques that exploit the
high solvating power and mass transport properties of
supercritlcal fluids should be investigated for chemical ly
characterizing the deposits and sediments resulting from
fuel degradation.
The ultimate goal of this work is to relate the fuel
degradation mechanisms with the insoluble product formation.
This will identify the precursors (soluble oxidation
products) responsible for insoluble product formation.

LIST OF REFERENCES

164
LIST OF REFERENCES
Bateman, L., and Hargrave, K. R. (1954), "Oxidation ofOrganic Sulfides If. Interaction of Cyclohexylsulfide with
" Proc Roy. Soc (London)Hydroperoxides in Hydrocarbons, • _ • ,
Ser. A. 224, p. 399.
Benson, S. W. (1965), "Effects of Resonance and Structureon the Thermochemlstry of Organic Peroxy Radicals and the
Kinetics of Combustion Reactions," J. Am. Chem. Soc. 8-/,
p. 972.
Benson, S. W., and Shaw, R. (1972), "Thermochemistry of
Organic Peroxides, Hydroperoxldes, Polyoxides, and TheirRadicals," Or_anlc Peroxides, Vo]. I, Chapter 2, (editor
Swern, D.), Wiley-lnterscience, New York, p. 105.
Benson, S. W. (1972), "The Mechanisms of Pyrolysis,
Oxidation, and Burning of Organic Materials," Nat' I. Bur.
Stand. (U.S.), Spec. Publ., No. 357, p. 121.
Benson, S. W. (1981), "Some Researches into Problems of
Molecular Structure and Chemical Reactivity," J._Phy. Chem.
8,5, p. 3375.
Berces, T., and Trotman-Dickenson, A. F. (1961), "The
Reactions of Hydroxyl Radicals with Hydrocarbons in Aqueous
Solutions," J. Chem. Soc., p. 4281.
Bolland, J. L., and ten Haave, P. (1947), "Liquid Phase
Oxidation of Hydrocarbons," Trans. Faraday Soc. &3, p. 201.
Boss, B. D., and Hazlett, R. N. (1969), "Oxidations of
Hydrocarbons in the Liquid Phase: n-Dodecane in aBorosilicate Glass Chamber at 200C," Can. J. Chem. 47,
p. 4175.
Boss, B. D., Hazlett, R. N., and Shepard, R. L. (1973),
"Analysis of n-Paraffln Oxidation Products in the
Presence of Hydroperoxides," Anal. Chem. 45, p. 2388.
Bridgewater, A. J., and Sexton, M. D. (1978), "Mechanism ofAntioxidant Action: Reactions of Alky| and Ary] Sulphldes
with Hydroperoxldes," I. Chem. Soc.,_Perkins Trans. 2,
p. 530.
Brinkman, D. W., Whisman, M. L., and Bowden, J. N. (1979),
"Stability Characteristics of Hydrocarbon Fuels from
Alternative Sources," Bartlesvil le Energy Technology Center,
Report No. BETC/RI-78/23.

165
Brinkman, D. W., Bowden, J. N., and Giles, H. N. (1980),"Lube Oil and Finished Fuel Storage Stability: AnAnnotated Review," DOE/BETC/RI-79-13.
Brown, D. M., and Fish, A. (1969), "The Extension to Long-
Chain Alkanes and to High Temperatures of the HydroperoxideChain Mechanism of Autoxidation," Proc. Roy. Soc. (London)Set. A. 308, p. 547.
Cooney, J. V., Hazlett, R. N., and Bea], E. N. (1986),
"Mechanisms of Syncrude/Synfuel Degradation," Naval Research
Laboratory, Report No. DOE/BC/I0525-15, Third Annual Report.
Coordinating Research Council (1979), "Literature Survey on
the Thermal Oxidative Stability of Jet Fuel," CRC Report No.509.
Cullls, C. F., Hirschler, M. M., and Rogers. R. L. (1981),
"The Oxidation of Decane in the Liquid and Gaseous Phases."
Proc. Roy. Soc. (London), Set. A. 375, p. 543.
Daniel, S. R. (1983), "Studies of the Mechanisms of SynfuelDegradation," NASA Report. NSG 3122.
Denlsov, E. T. (1973), "Elementary Reactions of Oxidation
Inhibltors," Russian Chemical Reviews 42, (3), p. 157.
Emanuel, N. M., Denison, E. T., and Malzus, Z. K. (1967),
Liquld-Phase Oxidations of_Hydrocarbons, EnglishTranslation, Plenum Press, New York.
Emanuel, N. M. (1981), "Chemical and Biological Kinetics,"Russian Chemical Reviews 50, I0, p. 901.
Emanuel, N. M. (1982), "80's in the Field of Liquid PhaseOxidation of Organic Compounds," Oxidation Communications2, No. 3-4, p. 221.
Fabuss, B. M., Smith, J. 0., and Satterfield, C. N. (1964),
"Thermal Cracking of Pure Saturated Hydrocarbons," Adv. Pet.Chem. Refln. 2, P. 157.
Faith, L. E., Ackerman, G. H., and Henderson, H. T. (1971),"Heat Sink Capability of Jet A Fuel: Heat Transfer andCoking Studies," NASA-CR-72951.
Fish, A. (1964), "Radical Rearrangement in Gas-Phase
Oxidation and Related Processes," Quart. Rev., Chem. Soc.London 18, p. 2&3.
Fish, A. (1968), "The Cool Flames of Hydrocarbons," Adv.Chem. Set. 9__88, p. 69.

166
Fish, A. (1970), "Rearrangement and Cyclizatlon Reactions ofOrganic Peroxy Radicals," Organic Peroxides, Vol. I, Chapter
3, (Editor Swern, D.), Wiley-lntersclence, New York, p. 141.
Frankenfeld, J. W., Taylor, W. F., and Brinkman, D. W.
(1981), "Fundamental Synthetic Fuel Stability Study," Exxon
Research and Engineering Co. Report No. DOE/BC/IO045-12.
Frankenfeld, J. g., Taylor, W. F., and Brlnkman, D. g.
(1982), "Fundamental Synthetic Fuel Stability Study," Exxon
Research and Engineering Co. Report No. DOE/BC/IO045-23.
Giammaria, J. J., and Norris, H. D. (1962), "High-
Temperature Inhibition of Normal Paraffin Oxidation by" Ind. Eng. Chem , Prod Res. Dev. i, p. 16.Alkylaromatlcs, _ • • _
Goetzinger, J. W., Thompson, C. J., and Brinkman, D. W.(1983), "A Review of Storage Stability Characteristics of
Hydrocarbon Fuels, 1952-1982," DOE/BETC/IC-83-3.
Hazlett, R. N., Hail, J. M., and Matson, M. (1977),
"Reactions of Aerated n-Dodecane Liquid Flowing Over Heated
Metal Tubes," Ind. Eng._Chem., Prod. Res. Dev. 16, 2,
p. 171.
Hazlett, R. N. .(1979), "Some Chemical Aspects of Deposit
Formation," NASA Technical Memorandum 79231.
Hazlett, R. N., and Hall, J. N. (1981), "Jet Aircraft Fuel
System Deposits," Div. Pet. Chem., Preprints, ACS Meeting,
Vol. 26, Atlanta, Georgia.
Hendry, D. G., Mill, T., Piskiewicz, L., Howard, J. A., and
Eigenmann, H. K. (1974), "A Critical Review of H-atomTransfer in the Liquid Phase: Chlorine Atom, AIkyl,
Trichloromethyl, Alkoxy and Alkylperoxy Radicals," J._Phy.
Chem. Ref. Data 2, P. 937.
Hiatt, R. (1972), "Alkyl Peroxides," Organic Peroxides, Vol.
3, Chapter I, (Editor Swern, D.), Wiley-lnterscience, New
York, p. I.
• . "Inhibition of the Autoxidation ofIngold, K U (1961),
Organic Substances in the Liquid Phase," Chem. Rev. 61,
p. 563.
Jensen, R. K., Korcek, S., Mahoney, L. R., and Zinbo, M.
(1979), "Liquld-Phase Autoxldatlon of Organic Compounds at
Elevated Temperatures. i. The Stirred Flow Reactor Technique
and Analysis of Primary Products from n-Hexadecane at 120-
180C," J. Am. Chem. Soc. I01, p. 7574.

167
Kharach, M. S., Nudenberg, W., and Mantell, G. J.(1951),
"Reactions of Atoms and Free Radicals in Solution. XXV. The
Reactions of Oleflns with Mercaptans in the Presence of
Oxygen," J. Org. Chem. 16, p. 524.
Knlght, H. B., and Swern, D. (1954), "Tetralln
Hydroperoxide," Orz. Syntheses 34, p. 90.
KoelewlJn, P., and Berger, H. (1972), "Mechanism of the
Antloxidant Action of Dialkyl Sulfoxides,"
Rec. Tray. Chlm. 91, p. 1275.
KoelewlJn, P., and Berger, H. (1974), "Mechanism of the
Antioxidant Action of Dialkyl Sulfoxides,"
Rec. Tray. Chlm. 93, p. 83.
Kosslakoff, A., and Rice, F. O. (1943), "Thermal
Decomposition of Hydrocarbons, Resonance Stabilization and
Isomerlzatlon of Free Radicals, " J. Amer. Chem. Soc. 65,p. 590.
Li, J., and Li, C. N. (1985), "Storage Stability of JetFuels," Fuel 64, p. 1041.
Loeffler, M. C., and Li, N. C. (1985), "Role of Nitrogen-
and Sulfur- Containing Compounds in the Ageing of LiquidFuels," Fuel 64, p. 1047.
Lundberg, W. O. (1962), Autoxidation and Antloxidants, JohnWiley, New York.
Maillard, B., Ingold, K. U., and Sclano, J. C. (1983), "Rate
Constants for the Reactions of Free Radicals with Oxygen inSolution," J. Amer. Chem. Soc. 105, p. 5095.
Marteney, P. J., Colket, M. B., and Vranos, A. (1982),
"Experimental Study of the Thermal Stability of HydrocarbonFuels," NASA-CR-168027.
Mayo, F. R., Miller, A. A., and Russell, G. A. (1958), "The
Oxidation of Unsaturated Compounds. IX. The Effect of
Structure on the Rates and Products of Oxldatfon of
Unsaturated Compounds," J. Amer. Chem. Soc. 80, p. 2500.
Mayo, F. R. (1968), "Free-Radical Autoxldatlons of
Hydrocarbons," Accounts of Chem. Res. [, p. 193.
Mayo, F. R., Richardson, H., and Mayorga, G. D. (1975), "TheChemistry of Jet Turbine Fuel Deposits and their
Precursors," Div. Pet. Chem., Preprlnts, ACS Meeting,Vo]. 20. Philadelphia, p. 38.
t68
Mayo, F. R., Lan, B., Cotts, D. B., Buttrill, S. E. Jr., and.
St. John, G. A. (1983), "Oxidation and Formation of Deposit
Precursors in Hydrocarbon Fuels," SRI-2115, SRI
International, NASA CR-168121.
Mayo, F. R., and Lan, B. (1986), "Gum and Deposit Formationf_om Jet Turbine and Diesel Fuels at 130C," Ind. Eng.
Chem., Prod. Res. Dev. 25, p. 333.
Mill, T., and Hendry, D. G. (1980), "Kinetics and Mechanisms
of Free Radical Oxidation of Alkanes and Oleflns in the
Liquid Phase," Comprehensive Chemlcal Kinetics, Vol. 16,
Chapter I, (Eds. Bamford, C. M., and Tipper, C. F. H. ),Elsevier Scientific Publishing Co., Amsterdam.
Mill, T., and Montorsl, G. (1973), "The Liquid Phase
Oxidation of 2,4-Dimethylpentane, " Intl. J. Chem. Kinetics
5, p. 119.
Mill, T., Mayo, F. R., Richardson, H., Irwin, K., and
Al lara, D. C. (1972), "Gas and Liquld-Phase Oxidation of
n-Butane," J. Am. Chem. Soc. 94, p. 8802.
Mushrush, G. W., Hazlett, R. N., Hardy, D. R., and Watkins,
J. M., (1986), "Liquid Phase Oxidation of Sulfur Compounds,"
Proceedings of the Second |nternatlonal Conference on Long-
Term Storage Stabilities of Liquid Fuels, San Antonio,
Texas, p. 512.
Nassan, K. (1983), The Physics and Chemistry of Color, John
Wiley and Sons, New York.
Nixon, A, C. (1962), "Autoxldatlon and Antloxldants of
Petroleum," Autoxidation and Antloxidants, Vol. 2, Chapter
17, (Editor- Lundberg, W. 0.), John Wiley, New York.
Nixon, A. C., and Thorpe, R. E. (1956), "The Effect of
Composition on the Stability and Inhibitor Response of Jet
Fuels," Amer. Chem. Soc., Div. Pet. Chem.,_Preprlnts, _,
No. 3, p. 265.
Oswald, A. A., and Noel, F. (1961), "Role of Pyrroles in
Fuel Instability," J. Chem. and Eng. Data 6, No. 2,
p. 294.
Oswald, A. A., and Ruper, C. B. (1959), "Co-oxldation of
Mercaptans and Oleflns," Am. Chem. Soc., D iv. Petrol. Chem..
Preprints, _, I, p. 27.
Oswald, A. A., Hudson, B. E. Jr., Rodgers, G., and Noel, F.
(1962), "Organic Sulfur Compound. VII. Some Addition and Co-oxidation Reactions of ThiOls with 2,5-Dimethyl-2, 4-
hexadlene," J. OrE. Chem. 27, p. 2439.

169
Oswald, A. A., Griesbaum, K., and Hudson, B. E. Jr. (1963),"Organic Sulfur Compound, Xll. Factors Determining a 1,2-
vs. 1,4-Mechanlsm of Radlcal Reactions of Conjugated
Dloleflns. Co-oxidation with Thlols by Oxygen," J. Ors.Chem. 28, p. 2355.
Peat, A. E. (1982), "Fuel Thermal Stability. Propulsion and
Energetics Panel, Working Group 13 on Alternative Jet EngineFuels," Vol. 2, R. B. Whyte, Ed., Report No. AGARD-AR-181-Vol. II.
Raflkova, V. S., Malzus, Z. K., Sklblda, I. P., and Emanuel.
N. M. (1971), "Role of the RI* + R2H Chain Transfer Reaction
in the Degenerate-Branched Chain Oxidation of Hydrocarbons,"
Dokl. Akad. Nauk,_SSSR, 198, No. 5, p. 1131.
Reich, L., and Stlvala, S. S. (1969), Autoxldatton of
Hydrocarbons and Polyolefins, Marcel Dekker Inc., New York.
Reynolds, T. W. (1977), "Thermal Stability of Some Aircraft
Turbine Fuels Derived from Oil Shale and Coal,"NASA TM-X-3551.
Russel, G. A. (1955), "The Competitive Oxidation of Cumene
and Tetralin," J. Amer. Chem. Soc. 77, p. 4583.
Rust, F. F. (1957), "Intramolecular Oxidation. The
Autoxldatlon of Some Dlmethylalkanes," J. Am. Chem. Soc.79, p. 4000.
Sauer, R. W., Weed, A. F., and Headington, C. E. (1958), "A
Mechanism of Organic Sediment Formation in Heating Oils,"
Pet. Chem. Div. Preprlnts, Vol. 3, No. 3, Chicago.
Schlrmer, R. M. (1970), "Morphology of Deposits in Aircraft
and Engine Fuel Systems," SAE paper 700258.
Scott, G. (1965), Autoxldatlon,_Atmospheric Oxidation and
Antloxldants, Elsevier, Amsterdam.
Shala, F. J. (1983), "Characterization and Analysis of
Diesel Exhaust Odor," Ph. D. Thesis, Department of
Chemistry, Drexel University, Philadelphia, PA.
Smith, J. D. (1967), "The Effect of Metals and Alloys on the
Thermal Stability of Avtur 50," Aircraft Eng., p. 19.
Taylor, W. F., (1968), "Kinetics of Deposit Formation from
Hydrocarbons. I I I. Heterogeneous and Homogeneous Metal
Effects," J. Appl. Chem. 18, p. 251.

170
Taylor, W. F., and Wallace, T. J. (1968), "Kinetics of
Deposit From Hydrocarbons: Effect of Trace Sulfur
Compounds," Ind. Enz. Chem., Prod. Res. Dev. _, p. 198.
Taylor, W. F. (1969), "Kinetics of Deposit Formation From
Hydrocarbons: Fuel Composition Studies," Ind. Eng. Chem.,
Prod. Res. Dev. 8, p. 375.
Taylor, W. F. (1974), "Deposit Formation from Deoxygenated
Hydrocarbons - [ : General Features," Ind. Eng. Chem., Prod.
Res. Dev. 13, p. 133.
Taylor, W. F. (1978a), "Deposit Formation from Deoxygenated" Ind
Hydrocarbons - lI. Effects of Trace Sulfur Compounds,
Eng. Chem., Prod. Res. Dev. 15, p. 64.
Taylor, W. F. (1976b), "Deposit Formation from Deoxygenated
Hydrocarbons - Ill. Effects of Trace Nitrogen and Oxygen
Compounds," Ind. Eng. Chem., Prod. Res. Dev. 15, p. 68.
Taylor, W. F. (1979), "Jet Fuel Thermal Stability," NASA TM-
79231.
Taylor, W. F., and Frankenfeld, J. W. (1986), "Chemistry andMechanism of Distillate Fuel Stability," Proceedings of the
Second International Conference on Long-term Storage
Stabilities of Liquid Fuels, San Antonio, Texas, p. 496.
Thompson, R. B., Bruge, L. W., and Chenicek, J. A. (1979),
Ind. Eng. Chem. 41, p. 2415.
Tobolsky, A. V., and Mesrobian, R. B. (1954), Organic
Peroxides; their Chemistry, Decomposition and Role in
Polymerisation, lnterscience, New York, N. Y.
Trimm, D. L. (1980), "The Liquid Phase Oxidation of Sulfur,
Nitrogen, and Chlorine Compounds" Comprehensive ChemicalKinetics, Vol. 16, Chapter 4, (Eds. Bamford, C. M., and
Tipper, C. F. H.), Elsevier Scientific Pub|ishing Co.,
Amsterdam.
Van Sickle, D. E., Mill, T., Mayo, F. R., Richardson, H.,
and Gould, C. W. (1973), "|ntramolecular Propagation in the
Oxidation of n-Alkanes. Autoxldatlon of n-Pentane and
n-Octane," J. Org. Chem. 38, p. 4435.
Vranos, A., and Marteney, P. J. (1980), "Experimental Study
of the Stability of Aircraft Fuels at Elevated
Temperatures," NASA CR-165165.
Walling, C. (1968). "The Role of Heteroatoms in Oxidation."
The Oxidation of Organic Compounds F ACS Advances in
ChemistrT, 75, Chapter 13, p. i66.

171
Watt, J. J., Evans, A. Jr., and Hibbard, R. R. (1968),"Fouling Characteristics of ASTM Jet A Fue! When Heated to700F in a Simulated Heat Exchanger Tube," NASA-TN-D4958.
Wong, E. L., and Bittker, D. A. (1983), "Effect of
Hydrocarbon Fuel Type on Fuel Stability," NASA-TM-82916.

APPENDICES

172
APPENDIX A
MODIFIED JFTOT OPERATING PROCEDURE
The followin E procedure has been adopted to run a
JFTOT experiment using the modified JFTOT apparatus
described in Section 3.1 and illustrated in Fig. 3.1. The
heater tube temperature controller is calibrated prior to
each experiment by melting pure tin and utilizing the
freezing point of tin (232C) as a standard. Suitable
corrections are applied to the heater tube temperature if
the indicated temperature differs from 232C. The electrical
insulation components for the heater tube and the fuel
reservoir piston lip seal are inspected for scratches and
abrasions and replaced suitably prior to cleaning. The
heater tube, prefllter, test filter and fuel reservoir
components are thoroughly rinsed employing pentane solvent,
with the heater tube assembly rinsed further with trisolvent
(equal parts of toluene, isoproponal and acetone, gQ_ grade)
to ensure removal of al] fuel derived soluble products and
deposits. 600 cc of test fuel (n-dodecane or n-dodecane plus
dopants) is poured into the assembled fuel reservoir. The
fuel is aerated with g liters of alr to provide an oxygen
saturated fuel with a fixed concentraton of dissolved oxygen
which is constant for all JFTOT fuel experiments. The
reservoir piston lip seal is placed on top of the aerated
fuel and the reservoir top is sealed, assembled and

173
connected to the fuel pressurization circuit. The whole
JFTOT system is pressurized to 500 pslg, employing nitrogen.
ensuring that the system is leak proof. The JFTOT elapsed
time indicator is reset to read zero time and the timer for
the run time is set to 2 I/2 hours. The coolant water flow
employed to cool the heater tube bars is adjusted to be
within 38 + 8 liters/min. The heater tube temperature
control let is set to ambient temperature and the heater and
fuel pump are switched on.
To start a test sequence, the sampling tap is cracked
open to provide a steady flow and ensure constant flushing
of the fuel lines up to the sample tee (maintain system
pressure at 500 psig). This modification increases the total
instrument flow from 3 ml/mln to approximately 3.75-4.0
ml/mln. Once the temperature deviation meter indicates a
zero deviation from the control|er setting, the spent fuel
flow Is diverted across the manometer (only main fuel flow
lines are shown in Fig. 3.1) and the differential pressure
is adjusted to read zero (mercury column in mm) on the
manometer sca|e. The fuel pump flow is determined with a
stop watch by measuring the time for 20 fuel drops passlng
through the reservoir top equipped with a sight window (9
1.0 seconds). The differential pressure recorder is started,
at this point, to record differentia! pressure. 15 minutes
is al |owed for system equilibration and stabilization
(making sure that the heater tube temperature and system
pressure is constant at the preset conditions) and adequate

174
flushing of the sample lines including the sample tee and
tap to ensure impurity free representative sample collection
(sample vials are flushed with fuel flowing through the tap
before actual sampling). The heater tube controller
temperature is increased to 200C, and 15 minutes allowed for
system equilibration and stabilization (which is similar to
the ambient temperature case). Representative 200C samples
are collected and the procedure is repeated for 250C, 300C,
350C, and 4OOC samples.
Finally, to shut the system down, the heater tube
temperature is decreased to ambient temperature to al low
flushing of the fuel lines including the tee and sampling
tap with room temperature fuel. This procedure flushes the
soluble thermal decomposition products from the fuel lines.
The fuel pump and heater are switched off and the nitrogen
pressurization valve is closed. The manometer bypass valve
is opened and nitrogen is bled from the system. The fuel
reservoir assembly, the heater tube assembly, and the pre
and test filter assemblies are disassembled and set aside
for cleaning and reuse.
175
APPENDIX B
OPERATION OF VACUUM DISTILLATION APPARATUS
The following procedure has been adopted to start a
distillation using the vacuum distillation apparatus
described in Section 3.3 and shown In Fig. 3.3. Initially,
fill the traps with ice and water and charge the pot no more
than half full with the material to be distilled, including
boiling chips to prevent bumping and overheating of the
glass pot. Connect the pot to the bottom of the column,
place the heater under it, and adjust the supports as
appropriate. Turn on the cooling water and turn on the heat
using the rheostat. Adjust the heat such that an acceptable
amount of vapor starts rising in the column (too low a heat
will cause insufficient vapor production and too high a heat
will cause excessive vapor production, which will prevent
the liquid from coming back into the pot and cause flooding
of the column). Turn on the vacuum by starting the vacuum
pump. If the manostat has been preset, no adjustment is
necessary; otherwise, see the separate manostat instructions
and set the mercury level to obtain an absolute pressure of
3 mm of mercury column. Once the system has come to
equilibrium, check for leaks by shutting off the vacuum at
the distillation head; fix any leaks as appropriate and
restore vacuum. Set the system for total reflux with no
condensed vapors being bled off as distilled product. Ope_n
the valve allowing vacuum to the column and product
176
receiver. Let the co|umn equilibrate for 20-30 mlnutes. Open
the receiver valve and collect product for about I0 minutes;
fo] |owing this, close the receiver valve. Continue this
process until about I0 percent of the original charge is
collected or unti| the boiling characteristics of the
product reach the desired value. The sample collected up to
this point is waste.
The desired boiling characteristics are determined by
comparison with published data for the material being
distilled. The temperature at the distillation head is read
using a thermometer and the absolute pressure is obtained
from the manometer and manostat readings [Pabs = Pbar -
Pman]. Generally, sufficient front end wastage has been
collected when the experimental boiling temperature (at the
system pressure) is within _ 0.1% of the published boiling
curve. Once the initial 10% is col |ected (or the boiling
curve _$ matched), the product receivers are changed and
distilled product is collected. Roughly 70-80 percent of the
initial charge is collected as usab|e products. The system
Is shut down by turning off the heat, vacuum and water, and
slowly repressurizlng the system.

VITA

177
VITA
Kishenkumar Tadisina Reddy was born in
He attended Osmania
University, Hyderabad, graduating with a Bachelor of
Engineering degree in Mechanical Engineering in June Ig78.
He pursued graduate studies at the Indian Institute of
Technology, Madras, India, and obtained the Master of
Technology degree in Mechanical Engineering in June 1980.
After working for a year at National Thermal Power
Corporation, New Delhi, India, he came to Drexel University
to further his education. He received a Master of Science
degree in Mechanical Engineering in June 1983 and a Doctor
of Philosophy degree in Mechanical Engineering in October
1987. During his stay at Drexel, he served as a graduate
research and teaching assistant in the Mechanical
Engineering and Mechanics Department.
Mr. Reddy has co-authored two Journal papers, two
_:onference papers, and a NASA final report in the area of
thermal stability of distillate hydrocarbon fuels while
studying at Drexel. He is an honorary member of the
fnternatlonal Association for Stabilities and Handling of
Liquid Fuel Forms. He is also a member of the American
Society of Mechanical Engineers, Society of Automotive
Engineers, Combustion Institute, and the American Institute
of Aeronautics and Astronautics.