Thermal Energy and the Human Body - OEIiZK · Thermal Energy and the Human Body - 5 B. Didactical...
34
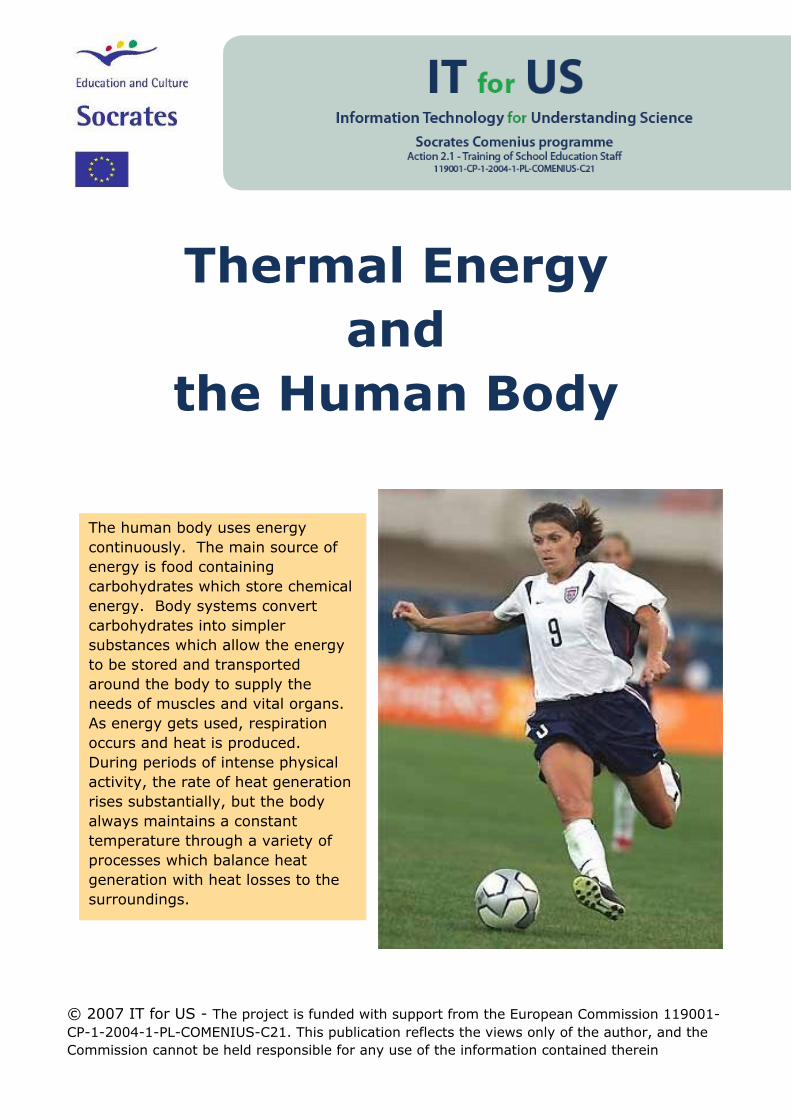
Thermal Energy and the Human Body © 2007 IT for US - The project is funded with support from the European Commission 119001- CP-1-2004-1-PL-COMENIUS-C21. This publication reflects the views only of the author, and the Commission cannot be held responsible for any use of the information contained therein The human body uses energy continuously. The main source of energy is food containing carbohydrates which store chemical energy. Body systems convert carbohydrates into simpler substances which allow the energy to be stored and transported around the body to supply the needs of muscles and vital organs. As energy gets used, respiration occurs and heat is produced. During periods of intense physical activity, the rate of heat generation rises substantially, but the body always maintains a constant temperature through a variety of processes which balance heat generation with heat losses to the surroundings.
-
Upload
dinhnguyet -
Category
Documents
-
view
213 -
download
1
Transcript of Thermal Energy and the Human Body - OEIiZK · Thermal Energy and the Human Body - 5 B. Didactical...
Thermal Energy
and
the Human Body
© 2007 IT for US - The project is funded with support from the European Commission 119001-
CP-1-2004-1-PL-COMENIUS-C21. This publication reflects the views only of the author, and the
Commission cannot be held responsible for any use of the information contained therein
The human body uses energy
continuously. The main source of
energy is food containing
carbohydrates which store chemical
energy. Body systems convert
carbohydrates into simpler
substances which allow the energy
to be stored and transported
around the body to supply the
needs of muscles and vital organs.
As energy gets used, respiration
occurs and heat is produced.
During periods of intense physical
activity, the rate of heat generation
rises substantially, but the body
always maintains a constant
temperature through a variety of
processes which balance heat
generation with heat losses to the
surroundings.
.
IT for US
Thermal Energy and the Human Body - 2
A. Introduction
1. Background theory
1. ENERGY INPUT TO THE HUMAN BODY
The main source of energy to the human body is food. Energy stored in food is
often regarded as chemical energy which resides in the chemical constituents of
food. Typically, carbohydrates are considered to be the most useful substances
containing this energy. The release of this energy requires reaction with oxygen
through the process of aerobic respiration. Expressed in its simplest form,
respiration results in the following chemical change:
carbohydrate + oxygen water + carbon dioxide
Water vapour and carbon dioxide gas are constituents of exhaled air.
Superficially, respiration is a similar chemical process to combustion in that
both are oxidation processes, the reactants and products are the same, and, in
both cases, heat is produced. Respiration is sometimes regarded as a very slow
form of combustion, but such a model breaks down when one considers the
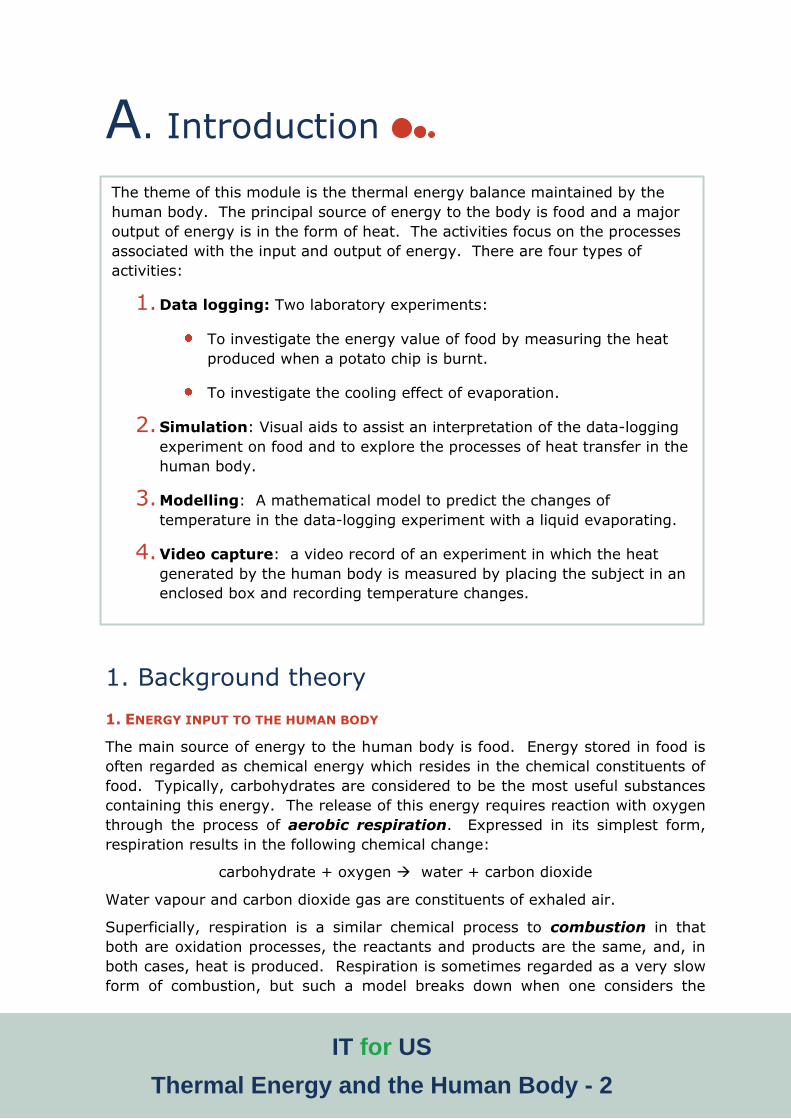
The theme of this module is the thermal energy balance maintained by the
human body. The principal source of energy to the body is food and a major
output of energy is in the form of heat. The activities focus on the processes
associated with the input and output of energy. There are four types of
activities:
1. Data logging: Two laboratory experiments:
To investigate the energy value of food by measuring the heat
produced when a potato chip is burnt.
To investigate the cooling effect of evaporation.
2. Simulation: Visual aids to assist an interpretation of the data-logging
experiment on food and to explore the processes of heat transfer in the
human body.
3. Modelling: A mathematical model to predict the changes of
temperature in the data-logging experiment with a liquid evaporating.
4. Video capture: a video record of an experiment in which the heat
generated by the human body is measured by placing the subject in an
enclosed box and recording temperature changes.
IT for US
Thermal Energy and the Human Body - 3
complex metabolic processes by which the constituents of food are broken down
into a form to facilitate respiration. However, the similarity can be usefully
exploited to determine a measure of the energy content of food. For practical
purposes, the energy content of food and the heat of combustion (or
enthalpy of combustion) can be regarded as equivalent. The latter can be
measured in the laboratory using various types of calorimeter, designed to
facilate the calculation of heat transfers from temperature changes.
In the human body, the liver is a major organ for metabolising food and,
amongst other biological functions, is responsible for generating core heat in the
body akin to a boiler in a central heating system. Muscles also generate heat
when they are active. Thus most forms of physical exercise result in body heat.
2. HEAT LOSSES FROM THE HUMAN BODY
By a complex regulation system, the internal temperature of the human body
usually remains constant at 37˚C. In comfortable climatic conditions, the
external air temperature is usually less than this. The result of this temperature
difference is that the body is constantly losing heat to the surroundings, mainly
by convection. The rate of loss of heat will depend upon the insulating
properties of the clothes being worn, but in general Newton’s Law of Cooling
applies; that is, the rate of heat loss t
H varies in proportion to the temperature
difference between the surface of the body and its surroundings:
)( sTTKt
H
- where T and Ts are the temperatures of the body and surroundings
respectively and K is a constant of proportionality.
The temperature of the skin is modified by the control of blood flow near the
surface and by the process of sweating. During conditions of cold external
temperatures, the body restricts the blood flow through veins below the skin to
conserve heat. During conditions of high external temperatures the body causes
perspiration through pores in the skin. The evaporation of the sweat droplets
involves the loss of latent heat and causes a cooling effect on the skin. The
amount of heat lost is related to the mass (Δm) of sweat evaporated thus:
mLH Δ.
- where L is the amount of heat needed to evaporate 1 kg of water.
IT for US
Thermal Energy and the Human Body - 4
2. Pre-requisite
knowledge required
Food types (carbohydrate,
protein, fat)
Aerobic respiration
Temperature measurement
Celsius scale of temperature
Effects of heating and cooling
substances
Heat transfer by convection
A temperature difference
causes the transfer of heat
3. Science concepts
developed in the
module
Energy content of food
Heat of combustion
Latent heat of vaporisation
The rate of cooling of a
substance depends upon the
temperature difference
between the substance and its
surroundings
4. Other useful
information
Further background theory
about metabolism, body
cooling and associated topics
may be found at:
http://hyperphysics.phy-
astr.gsu.edu/hbase/
hframe.html
A summary is attached as
Appendix 1.
IT for US
Thermal Energy and the Human Body - 5
B. Didactical approach
1. Pedagogical context
Possible contexts in which the topic might be introduced:
Comparing the energy values of a
variety of different foods
Discussion of balanced diet and
methods of dieting
Consideration of the energy
transfers when engaging in
sporting activities
Consideration of sweating as a
process which accelerates the loss
of body heat.
CONSTRUCTING A TEACHING SEQUENCE:
Each of the contexts suggested above will involve different starting points for
teacher exposition or class discussion, but it is strongly recommended that this
leads promptly to one of the data-logging activities. Such practical activity is
valuable for providing firsthand experience of the phenomenon which can be
used to stimulate questions about the underlying scientific processes. The need
for further investigation is a likely outcome and the simulation and modelling
activities provide a useful means of extending investigation and deepening
thinking. The simulation and modelling activities both demand quantitative
description and analysis.
2. Common student difficulties
Confusion between respiration and breathing
Confusion between heat and temperature
Understanding rate of change
3. Evaluation of ICT
This section considers some of the practical arrangements for exploiting the use
of ICT to best effect, and discusses the qualities of the ICT methods which make
a special contribution to students’ learning.
DATA-LOGGING
Both experiments use temperature probes which are generally very useful for
conducting a large variety of simple experiments involving heating and cooling.
Quite cheap probes can offer excellent sensitivity and accuracy well suited to
real-time experiments.

IT for US
Thermal Energy and the Human Body - 6
Energy content of food:
In this example, the probe is
secured in good thermal contact to
the top of the calorimeter resting
in an inverted position on a tripod.
The principle is that when an item
of food is ignited and burnt
underneath the calorimeter, the
rising hot gases heat up the
calorimeter. The data-logging
technique makes the graph of
temperature against time visible
immediately and when the burning
is complete, the maximum temperature may be read from the graph accurately.
Since we are interested in the total heat given out during burning, the
calorimeter needs to be calibrated so that the temperature rise may be used for
calculating the heat output. This is done by repeating the experiment using a
standard mains electric spot lamp inside the calorimeter in the place of the
burning food. The new graph of rise in temperature can be compared with the
first graph and the time taken to reach the former maximum temperature may
be measured. Multiplying this time by the wattage of the lamp gives the energy
output of the food.
Evaporation of water:
In this example, the temperature probe is set up with a small strip of tissue
paper rolled around its tip. After moistening the paper with several drops of
water, the cooling effect due to evaporation becomes evident on the
temperature versus time graph which develops while the experiment is in
progress. The drop in temperature is quite small, but the software allows it to
be magnified on the screen and easily measured.
SIMULATION
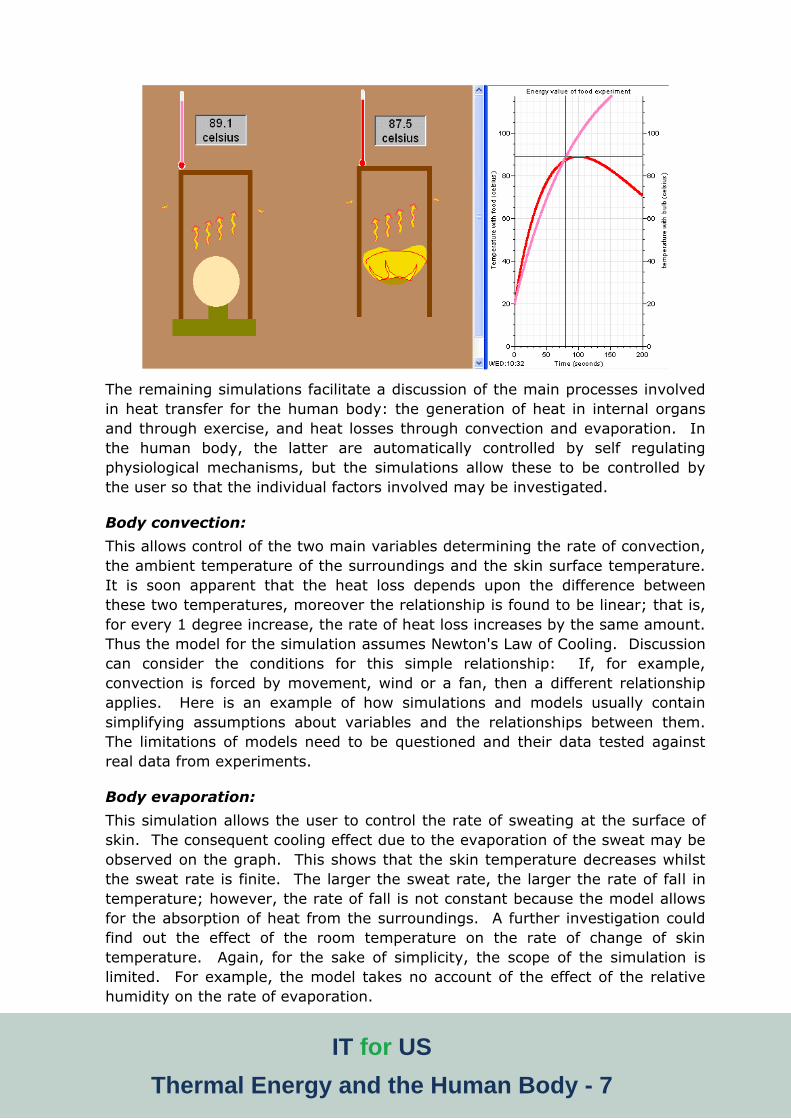
Energy value experiment:
This simulates the data-logging experiment of Activity 1a. Both parts of the
experiment, the burning of the potato crisp and the calibration with the electric
bulb, run simultaneously side by side with both sets of results displayed on the
graph. The simulation may be used to prepare pupils thinking before performing
the experiment, or it may be used for discussing the analysis of the results from
the experiment. The cursor controls make it possible to take accurate readings
from the graph.
IT for US
Thermal Energy and the Human Body - 7
The remaining simulations facilitate a discussion of the main processes involved
in heat transfer for the human body: the generation of heat in internal organs
and through exercise, and heat losses through convection and evaporation. In
the human body, the latter are automatically controlled by self regulating
physiological mechanisms, but the simulations allow these to be controlled by
the user so that the individual factors involved may be investigated.
Body convection:
This allows control of the two main variables determining the rate of convection,
the ambient temperature of the surroundings and the skin surface temperature.
It is soon apparent that the heat loss depends upon the difference between
these two temperatures, moreover the relationship is found to be linear; that is,
for every 1 degree increase, the rate of heat loss increases by the same amount.
Thus the model for the simulation assumes Newton's Law of Cooling. Discussion
can consider the conditions for this simple relationship: If, for example,
convection is forced by movement, wind or a fan, then a different relationship
applies. Here is an example of how simulations and models usually contain
simplifying assumptions about variables and the relationships between them.
The limitations of models need to be questioned and their data tested against
real data from experiments.
Body evaporation:
This simulation allows the user to control the rate of sweating at the surface of
skin. The consequent cooling effect due to the evaporation of the sweat may be
observed on the graph. This shows that the skin temperature decreases whilst
the sweat rate is finite. The larger the sweat rate, the larger the rate of fall in
temperature; however, the rate of fall is not constant because the model allows
for the absorption of heat from the surroundings. A further investigation could
find out the effect of the room temperature on the rate of change of skin
temperature. Again, for the sake of simplicity, the scope of the simulation is
limited. For example, the model takes no account of the effect of the relative
humidity on the rate of evaporation.

IT for US
Thermal Energy and the Human Body - 8
Body energy balance:
This simulation calculates the combined heat losses due to evaporation and
convection and allows them to be compared with the main sources of heat
generation within the body. Its main teaching purpose is to prompt thinking
about the sophistication of the self-regulatory processes which contribute to
homeostasis, which results in a stable internal body temperature of 37 °C. The
philosophy behind this simulation is for the user to attempt to control these
processes in a way which imitates the perfect balance normally achieved by the
body automatically. The difficulty of achieving this balance leads one to admire
even more the sophistication of the natural control systems within the human
body.
Food is the main source of supply of energy to the body and its slow metabolism
in internal organs results in the generation of heat (mainly in the liver). The
simulation demonstrates the slow release of heat from this process, normally
about 80W. In contrast, muscular activity in exercise produces 'waste' heat
much more quickly. Typically, muscles produce heat at three times the rate of
useful mechanical power. For heat losses by convection and evaporation, the
simulation incorporates ideas from the previous two simulations. Although this
simulation gives the user independent control of skin surface temperature, in
reality this is automatically controlled by systems within the body. Sweating is
not normally triggered until skin reaches a temperature of 37 °C.
IT for US
Thermal Energy and the Human Body - 9
MODELLING
The purpose of this activity is to use formulae to generate a set of data which
approximates as closely as possible to the data captured in the data logging
Activity 1b. The model performs a sequence of calculations, aimed at calculating
small changes of temperature and mass of liquid during a short interval of time.
Repetition of the calculations results in a set of data showing the temperature
and mass of liquid varying with time. The model shows how the calculations are
broken down into a few simple steps, each using a basic principle in physics.
The model assumes these physical concepts:
1. The rate of evaporation of the liquid contained in the tissue paper around the temperature probe varies in proportion to the mass of liquid remaining.
2. The rate of loss of heat due to evaporation varies in proportion to the rate of evaporation of the liquid and its latent heat of vaporisation.
3. The rate of heat gained from the surroundings varies in proportion to the difference in temperature between the liquid and its surroundings.
4. The temperature change depends upon the net heat transfer and the thermal capacity of the liquid and temperature probe.
The first concept is represented in the formula which calculates the change of
mass of liquid Δm during a regular time interval Δt:
tmVm
where m is the mass of liquid remaining, and
V is a constant representing the volatility of the liquid
The second assumption is represented in the formula:
mLHe
where ΔHe is the heat lost when mass Δm evaporates, and
L is the latent heat of vaporisation of the liquid.
The third assumption is represented in the formula which calculates the change
of temperature ΔT during a small time interval Δt:
tTTKT s)(
where Ts is the temperature of the surroundings, and
K is a constant of proportionality
The resulting change of temperature ΔT is calculated by summing heat lost and
heat gained:
mC
HHT es )(
where mC is the thermal capacity of the temperature probe.
Since the mass of liquid in the tissue paper is very much smaller than that of the
temperature probe, its thermal capacity is ignored compared with that of the
probe.
IT for US
Thermal Energy and the Human Body - 10
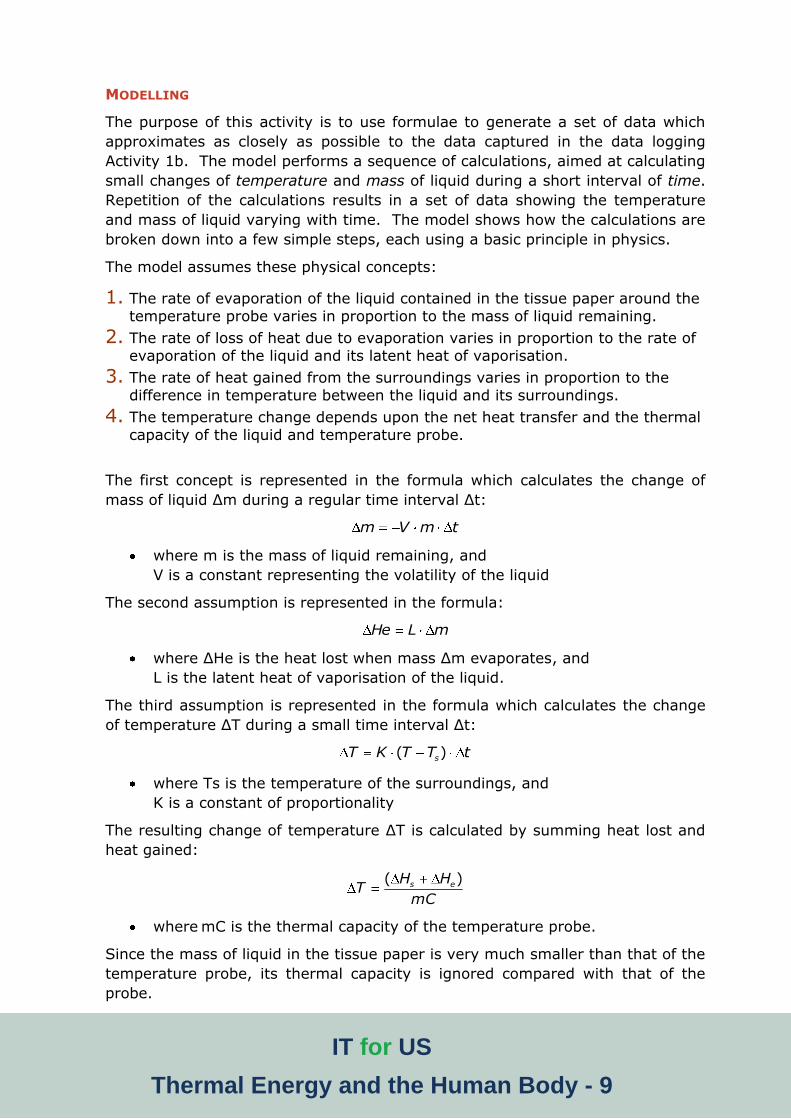
By studying the formulae and experimenting with different values for the
constants, the physical assumptions implicit in the model may be evaluated.
Each of the previous simulations contain similar models, and pupils may also
investigate them to identify the variables involved, the relationships between
them and the scientific principles represented by the formulae.
VIDEO CAPTURE
The video recording features a data-logging experiment designed to measure the
rate of energy emission from the human body. The experiment was devised by
Mats Areskoug, and his paper describing the theory and experiment is provided
in Appendix 2. The experiment may be reproduced in the school laboratory, but
in view of the unusual apparatus, the video recording conveniently allows the
experiment to be studied and results analysed without the expense of too much
time and money.
A thermally insulated box is prepared, containing sensors for temperature,
humidity and CO2 concentration. A data-logger records readings from the
sensors whilst a person spends a few minutes inside the box. The rise in
temperature can be obtained from the graph and used to calculate the heat
energy output from the person's body. The completion of the calculation
requires a separate calibration experiment similar to that used in data-logging
Activity 1b; a mains light bulb of known power output is placed inside the empty
box and the rate of temperature rise again recorded using the data-logger. The
method of calculating the equivalent heat output from the temperature rise is
exactly the same as that used in simulation Activity 2a. This is an illustration of
the complementary use of the different ICT tools: data-logging, simulation and
video capture.

IT for US
Thermal Energy and the Human Body - 11
The measurements of CO2 concentration and Relative humidity are useful as
evidence supporting the chemical description of aerobic respiration in the body:
C6H12O6+6 O2 6 CO2 + 6 H2O
Further, the increase in CO2 concentration can be used to calculate the amount
of glucose metabolised during the experiment. Since the Heat of Combustion
(enthalpy) of glucose is known, the amount of heat generated by respiration
may be calculated and compared with the result obtained from the rise of
temperature. Calculations from sample data are included in Activity 4. A full
explanation of the theory behind these may be found in the paper by Mats
Areskoug ‘The Power of the Human Body’ provided in Appendix 2.

IT for US
Thermal Energy and the Human Body - 12
4. Teaching approaches
The four activities presented here
offer distinctive but complementary
insights into the science involved in
this topic. For the activities to be
effective for teaching and learning, it
is helpful for teachers to consider two
types of skills in using the software
tools:
Operational skills which concern
the manipulation of the computer
hardware and knowledge of the
features in the software.
Procedural skills which concern
the manner in which the software
tools are employed in the lesson
context for the purpose of
achieving learning benefits. A
dominant aspect of these skills is
the development of an inquiring
approach to the analysis and
interpretation of data and to
making links with previous
knowledge.
Such skills are important for the
preparation of pupils for the activities,
and the activity sheets below each
contain indications of the skills
needed for the particular activity.
For the teacher, there are further
pedagogical skills which contribute to
the effectiveness of the activities:
1. Clarity of learning objectives for
each activity.
2. Understanding of the special value
of the ICT method and exploiting
its full potential in purposeful
ways.
3. To manage the activity in a way
which promotes ‘appropriate’
rather than ‘indiscriminate’ use of
ICT.
4. To integrate the learning from
each activity to develop pupils’
understanding of the topic.
The development of the last of these
is a particular aim of the IT for US
Project, and the activities presented
below have been specially selected to
illustrate how integration might be
achieved. Comparisons of the
observations and results of each
activity form a central role in this
integration process. For example:
Compare the two sets of data
collected in the first data-logging
experiment; the data obtained
with the electric lamp is used to
calibrate the data from burning
the potato crisp;
Use the results from the two data
logging experiments (1. burning,
2. evaporation) to contribute to a
discussion about human
respiration and the energy
balance maintained by the human
body;
Use the simulations to amplify the
discussion of respiration and
energy;
Compare data from the model
with experimental data;
Compare the data from the video-
recorded experiment, data-logging
experiments and the models.
In these, the graph is a key tool in
facilitating comparisons and
interpretations and skills with graphs
generally provide a common thread in
exploiting IT for US activities.

IT for US
Thermal Energy and the Human Body - 13
Teachers will usually have their preferred sequence of teaching themes involving,
demonstrations, explanations, class experiments, but the table below suggests a suitable sequence exemplifying a logical development of concepts. The right
hand column shows how the activities in this module may be chosen to enhance
the teaching sequence.
Teaching sequence IT for US Activities
Oxidation liberates energy in a fuel
*Experiments with burning fuels to find
energy content
Food is fuel to the human body
Experiment burning an item of food
in a quasi calorimetric bomb
D-Logging: 1a. Energy content of food
Simulation: 2a. Energy content of food
Heat energy emitted from a human body
comes from ‘burning’ food in the process
of ‘Aerobic respiration’
Experiment to measure heat
emitted from human body in
insulated box
Calculations of energy balance (optional)
Video: 4. Energy emission from human
D-Logging: Experiment featured in video
Heat energy is lost when a liquid
evaporates
Experiment to measure the
temperature of an evaporating
liquid
D-Logging: 1b. Evaporation of a liquid
Model: 3. Evaporation of a liquid
Thermal energy changes in the human
body
Simulation: 2b. Body evaporation
Body convection,
Body energy balance
The non-computer experiments (*) are not described here, since their details
are well established in conventional teaching schemes and text books.

IT for US
Thermal Energy and the Human Body - 14
The management of the classroom
setting also has an important influence
on the successful integration of
activities. When access to computer
equipment is scarce it is likely that the
teacher will wish to present the
activity as a demonstration in a
didactic manner. In this mode, the
teacher can give strong guidance to
pupils’ thinking about the comparisons
between the activities. Alternatively,
pupils could perform the activities in
small groups of three or four pupils,
each group engaged on a different
activity. Integration might be
achieved by each group making a
presentation of their results to the
whole class. In chairing these
presentations the teacher can prompt
discussion of the significant findings of
each group.
It is worth considering that all the
activities may be used in a variety of
learning contexts; it is not necessary
to consider their mode of use
exclusively as a first experience of the
topic. For example, the simulations
could be used to prepare thinking
about the video-recorded experiment.
Similarly, the evaporation model could
be used either before the data-logging
experiment to prepare thinking about
the experiment, or it could be used as
a means of extending the
investigation, or as a revision exercise,
or for distance learning. Although the
activities have been designed to
provide complementary experiences, it
is not essential to use all of them; two,
three or four activities might be
chosen according to how well they suit
the needs of teachers and pupils in a
particular context. In varying
conditions between schools and within
schools at different times of the year
or different stages in the curriculum,
needs and appropriateness are likely
to change; for example, data-logging
equipment might not be available at
the time of need, an individual pupil
might need a revision or extension
activity, an enrichment activity might
be required to occupy some spare
time, a quick activity might be needed
if time is scarce. The overlapping
features, such as graphical
presentation, between the activities
allows them to be used to a certain
extent as alternatives, but their
distinctive features also allow them to
be used as complements to each other.
The table below summarises the
distinctive potential learning benefits
of each. It is a useful guide to the
special value of each ICT activity.
IT for US
Thermal Energy and the Human Body - 15
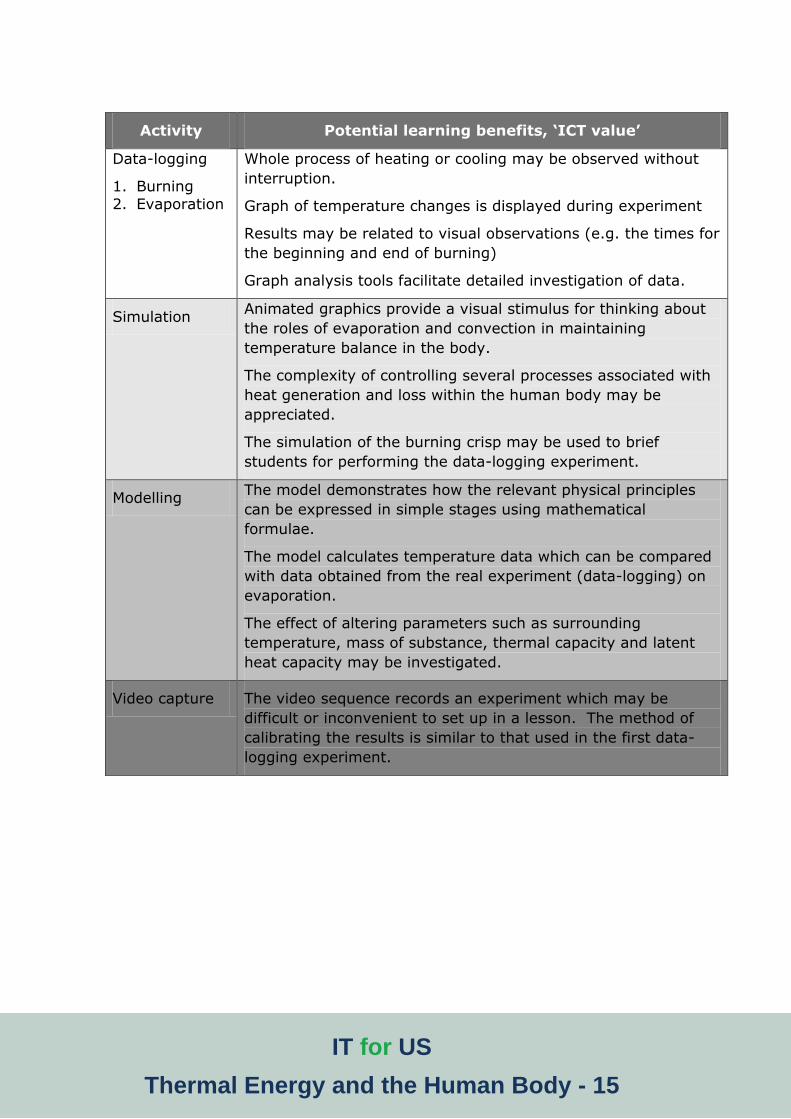
Activity Potential learning benefits, ‘ICT value’
Data-logging
1. Burning
2. Evaporation
Whole process of heating or cooling may be observed without
interruption.
Graph of temperature changes is displayed during experiment
Results may be related to visual observations (e.g. the times for
the beginning and end of burning)
Graph analysis tools facilitate detailed investigation of data.
Simulation Animated graphics provide a visual stimulus for thinking about
the roles of evaporation and convection in maintaining
temperature balance in the body.
The complexity of controlling several processes associated with
heat generation and loss within the human body may be
appreciated.
The simulation of the burning crisp may be used to brief
students for performing the data-logging experiment.
Modelling The model demonstrates how the relevant physical principles
can be expressed in simple stages using mathematical
formulae.
The model calculates temperature data which can be compared
with data obtained from the real experiment (data-logging) on
evaporation.
The effect of altering parameters such as surrounding
temperature, mass of substance, thermal capacity and latent
heat capacity may be investigated.
Video capture The video sequence records an experiment which may be
difficult or inconvenient to set up in a lesson. The method of
calibrating the results is similar to that used in the first data-
logging experiment.

IT for US
Thermal Energy and the Human Body - 16
5. Resources for Student Activities
USING INSIGHT SOFTWARE
Activity Software
program
Files available
1. Data-logging Datalogging
Insight
Set-up files: ‘Energy value set up’ and
‘Evaporation set up’.
Open these files to configure the program
ready for the experiments.
Data files: ‘Energy value data’ and
‘Evaporation data’
These files contain sample sets of data.
2. Simulation Simulation
Insight
‘Energy value expt’
‘Body convection’
‘Body evaporation’
‘Body energy balance’
3. Modelling Simulation
Insight
‘Evaporation model’
4. Video Media player
Datalogging
Insight
‘Body heat expt’
‘Human body data’
EQUIPMENT AND MATERIALS FOR ACTIVITY 1 (DATA-LOGGING)
Computer
Software – See table above
Interface (data-logger)
Temperature sensor
Copper calorimeter
Tripod and heat resistant mat
Packet of potato crisps
Tongs
100W bulb in holder
Matches, Adhesive tape, Pipette, Filter paper

IT for US
Thermal Energy and the Human Body - 17
C. Student Activities
ACTIVITY 1A. EXPERIMENT TO MEASURE THE
ENERGY CONTENT OF FOOD
Learning Objectives:
1. To measure the rise in temperature of a copper
calorimeter when an item of food is burnt inside it.
2. To calibrate the calorimeter for heat transfer using
a standard electric bulb.
3. To calculate the amount of heat given out by
the item of food when burnt.
Operational Skills:
Connecting sensors and interfaces
Choosing logging parameters
Starting and finishing real-time logging
Using the cursor tools for obtaining measurements from the graph
Procedural Skills:
Evaluating measurement quality
Analysing data using graph
Reading values/slopes
Materials:
Interface (data-logger)
Temperature sensor
Copper calorimeter on a tripod on a heat resistant mat
Handling tongs
Food item (potato crisp)
100W bulb in holder (reflector type)
Matches
Adhesive tape
APPLIED ICT TECHNOLOGY:
DATA LOGGING
STUDENT LEVEL:
AGE 14-17
RECOMMENDED SETTINGS:
STUDENT ACTIVITY IF
ENOUGH EQUIPMENT IS
AVAILABLE, OTHERWISE
TEACHER DEMONSTRATION
IT for US
Thermal Energy and the Human Body - 18
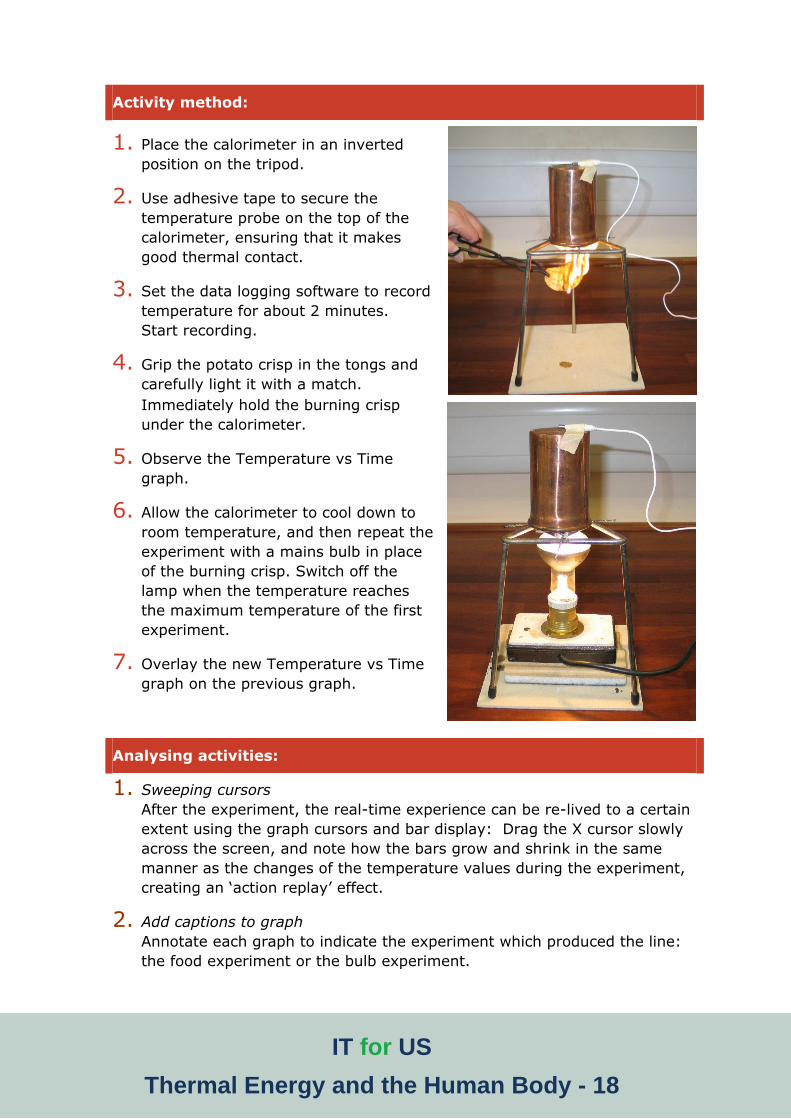
Activity method:
1. Place the calorimeter in an inverted
position on the tripod.
2. Use adhesive tape to secure the
temperature probe on the top of the
calorimeter, ensuring that it makes
good thermal contact.
3. Set the data logging software to record
temperature for about 2 minutes.
Start recording.
4. Grip the potato crisp in the tongs and
carefully light it with a match.
Immediately hold the burning crisp
under the calorimeter.
5. Observe the Temperature vs Time
graph.
6. Allow the calorimeter to cool down to
room temperature, and then repeat the
experiment with a mains bulb in place
of the burning crisp. Switch off the
lamp when the temperature reaches
the maximum temperature of the first
experiment.
7. Overlay the new Temperature vs Time
graph on the previous graph.
Analysing activities:
1. Sweeping cursors
After the experiment, the real-time experience can be re-lived to a certain
extent using the graph cursors and bar display: Drag the X cursor slowly
across the screen, and note how the bars grow and shrink in the same
manner as the changes of the temperature values during the experiment,
creating an ‘action replay’ effect.
2. Add captions to graph
Annotate each graph to indicate the experiment which produced the line:
the food experiment or the bulb experiment.

IT for US
Thermal Energy and the Human Body - 19
3. Take readings from the graph Record the highest temperature reached in the potato crisp experiment.
Use the Interval graphing tool to measure how many seconds it took the
for the mains bulb to reach the same temperature.
Calculate the energy supplied using ΔH = 100 x interval.
4. Time measurements Find the time period for which the potato crisp was burning.
5. Measure rate of change Use the Rate and Gradient graphing tools to measure and compare the
rates of warming up in each experiment. Could these values be used to
calculate the energy in the food?
Burning crisp: Reading highest temperature and time for burning
IT for US
Thermal Energy and the Human Body - 20
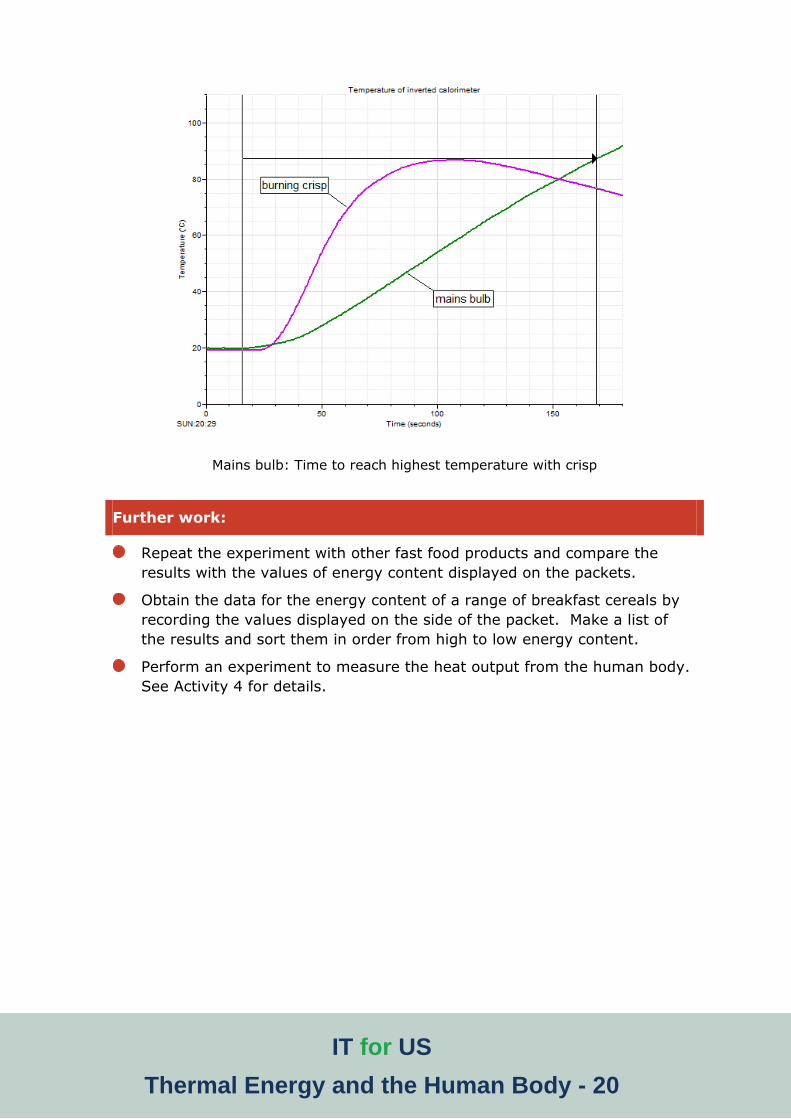
Mains bulb: Time to reach highest temperature with crisp
Further work:
Repeat the experiment with other fast food products and compare the
results with the values of energy content displayed on the packets.
Obtain the data for the energy content of a range of breakfast cereals by
recording the values displayed on the side of the packet. Make a list of
the results and sort them in order from high to low energy content.
Perform an experiment to measure the heat output from the human body.
See Activity 4 for details.
IT for US
Thermal Energy and the Human Body - 21
ACTIVITY 1B. EXPERIMENT TO MEASURE THE
EFFECT OF A LIQUID
EVAPORATING
Learning Objectives:
1. To measure the fall in temperature of a liquid
when it evaporates.
2. To understand the factors which influence the
cooling effect of evaporation.
Operational Skills:
Connecting sensors and interfaces
Choosing logging parameters
Starting and finishing real-time logging
Using the cursor tools for obtaining measurements from the graph
Procedural Skills:
Evaluating measurement quality
Analysing data using graph
Reading values/slopes
Materials:
Interface (data-logger)
Temperature sensor
Tissue paper
Pipette
APPLIED ICT TECHNOLOGY:
DATA LOGGING
STUDENT LEVEL:
AGE 14-17
RECOMMENDED SETTINGS:
STUDENT ACTIVITY IF
ENOUGH EQUIPMENT IS
AVAILABLE, OTHERWISE
TEACHER DEMONSTRATION

IT for US
Thermal Energy and the Human Body - 22
Activity method:
1. Assemble the temperature probe in the stand with a piece of tissue paper
wrapped around its tip.
2. Fill a pipette with water.
3. Set the data logger to record temperature for 15 minutes.
4. Use the pipette to soak the tissue paper with water.
5. Observe the Temperature vs Time graph.
Analysing activities:
1. Magnify the graph
Use the Zoom or scaling tool to increase the vertical scale so as to magnify
the change of temperature.
2. Sweeping cursors
After the experiment, the real-time experience can be re-lived to a certain
extent using the graph cursors and bar display: Drag the X cursor slowly
across the screen, and note how the bars grow and shrink in the same
manner as the changes of the temperature values during the experiment,
creating an ‘action replay’ effect.
3. Take readings from the graph Record the lowest temperature reached in the experiment.
Use the Change graphing tool to measure the maximum fall in
temperature.
4. Time measurements Use the Interval graphing tool to measure how many seconds it took the
for the lowest temperature to be reached.

IT for US
Thermal Energy and the Human Body - 23
Taking readings of Change and Interval.

IT for US
Thermal Energy and the Human Body - 24
ACTIVITY 2A. UNDERSTANDING THE ‘ENERGY
CONTENT OF FOOD’ EXPERIMENT
Learning Objectives:
1. To understand the energy transfers which cause
changes of temperature of the calorimeter in the
data-logging experiment 1a.
2. To understand the use of the mains bulb as a means
of calibrating temperature changes of
the calorimeter to determine heat transfer.
Operational Skills:
Using the software controls for running the simulation
Using the cursor tools for obtaining readings from the graph
Procedural Skills:
Relate temperature and temperature changes to the shape of the graph
Describe observations and link these with theoretical explanation
Activity method:
1. Open the Insight file ‘Energy value expt’.
2. Look carefully at the simulation window and notice that it shows two
experiments which will run at the same time. The experiment on the left
shows a mains bulb heating up the inside of the calorimeter. The
experiment on the right shows an item of food being burnt inside the
calorimeter.
3. Look at the graph and notice that this shows temperature of the
calorimeter against time. By comparing the two graphs, it is possible to
calculate the amount of heat produced by the burning crisp.
APPLIED ICT TECHNOLOGY:
SIMULATION
STUDENT LEVEL:
AGE 14-17
RECOMMENDED SETTINGS:
STUDENT ACTIVITY OR
TEACHER-LED CLASS
DISCUSSION

IT for US
Thermal Energy and the Human Body - 25
Analysing activities:
1. Sweeping cursors
After running the model and observing the heating and cooling, replay the
changes using the graph cursors and bar display: Drag the X cursor slowly
across the screen, and note how the bars grow and shrink in the same
manner as the changes of the temperature values during the experiment,
creating an ‘action replay’ effect. Observe that the temperature begins to
fall when the crisp has finished burning.
2. Add captions to graph
Annotate the point on the graph to show where the crisp stopped burning.
3. Take readings from the graph Make a note of the maximum temperature reached when the crisp burns.
Find the time taken for the bulb to reach the same temperature.
Calculate the amount of heat given out by the bulb during this time using:
Heat (in joules) = power (in watts) x time (in seconds)
This is the same as the amount of heat produced when the crisp has
completely burnt.

IT for US
Thermal Energy and the Human Body - 26
ACTIVITY 2B. INVESTIGATING ENERGY CHANGES
IN THE HUMAN BODY
Learning Objectives:
1. To understand the factors which affect the loss of
heat energy by the convection of air around the body.
2. To understand how sweating and evaporation
allow the human body to lose heat.
3. To understand how food and exercise create heat
energy in the body and how this needs to balance
the body’s losses of heat through convection and
evaporation.
Operational Skills:
Using the software controls for running the simulation
Using the cursor tools for obtaining readings from the graph
Procedural Skills:
Relate temperature and temperature changes to the shape of the graph
Describe observations and link these with theoretical explanation
Investigating convection:
1. Open the Insight file ‘Body convection’.
2. Adjust the value of room temperature and notice its effect on the rate of
loss of heat. (If the heat loss shows as negative, this corresponds to the
body gaining heat from the surroundings.)
3. Adjust the value of room temperature and notice its effect on the rate of
loss of heat against time.
4. Adjust the value of skin surface temperature and notice its effect on the
rate of loss of heat against time.
5. Make a simple rule which predicts the rate of loss of heat to the
surroundings.
6. How would the rate of heat loss be affected by the wearing of clothes?
Explain.
APPLIED ICT TECHNOLOGY:
SIMULATION
STUDENT LEVEL:
AGE 14-17
RECOMMENDED SETTINGS:
STUDENT ACTIVITY OR
TEACHER-LED CLASS
DISCUSSION
IT for US
Thermal Energy and the Human Body - 27
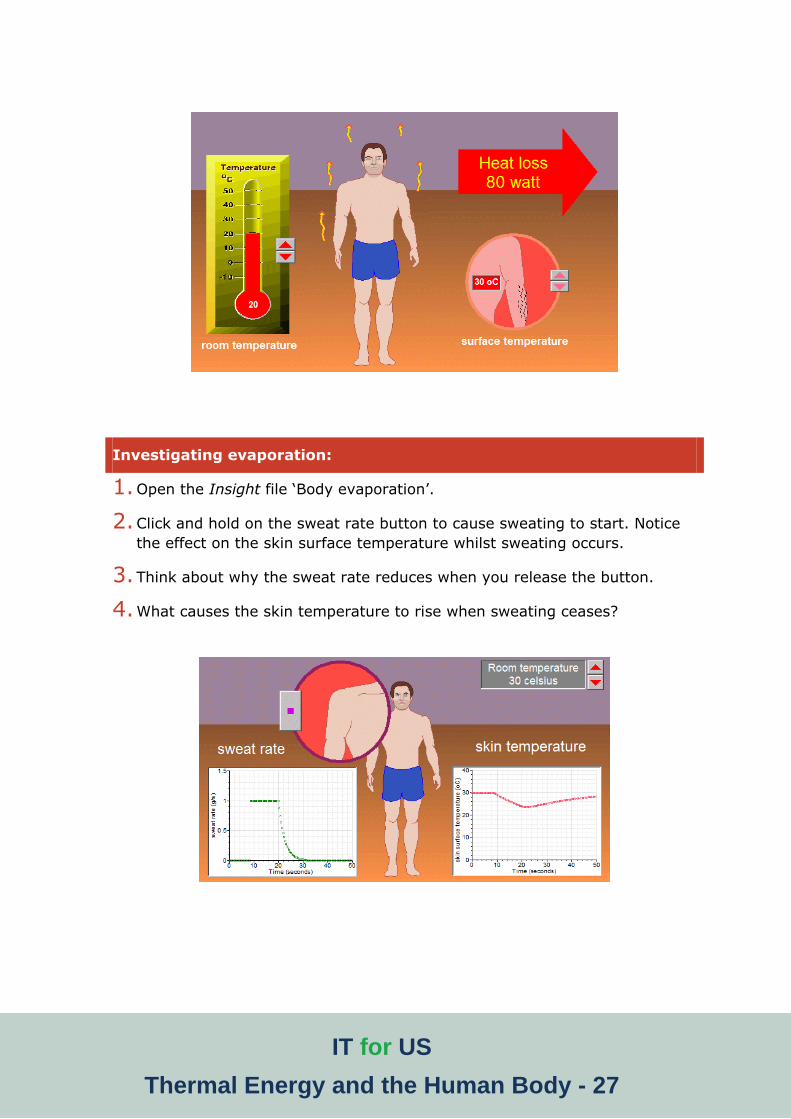
Investigating evaporation:
1. Open the Insight file ‘Body evaporation’.
2. Click and hold on the sweat rate button to cause sweating to start. Notice
the effect on the skin surface temperature whilst sweating occurs.
3. Think about why the sweat rate reduces when you release the button.
4. What causes the skin temperature to rise when sweating ceases?
IT for US
Thermal Energy and the Human Body - 28
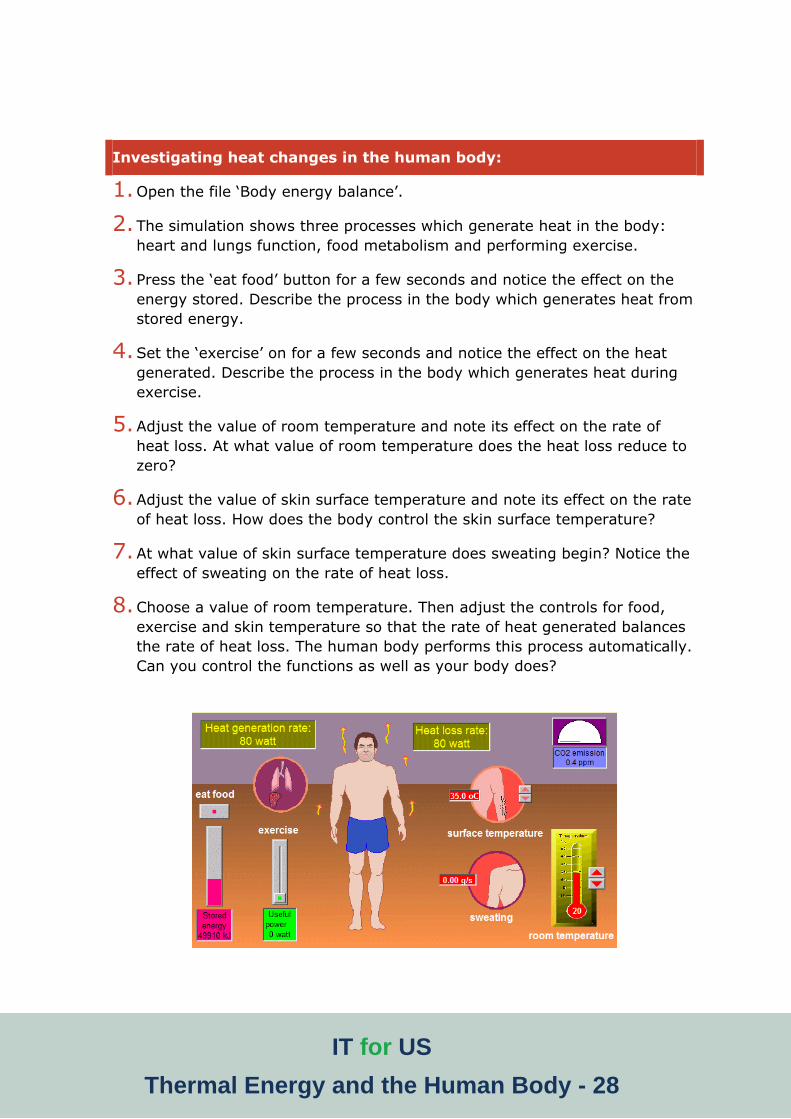
Investigating heat changes in the human body:
1. Open the file ‘Body energy balance’.
2. The simulation shows three processes which generate heat in the body:
heart and lungs function, food metabolism and performing exercise.
3. Press the ‘eat food’ button for a few seconds and notice the effect on the
energy stored. Describe the process in the body which generates heat from
stored energy.
4. Set the ‘exercise’ on for a few seconds and notice the effect on the heat
generated. Describe the process in the body which generates heat during
exercise.
5. Adjust the value of room temperature and note its effect on the rate of
heat loss. At what value of room temperature does the heat loss reduce to
zero?
6. Adjust the value of skin surface temperature and note its effect on the rate
of heat loss. How does the body control the skin surface temperature?
7. At what value of skin surface temperature does sweating begin? Notice the
effect of sweating on the rate of heat loss.
8. Choose a value of room temperature. Then adjust the controls for food,
exercise and skin temperature so that the rate of heat generated balances
the rate of heat loss. The human body performs this process automatically.
Can you control the functions as well as your body does?

IT for US
Thermal Energy and the Human Body - 29
ACTIVITY 3. INVESTIGATING MODELS OF
ENERGY CHANGES IN THE HUMAN
BODY
Learning Objectives:
1. To understand that the rate of cooling during
evaporation depends upon the mass of water
present, its volatility and latent heat.
2. To understand that when the temperature of a body
is lower than the temperature of its surroundings,
the body receives heat from the surroundings.
Operational Skills:
Using the software controls for running the simulation
Using the cursor tools for obtaining readings from the graph
Procedural Skills:
Relate temperature and temperature changes to the shape of the graph
Describe observations and link these with theoretical explanation
Evaporation (using Simulation Insight)
1. Open the Insight file ‘Evaporation model’.
2. Click on the START button to run the simulation.
3. Observe the shape of the Temperature vs Time graph and try to explain it.
4. If water were more volatile, the constant ‘V’ would be larger. Stop the
model, make V = 0.2 and run the model again. How does the graph differ
from before.
APPLIED ICT TECHNOLOGY:
MODELLING
STUDENT LEVEL:
AGE 14-17
RECOMMENDED SETTINGS:
STUDENT ACTIVITY OR
TEACHER-LED CLASS
DISCUSSION

IT for US
Thermal Energy and the Human Body - 30
Body energy models (using Simulation Insight)
1. Open each of the previous simulation files, show the model window and
find out how the models work:
‘Energy value expt’
‘Body convection’
‘Body evaporation’
‘Body heat balance’

IT for US
Thermal Energy and the Human Body - 31
ACTIVITY 4. ANALYSIS OF A VIDEO RECORDING
OF AN EXPERIMENT TO MEASURE
THE RATE OF ENERGY EMISSION
FROM THE HUMAN BODY
Learning Objectives:
1. To measure the rate of heat emitted by the human
body.
Operational Skills:
Using the cursor tools for obtaining readings from
the graph
Procedural Skills:
Relate the graphs to the theory of respiration
Activities:
The video shows an experiment in which a person sits inside a thermally
insulated box for a few minutes. During that time a data-logger records
measurements of temperature, humidity and carbon dioxide concentration
inside the box. Afterwards a similar experiment is conducted, but with an
electric bulb instead of a person inside the box. By comparing the
temperature increases in each experiment, the rate of heat emitted by the
person may be calculated.
APPLIED ICT TECHNOLOGY:
VIDEO CAPTURE
STUDENT LEVEL:
AGE 15-17
RECOMMENDED SETTINGS:
STUDENT ACTIVITY OR
TEACHER-LED CLASS
DISCUSSION
IT for US
Thermal Energy and the Human Body - 32
Analysing activities:
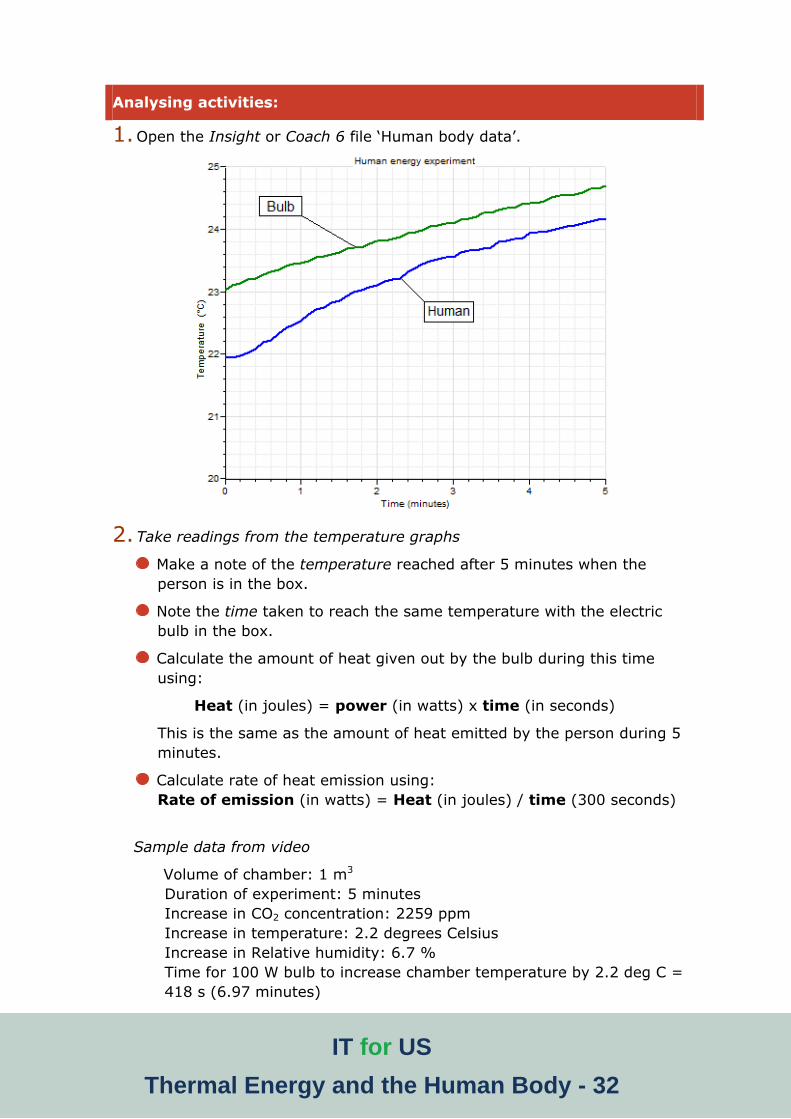
1. Open the Insight or Coach 6 file ‘Human body data’.
2. Take readings from the temperature graphs
Make a note of the temperature reached after 5 minutes when the
person is in the box.
Note the time taken to reach the same temperature with the electric
bulb in the box.
Calculate the amount of heat given out by the bulb during this time
using:
Heat (in joules) = power (in watts) x time (in seconds)
This is the same as the amount of heat emitted by the person during 5
minutes.
Calculate rate of heat emission using:
Rate of emission (in watts) = Heat (in joules) / time (300 seconds)
Sample data from video
Volume of chamber: 1 m3
Duration of experiment: 5 minutes
Increase in CO2 concentration: 2259 ppm
Increase in temperature: 2.2 degrees Celsius
Increase in Relative humidity: 6.7 %
Time for 100 W bulb to increase chamber temperature by 2.2 deg C =
418 s (6.97 minutes)

IT for US
Thermal Energy and the Human Body - 33
Calculation of rate of heat emission
Heat emitted by 100W bulb in 418 seconds = 100 * 418 = 41800 J
Rate of heat emission by human body over 300 seconds = 41800 / 300
= 139 W
3. Take readings from the humidity and CO2 graphs
Take readings of the increase in relative humidity and the increase in CO2
concentration during the 5 minute period of the experiment. Discuss the
reasons for these increases in relation to the process of aerobic respiration
in the human body. These readings may also be used to calculate the amount of glucose
metabolised during the experiment and the consequent rate of heat
generation in the human body. Using the sample data from the video, the
following calculations may be made.
Emitted CO2 in mol:
1 ppm (part per million) corresponds to 1 cm3 in 1 m3. Since the
volume of the box in the experiment is 1 m3, the increase in CO2
corresponds to a volume ΔV= 2259 cm3 = 2.259 litre.
At 273 K (0oC) at 1 atm pressure, 1 mole of gas has a volume 22.4 litre
(V0).
It follows, at 298 K (25oC) at 1 atm pressure, 1 mole of gas has a
volume given by
45,24273
2984,22
0
0T
TVtV
Thus 1 litre contains 1 / (24.45) mol
Hence, 2.259 litre contains 2.259 / 24.45 = 0.092 mol of CO2
Combustion of glucose:
For the oxidation of glucose, C6H12O6+6 O2 6 CO2 + 6 H2O one mole
of glucose being burned yields 6 moles of CO2. Therefore 0.092 mol of
CO2 emitted in the experiment originates from 0.015 mol of glucose
being burned.
The Heat of Combustion (enthalpy) of glucose is 2812 kJ/mol
The yielded heat is therefore ΔHb=0.015 * 2812 = 42.2 kJ.
Power of combustion is P= 42200 J /300 s = 141 W
Energy for water vaporisation:
Relative Humidity change ΔRH = 6.7%
Saturated vapour pressure of water at 278 K is 3167 Pa
Thus, change of water vapour pressure Δp = 6.7% * 3167 Pa = 212 Pa
IT for US
Thermal Energy and the Human Body - 34
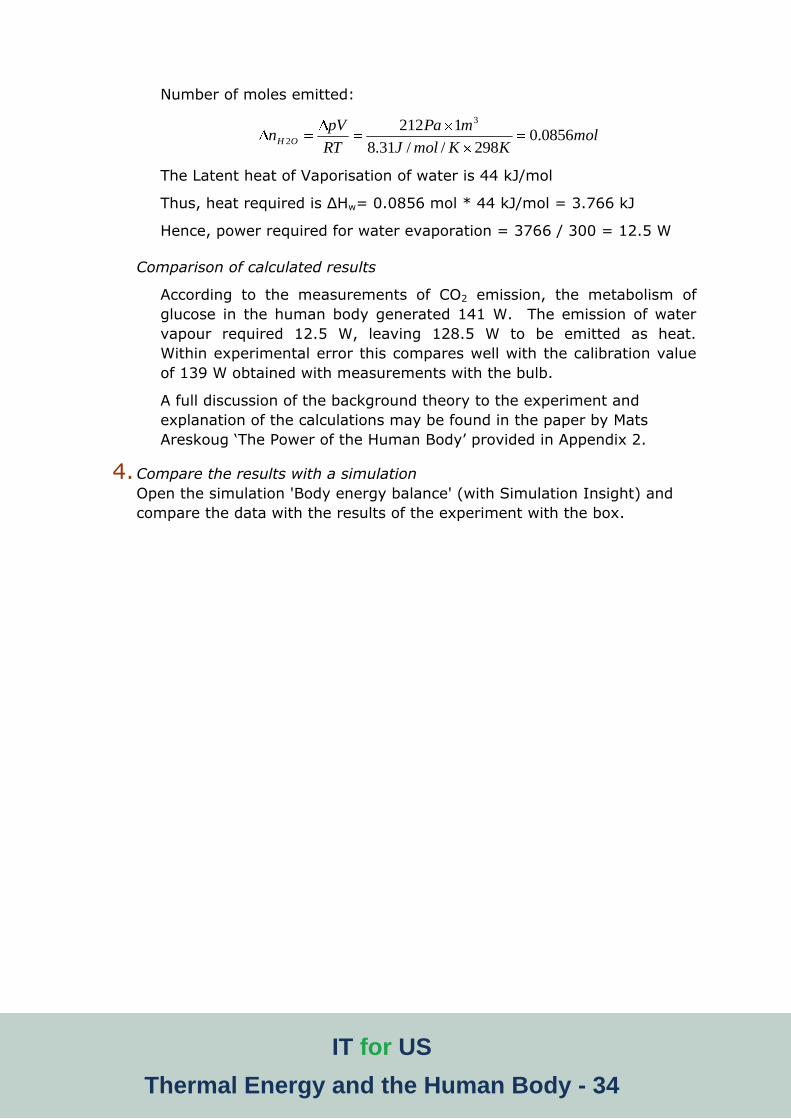
Number of moles emitted:
molKKmolJ
mPa
RT
pVn OH 0856.0
298//31.8
1212 3
2
The Latent heat of Vaporisation of water is 44 kJ/mol
Thus, heat required is ΔHw= 0.0856 mol * 44 kJ/mol = 3.766 kJ
Hence, power required for water evaporation = 3766 / 300 = 12.5 W
Comparison of calculated results
According to the measurements of CO2 emission, the metabolism of
glucose in the human body generated 141 W. The emission of water
vapour required 12.5 W, leaving 128.5 W to be emitted as heat.
Within experimental error this compares well with the calibration value
of 139 W obtained with measurements with the bulb.
A full discussion of the background theory to the experiment and
explanation of the calculations may be found in the paper by Mats
Areskoug ‘The Power of the Human Body’ provided in Appendix 2.
4. Compare the results with a simulation
Open the simulation 'Body energy balance' (with Simulation Insight) and
compare the data with the results of the experiment with the box.