
Thermal conductivity of metal-organic framework 5 (MOF-5 ...
12
Thermal conductivity of metal-organic framework 5 (MOF-5): Part I. Molecular dynamics simulations B.L. Huang, A.J.H. McGaughey 1 , M. Kaviany * Department of Mechanical Engineering, University of Michigan, 2250 G.G. Brown Laboratory, Ann Arbor, MI 48109-2125, United States Received 2 March 2006; received in revised form 29 September 2006 Available online 7 November 2006 Abstract The phonon thermal conductivity of MOF-5, a metal-organic framework crystal with a phenylene bridge, is predicted between tem- peratures of 200 K and 400 K using molecular dynamics simulations and the Green–Kubo method. The simulations are performed using interatomic potentials obtained using ab initio calculations and experimental results. The predicted thermal conductivity of MOF-5 is low for a crystal, 0.31 W/m K at a temperature of 300 K, and its temperature dependence is very weak. By decomposing the thermal con- ductivity into components associated with short- and long-range acoustic phonons, and optical phonons, the weak temperature depen- dence is found to be related to the mean free path of the majority of phonons, which is of the order of lattice parameter (and is essentially temperature independent). To interpret the results, an analytical thermal conductivity relation is derived, which reduces to the Cahill– Pohl and Slack models under appropriate assumptions. The relation contains a critical frequency, which determines the relative contri- butions of the short- and long-range acoustic phonons. The small long-range acoustic phonon contribution is found to be related to the long and flexible phenylene bridge, and to the mass mismatch between the cages and the bridges. Ó 2006 Elsevier Ltd. All rights reserved. Keywords: Metal-organic framework; Molecular dynamics simulations; Thermal conductivity; Nanoporous crystals; Potentials 1. Introduction The metal-organic frameworks (MOFs), a sub-family of the nanoporous crystals, are characterized by metal-oxygen cages (vertices) connected by organic bridges [1–4]. MOFs currently attract intensive interest for their excellent poten- tial for storing and separating gases (e.g., N 2 , Ar, CO 2 , CH 4 , and H 2 ) [5–7]. By changing the organic bridge and/ or its functionalization, new MOFs can be designed and synthesized without changing the underlying topology. Recent work has focused on their structural properties [2], adsorption characteristics [2,5–7], and the diffusion of light gases through them [8], but their thermal transport characteristics have yet to be considered. Since the gas absorption/desorption is sensitive to the unintended change in the ambient temperature and this response is related to the absorption/desorption bed thermal conduc- tivity, the knowledge of the thermal conductivity of a MOF is crucial in predicting the behavior. Furthermore, the variety of MOFs available points towards the possibil- ity of systematically designing materials with specified ther- mal properties. To prepare for such molecular design, an understanding of the relationship between a MOF struc- ture and its thermal conductivity is required. We report the investigation of the thermal transport in MOF-5 (shown in Fig. 1), which is the smallest of a series of MOFs that have a simple cubic crystal structure [2]. It is built from zinc–oxygen tetrahedra connected by 1,4-ben- zenedicarboxylate (BDC) bridges. It has a low density (610 kg/m 3 ), a large free cage volume (79%), and a pore diameter of 11.2 A ˚ [2]. There are two standard approaches for predicting the thermal conductivity of a solid, both of which are based 0017-9310/$ - see front matter Ó 2006 Elsevier Ltd. All rights reserved. doi:10.1016/j.ijheatmasstransfer.2006.10.002 * Corresponding author. Tel.: +1 734 936 0402; fax: +1 734 647 3170. E-mail address: [email protected] (M. Kaviany). 1 Present address: Department of Mechanical Engineering, Carnegie Mellon University, Pittsburgh, PA 15213, United States. www.elsevier.com/locate/ijhmt International Journal of Heat and Mass Transfer 50 (2007) 393–404
Transcript of Thermal conductivity of metal-organic framework 5 (MOF-5 ...

www.elsevier.com/locate/ijhmt
International Journal of Heat and Mass Transfer 50 (2007) 393–404
Thermal conductivity of metal-organic framework 5 (MOF-5):Part I. Molecular dynamics simulations
B.L. Huang, A.J.H. McGaughey 1, M. Kaviany *
Department of Mechanical Engineering, University of Michigan, 2250 G.G. Brown Laboratory, Ann Arbor, MI 48109-2125, United States
Received 2 March 2006; received in revised form 29 September 2006Available online 7 November 2006
Abstract
The phonon thermal conductivity of MOF-5, a metal-organic framework crystal with a phenylene bridge, is predicted between tem-peratures of 200 K and 400 K using molecular dynamics simulations and the Green–Kubo method. The simulations are performed usinginteratomic potentials obtained using ab initio calculations and experimental results. The predicted thermal conductivity of MOF-5 is lowfor a crystal, 0.31 W/m K at a temperature of 300 K, and its temperature dependence is very weak. By decomposing the thermal con-ductivity into components associated with short- and long-range acoustic phonons, and optical phonons, the weak temperature depen-dence is found to be related to the mean free path of the majority of phonons, which is of the order of lattice parameter (and is essentiallytemperature independent). To interpret the results, an analytical thermal conductivity relation is derived, which reduces to the Cahill–Pohl and Slack models under appropriate assumptions. The relation contains a critical frequency, which determines the relative contri-butions of the short- and long-range acoustic phonons. The small long-range acoustic phonon contribution is found to be related to thelong and flexible phenylene bridge, and to the mass mismatch between the cages and the bridges.� 2006 Elsevier Ltd. All rights reserved.
Keywords: Metal-organic framework; Molecular dynamics simulations; Thermal conductivity; Nanoporous crystals; Potentials
1. Introduction
The metal-organic frameworks (MOFs), a sub-family ofthe nanoporous crystals, are characterized by metal-oxygencages (vertices) connected by organic bridges [1–4]. MOFscurrently attract intensive interest for their excellent poten-tial for storing and separating gases (e.g., N2, Ar, CO2,CH4, and H2) [5–7]. By changing the organic bridge and/or its functionalization, new MOFs can be designed andsynthesized without changing the underlying topology.Recent work has focused on their structural properties[2], adsorption characteristics [2,5–7], and the diffusion oflight gases through them [8], but their thermal transportcharacteristics have yet to be considered. Since the gas
0017-9310/$ - see front matter � 2006 Elsevier Ltd. All rights reserved.
doi:10.1016/j.ijheatmasstransfer.2006.10.002
* Corresponding author. Tel.: +1 734 936 0402; fax: +1 734 647 3170.E-mail address: [email protected] (M. Kaviany).
1 Present address: Department of Mechanical Engineering, CarnegieMellon University, Pittsburgh, PA 15213, United States.
absorption/desorption is sensitive to the unintendedchange in the ambient temperature and this response isrelated to the absorption/desorption bed thermal conduc-tivity, the knowledge of the thermal conductivity of aMOF is crucial in predicting the behavior. Furthermore,the variety of MOFs available points towards the possibil-ity of systematically designing materials with specified ther-mal properties. To prepare for such molecular design, anunderstanding of the relationship between a MOF struc-ture and its thermal conductivity is required.
We report the investigation of the thermal transport inMOF-5 (shown in Fig. 1), which is the smallest of a seriesof MOFs that have a simple cubic crystal structure [2]. It isbuilt from zinc–oxygen tetrahedra connected by 1,4-ben-zenedicarboxylate (BDC) bridges. It has a low density(610 kg/m3), a large free cage volume (79%), and a porediameter of 11.2 A [2].
There are two standard approaches for predicting thethermal conductivity of a solid, both of which are based

Nomenclature
a mean atomic distanceb constantc concentrationk thermal conductivityn number densityP pressureq charger distancet timeu velocityA coefficientB coefficientD density of statesE energyI spectral densityM dipole momentsM atomic weightN number of particlesNc number of atoms in a primitive cellRc cut-off radiusT temperatureV volume
Greek symbols
b Wolf method parametercG Gruneisen constant
js compressibilityk mean free pathm Poisson ratiox angular frequency_x heat currentq densitys time constantu potential energy
SubscriptsA acousticCP Cahill–Pohli summation index, particle labelj summation index, particle labelp phonong groupc cellO opticalT transversalL longitudinalD Debyesh short-rangelg long-rangej wave vectorb species
394 B.L. Huang et al. / International Journal of Heat and Mass Transfer 50 (2007) 393–404
on the Fourier law. One approach is to use continuumtransport theory and kinetic theory, such as the Boltzmanntransport equation (BTE) approach of Callaway [9] andHolland [10]. The second is to use an atomistic technique,such as molecular dynamics (MD) simulations. The BTEcan be used to study large systems rather quickly, but fora reliable calculation, a good understanding of the underly-ing phonon processes is required. Parameters such as thephonon relaxation times must be obtained from otherapproaches (e.g., by fitting to experimental data [9,10] ordirectly from MD [11]). Molecular dynamics is a more fun-damental method, which tracks the positions and momentaof an ensemble of classically interacting atoms. For input,MD only requires a material structure and suitable inter-atomic potentials. In this investigation, MD will be usedto predict the thermal conductivity of MOF-5. The datarequired for a BTE study is currently unavailable.
We first describe the development of the classical inter-atomic potentials (force fields) needed to perform MD sim-ulations of MOFs. Using these potentials, the thermalconductivity of MOF-5 is predicted between temperaturesof 200 K and 400 K. The thermal conductivity is decom-posed into components associated with short- and long-range acoustic phonons and optical phonons. A model isformulated to explain the observed weak temperaturedependence, and a critical frequency is introduced to sepa-
rate the contributions of the two acoustic components.Finite size and quantum effects on the thermal conductivityprediction are also discussed. The relationship between theMOF-5 structure and its thermal behavior is explored, anda simplified structural model is proposed.
2. Classical interatomic potentials for MOF-5
To model the dynamics of MOF-5, the development ofpotentials for different interactions in MOF-5 is required.Previous MD studies have focused on the interaction ofgases with the structure, and modeled the crystal as beingrigid [8]. The main challenge in the construction of a poten-tial set is related to the oxygen atom in the carboxylatemoiety, which has a charge of �0.5. While potentials existfor Zn–O systems with formal charges [12], parameters arenot available for this reduced charge state. To construct thepotentials, we fit selected algebraic expressions to energysurfaces obtained from ab initio calculations.
The ab initio calculations are performed with Gaussian98 [13], which is a software package for electronic structurecalculation. First, to determine the appropriate method/basis set, the MOF-5 structure is relaxed using commoncombinations, e.g., RHF/6-311g (here RHF is the methodand 6-311g is the basis). The resulting structures are thencompared to the experimental data, as shown in Table 1.

Fig. 1. MOF-5 unit cell: 8[Zn4O(BDC)3]. This is the 1 � 1 � 1 system.The cage is built from four zinc–oxygen tetrahedra (ZnOcO3), which sharethe Oc atom (located at the center of the cage). The O–C1–O group formsa carboxylate moiety, to which a phenylene group is attached. Note thedistinction between the three carbon sites. The carboxylate moieties oneither side of a phenylene ring are perpendicular. Thus, eight cages and 12bridges are required to form the simple cubic unit cell, which has a latticeconstant of 25.85 A. The formal charges on the oxygen atoms at the centerof the cage (Oc), the carboxylate-oxygen atoms (O), and the zinc atoms are�2, �0.5, and +2. The other species are charge neutral.
B.L. Huang et al. / International Journal of Heat and Mass Transfer 50 (2007) 393–404 395
Based on a sum of squares error calculation (compared tothe experimental data), B3YLP/6-311g** is found to bemost suitable. The energy surface of MOF-5 is thenscanned using B3YLP/6-311g** by changing bond lengthsand angles. The classical potentials are fitted to this datausing the general utility lattice program (GULP) [14].
The set of interatomic potentials includes two-body(pair), three-body (angular), and four-body (torsional)terms, as presented in Table 2. The C2 and C3 atoms aretreated in the same way in the pair and angular potentials(denoted as C2/3). The C2/3–C2/3–C2/3 bending andC2/3–C2/3–C2/3–C2/3 torsion potentials are taken fromChelli et al. [15]. Other than electrostatics, no two-body
Table 1The structural parameters predicted by different ab initio methods/basis sets a
Method/basis Bond lengths (A)
Oc–Zn Zn–O O–C1 C1–C2 C2–H
RHF/sto-3g* 1.877 1.865 1.281 1.549 1.085RHF/6-311g** 1.992 1.962 1.241 1.504 1.080RHF/6-311+g** 1.996 1.981 1.242 1.506 1.080RHF/LANL2DZ 2.044 1.973 1.271 1.504 1.077B3YLP/6-311g** 1.972 1.953 1.262 1.510 1.088
B3YLP/6-311+g** 1.982 1.980 1.265 1.512 1.087B3YLP/LANL2DZ 2.037 1.988 1.295 1.514 1.091
Experiment 1.936 1.941 1.252 1.498 1.090
B3YLP/6-311g** gives the best agreement with the experimental data basedsummation is over the bond lengths and angles listed.
interactions are assumed for the non-bonded pairs of Oc–O, O–O, and Zn–Zn. These interactions are best capturedwith the three- and four-body potentials. The hydrogenatoms are not directly included in the model. The C3-Hgroup is taken to be a rigid entity (by adding the hydrogenmass to the carbon mass), a common treatment for hydro-gen atoms in MD [16].
The MOF-5 structure is then relaxed under the newpotentials with GULP. The resulting structural parametersare shown in Fig. 2, where they are compared with theexperimental data [17]. The average difference betweenthe predicated data and the experimental data are 2%.The MOF-177, IRMOF-11, and IRMOF-16 structureshave also been successfully relaxed in GULP using thesepotentials, indicating their transferability to other MOFs.
To further validate the potential, we compare the MDpredicted infrared (IR) spectrum and that from experimen-tal NIR-FT (Near InfraRed-Fourier Transform) measure-ments [17]. The range of the NIR-FT data are from75 Trad/s to 375 Trad/s (400 cm�1 � 2000 cm�1). The MDpredicted IR spectrum is obtained by taking the Fouriertransform of the electrical flux autocorrelation function [18]:
IðxÞ /Z 1
0
dMðtÞdt� dMð0Þ
dt
� �cosðxtÞdt; ð1Þ
where
dMðtÞdt
¼XN
i¼1
qiuiðtÞ: ð2Þ
Here, I(x) is the spectral density, x is angular frequency,M(t) is the summation of the individual dipole momentsof all the atoms in the system, t is time, N is the numberof atoms in the system, qi is the charge on the ith atom,and ui(t) is the velocity of ith atom. In Fig. 3, the two IRspectra are shown and the main band peaks are identified.There are much more details in the calculated spectrum.The match of the main peaks in the low frequency region(<200 Trad/s) is considered good. The deviation becomesnoticeable in the high frequency region (P200 Trad/s).The average deviation between the main band peaks
nd the experimental data [1]
Angles (�) S2 (10�3)
Oc–Zn–O Zn–O–C1 O–C1–C2 C2–C3–H
113.5 127.6 116.1 108.8 6.23109.5 133.6 117.2 108.8 1.53109.5 133.3 117.1 108.8 1.95108.9 135.3 119.4 109.1 4.81110.8 131.7 117.8 111.1 0.76
110.8 131.6 117.8 111.0 1.40110.0 133.6 118.8 110.5 4.92
111.1 132.3 118.1 109.5
on a sum of squares calculation. S2 ¼P9
i¼1½ðsi � sexpÞ=sexp�2, where the

Table 2The interatomic potentials for MOF-5
Interaction Potential model Parameters
Pair
Oc–Zn 1r qOcqZn þ A exp � r
r�
� �� Cr�6 A = 770.127 eV, ro = 0.357 A, C = 0.00088 eV A6
Oc–O 1r qOcqO
O–Zn 1r qOcqZn þ A expð� r
r�Þ � Cr�6 A = 529.7 eV, ro = 0.352 A, C = 0.0 eV A6
Zn–Zn 1r qZnqZn
O–O 1r qOqO
O–C1 uo{[1 � exp(�a(r � ro))]2 � 1} uo = 4.624 eV, a = 2.337 A�1, ro = 1.28 AC1–C2 uo{[1 � exp(�a(r � ro))]2 � 1} uo = 5.439 eV, a = 1.669 A�1, ro = 1.482 AC2/3–C2/3 uo{[1 � exp(�a(r � ro))]2 � 1} uo = 8.196 eV, a = 1.680 A�1, ro = 1.388 A
Angular
C2/3–C2/3–C2/3 12 khðcos h� cos h�Þ2 kh = 11.732 eV, ho = 120�
O–C1–O 12 khðcos h� cos h�Þ2 kh = 11.0 eV, ho = 120�
C1–C2–C3 12 khðcos h� cos h�Þ2 kh = 9.599 eV, ho = 120�
Zn–O–C1 12 khðcos h� cos h�Þ2 kh = 11.0 eV, ho = 132.3�
Torsional
C2/3–C2/3–C2/3–C2/3 k/[1 � cos(/ � /o)] k/ = 1.735 eV, /o = 0�O–C1–C2–C3 k/[1 � cos(/ � /o)] k/ = 1.587 eV, /o = 0�O–C1–O–Zn k/[1 � cos(/ � /o)] k/ = 1.732 eV, /o = 0�
r, h and / are distance, bond angle and torsion angle. The C2 and C3 atoms are treated in the same way in the pair and angular potentials (denoted asC2/3). The cutoff radius of electrostatic terms is 10 A. For all other terms, only bonded interactions are considered.
Fig. 2. The MOF-5 structure produced by optimization with GULP using the new potentials and the experimental data (in parentheses). The lengths arein (A) and the angles are in (�).
396 B.L. Huang et al. / International Journal of Heat and Mass Transfer 50 (2007) 393–404
predicted by MD and the associated experimental data are3.5%, which we take to be good agreement [19].
3. Simulation details
3.1. Logistics
All data used for the thermal conductivity predictionscome from simulations run in the NVE (constant mass,volume, and energy) ensemble. Unless noted, the simula-tion cell contains eight unit cells in a 2 � 2 � 2 arrange-ment (2624 atoms). Size effects will be discussed inSection 3.2. The Verlet leapfrog algorithm is used to inte-grate the equations of motion with a time step of 0.2 fs.
The Wolf method is applied to model the electrostaticinteractions according to [20]:
qiqj
rij’
qiqjerfcðbrijÞrij
� limrij!Rc
qiqjerfcðbrijÞrij
� �; ð3Þ
where rij, b, and Rc are the distance between atoms i and j,the damping parameter, and the cut-off radius. The Wolfmethod can significantly reduce the computation time com-pared to the traditional Ewald sum. Demontis et al. [21].suggest taking Rc P 5b and b ’ 2/Rc, where b correspondsto the largest of the nearest-neighbor distances betweenparticles of opposite charge. For MOF-5, b ’ 2 A (seeFig. 2). Thus, we choose Rc to be 10 A, and b to be0.2 A�1. To find the zero-pressure lattice constant as a

Fig. 3. The IR spectrum calculated from MD and the experimental (NIR-FT) results. The curves are normalized against the largest peak in eachdata set. The correspondence between peaks is established by comparingthe partial density of states of the species calculated from MD (see Fig. 8)to the results of experiments, [17] and by visual comparison of the twospectra. The 127/125 peak is related to vibrations of the Oc atom, the245/262 peak is associated with symmetric stretching of the carboxylatemoiety, the 284/279 peak results from vibrations of the phenylene ring,and the 306/297 peak is associated with asymmetric stretching of thecarboxylate moiety.
B.L. Huang et al. / International Journal of Heat and Mass Transfer 50 (2007) 393–404 397
function temperature, simulations are run in the NPT (con-stant mass, pressure, and temperature) ensemble, and anaverage was taken over 20 ps of data. The Nose–Hooverthermostat and the Berendsen barostat are used to controlthe system temperature and pressure [22].
3.2. Quantum effects
Below the Debye temperature, TD, phonon mode popu-lations in a quantum system are temperature dependent,but almost temperature independent in a classical system,such as MD [11]. By running the current simulations attemperatures above the Debye temperature, errors thatmay result from ignoring quantum effects when comparingto experimental data will be minimized.
The Debye temperature for a monatomic crystal isdefined as [23]
T D ¼�hP
kB
up;gð6p2nÞ1=3; ð4Þ
where �hP is the Planck constant divided by 2p, kB is theBoltzmann constant, up,g is the sound speed (an averagephonon group velocity) and n is the atomic number density(N/V). For polyatomic crystals, Slack [24] ignored the opti-cal branches and introduced a factor 1=N 1=3
c to Eq. (4) (Nc
is the number of atoms in the unit cell). For MOF-5, wherethe mass and bond differences are small among mostatoms, the correction to Eq. (4) is expected to be smaller.Using Eq. (4) as given will thus somewhat overestimatethe Debye temperature and provide a safe estimate of thetemperatures for which the simulations will be comparableto experimental data.
To find the Debye temperature, a sound speed isrequired, which can be obtained from MD simulations
using the following procedure. In the NVE ensemble, theadiabatic compressibility, js, is given by [25]
js ¼2
3P þ nkBT þ
Xi;j
o2uoriorj
* +� N
nkBThðdPÞ2i
" #�1
; ð5Þ
where P is the pressure, u is the total potential energy, anddP is the root-mean-square pressure fluctuation, i.e.,h(dP)2i = h(P � hPi)2 i. At a temperature of 300 K, the adi-abatic compressibility is found to be 7.09 � 10�10 Pa�1.With the adiabatic compressibility, the longitudinal soundvelocity up,g,L and transverse sound velocity up,g,T can bedetermined from [26,27]
up;g;L ¼3ð1� 2mÞ
jsq
� 1=2
ð6Þ
up;g;T ¼3ð1� 2mÞ
2ð1þ mÞjsq
� 1=2
; ð7Þ
where q is density and m is the Poisson ratio. For most sol-ids, m ’ 0.3. An average sound speed, up,A, can be given by3u�1
p;A ¼ u�1p;g;L þ 2u�1
p;g;T, which yields up,A = 1184 m/s forMOF-5 at a temperature of 300 K, a reasonable value.Using Eq. (4) (replacing up,g with up,A), we have TD ’102 K. We will consider temperatures between 200 K and400 K (at 50 K intervals), well above the estimated TD.
3.3. Thermal conductivity prediction
The thermal conductivity, k, is predicted using theGreen–Kubo (GK) method, where, for an isotropic mate-rial, it is given by [28]
k ¼ 1
kBVT 2
Z 1
0
h _wðtÞ � _wð0Þi3
; ð8Þ
where _wðtÞ is the heat current vector, and h _wðtÞ � _wð0Þi isthe heat current autocorrelation function (HCACF). Aslow-decaying HCACF indicates that the heat current fluc-tuations can spread over a long time before vanishing (i.e.,a long phonon relaxation time). The heat current is givenby
_w ¼ d
dt
XN
i¼1
riEi; ð9Þ
where ri and Ei are the position vector and the total energyof particle i. The GK method has been used to investigatethe thermal properties of dielectric materials such as dia-mond [29], silicon [30,31], zeolites [32], and amorphous sil-icon [33]. This approach is based on fluctuation-dissipationtheory and is an equilibrium method. As we believe MOF-5to be a good dielectric, the electronic component of thethermal conductivity is taken as negligible.
Thermal conductivity can also be predicted in MD usingthe direct method, which closely resembles an experimentaltechnique based on an application of the Fourier law [30].The direct method is a steady-state, non-equilibriummethod in which a steady 1-D heat flux is imposed on a

Table 3Variation of the predicted thermal conductivity of MOF-5 with respect tothe simulation system size (number of cells and total number of atoms)and temperature
T (K) Simulation system size
1 � 1 � 1(328 atoms)
2 � 2 � 2(2624 atoms)
3 � 3 � 3(8856 atoms)
k (W/m K)200 0.187 ± 0.025 (3) 0.287 ± 0.041 (3)250 0.197 ± 0.013 (3) 0.293 ± 0.027 (3)300 0.195 ± 0.007 (3) 0.308 ± 0.024 (4) 0.288 ± 0.044 (1)350 0.205 ± 0.008 (3) 0.316 ± 0.016 (3) 0.291 ± 0.052 (1)400 0.196 ± 0.008 (3) 0.317 ± 0.018 (3)
The number in the parentheses is the number of simulation runs andaveraged to get the reported value and the uncertainty. The uncertanityfor the 3 � 3 � 3 system are estimated from the fluctuation of the HCACFin the converged region of the integral.
398 B.L. Huang et al. / International Journal of Heat and Mass Transfer 50 (2007) 393–404
system. From the resulting temperature gradient, the ther-mal conductivity is directly obtained using the Fourier law.The direct method normally has strong non-linear responsebehavior and significant size effects. Large atomic systemare typically required to obtain an accurate prediction ofthe bulk phase thermal conductivity (it is better suited, infact, to the study of thin films) [30]. For a complex crystalwith a large unit cell (such as MOF-5), the computationaldemands would be tremendous. The linear response behav-ior of the GK method leads to accurate results using smal-ler atomic system than required in the direct method [30].The GK method is also advantageous as it allows for thedecomposition of the thermal conductivity into contribu-tions associated with acoustic and optical phonons [32].
At the beginning of a simulation for a thermal conduc-tivity prediction, the system is run in the NVT ensemble toset the temperature. After 20 ps, when the system hasreached equilibrium, the simulation is switched to run inthe NVE ensemble, and the HCACF is obtained over200 ps. At each temperature, three runs are performedunless noted. The thermal conductivity is then obtainedfrom the integral of the HCACF [32]. A running averageis applied to the integral to obtain a smooth behavior,
<w
(t).
w(0
)>/<
w(0
).w
(0)>
..
..
0 2 4 6 8 10
1.00
0.50
0.00
-0.50
-1.00
t (ps)
MOF-5T = 300 K
Raw data
Raw data Running Average
ConvergenceRegion
MOF-5T = 300 K
t (ps)
k (W
/m-K
)
0 2 4 6 8 100
0.5
1.0
1.5
2.0b
Fig. 4. (a) Decay of the normalized HCACF for MOF-5 and (b) itsintegral (the thermal conductivity) at a temperature of 300 K.
allowing a convergence region to be defined. The decayof the normalized HCACF at a temperature of 300 K isshown in Fig. 4a, and its integral, the thermal conductivity,is shown in Fig. 4b. The HCACF vanishes after 6 ps. TheMOF-5 HCACF has high frequency oscillations, believedto be related to optical phonons [32].
3.4. Simulation-size effects
In a small simulation cell, there may not be enough pho-non modes to establish scattering and transport representa-tive of the associated bulk system [34]. Such size effects willlead to a thermal conductivity different from the infinitesize (bulk) limit [29,30]. The MD predicted thermal con-ductivities of MOF-5 are shown in Table 3, for simulationsystems containing 1 � 1 � 1, 2 � 2 � 2 and 3 � 3 � 3 unitcells (328, 2624, and 8856 atoms). The thermal conductivityof the 1 � 1 � 1 system is lower than that of the larger sys-tems. The predictions for the 2 � 2 � 2 system are veryclose to those for the 3 � 3 � 3 system at temperatures of300 K and 350 K, indicating that the 2 � 2 � 2 system willsuffice to give a converged value.
4. Numerical results and analysis
4.1. Thermal conductivity and temperature dependence
The 2 � 2 � 2 data from Table 3 are plotted in Fig. 5.Also included in the plot are the thermal conductivity mod-els of Slack [24] and Cahill and Pohl [35].
Slack proposed that the thermal conductivity of crystalsat temperatures above that of the experimental peak valuecan be approximated by the relation [36,24]
kS ¼3:0� 104hMiT 3
D
Tn1=3c2GN 2=3
c
; ð10Þ
where hMi is the mean atomic weight of the atoms in the unitcell (kg/kmol) and cG is the mode-averaged Gruneisen con-stant. This relation indicates that the thermal conductivity
Slack Relation
Mp (2×2×2 System)
80
TD = 102 K
Cahill-Pohl Relation
200 250 300 350 400 450
T (K)
150
k, (
W/m
-K)
0
0.1
0.2
0.3
0.4
0.5
0.6
0.7
0.308 0.3160.293
0.3170.287
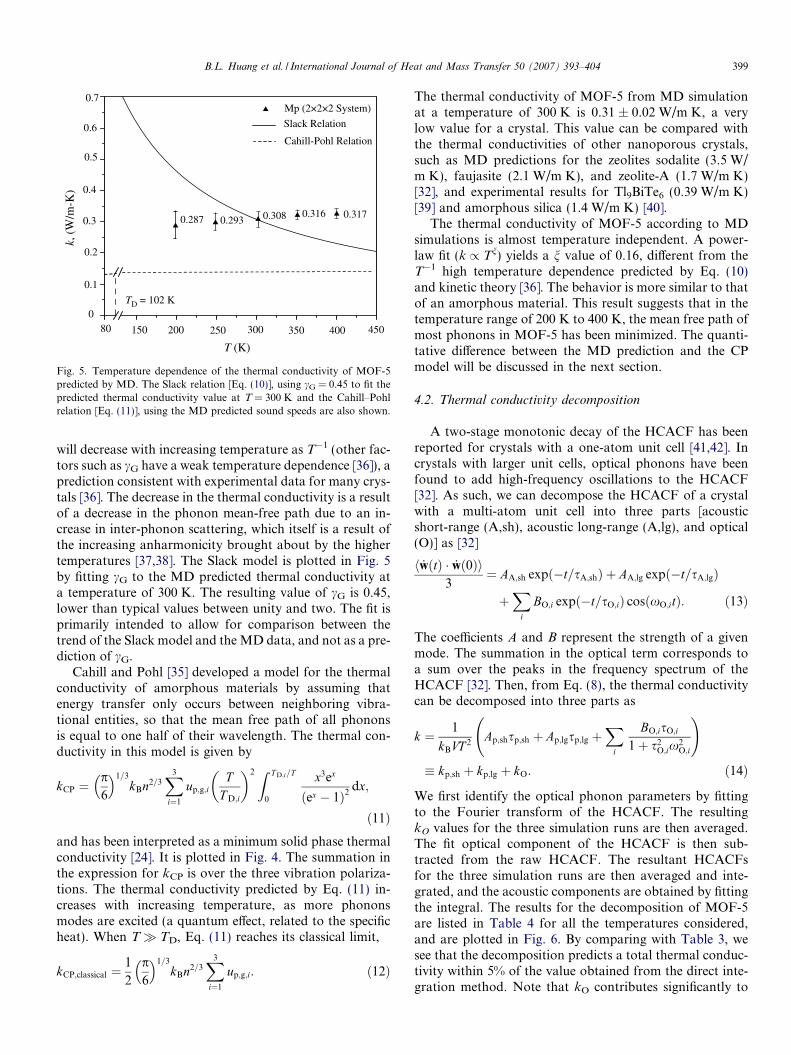
Fig. 5. Temperature dependence of the thermal conductivity of MOF-5predicted by MD. The Slack relation [Eq. (10)], using cG = 0.45 to fit thepredicted thermal conductivity value at T = 300 K and the Cahill–Pohlrelation [Eq. (11)], using the MD predicted sound speeds are also shown.
B.L. Huang et al. / International Journal of Heat and Mass Transfer 50 (2007) 393–404 399
will decrease with increasing temperature as T�1 (other fac-tors such as cG have a weak temperature dependence [36]), aprediction consistent with experimental data for many crys-tals [36]. The decrease in the thermal conductivity is a resultof a decrease in the phonon mean-free path due to an in-crease in inter-phonon scattering, which itself is a result ofthe increasing anharmonicity brought about by the highertemperatures [37,38]. The Slack model is plotted in Fig. 5by fitting cG to the MD predicted thermal conductivity ata temperature of 300 K. The resulting value of cG is 0.45,lower than typical values between unity and two. The fit isprimarily intended to allow for comparison between thetrend of the Slack model and the MD data, and not as a pre-diction of cG.
Cahill and Pohl [35] developed a model for the thermalconductivity of amorphous materials by assuming thatenergy transfer only occurs between neighboring vibra-tional entities, so that the mean free path of all phononsis equal to one half of their wavelength. The thermal con-ductivity in this model is given by
kCP ¼p6
� �1=3
kBn2=3X3
i¼1
up;g;iT
T D;i
�2 Z T D;i=T
0
x3ex
ðex � 1Þ2dx;
ð11Þand has been interpreted as a minimum solid phase thermalconductivity [24]. It is plotted in Fig. 4. The summation inthe expression for kCP is over the three vibration polariza-tions. The thermal conductivity predicted by Eq. (11) in-creases with increasing temperature, as more phononsmodes are excited (a quantum effect, related to the specificheat). When T� TD, Eq. (11) reaches its classical limit,
kCP;classical ¼1
2
p6
� �1=3
kBn2=3X3
i¼1
up;g;i: ð12Þ
The thermal conductivity of MOF-5 from MD simulationat a temperature of 300 K is 0.31 ± 0.02 W/m K, a verylow value for a crystal. This value can be compared withthe thermal conductivities of other nanoporous crystals,such as MD predictions for the zeolites sodalite (3.5 W/m K), faujasite (2.1 W/m K), and zeolite-A (1.7 W/m K)[32], and experimental results for Tl9BiTe6 (0.39 W/m K)[39] and amorphous silica (1.4 W/m K) [40].
The thermal conductivity of MOF-5 according to MDsimulations is almost temperature independent. A power-law fit (k / Tn) yields a n value of 0.16, different from theT�1 high temperature dependence predicted by Eq. (10)and kinetic theory [36]. The behavior is more similar to thatof an amorphous material. This result suggests that in thetemperature range of 200 K to 400 K, the mean free path ofmost phonons in MOF-5 has been minimized. The quanti-tative difference between the MD prediction and the CPmodel will be discussed in the next section.
4.2. Thermal conductivity decomposition
A two-stage monotonic decay of the HCACF has beenreported for crystals with a one-atom unit cell [41,42]. Incrystals with larger unit cells, optical phonons have beenfound to add high-frequency oscillations to the HCACF[32]. As such, we can decompose the HCACF of a crystalwith a multi-atom unit cell into three parts [acousticshort-range (A,sh), acoustic long-range (A,lg), and optical(O)] as [32]
h _wðtÞ � _wð0Þi3
¼ AA;sh expð�t=sA;shÞ þ AA;lg expð�t=sA;lgÞ
þX
i
BO;i expð�t=sO;iÞ cosðxO;itÞ: ð13Þ
The coefficients A and B represent the strength of a givenmode. The summation in the optical term corresponds toa sum over the peaks in the frequency spectrum of theHCACF [32]. Then, from Eq. (8), the thermal conductivitycan be decomposed into three parts as
k ¼ 1
kBVT 2Ap;shsp;sh þ Ap;lgsp;lg þ
Xi
BO;isO;i
1þ s2O;ix
2O;i
!
kp;sh þ kp;lg þ kO: ð14Þ
We first identify the optical phonon parameters by fittingto the Fourier transform of the HCACF. The resultingkO values for the three simulation runs are then averaged.The fit optical component of the HCACF is then sub-tracted from the raw HCACF. The resultant HCACFsfor the three simulation runs are then averaged and inte-grated, and the acoustic components are obtained by fittingthe integral. The results for the decomposition of MOF-5are listed in Table 4 for all the temperatures considered,and are plotted in Fig. 6. By comparing with Table 3, wesee that the decomposition predicts a total thermal conduc-tivity within 5% of the value obtained from the direct inte-gration method. Note that kO contributes significantly to

Table 4Thermal conductivity decomposition for MOF-5 and the temperaturedependence of the components
T (K) k
(W/m K)kA,lg
(W/m K)kA,sh
(W/m K)kO
(W/m K)
200 0.298 0.051 0.141 0.106250 0.306 0.042 0.151 0.113300 0.305 0.029 0.160 0.116350 0.314 0.025 0.161 0.128400 0.318 0.021 0.142 0.155
niðki / T ni Þ 0.09 �1.30 0.06 0.54
Fig. 6. Variation of the thermal conductivity components of MOF-5 withrespect to temperature and the Cahill–Pohl relation [Eq. (11)]. The Cahill–Pohl relation uses the temperature-independent sound speeds obtained inSection 3.2.
400 B.L. Huang et al. / International Journal of Heat and Mass Transfer 50 (2007) 393–404
the thermal conductivity. This contribution is often ignoredin modelling efforts due to the flatness of the associatedphonon dispersion branches [9,10,37]. Such an assumptionis justified for materials with a large thermal conductivity[32]. For a crystal with a low thermal conductivity, suchas MOF-5, the optical phonon contribution cannot be ig-nored. A similar result was found for silica structures [32].
The components of the thermal conductivity have differ-ent temperature dependencies: kA,sh is almost temperatureindependent (n = 0.06), and is close to kCP at all tempera-tures (as was found for a series of silica structures [32]);kO increases when the temperature increases (n = 0.54),and kA,lg decreases noticeably with increasing temperature(n = �1.30). Note that only kA,lg varies with temperatureapproximately as T�1. For MOF-5, a crystal with a lowthermal conductivity, the relative contribution of thelong-range acoustic phonons is small and the temperaturedependence of the total thermal conductivity is thus weak.Only for those crystals in which long-range correlationsdominate the heat transfer (e.g., diamond, NaCl) will thetotal thermal conductivity vary as T�1.
To develop a theoretical description of the acoustic por-tion of Eq. (14) (kA kA,sh + kA,lg), we begin from the
kinetic theory for thermal conductivity and write the ther-mal conductivity as summation of the contributions fromall phonon modes [38]
k ¼ 1
3cvup;gkp ¼
Xj
1
3cv;jup;g;jkp;j
¼Xj;A
1
3cv;jup;g;jkp;j þ
Xj;O
1
3cv;jup;g;jkp;j ¼ kA þ kO; ð15Þ
where cv is the volumetric specific heat, kp is the phononmean free path, and cv,j, up,g,j, and kp,j are the mode spe-cific heat capacity, group velocity, and mean free path,respectively. Under the Debye approximation, the contri-bution of the acoustic phonons modes, kA, can be writtenas [10]
kA ¼ kBnX3
i¼1
up;g;iT
T D;i
�3 Z T D;i=T
0
x4ex
ðex � 1Þ2kp;iðxÞdx; ð16Þ
where the summation is over the three polarizationbranches, x is �hx/kBT and TD,i is �hxD,i/kB (xD,i is theDebye frequency for the ith branch). In general, the meanfree path is limited by boundary scattering, impurity scat-tering, and interphonon scattering [10,37]. At high temper-atures, interphonon scattering dominates. In the MDsimulations performed here, only interphonon scatteringis present. To be physically meaningful, the mean free pathof a phonon mode should be longer than one half of itswavelength [35]. Starting from this idea, we construct atwo-segment mean free path model. When the phonon fre-quency is below a critical frequency, xc, its mean free pathwill vary according to the relaxation time model of Rouf-osse for moderate and high temperatures (above TD)[37,43]. When the phonon frequency is above the criticalfrequency, its mean free path is set to one half of its wave-length. Thus, we get
kp;iðxÞ ¼up;g;i
Aið1þ Bix2Þx2T; x < xc;i;
¼ pup;g;i
x; xc;i 6 x 6 xD;i;
Ai ¼3� 103NApac2
GkB
21=2hMiu3p;g;i
; Bi ¼4p3
�2=35a2
12p2u2p;g;i
; ð17Þ
where a is the mean interatomic distance (a = n�1/3) andNA is the Avogadro number. To ensure a continuouskp,i(x), xc must satisfy
xc;iAið1þ Bix2c;iÞ ¼
1
pT: ð18Þ
For Bi p2A2i T 2, we have
xc;i ’1
AipT: ð19Þ
For MOF-5 at a temperature of 300 K and usingup,A = 1184 m/s as calculated from Eqs. (6) and (7), B is9.2 � 10�27 s2, and p2A2T2 is 2.1 � 10�25 s2, so that theuse of Eq. (19) is justified. At this temperature, xc is

B.L. Huang et al. / International Journal of Heat and Mass Transfer 50 (2007) 393–404 401
2.2 Trad/s, much less than the Debye frequency(xD = 13.4 Trad/s), indicating that most acoustic phononshave the minimum mean free path.
The critical frequency xc decreases with temperature(for MOF-5, xc at temperatures of 200 K, 250 K, 300 K,350 K, and 400 K is 3.3 Trad/s, 2.6 Trad/s, 2.2 Trad/s,1.9 Trad/s, and 1.7 Trad/s). That is, as the temperatureincreases, an increasing number of phonon modes reachthe limiting mean free path of one half of their wavelength.Using Eq. (17), Eq. (16) can be rewritten as
kA ¼X3
i¼1
kB
2p2up;g;iAiT
Z xc;i
0
4p3
�2=35x2a2
12p2u2p;g;iþ 1
" #�1
dx
þ p6
� �1=3
n2=3X3
i¼1
up;g;i�h4
T 2D;ik
3BT 2
Z kBT D;i=�h
xc;i
x3e�hx
kBT
ðe�hx
kBT � 1Þ2dx:
ð20Þ
Based on the construction of this model, and our knowl-edge of the GK thermal conductivity decomposition, weassociate the first term in Eq. (20) with kA,lg and the secondterm with kA,sh. In considering Eq. (20), even if the temper-ature dependencies of the material properties and phonondispersion are ignored, kA,lg still departs from T�1 behavior
(Tn with n < � 1). This is because xc decreases with tem-perature. At the same time, kA,sh increases slightly withtemperature and eventually saturates. The lower xc, thelarger the fraction of kA,sh in kA. Eq. (20) also predicts thatthe temperature dependence of kA will become progres-sively weaker as temperature increases.
In Fig. 7, the temperature dependencies of kA,lg andkA,sh predicted by the two-stage model are shown along
Fig. 7. The variation of kA,lg and kA,sh with respect to temperaturepredicted by the two-stage model and from the MD decomposition. Thelongitudinal and transverse sound speeds are taken to be 1672 m/s and1033 m/s (see Section 3.2), and cG is set as 1.01 to fit kA,lg at a temperatureof 300 K.
with the MD decomposition data. The kA,lg component isfit to the decomposition data at 300 K by setting cG equalto 1.0. As with the fit to the Slack model in Fig. 5, the pur-pose of the fit is to compare the general trends, and not tospecify cG. The agreement between the trends in the modeland the MD data are good. Note that the thermal conduc-tivity predicted by Eq. (20) goes to infinity as the tempera-ture goes to zero, typical of a crystal in an MD simulation,where there are no quantum effects. A simulation of MOF-5 at a temperature of 50 K (lower than TD) gives a thermalconductivity of 2.8 W/m K, consistent with this trend.While this numerical value cannot be compared with theexperiments due to the exclusion of quantum effects (pho-non excitation), it does indicate that MOF-5 behaves likea crystal in the simulations (the thermal conductivity ofamorphous materials in MD decreases as the temperaturedecreases, consistent with experimental data [33,44,32]).
By setting xc equal to xD, up,g,i to the mean phonon
speed up,g, and using xD = up,g(6p2n/Nc)1/3, we have, from
Eq. (20),
k ¼ kA;lg ¼4:48� 103hMiT 3
D
Tn1=3c2GN 2=3
c
; ð21Þ
which is similar to the Slack relation (Eq. (10)), except forthe constant. The difference in the constants is due to thesingle-mode relaxation time approximation and a differentHamiltonian used by Roufosse for three-phonon interac-tions [37]. If xc is equal to zero, only kA,sh contributes tokA, and as expected, Eq. (20) reduces to Eq. (11). ForT/TD,i� 1, xc vanishes, and kA will reach the classical lim-it of kCP, Eq. (12).
Since kA,sh and kO are small and their temperaturedependencies are not strong (their sum has been interpretedas a thermal conductivity limit in crystals [32]), we mayobtain a crystal with a low thermal conductivity and aweak temperature dependence by reducing xc. This canbe accomplished by reducing the sound speed and increas-ing the mean interatomic distance.
4.3. Examination of vibrations
The thermal conductivity of a dielectric material isrelated to the lattice vibrations (i.e., phonon transport).To further investigate the low thermal conductivity ofMOF-5, we will calculate the partial density of states(PDOS) of the distinct atomic positions in the unit cell.The PDOS of the bth species, Dp,b, is determined by takingthe Fourier transform of the velocity auto-correlation func-tion, and weighting the result with the species concentra-tion cb [45]:
Dp;bðxÞ ¼ cb
Z s
0
CbðtÞ cosðxtÞdt; ð22Þ
where
CbðtÞ ¼XNb
i
huibðtÞ � uibð0Þi=XNb
i
huibð0Þ � uibð0Þi: ð23Þ

402 B.L. Huang et al. / International Journal of Heat and Mass Transfer 50 (2007) 393–404
The total phonon DOS is obtained by summing over thepartial DOS:
DpðxÞ ¼X
b
Dp;bðxÞ: ð24Þ
The PDOS indicates the vibrational modes that specificatoms are involved with in the overall crystal latticedynamics. In a classical system, such as an MD simulation,and in real systems well above the Debye temperature, alldegrees of freedom have approximately the same expecta-tion value for their energy. Thus, one can interpret the areaunder the PDOS curves as an indication of how the systemenergy is distributed among the atoms.
In Fig. 8a, two cages and one bridge of the MOF-5structure are shown, and the arrows are used to illustratethe transport of vibrations from the atom C1. In Figs. 8band 8c, the PDOS of the Oc, Zn, O, C1, C2, and C3 atomsare plotted. The C1 and C2 atoms have the same PDOS.Motivated by the decomposition of the thermal conductiv-ity, we can examine the vibrations in both the low- andhigh-frequency regimes.
In the acoustic phonon modes, which end around 14Trad/s (2.3 THz), the center oxygen atom (Oc) essentiallydoesn’t participate. If one thinks of the heat transfer asenergy moving from atom to atom, in the cage structureit will need to take a circuitous route around the Oc atom.
C1
C1
OC1
C2
OZn O
Zn O
Oc
C3
a
Oc
ZnO
C1/C2
C3
0 4 8 12 16 20
(Trad/s)ω
Part
ial D
ensi
ty o
f St
ates
(ar
bitr
ary
units
)
b
0.0
1.2
0.9
0.6
0.3
Fig. 8. (a) Section of the MOF-5 structure. (b) and (c) PDOS of Oc, Zn, O, Catoms is different than the others in (c).
There is also more activity in the C3 (which are a part ofthe phenylene ring) and O1 (which are a part of the cage)atoms than the C1/C2 atoms. The C1/C2 atoms act as abottleneck. We interpret this result as a sign of energylocalization. The phenylene ring can pivot about the axisdefined by the C1–C2 bond, and yet these motions are dif-ficult to pass onto the cage and vice versa. Energy movesback and forth across the bridge, or inside the cage, as itis reflected at the connection between them. In this way,the development of long-range correlations is suppressed.A similar trend is observed in the optical phonon spectrumof the C3 atoms. There is also scant overlap between thePDOS of the Zn and O atoms at the higher frequencies(most likely brought about by their mass difference), iden-tifying another point in the structure where transmittingenergy will be difficult. The overall picture is thus one ofcages and bridges between which energy flow is restricted.This is a finding similar to that for zeolites [32], whereenergy localization on specific Si–O–Si structures wasidentified.
5. Summary
We have developed a set of optimized classical inter-atomic potentials for MOFs and used them to predict thethermal conductivity of MOF-5 between temperatures of
C1/C2
0 400100 200 300
Part
ial D
ensi
ty o
f St
ates
(ar
bitr
ary
units
)
(Trad/s)
0.0
0.3
0.6
O
0.0
0.3
0.6
Zn
0.0
0.3
0.6
ω
0.0
0.3
0.6Oc
cC3
0.0
2.0
4.0
6.0
1, C2, and C3 atoms in the simulation cell. Note that the scale for the C3
B.L. Huang et al. / International Journal of Heat and Mass Transfer 50 (2007) 393–404 403
200 K and 400 K using MD simulations and the GKmethod. The thermal conductivity of MOF-5 is low(0.31 W/m K at a temperature of 300 K) and shows a weaktemperature dependence, very different from the k / T�1
behavior exhibited by many crystals at high temperature,but similar to the behavior of amorphous phases.
The thermal conductivity of MOF-5 can be decomposedinto three parts: the acoustic short-range, acoustic long-range and optical contributions, as shown in Table 4 andFig. 6. The decomposition indicates that the short-rangeacoustic phonons and the optical phonons dominate theenergy transport. The long-range acoustic phonons con-tribute little to the total thermal conductivity, resulting inan amorphous-like behavior at high temperatures. Webelieve this to be a common characteristic for nanoporouscrystals with a low thermal conductivity.
We developed Eq. (20), which is based on a two-stagemean free path, to explain the acoustic portion of thedecomposition. The short-range contribution (kA,sh) isfound to be related to phonons that have mean free pathsequal to one half of their wavelengths, and the long-rangecontribution (kA,lg) to phonons with longer mean freepaths. A critical frequency (xc) has been defined, whichindicates the relative contributions of the short and long-range acoustic phonons. When xc is small the short-rangecomponent dominates the thermal transport, and theacoustic contribution to the thermal conductivity reachesthe CP limit. When xc is large, the long-range phononsdominate, and the total thermal conductivity variesapproximately as T�1.
To summarize, we can explain the low thermal conduc-tivity of MOF-5 using the simple kinetic relation k =cvup,gkp/3 (Eq. (15)). The open structure of MOF-5 results
in a low atomic number density and leads to a low cv, andthe long, flexible bridge and the heavy cage cluster result ina low phonon group velocity. The cage-bridge structuresuppresses the development of long range correlationsand reduces the phonon mean free path. While the resultspresented are specific to MOF-5, the general findings areapplicable to other MOFs. With MD as a tool, and theMOF family of materials to work with, the design ofnew, highly insulating materials appears to be a realisticgoal.
Acknowledgements
This work has been supported by the US Department ofEnergy, Office of Basic Energy Sciences under grant DE-FG02-00ER45851. Assistance from Professor Yaghi’sgroup (Chemistry, University of Michigan) on MOF-5structural data are appreciated.
References
[1] H. Lir, M. Eddaoudi, M. O’Keeffe, O.M. Yaghi, Design and synthesisof an exceptionally stable and highly porous metal-organic frame-work, Nature 402 (1999) 276.
[2] M. Eddaoudi, J. Kim, N. Rosi, D. Vodak, J. Wachter, M. O’Keeffe,O.M. Yaghi, Systematic design of pore size and functionality inisoreticular mofs and their application in methane storage, Science295 (2002) 469.
[3] O.M. Yaghi, M. O’Keeffe, N.W. Ockwig, H.K. Chae, M. Eddaoudi,J. Kim, Reticular synthesis and the design of new materials, Nature423 (2003) 705.
[4] J.L.C. Rowsell, O.M. Yaghi, Metal-organic frameworks: a new classof porous materials, Micropor. Mesopo. Mater. 73 (2004) 3.
[5] N.L. Rosi, J. Eckert, M. Eddaoudi, D.T. Vodak, J. Kim, M.O’Keeffe, O.M. Yaghi, Hydrogen storage in microporous metal-organic frameworks, Science 300 (2003) 1127.
[6] J.L.C. Rowsell, A.R. Millward, K.S. Park, O.M. Yaghi, Hydrogensorption in functionalized metal-organic frameworks, J. Am. Chem.Soc. 126 (2004) 5666.
[7] J.L.C. Rowsell, E.C. Spencer, J. Eckert, J.A.K. Howard, O.M. Yaghi,Gas adsorption sites in a large-pore metal-organic framework,Science 309 (2005) 1350.
[8] A.I. Skoulidas, D.S. Sholl, Self-diffusion and transport diffusion oflight gases in metal-organic framework materials assessed usingmolecular dynamics simulations, J. Phys. Chem. B 109 (2005) 15760.
[9] J. Callaway, Model for lattice thermal conductivity at low temper-atures, Phys. Rev. 113 (1959) 1046–1051.
[10] M.G. Holland, Analysis of lattice thermal conductivity, Phys. Rev.132 (1963) 2461.
[11] A.J.H. McGaughey, M. Kaviany, Quantitative validation of theboltzmann transport equation phonon thermal conductivity modelunder the single-mode relaxation time approximation, Phys. Rev. B69 (2004) 094303.
[12] R.W. Grimes, D.J. Binks, A.B. Lidiard, The extent of zinc-oxidesolution in zinc chromate spinel, Philos. Mag. A 72 (1995) 650–668.
[13] M.J. Frisch et al., Gaussian 98 (Revision A.11), Gaussian, Inc,Pittsburgh PA, 2001.
[14] J.D. Gale, A.L. Rohl, The general utility lattice program (gulp), Mol.Simulat. 29 (2003) 291–341.
[15] R. Chelli, G. Cardini, P. Procacci, R. Righini, S. Califano, A.Albrecht, Simulated structure, dynamics, and vibrational spectra ofliquid benzene, J. Chem. Phys. 113 (2000) 6851.
[16] A.R. Leach, Molecular Modelling Principles and Applications,Addison Wesley Longman Ltd., Reading, MA, 1996.
[17] Z. Ni, Chemistry Department, University of Michigan, personalcommunication.
[18] B. Boulard, J. Kieffer, C.C. Phifer, C.A. Angell, Vibrational-spectrain fluoride-crystals and glasses at normal and high-pressures bycomputer-simulation, J. Non-Cryst. Solids 140 (1992) 350.
[19] J. Sauer, J. Dobler, Gas-phase infrared spectrum of the protonatedwater dimer: Molecular dynamics simulation and accuracy of thepotential energy surface, ChemPhysChem 6 (2005) 1706–1710.
[20] D. Wolf, P. Keblinski, S.R. Phillpot, J. Eggebrecht, Exact method forthe simulation of coulombic systems by spherically truncated,pairwise r(-1) summation, J. Chem. Phys. 110 (1999) 8254.
[21] P. Demontis, S. Spanu, G.B. Suffritti, Application of the wolf methodfor the evaluation of coulombic interactions to complex condensedmatter systems: aluminosilicates and water, J. Chem. Phys. 114 (2001)7980–7988.
[22] D. Frenkel, B. Smit, Understanding Molecular Simulation: FromAlgorithms to Applications, Academic Press, San Diego, 1996.
[23] C. Kittel, Introduction to Solid State Phys., Wiley Inc, New York,1996.
[24] G.A. Slack, Solid State Phys. 34 (1979).[25] J.M. Haile, Molecular Dynamics Simulation Elementary Methods,
Wiley Inc, New York, 1992.[26] M.T. Dove, Introduction to Lattice Dynamics, Cambridge University
Press, Cambridge, 1993.[27] A.D. Nashif, D.I.G. Jones, J.P. Henderson, Vibration Damping,
Wiley, New York, 1985.[28] D.A. McQuarrie, Statistical Mechanics, University Science Books,
Sausalito, 2000.

404 B.L. Huang et al. / International Journal of Heat and Mass Transfer 50 (2007) 393–404
[29] J. Che, T. Cagin, W. Deng, W.A. Goddard, Thermal conductivity ofdiamond and related materials from molecular dynamics simulations,J. Chem. Phys. 113 (2000) 68888.
[30] P.K. Schelling, S.R. Phillpot, P. Keblinski, Comparison of atomic-level simulation methods for computing thermal conductivity, Phys.Rev. B 65 (2002) 144306.
[31] S.G. Volz, G. Chen, Molecular-dynamics simulation of thermalconductivity of silicon crystals, Phys. Rev. B 61 (2000) 2651.
[32] A.J.H. McGaughey, M. Kaviany, Thermal conductivity decomposi-tion and analysis using molecular dynamics simulations – part ii.complex silica structures, Int. J. Heat Mass Transfer 47 (2004) 1799.
[33] Y.H. Lee, R. Biswas, C.M. Soukoulis, C.Z. Wang, C.T. Chan, K.M.Ho, Molecular-dynamics simulation of thermal-conductivity inamorphous-silicon, Phys. Rev. B 43 (1991) 6573.
[34] A.J.H. McGaughey, M. Kaviany, Observation and description ofphonon interactions in molecular dynamics simulations, Phys. Rev. B71 (2005) 184305.
[35] D.G. Cahill, S.K. Watson, R.O. Pohl, Lower limit to the thermal-conductivity of disordered crystals, Phys. Rev. B 46 (1992) 6131.
[36] R. Berman, Thermal Conduction in Solids, Clarendon Press, Oxford,1976.
[37] M. Roufosse, P.G. Klemens, Thermal-conductivity of complexdielectric crystals, Phys. Rev. B 7 (1973) 5379.
[38] G.P. Srivastava, The Physics of Phonons, Adam Hilger, New York,1990.
[39] B. Wolfing, C. Kloc, J. Teubner, E. Bucher, High performancethermoelectric tl9bite6 with an extremely low thermal conductivity,Phys. Rev. Lett. 86 (2001) 19.
[40] Y. Touloukian, Thermalphysical Properties of Matter, Plenum, NewYork, 1970.
[41] A.J.H. McGaughey, M. Kaviany, Thermal conductivity decomposi-tion and analysis using molecular dynamics simulations. part i.lennard-jones argon, Int. J. Heat Mass Transfer 47 (2004) 1783–1798.
[42] J. Li, L. Porter, S. Yip, Atomistic modeling of finite-temperatureproperties of crystalline beta-sic – ii. Thermal conductivity and effectsof point defects, J. Nucl. Mater. 255 (1998) 139–152.
[43] V.A. Konstantinov, Manifestation of the lower limit to thermal conduc-tivity in the solidified inert gases, J. Low Temp. Phys. 122 (2001) 459.
[44] P. Jund, R. Jullien, Molecular-dynamics calculation of the thermalconductivity of vitreous silica, Phys. Rev. B 59 (1999) 13707.
[45] C.-K. Loong, Phonon density of states and oxygen-isotope effect inba1-xkxbio3, Phys. Rev. B 45 (1992) 8052.


![MOF-5 impurities FINAL · MOF-5 remains an attractive hydrogen storage material due to its balanced gravimetric and volumetric hydrogen uptake [30]. As a zinc-based MOF with a carboxylate](https://static.fdocuments.us/doc/165x107/604c16ef32bbfa546e0cae36/mof-5-impurities-final-mof-5-remains-an-attractive-hydrogen-storage-material-due.jpg)


