Theory and Practice of Sampling - Esic...
67
Marketing Research Verónica Rosendo Ríos © Chapter 10 Theory and Practice of Sampling Business Research Methods Verónica Rosendo Ríos Enrique Pérez del Campo
Transcript of Theory and Practice of Sampling - Esic...

Marketing Research
Ver
ónic
a R
osen
do R
íos
©
Chapter 10
Theory and Practice of Sampling
Business Research Methods
Verónica Rosendo Ríos
Enrique Pérez del Campo
Marketing Research
Ver
ónic
a R
osen
do R
íos
©
1-2
“A straw vote only shows which way the hot air blows”
O. HENRY William Sydney Porter (1862 – 1910), known by his pen name O. Henry, was an American writer.”
“Make everything as simple as possible, but not simpler” ALBERT EINSTEIN
Albert Einstein (1879 – 1955) was a German-born theoretical physicist who developed the general theory of relativity, effecting a revolution in physics.
CHAPTER 10. THEORY AND PRACTICE OF SAMPLING
Marketing Research
Ver
ónic
a R
osen
do R
íos
©
1-3
CONTENTS
1. Population and Sample
2. Sampling Type: Probabilistic and Non-probabilistic
3. The Sampling Error
4. Sampling Size
CHAPTER 10. THEORY AND PRACTICE OF SAMPLING

Marketing Research
Ver
ónic
a R
osen
do R
íos
©
1-4
POPULATION:
“Aggregate of all the elements that share some common characteristics and that comprise the UNIVERSE for the marketing research problem”.
Census:
“Enumeration of the elements of a population”
SAMPLE:
“Subgroup of the population selected for participation in the study”
Sampling unit
Elements of the population to be sampled
POPULATION AND SAMPLE

Marketing Research
Ver
ónic
a R
osen
do R
íos
©
1-5
• Sample versus population:
Budget and time limits A census is both costly and time consuming
Size If the population is very large, a census is not realistic. IF it is small, a census would be preferred.
Variance High variance favors a census whenever possible
Cost of sampling errors A census is preferred if the cost of sampling error is high (e.g. medical research)
Cost of non-sampling errors High cost of non-sampling errors would favor a sample. A census can greatly increase non-sampling errors. Non-sampling errors are the greatest contribution to total errors. Accuracy considerations would favor a sample over a census most of the time
Secrecy Sometimes, due to competition, a sample is better than a census to keep secrecy
POPULATION AND SAMPLE
Marketing Research
Ver
ónic
a R
osen
do R
íos
©
1-6
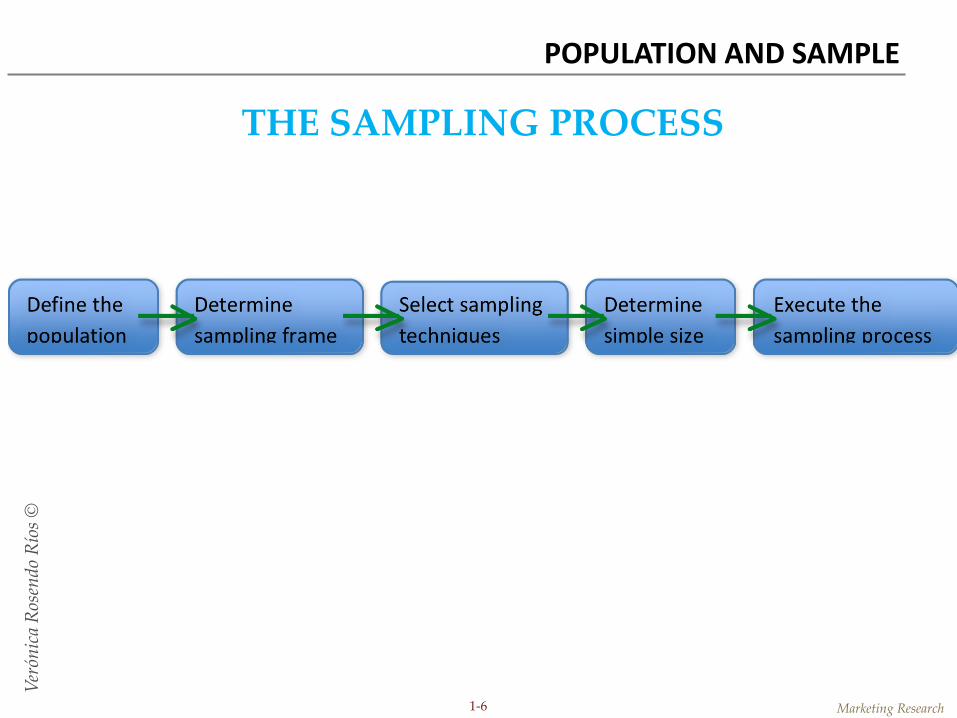
THE SAMPLING PROCESS
POPULATION AND SAMPLE
Marketing Research
Ver
ónic
a R
osen
do R
íos
©
1-7
1. Define the population Accuracy
Imprecise definitions will lead to ineffective research and misleading results
The target population should be defined in terms of:
-Elements. Element about which the information is desired. Typically the respondent
-Sampling units. Element or unit containing the element (e.g. household)
-Extent. Geographical boundaries
-Time. Period for fieldwork
POPULATION AND SAMPLE
Marketing Research
Ver
ónic
a R
osen
do R
íos
©
1-8
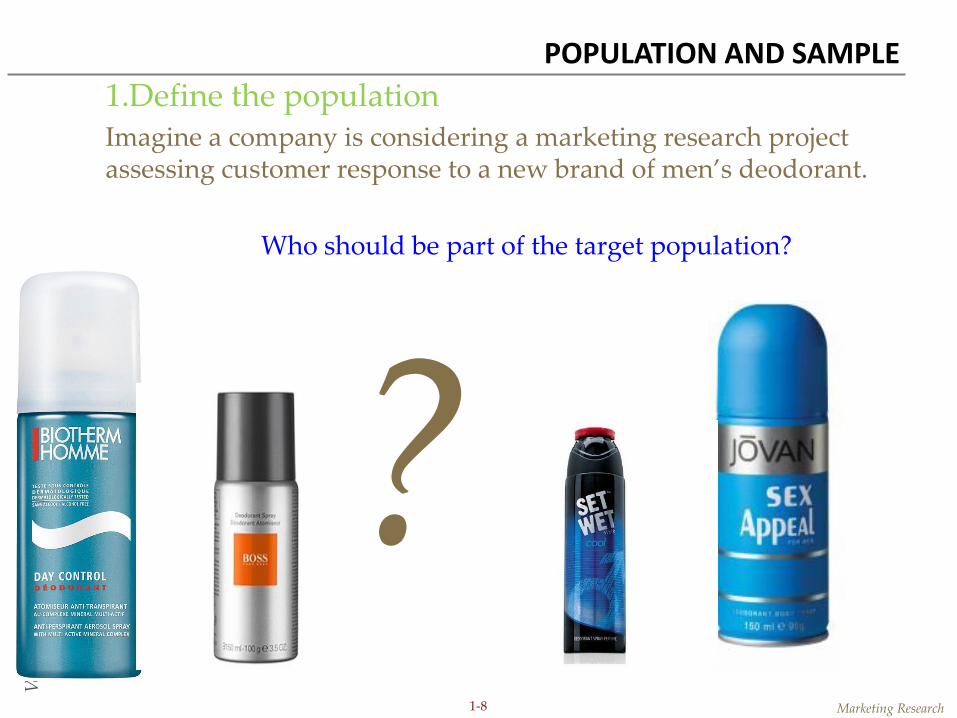
1.Define the population Imagine a company is considering a marketing research project assessing customer response to a new brand of men’s deodorant.
Who should be part of the target population?
?
POPULATION AND SAMPLE

Marketing Research
Ver
ónic
a R
osen
do R
íos
©
1-9
2. Determine the sampling frame
“A sampling frame is a representation of the elements of a target population”
E.g. Telephone directory, city directory, …
Important to check the accuracy!!!
Adjust the sampling frame error:
Redefine the population in terms of sampling frame
Screening eg in terms of demographic factors…
Weighting scheme
POPULATION AND SAMPLE

Marketing Research
Ver
ónic
a R
osen
do R
íos
©
1-10
3. Select the sampling technique(s)
Bayesian or traditional? -Bayesian. The elements are selected sequentially, data are collected after each element is added to the sample. Not very much used.
-Traditional. The entire sample is selected before data collection begins. Most common approach.
With or without replacement?
-With replacement. An element is taken from the sampling frame and data obtained. Then the element is placed back in the sampling frame. Result: it can be selected more than once.
-Without replacement. Once an element is selected for inclusion in the sample, it is removed from the sampling frame and cannot be selected for inclusion again.
Probability vs non-probability?
POPULATION AND SAMPLE
Marketing Research
Ver
ónic
a R
osen
do R
íos
©
1-11
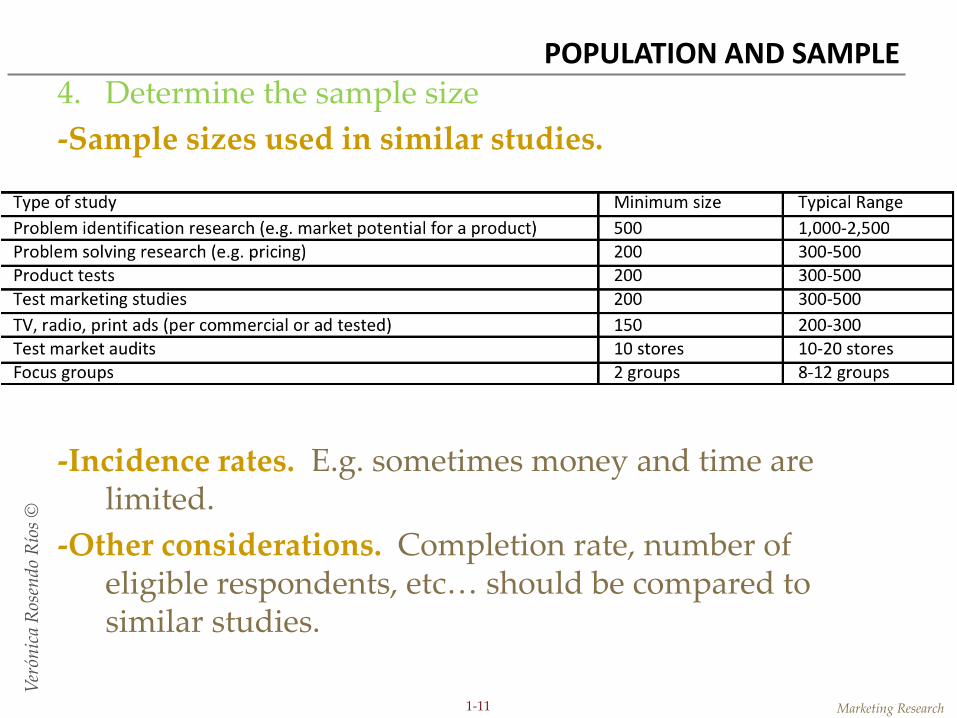
4. Determine the sample size
-Sample sizes used in similar studies.
-Sample sizes used in similar studies.
-Incidence rates. E.g. sometimes money and time are limited.
-Other considerations. Completion rate, number of eligible respondents, etc… should be compared to similar studies.
POPULATION AND SAMPLE

Marketing Research
Ver
ónic
a R
osen
do R
íos
©
1-12
5. Execute the sampling process
Detailed specification of how the sampling design decisions with respect to: -population
-Sampling frame
-Sampling unit
-Sampling technique
-Sample size
… are to be implemented
-Considerations:
E.g. If households are sampling unit, a specific definition of household is required and procedures in case of vacant houses, not at homes, callbacks, …
POPULATION AND SAMPLE

Marketing Research
Ver
ónic
a R
osen
do R
íos
©
1-13
SAMPLING TYPE: PROBABILITY AND NON-PROBABILITY
Marketing Research
Ver
ónic
a R
osen
do R
íos
©
1-14
NON-PROBABILITY SAMPLING:
“Relies on the personal judgment of the researcher rather than on chance to select sample elements. The researcher decides which elements to include in the sample”. The estimates cannot be generalized to the population.
1. Convenience Sampling:
-Attempts to obtain a sample of convenient elements
-Sometimes elements are selected for being in the right place at the right time e.g. mall intercepts, students, tear-out questionnaires included in magazines, street interviews…
Advantages: It is the least expensive and less-time consuming
Disadvantages: Not representative. Should not be used in conclusive research
SAMPLING TYPE: PROBABILITY AND NON-PROBABILITY
Marketing Research
Ver
ónic
a R
osen
do R
íos
©
1-15
NON-PROBABILITY SAMPLING:
2. Judgmental sampling:
Population elements are selected based on the judgment of the researcher. The researcher chooses the elements to be included in the sample because he or she believes that they are representative of the population of interest or are otherwise appropriate.
For example test markets selected to determine the potential of a new product, purchase engineers selected in industrial marketing research because they are considered to be representative of the company, expert witnesses used in court, department stores selected to test a new merchandising display system.
SAMPLING TYPE: PROBABILITY AND NON-PROBABILITY

Marketing Research
Ver
ónic
a R
osen
do R
íos
©
1-16
NON-PROBABILITY SAMPLING:
3. Quota Sampling
It is a two-stage restricted judgmental sampling. -The first step consists of developing control categories, or quotas,
of population elements. Relevant control characteristics include sex, age, and race. Often, the quotas are assigned so that the proportion of the sample elements possessing the control characteristics is the same as the proportion of population elements with these characteristics. In other words, the quotas ensure that the composition of the sample is the same as the composition of the population with respect to the characteristics of interest.
In the second stage, sample elements are selected based on convenience or judgment. The only requirement is that the elements selected fit the control characteristics.
SAMPLING TYPE: PROBABILITY AND NON-PROBABILITY

Marketing Research
Ver
ónic
a R
osen
do R
íos
©
1-17
NON-PROBABILITY SAMPLING:
3. Quota Sampling E.g. a company may be interested in undertaking a study to determine the
loyalty of adult consumers to a newspaper. 300,000 inhabitants constitute the adult population. A quota sample of 1,000 adults is selected. The control characteristics are sex, age and race. The quota are assigned as follows:
SAMPLING TYPE: PROBABILITY AND NON-PROBABILITY

Marketing Research
Ver
ónic
a R
osen
do R
íos
©
1-18
NON-PROBABILITY SAMPLING:
3. Quota Sampling Disadvantages
o There is no assurance that the sample is representative.
o If a characteristic that is relevant to the problem has been overlooked, the quota sample will not be representative.
o Relevant control characteristics are often omitted because there are particular difficulties associated with including many control characteristics.
o Because the elements in each quota are selected based on convenience or judgment, many sources of selection bias are potentially present.
o The interviewers may go to selected areas where eligible respondents are more likely to be found, or they may wrongly avoid areas or people that they do not consider adequate. Quota sampling does not permit assessment of sampling error.
SAMPLING TYPE: PROBABILITY AND NON-PROBABILITY

Marketing Research
Ver
ónic
a R
osen
do R
íos
©
1-19
NON-PROBABILITY SAMPLING:
3. Quota Sampling Advantages
o It attempts to obtain representative samples at a relatively low cost.
o Its main advantages are the lower costs and greater convenience to the interviewers in selecting the elements for each quota.
o Recently, tighter controls have been imposed on interviewers and interviewing procedures that tend to reduce selection bias, and guidelines have been suggested for improving the quality of mall-intercept quota samples.
o Under certain conditions, quota sampling obtains results close to those for conventional probability sampling.
SAMPLING TYPE: PROBABILITY AND NON-PROBABILITY

Marketing Research
Ver
ónic
a R
osen
do R
íos
©
1-20
NON-PROBABILITY SAMPLING:
4. Snowball Sampling o An initial group of respondents is selected, usually at random.
o After being interviewed, these respondents are asked to identify others who belong to the target population of interest.
o Subsequent respondents are selected based on the referrals. By obtaining referrals from referrals, this process may be carried out in waves, therefore leading to the snowball effect.
o Even though probability sampling is used to select the initial respondents, the final sample is a nonprobability sampling. The referrals are likely to have demographic and psychographic characteristic more similar to the persons referring them than would occur by chance.
o A major objective of snowball sampling is to estimate characteristics that are rare in the population. For example, users of particular social services, such as food stamps whose names cannot be revealed; special census groups; members of scattered minority populations. Snowballing is used in industrial buyer-seller research to identify buyer-seller pairs.
SAMPLING TYPE: PROBABILITY AND NON-PROBABILITY
Marketing Research
Ver
ónic
a R
osen
do R
íos
©
1-21
NON-PROBABILITY SAMPLING:
4. Snowball Sampling
Advantages: the major advantage is that it substantially increases the likelihood of locating the desired characteristic in the population. It also results in relatively low sampling variance and cots.
SAMPLING TYPE: PROBABILITY AND NON-PROBABILITY

Marketing Research
Ver
ónic
a R
osen
do R
íos
©
1-22
PROBABILITY SAMPLING:
o Sample units are selected by chance. Each element of the population has a fixed probabilistic chance of being selected for the sample.
• Because sample elements are selected by chance, it is possible to determine the precision of the sample estimates of the characteristics of interest.
• Confidence intervals, which contain the true population value with a given level of uncertainty, can be calculated. This allows the researcher to make inferences or projections about the target population from which the sample was drawn.
SAMPLING TYPE: PROBABILITY AND NON-PROBABILITY
Marketing Research
Ver
ónic
a R
osen
do R
íos
©
1-23
PROBABILITY SAMPLING:
Probability sampling techniques are classified based on (Malhotra, 2012):
Elements versus cluster sampling
Equal unit probability versus unequal probabilities
Un-stratified versus stratified selection
Random versus systematic selection
Single-stage versus multistage techniques
All possible combinations of these five aspects result in 32 different probability sampling techniques. The most typical ones are: simple random sampling, systematic sampling, stratified sampling, and cluster sampling.
SAMPLING TYPE: PROBABILITY AND NON-PROBABILITY
Marketing Research
Ver
ónic
a R
osen
do R
íos
©
1-24
PROBABILITY SAMPLING:
1. Simple Random Sampling (SRS) • In simple random sampling, each member of the population has a
known and equal number of probabilities to selection.
• Furthermore, each possible sample of a given size (n) has a known and equal probability of being the sample actually selected. This means that every element is selected independently of every other element. The sample is drawn by a random procedure from a sampling frame. (This method is similar to a lottery in which names are drawn out).
• To draw a simple random sample, the researcher first compiles a sampling frame in which each element is assigned a unique identification number. Then random numbers are generated to determine which elements to include in the sample. For example, imagine a sample size of 30 is selected from a sampling frame containing 800 elements. A computer routine system or excel spreadsheet could be used to do a random selection.
SAMPLING TYPE: PROBABILITY AND NON-PROBABILITY

Marketing Research
Ver
ónic
a R
osen
do R
íos
©
1-25
PROBABILITY SAMPLING:
1. Simple Random Sampling (SRS) • Advantages of SRS:
Results may be generalized and projected to the target population, and most statistical inferences are based on SRS.
• Limitations:
• It is difficult to construct a sampling frame that will allow a simple random sample to be drawn.
• Second, SRS can result in large samples or samples spread over large geographic areas, thus increasing the time and cost of data collection.
• Third, SRS often result in lower precision with larger standard errors than other probability sampling techniques.
• Fourth, SRS may or may not result in a representative sample. Although samples drawn will represent the population well on average, a given simple random sample may grossly misrepresent the target population. This is more likely if the size of the sample is small. For these reasons, although SRS is quite typical and most common technique, it is not as widely used in marketing research as systematic sampling.
SAMPLING TYPE: PROBABILITY AND NON-PROBABILITY
Marketing Research
Ver
ónic
a R
osen
do R
íos
©
1-26
PROBABILITY SAMPLING:
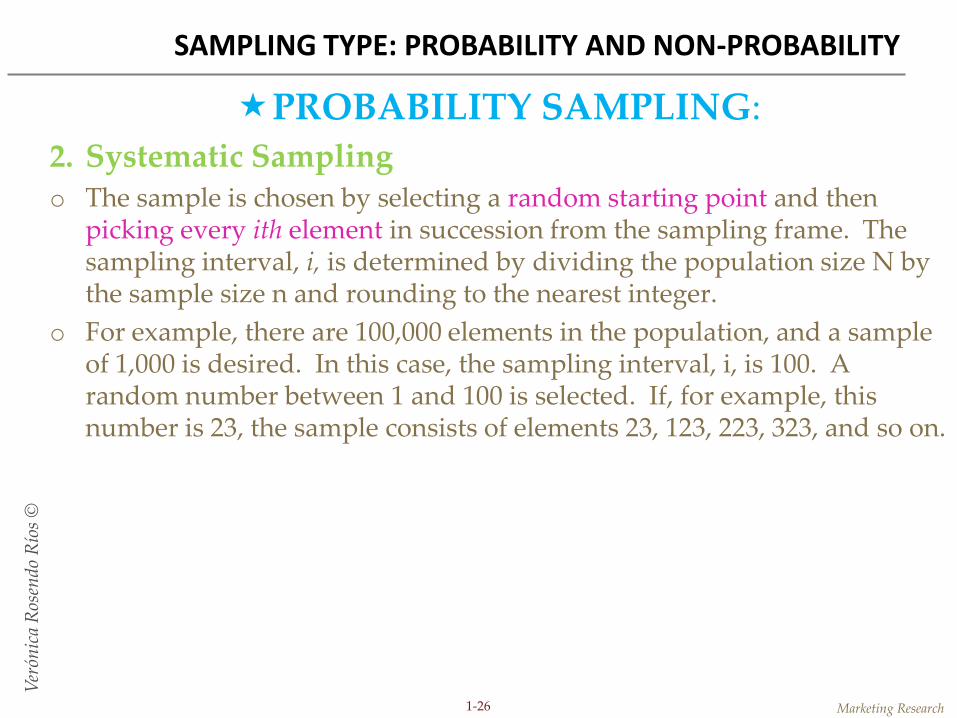
2. Systematic Sampling o The sample is chosen by selecting a random starting point and then
picking every ith element in succession from the sampling frame. The sampling interval, i, is determined by dividing the population size N by the sample size n and rounding to the nearest integer.
o For example, there are 100,000 elements in the population, and a sample of 1,000 is desired. In this case, the sampling interval, i, is 100. A random number between 1 and 100 is selected. If, for example, this number is 23, the sample consists of elements 23, 123, 223, 323, and so on.
SAMPLING TYPE: PROBABILITY AND NON-PROBABILITY
Marketing Research
Ver
ónic
a R
osen
do R
íos
©
1-27
PROBABILITY SAMPLING:
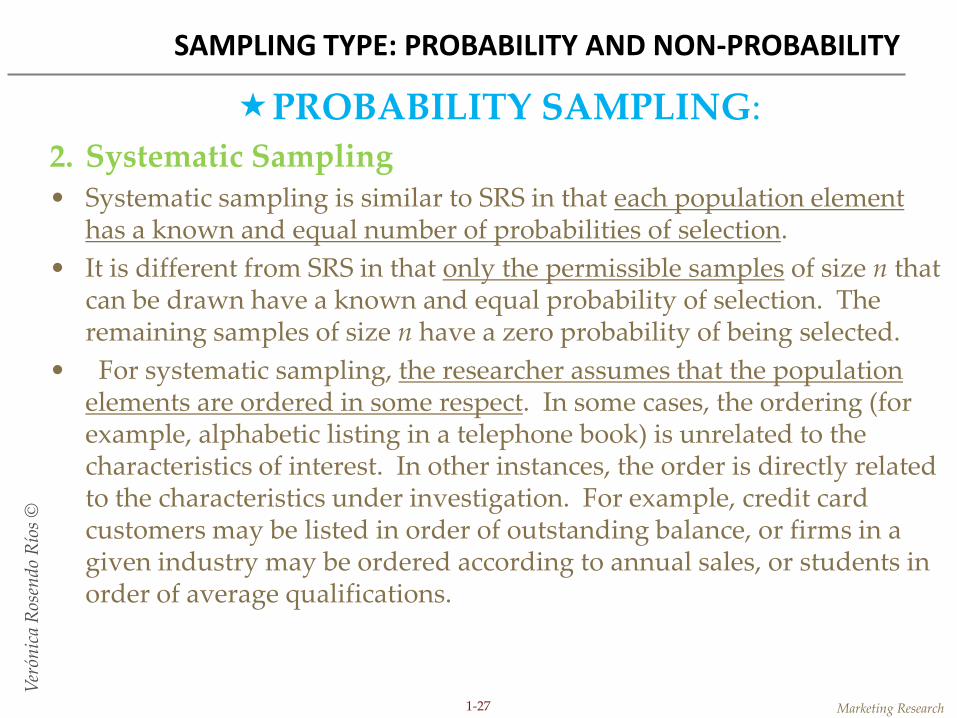
2. Systematic Sampling • Systematic sampling is similar to SRS in that each population element
has a known and equal number of probabilities of selection.
• It is different from SRS in that only the permissible samples of size n that can be drawn have a known and equal probability of selection. The remaining samples of size n have a zero probability of being selected.
• For systematic sampling, the researcher assumes that the population elements are ordered in some respect. In some cases, the ordering (for example, alphabetic listing in a telephone book) is unrelated to the characteristics of interest. In other instances, the order is directly related to the characteristics under investigation. For example, credit card customers may be listed in order of outstanding balance, or firms in a given industry may be ordered according to annual sales, or students in order of average qualifications.
SAMPLING TYPE: PROBABILITY AND NON-PROBABILITY

Marketing Research
Ver
ónic
a R
osen
do R
íos
©
1-28
PROBABILITY SAMPLING:
3. Stratified Sampling • It is a two-step process in which the population is partitioned into
subpopulations, or strata.
• The strata should be mutually exclusive and collectively exhaustive in that every population element should be assigned to one and only one stratum and no population element should be omitted.
• Next, elements are selected from each stratum by random procedure, usually SRS.
• Technically, only SRS should be employed in selecting the elements from each stratum. In practice, sometimes systematic sampling and other probability sampling procedures are employed. Stratified sampling differs from quota sampling in that the sample elements are selected probabilistically rather than based on convenience or judgment. A major objective of stratified sampling is to increase precision without increasing cots.
SAMPLING TYPE: PROBABILITY AND NON-PROBABILITY

Marketing Research
Ver
ónic
a R
osen
do R
íos
©
1-29
PROBABILITY SAMPLING:
• 3. Stratified Sampling • The variables used to partition the population into strata are referred to
as stratification variables.
• The criteria for the selection of these variables consist of homogeneity, heterogeneity, relatedness, and cost. The elements within a stratum should be as homogeneous as possible, but the elements in different strata should be as heterogeneous as possible.
• The stratification variables should also be closely related to the characteristic of interest.
• Variables commonly used for stratification include demographic characteristics, type of customer (e.g. credit card vs non-credit card), size of the firm, or type of industry.
SAMPLING TYPE: PROBABILITY AND NON-PROBABILITY
Marketing Research
Ver
ónic
a R
osen
do R
íos
©
1-30
PROBABILITY SAMPLING:
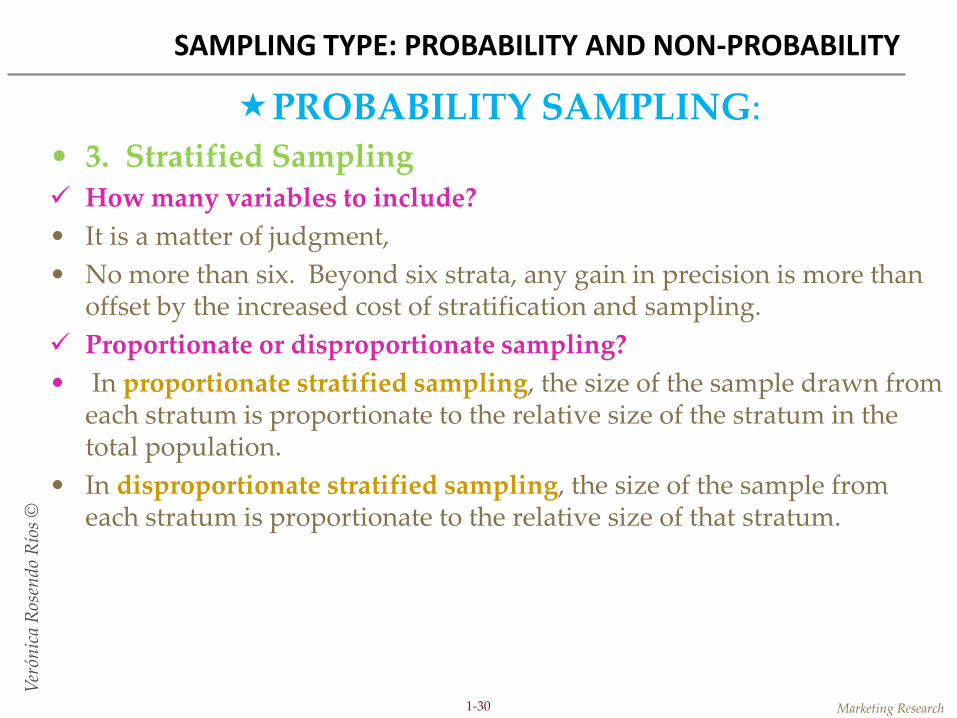
• 3. Stratified Sampling How many variables to include?
• It is a matter of judgment,
• No more than six. Beyond six strata, any gain in precision is more than offset by the increased cost of stratification and sampling.
Proportionate or disproportionate sampling?
• In proportionate stratified sampling, the size of the sample drawn from each stratum is proportionate to the relative size of the stratum in the total population.
• In disproportionate stratified sampling, the size of the sample from each stratum is proportionate to the relative size of that stratum.
SAMPLING TYPE: PROBABILITY AND NON-PROBABILITY

Marketing Research
Ver
ónic
a R
osen
do R
íos
©
1-31
PROBABILITY SAMPLING:
4. Cluster Sampling • The target population is first divided into mutually exclusive and
collectively exhaustive subpopulations, or clusters.
• Then a random sample of clusters is selected, based on a probability sampling technique such as SRS.
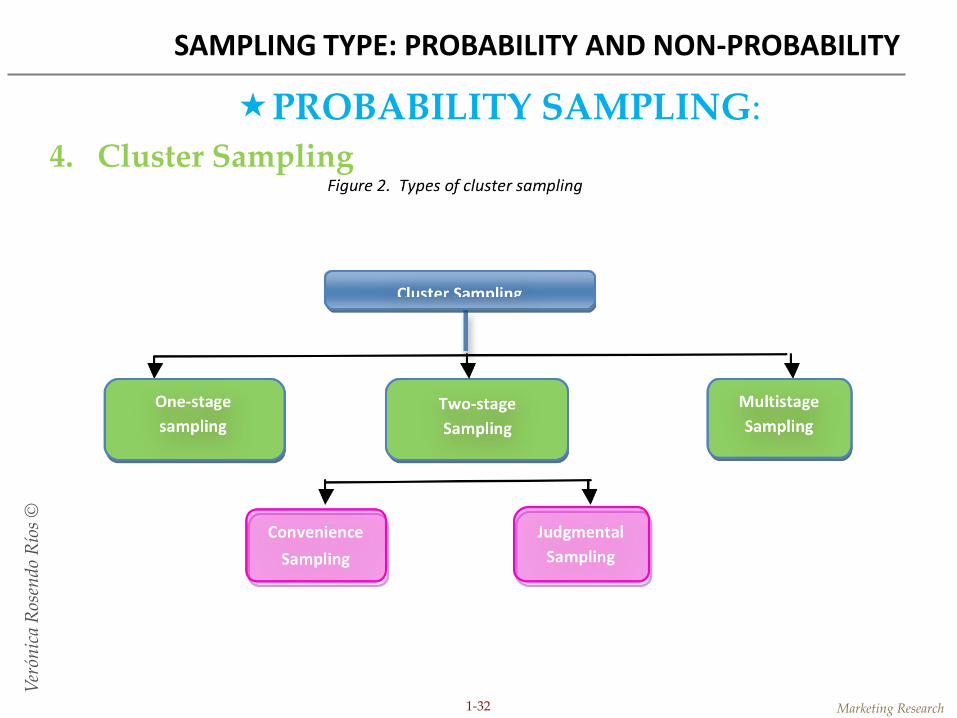
• For each selected cluster, either all the elements are included in the sample, or a sample of elements is drawn probabilistically. If all the elements in each selected cluster are included in the sample, the procedure is called one-stage cluster sampling.
• Two-stage cluster sampling can be either simple two-stage cluster sampling involving SRS, or probability proportionate to size (PPS) sampling. Furthermore, a cluster sample can have multiple (more than two) stages, as in multistage cluster sampling.
SAMPLING TYPE: PROBABILITY AND NON-PROBABILITY
Marketing Research
Ver
ónic
a R
osen
do R
íos
©
1-32
PROBABILITY SAMPLING:
4. Cluster Sampling
SAMPLING TYPE: PROBABILITY AND NON-PROBABILITY
Marketing Research
Ver
ónic
a R
osen
do R
íos
©
1-33
PROBABILITY SAMPLING:
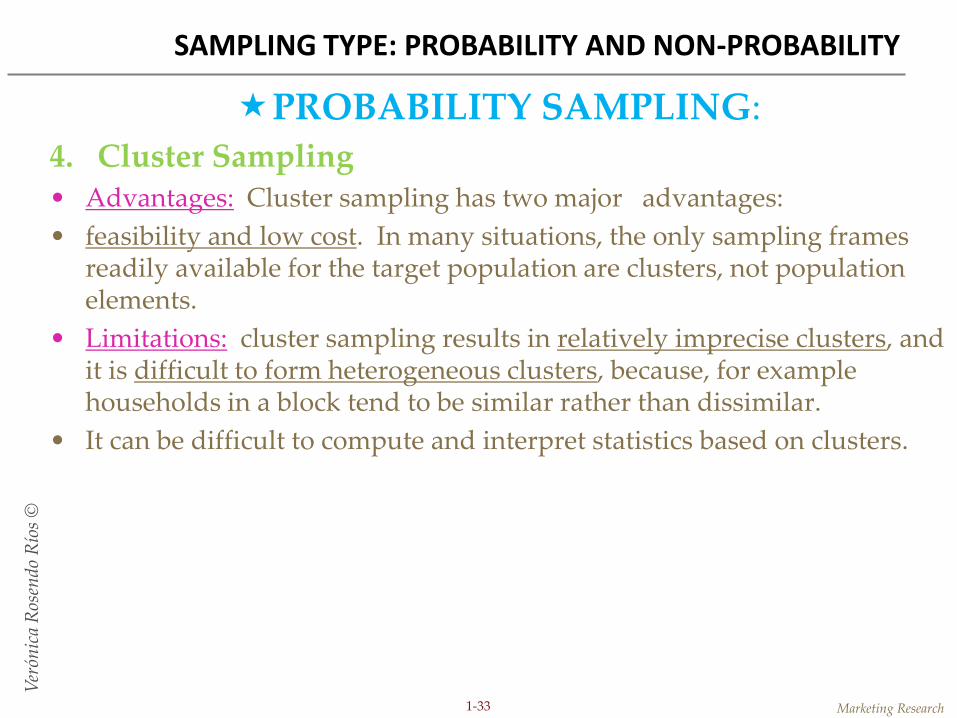
4. Cluster Sampling • Advantages: Cluster sampling has two major advantages:
• feasibility and low cost. In many situations, the only sampling frames readily available for the target population are clusters, not population elements.
• Limitations: cluster sampling results in relatively imprecise clusters, and it is difficult to form heterogeneous clusters, because, for example households in a block tend to be similar rather than dissimilar.
• It can be difficult to compute and interpret statistics based on clusters.
SAMPLING TYPE: PROBABILITY AND NON-PROBABILITY
Marketing Research
Ver
ónic
a R
osen
do R
íos
©
1-34
SAMPLING TYPE: PROBABILITY AND NON-PROBABILITY

Marketing Research
Ver
ónic
a R
osen
do R
íos
©
1-35
OTHER PROBABILITY SAMPLING TECHNIQUES:
1. Sequential Sampling The population elements are sampled sequentially, data collection and analysis are done at each stage, and a decision is made as to whether additional population elements should be sampled.
• The sample size is not known in advance, but a decision rule is stated before sampling begins.
• At each stage, this rule indicates whether sampling should be continued or whether enough information has been obtained.
• Sequential sampling has been used to determine preferences for two competing alternatives. In one study, respondents were asked which of two alternatives they preferred, and sampling was terminated when sufficient evidence was accumulated to validate preference. It has also been used to establish the price differential between a standard model and a delux model of a consumer durable (Malhotra, 2012).
SAMPLING TYPE: PROBABILITY AND NON-PROBABILITY

Marketing Research
Ver
ónic
a R
osen
do R
íos
©
1-36
OTHER PROBABILITY SAMPLING TECHNIQUES:
2. Double Sampling, Two-phase sampling Certain population elements are sampled twice.
In the first phase, a sample is selected and some information is collected from all the elements in the sample.
In the second phase, a subsample is drawn from the original sample and additional information is obtained from the elements in the subsample. The process may be extended to three or more phases, and the different phases may take place simultaneously or at different times.
Double sampling can be useful when no sampling frame is readily available for selecting final sampling units but when the elements of the frame are known to be contained within a broader sampling frame.
SAMPLING TYPE: PROBABILITY AND NON-PROBABILITY

Marketing Research
Ver
ónic
a R
osen
do R
íos
©
1-37
OTHER PROBABILITY SAMPLING TECHNIQUES:
2. Double Sampling, Two-phase sampling Example:
A researcher wants to select households in a given city that consume apple juice. The households of interest are contained within the set of all households, but the researcher does not know which ones they are:
In applying double sampling, the researcher would obtain a sampling frame of all households in the first phase. This would be constructed from the city directory or purchased. Then a sample of households would be drawn, using systematic random sampling to determine the amount of apple juice consumed.
In the second phase, households that consume apple juice would be selected and stratified according to the amount of apple juice consumed. Then a stratified random sample would be drawn and detailed questions regarding apple juice consumption asked.
SAMPLING TYPE: PROBABILITY AND NON-PROBABILITY

Marketing Research
Ver
ónic
a R
osen
do R
íos
©
1-38
Probability vs non-probability sampling Type of research:
For example, in exploratory research, the findings are treated as preliminary and the use of probability sampling may not be warranted. On the other hand, in conclusive research where the researcher whishes to use the results to estimate overall market shares or the size of the total market, probability sampling is favored.
Generalization:
Probability samples allow statistical projection of the results to a target population.
Accuracy:
For some research problems, highly accurate estimates of population characteristics are required. In these situations, the elimination of selection bias and the ability to calculate sampling error make probability sampling desirable.
SAMPLING TYPE: PROBABILITY AND NON-PROBABILITY

Marketing Research
Ver
ónic
a R
osen
do R
íos
©
1-39
Probability vs non-probability sampling Variability in the population:
Another consideration is homogeneity of the population with respect to the variables of interest. A heterogeneous population would favor probability sampling because it would be more important to secure a representative sample.
Statistical considerations:
Probability sampling is preferable from a statistical viewpoint, as it is the basis of most common statistical techniques.
Operational considerations:
Probability sampling is sophisticated and requires statistically trained researchers. It generally costs more and takes longer than non-probability sampling. In many marketing research projects, it is difficult to justify the additional time and costs.
SAMPLING TYPE: PROBABILITY AND NON-PROBABILITY

Marketing Research
Ver
ónic
a R
osen
do R
íos
©
1-40
SAMPLING TYPE: PROBABILITY AND NON-PROBABILITY

Marketing Research
Ver
ónic
a R
osen
do R
íos
©
1-41
SAMPLING TYPE: PROBABILITY AND NON-PROBABILITY

Marketing Research
Ver
ónic
a R
osen
do R
íos
©
1-42
THE SAMPLING ERROR
Marketing Research
Ver
ónic
a R
osen
do R
íos
©
1-43
STATISTICS
The statistical approach to determine sample size considered here is based on traditional statistical inference. In this approach, the precision level is specified in advance. This approach is based on the construction of confidence intervals around sample means or proportions.
Sample statistics or statistics are the various numerical measures (such as mean, variance, etc) when applied to a sample. When these numerical measures are applied to a population, they are called population parameters or simply parameters. The sample statistic mean (X_high bar ) estimates the population mean μ; the sample statistic variance (S²) estimates the population variance σ².
Sampling distribution: The principal use of sampling distributions and its related concepts is to help predict how close the estimate is to the population parameter, and with what probability.
THE SAMPLING SIZE
Marketing Research
Ver
ónic
a R
osen
do R
íos
©
1-44
STATISTICS
Degrees of freedom: If we are asked to choose three random numbers a, b and c, we are free to choose any three numbers without any restrictions - in other words, we have 3 degrees of freedom. But if the three numbers are put together in a model a + b + c = 10, then we have just 2 degrees of freedom. The choice of a and b can be arbitrary, but c is constrained to take a specific value that satisfies the model. The use of df appears to be a compensatory mechanism in the computations, specific to the context/situation in which is it applied.
Confidence Interval (CI): An interval estimate, with its associated measure of confidence is called confidence interval. It is a range of numbers that probably contains the unknown population parameter, with an adjoining level of confidence that it indeed does. Statistical range of values within which the true value of the defined target population parameter is expected to be.
THE SAMPLING SIZE
Marketing Research
Ver
ónic
a R
osen
do R
íos
©
1-45
STATISTICS
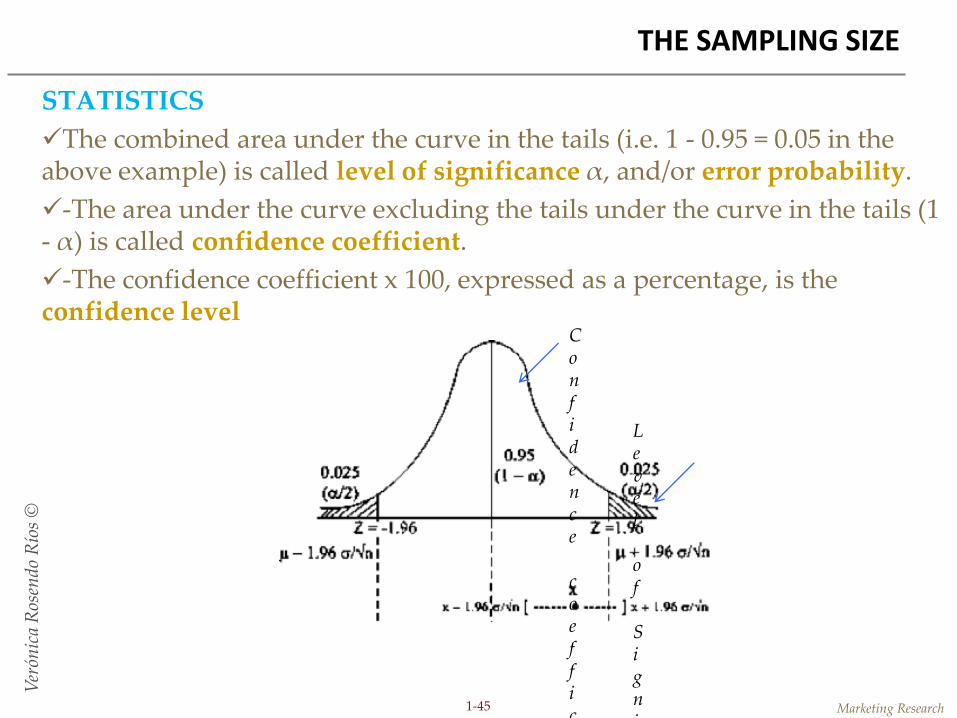
The combined area under the curve in the tails (i.e. 1 - 0.95 = 0.05 in the above example) is called level of significance α, and/or error probability.
-The area under the curve excluding the tails under the curve in the tails (1 - α) is called confidence coefficient.
-The confidence coefficient x 100, expressed as a percentage, is the confidence level
THE SAMPLING SIZE
Level of Signi
Confidence coeffic
Marketing Research
Ver
ónic
a R
osen
do R
íos
©
1-46
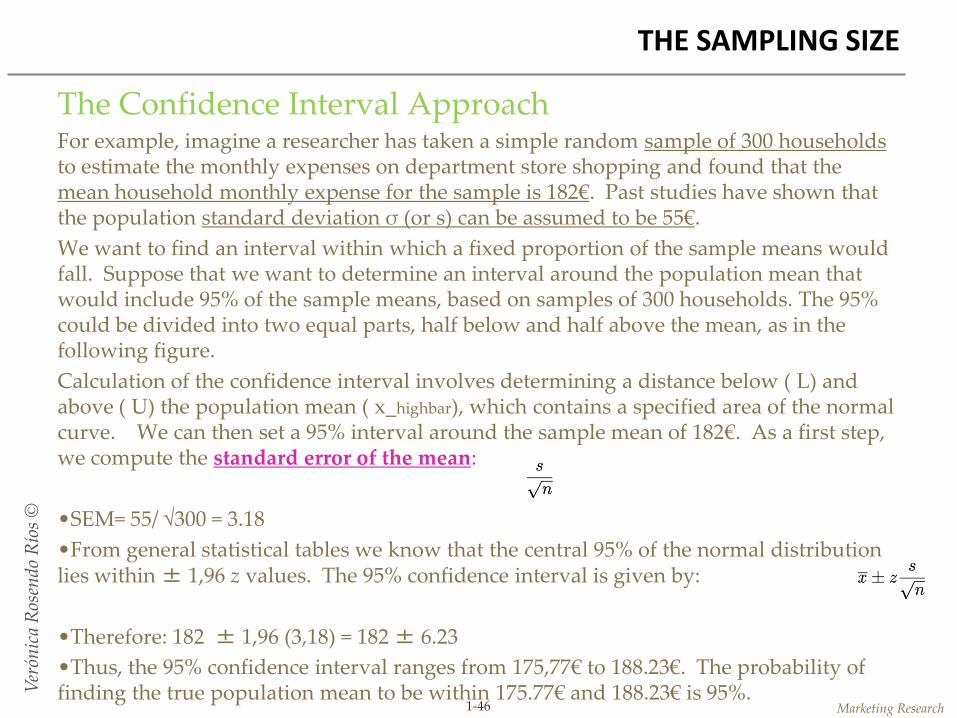
The Confidence Interval Approach For example, imagine a researcher has taken a simple random sample of 300 households to estimate the monthly expenses on department store shopping and found that the mean household monthly expense for the sample is 182€. Past studies have shown that the population standard deviation σ (or s) can be assumed to be 55€.
We want to find an interval within which a fixed proportion of the sample means would fall. Suppose that we want to determine an interval around the population mean that would include 95% of the sample means, based on samples of 300 households. The 95% could be divided into two equal parts, half below and half above the mean, as in the following figure.
Calculation of the confidence interval involves determining a distance below ( L) and above ( U) the population mean ( x_highbar), which contains a specified area of the normal curve. We can then set a 95% interval around the sample mean of 182€. As a first step, we compute the standard error of the mean:
•SEM= 55/ √300 = 3.18
•From general statistical tables we know that the central 95% of the normal distribution lies within ± 1,96 z values. The 95% confidence interval is given by:
•Therefore: 182 ± 1,96 (3,18) = 182 ± 6.23
•Thus, the 95% confidence interval ranges from 175,77€ to 188.23€. The probability of finding the true population mean to be within 175.77€ and 188.23€ is 95%.
THE SAMPLING SIZE

Marketing Research
Ver
ónic
a R
osen
do R
íos
©
1-47
Sample Size Determination: MEANS
Imagine that the researcher wants to estimate the monthly household expense on department store shopping more precisely so that the estimate will be within ± 5.00€ of the true population value. What should be the size of the sample?
Specify the level of precision. This is the maximum permissible difference (D) between the sample mean and the population mean. In our example, D= ± 5.00€.
Specify the level of confidence. Suppose that a 95% confidence level is desired.
Determine the z value associated with the confidence level using the standard normal table in the appendix. For a 95% confidence level, the probability that the population mean will fall outside one end of the interval is 0,025 (0.5/2). The associated z value is 1.96.
THE SAMPLING SIZE
Marketing Research
Ver
ónic
a R
osen
do R
íos
©
1-48
Sample Size Determination: MEANS
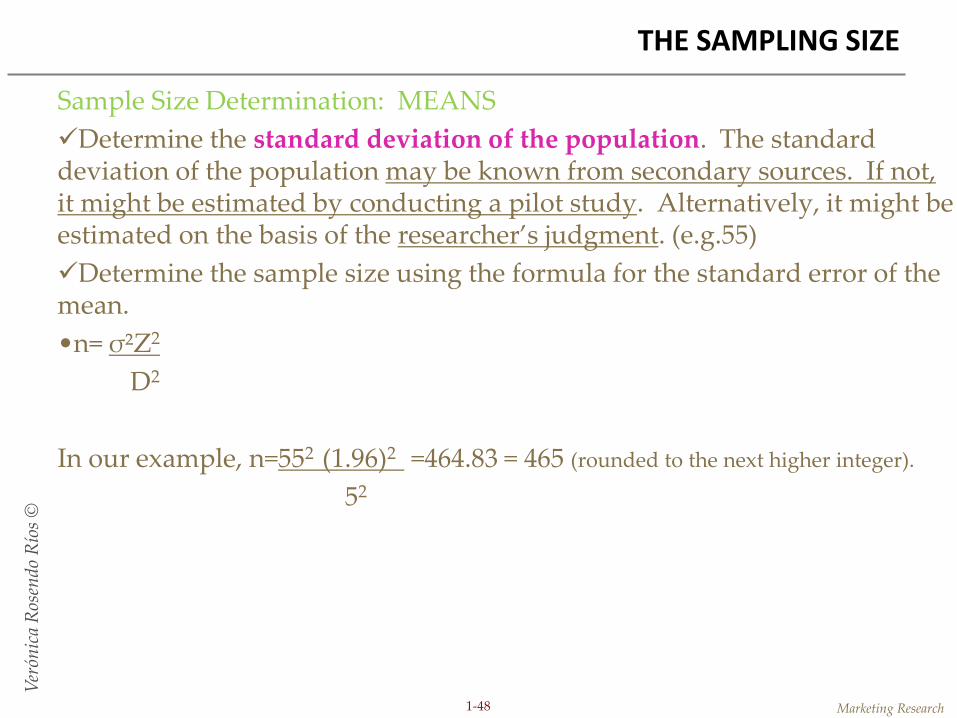
Determine the standard deviation of the population. The standard deviation of the population may be known from secondary sources. If not, it might be estimated by conducting a pilot study. Alternatively, it might be estimated on the basis of the researcher’s judgment. (e.g.55)
Determine the sample size using the formula for the standard error of the mean.
•n= σ²Z2
D2
In our example, n=552 (1.96)2 =464.83 = 465 (rounded to the next higher integer).
52
THE SAMPLING SIZE

Marketing Research
Ver
ónic
a R
osen
do R
íos
©
1-49
Sample Size Determination: MEANS
If the resulting sample size represents 10% or more of the population, the finite population correction (fpc) should be applied. The required sample size should then be calculated from the formula:
nc= nN
N+n-1
Where n=sample size wihout fpc and nc=sample size with fpc
THE SAMPLING SIZE

Marketing Research
Ver
ónic
a R
osen
do R
íos
©
1-50
Sample Size Determination: MEANS
If the population standard deviation, σ, is unknown and an estimate is used, it should be re-estimated once the sample has been drawn. The sample standard deviation, s, is used as an estimate of σ. A revised confidence interval should then be calculated to determine the precision level actually obtained.
oSuppose that the value of 55 used for σ² was an estimate because the true value was unknown. A sample of n=465 is drawn, and these observations generate a mean of 180.00 and a sample standard deviation of 50.00. The revised confidence interval is then calculated as
•X_highbar ± Zsx = 180.00 ± 1.96 50 = 180.00 ± 4.55 or 175.45 ≤ μ ≤ 184.55
• √465
•
•Note that the confidence interval obtained is narrower (X_highbar ± 4.55)than planned (X_highbar ± 5.00), because the population standard deviation was overestimated, as judged by the sample standard deviation.
THE SAMPLING SIZE
Marketing Research
Ver
ónic
a R
osen
do R
íos
©
1-51
Sample Size Determination: PROPORTIONS
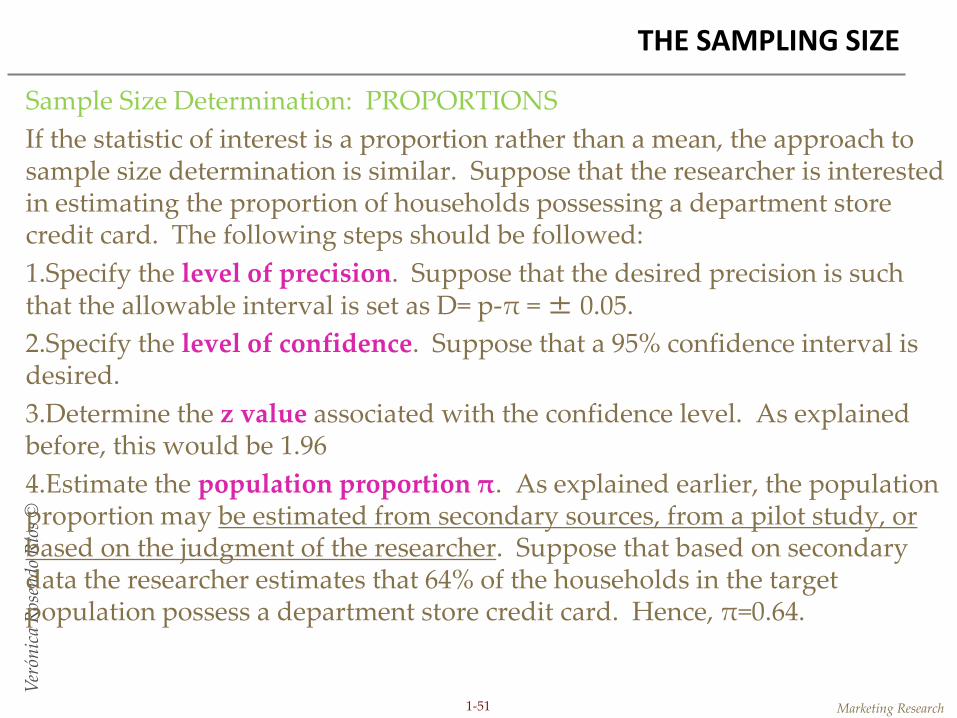
If the statistic of interest is a proportion rather than a mean, the approach to sample size determination is similar. Suppose that the researcher is interested in estimating the proportion of households possessing a department store credit card. The following steps should be followed:
1.Specify the level of precision. Suppose that the desired precision is such that the allowable interval is set as D= p-π = ± 0.05.
2.Specify the level of confidence. Suppose that a 95% confidence interval is desired.
3.Determine the z value associated with the confidence level. As explained before, this would be 1.96
4.Estimate the population proportion π. As explained earlier, the population proportion may be estimated from secondary sources, from a pilot study, or based on the judgment of the researcher. Suppose that based on secondary data the researcher estimates that 64% of the households in the target population possess a department store credit card. Hence, π=0.64.
THE SAMPLING SIZE

Marketing Research
Ver
ónic
a R
osen
do R
íos
©
1-52
Sample Size Determination: PROPORTIONS
5. Determine the sample size using the formula for the standard error of the proportion.
σp = p-π = D = √π(1-π) or n=π(1-π)z2
z z n D2
In our example, n = 0.64 (1-0.64) (1.96)2 = 354.04 = 355 (rounded to the nearest integer)
(0.05)2
6. If the resulting sample size represents 10% or more of the population, the finite population correction (fpc) should be applied. The required sample size should then be calculated from the formula:
nc = nN
N+n-1
Where n= sample size without fpc; nc = sample size with fpc.
THE SAMPLING SIZE

Marketing Research
Ver
ónic
a R
osen
do R
íos
©
1-53
Other probability sampling techniques
So far, we have considered sample size determination based on the method of statistical inference using the technique of simple random sampling. The determination of sample size for other probability sampling techniques is based on the same underlying principles.
The researcher must specify the level of precision and the degree of confidence and estimate the sampling distribution of the test statistic.
In addition, the researcher must take into account within-strata variability or within- and between- cluster variability.
Once the overall sample size is determined, the sample is apportioned among strata or clusters. This increases the complexity of the sample size formulas.
In general, to provide the same reliability as simple random sampling, sample sizes are the same for systematic sampling, smaller for stratified sampling, and larger for cluster sampling (Malhotra, 2012).
THE SAMPLING SIZE

Marketing Research
Ver
ónic
a R
osen
do R
íos
©
1-54
Adjusting the statistically determined sample size
The sample size determined statistically represents the final or net sample size that must be achieved to ensure that the parameters are estimated with the desired degree of precision and the given level of confidence.
In surveys, this represents the number of interviews that must be completed.
To achieve this final sample size, a much greater number of potential respondents have to be contacted.
In other words, the initial sample size has to be much larger because typically the incidence rates and completion rates are less than 100%.
THE SAMPLING SIZE

Marketing Research
Ver
ónic
a R
osen
do R
íos
©
1-55
Adjusting the statistically determined sample size
Incidence rate refers to the rate of occurrence or the percentage of persons eligible to participate in the study.
Incidence rate determines how many contacts need to be screened for a given sample size requirement.
Suppose that a study of laptops calls for a sample of female who work from home aged 25 to 55. Of the women between the ages of 20 and 60 who might reasonably be approached to see if they qualify, approximately 75% are home workers aged 25 to 55. This means that, on average (1/0.75) or 1.33 women would be approached to obtain one qualified respondent.
Additional criteria for qualifying respondents (for example, product usage behavior) will further increase the number of contacts. Suppose that an added eligibility requirement is that women should have used a laptop during the last two months. It is estimated that 60% of the women contacted would meet this criteria. Then the incidence rate is 0.75x0.60=0.45. Thus, the final sample size will have to be increased by a factor of (1/0.45) or 2.22.
THE SAMPLING SIZE

Marketing Research
Ver
ónic
a R
osen
do R
íos
©
1-56
Adjusting the statistically determined sample size
•Similarly, the determination of sample size must take into account anticipated refusals by people who qualify. The completion rate denotes the percentage of qualified respondents who complete the interview. If, for example, the researcher expects an interview completion rate of 80% of eligible respondents, the number of contacts should be increased by a factor of 1.2.
•the incidence rate and the completion rate together imply that the number of potential respondents contacted –that is, the initial sample size- should be 2.22x1.2 or 2.77 times the sample size required. In general, if there are c qualifying factors with an incidence of Q1, Q2, Q3, …, Qc, each expressed as a proportion, the following are true:
Incidence rate= Q1 x Q2 x Q3, k Qc
•Initial sample size = final sample size
• Incidence rate x completion rate
•The number of units that will have to be sampled will be determined by the initial sample size.
THE SAMPLING SIZE

Marketing Research
Ver
ónic
a R
osen
do R
íos
©
1-57
Adjusting for non-response
High response rate increase the probability than nonresponse bias is substantial. Nonresponse rates should always be reported, and wherever possible, the effects of non-response should be estimated.
• This can be done by linking the nonresponse rate to estimated differences between respondents and non-respondents
For example, differences found through callbacks could be extrapolated, or a concentrated follow-up could be conducted on a subsample of the non-respondents. Alternatively, it may be possible to estimate these differences from other sources.
THE SAMPLING SIZE
Marketing Research
Ver
ónic
a R
osen
do R
íos
©
1-58
Adjusting for non-response
Subsampling of non respondents
o In this technique, the researcher contacts a subsample of the non-respondents, usually by means of telephone or personal interviews. This often results in a high response rate within that subsample.
o The values obtained for the subsample are then projected to all the non-respondents, and the survey results are adjusted to account for non response.
o This method can estimate the effect of non response on the characteristic of interest.
THE SAMPLING SIZE
Marketing Research
Ver
ónic
a R
osen
do R
íos
©
1-59
Adjusting for non-response
Replacement
o In replacement, the non-respondents in the current survey are replaced with non respondents from an earlier, similar survey.
o The researcher attempts to contact those non-respondents from the earlier survey and administer the current survey questionnaire of nonresponse in the current survey similar to that of the earlier survey.
o The two surveys should use similar kinds of respondents, and the time interval between them should be short.
o As an example, if the department store survey is being repeated one year later, the non-respondents in the present survey may be replaced by the non-respondents in the original survey.
THE SAMPLING SIZE
Marketing Research
Ver
ónic
a R
osen
do R
íos
©
1-60
Adjusting for non-response
Substitution
o In substitution, the researcher substitutes for non respondents other elements from the sampling frame who are expected to respond.
o The sampling frame is divided into subgroups that are internally homogeneous in terms of respondent characteristics but heterogeneous in terms of response rates.
o These subgroups are then used to identify substitutes who are similar to a particular non respondent but dissimilar to respondents already in the sample.
o For example, a research company is planning a survey for a presidential election. Thus, the research company substitutes for non respondents other potential respondents who are similar in age, race, and residence.
THE SAMPLING SIZE

Marketing Research
Ver
ónic
a R
osen
do R
íos
©
1-61
Adjusting for non-response
Subjective estimates
oWhen it is no longer feasible to increase the response rate by subsampling, replacement, or substitution, it may be possible to arrive at subjective estimates of the nature and effect of nonresponse bias.
oThis involves evaluating the likely effects of non response based on experience and available information.
oFor example, married adult with young children are more likely to be at home than single or than married adults with no children. This information provides the basis for evaluating the effects of nonresponse due to not-at-homes in personal or telephone surveys.
THE SAMPLING SIZE

Marketing Research
Ver
ónic
a R
osen
do R
íos
©
1-62
Adjusting for non-response
Trend Analysis
oTrend analysis is an attempt to discern a trend between early and late respondents. This trend is projected to non-respondents to estimate where they stand on the characteristics of interest.
oFor example, the following table presents the results of several waves of a mail survey. The characteristic of interest is € spent on shopping in department stores in the last two months
THE SAMPLING SIZE

Marketing Research
Ver
ónic
a R
osen
do R
íos
©
1-63
Adjusting for non-response
Weighting
o Weighting attempts to account for non response by assigning differential weights to the data depending on the response rates.
o For example, in a survey on personal computers, the sample was stratified according to income. The response rates were 85%, 70%, and 40%, respectively, for the high, medium, and low income groups.
o In analyzing the data, these subgroups are assigned weights inversely proportional to their response rates. That is, the weights assigned would be 100/85, 100/70, 100/40, respectively, for the high, medium and low income groups.
o Although weighting can correct for the differential effects of nonresponse, it destroys the self-weighting nature of the sampling design and can introduce complications.
o It should be used with caution (Malhotra, 2012).
THE SAMPLING SIZE

Marketing Research
Ver
ónic
a R
osen
do R
íos
©
1-64
Adjusting for non-response
Imputation
o Imputation involves imputing, or assigning, the characteristic of interest to the non respondents based on the similarity of the variables available for both non respondents and respondents.
o For example, a respondent who does not report brand usage may be imputing the usage of a respondent with similar demographic characteristics.
o Often, there is a high correlation between the characteristics of interest and some other variable. In such cases, correlation can be used to predict the value of the characteristic for the non respondent (Malhotra, 2012).
THE SAMPLING SIZE
Marketing Research
Ver
ónic
a R
osen
do R
íos
©
1-65
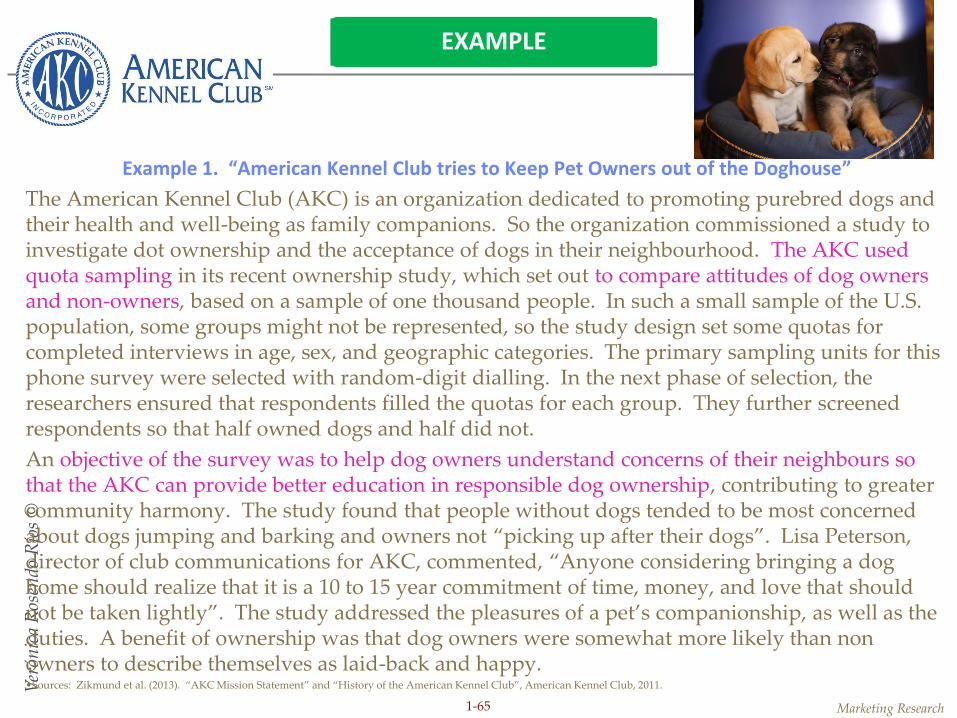
Example 1. “American Kennel Club tries to Keep Pet Owners out of the Doghouse”
The American Kennel Club (AKC) is an organization dedicated to promoting purebred dogs and their health and well-being as family companions. So the organization commissioned a study to investigate dot ownership and the acceptance of dogs in their neighbourhood. The AKC used quota sampling in its recent ownership study, which set out to compare attitudes of dog owners and non-owners, based on a sample of one thousand people. In such a small sample of the U.S. population, some groups might not be represented, so the study design set some quotas for completed interviews in age, sex, and geographic categories. The primary sampling units for this phone survey were selected with random-digit dialling. In the next phase of selection, the researchers ensured that respondents filled the quotas for each group. They further screened respondents so that half owned dogs and half did not.
An objective of the survey was to help dog owners understand concerns of their neighbours so that the AKC can provide better education in responsible dog ownership, contributing to greater community harmony. The study found that people without dogs tended to be most concerned about dogs jumping and barking and owners not “picking up after their dogs”. Lisa Peterson, director of club communications for AKC, commented, “Anyone considering bringing a dog home should realize that it is a 10 to 15 year commitment of time, money, and love that should not be taken lightly”. The study addressed the pleasures of a pet’s companionship, as well as the duties. A benefit of ownership was that dog owners were somewhat more likely than non owners to describe themselves as laid-back and happy. •Sources: Zikmund et al. (2013). “AKC Mission Statement” and “History of the American Kennel Club”, American Kennel Club, 2011.
EXAMPLE
Marketing Research
Ver
ónic
a R
osen
do R
íos
©
1-66
REFERENCES
• Brown, T.J., Suter, T. (2012). MR. South Western, Cenage Learning. USA.
• Hair, J.; Bush, R. & Ortinau, D. (2006). Marketing research. Within a changing environment. Revised International Edition (3rd Ed.). McGraw Hill, New York, USA.
• Malhotra, N.K. (1996) Marketing Research. An Applied Orientation. 2nd Edn. Prentice-Hall International. USA
• Rosendo-Rios, V., de Esteban, J., Antonovica, A. (2012). MR: Development ofTheoretical Concepts for Market Research I and II. South Western, Cenage Learning. USA
• Zikmund, W. G., Babin, B.J., Carr, J.C., Griffin, M.(2013) Business Research Methods. 9th Edition. South Western, Cenage Learning. USA
CHAPTER 10. THEORY AND PRACTICE OF SAMPLING

Marketing Research
Ver
ónic
a R
osen
do R
íos
©
Chapter 10
Theory and Practice of Sampling
Business Research Methods
Verónica Rosendo Ríos
Enrique Pérez del Campo