Theaters Financial Report December 2010
19
Theaters Financial Report December 2010 City of Tacoma Public Assembly Facilities Performing Arts Center Prepared by: Michele Tuong
Transcript of Theaters Financial Report December 2010

Theaters Financial Report December 2010
City of Tacoma
Public Assembly Facilities
Performing Arts Center
Prepared by: Michele Tuong


1
Table of Contents
Management’s Discussion and Analysis………………………………….………………….3
Financial Statements………………………………………………………………………...….9
Notification These financial statements are unaudited reports prepared primarily for the use of management. Immaterial differences
may occur due to rounding.

2
(This page intentionally left blank.)

3
Management’s Discussion and Analysis

4
City of Tacoma
Public Assembly Facilities
Performing Arts Center
December 31, 2010
Management’s Discussion and Analysis
The Performing Arts theater group is composed of two funds: 1) an operating fund, Fund 4190‐Oper, which includes the
Performing Arts Center Operating Fund, the Rialto Theater Fund, the Broadway Theater District Fund, and the
Pantages Theater Remodel Fund; and 2) a restricted fund, Fund 4190‐Panta, which includes the Pantages Investment
Fund.
Financial Highlights
Net operating expense is $1.1 million for the year ended December 31, 2010, compared to $1.8 million in 2009.
This is primarily due to $592,000 of bad debt expense recorded in 2009 for potential non‐payment of loan, and a
reduction of labor, supplies and services in 2010.
The current operating fund cash balance is $232,000, compared to $56,000 a year ago. The increase is partly due
to an increase of $150,000 in contributions for acquisition and major repairs of capital assets.
Assets totaled $19.4 million at December 31, 2010 compared to $19.1 million in 2009.
Financial Analysis – Condensed Consolidated Comparative Balance Sheets
Consolidated Balance Sheets
Increase
2010 2009 (Decrease)
Current assets 277,375$ 71,250$ 206,125$
Restricted assets 4,359,060 4,296,629 62,431
Capital assets 14,751,888 14,713,986 37,902
Total assets 19,388,323$ 19,081,865$ 306,458$
Current liabilities 1,179,912$ 1,248,494$ (68,582)$
Total liabilities 1,179,912 1,248,494 (68,582)
Invested in capital assets net of related debt 14,751,888 14,713,986 37,902
Restricted assets 4,359,060 4,296,629 62,431
Unrestricted (902,537) (1,177,244) 274,707
Total net assets 18,208,411 17,833,371 375,040
19,388,323$ 19,081,865$ 306,458$
As of December 31,

5
Current assets
The Theaters Group Operating Fund has a cash balance of $232,000 as of December 30, 2010, which is an increase of
$176,000 from a year ago. The BCPA loan balance is $557,000. In December 2010, a payment of $60,000 was received, of
which $25,000 was applied to interest and $35,000 to principal. The loan balance was reduced to $557,000 and the
allowance for doubtful loans receivable was adjusted to $557,000 to recognize the potential non‐payment at December
31, 2010. A request for a two‐year extension to December 31, 2011 was approved by Ordinance Number 27859.
The due from other funds account increased to $31,000 in 2010 compared to $460 in 2009. The increase is from a
contribution from the Limited Tax General Obligation (LTGO) Bond Fund for the acquisition of capital assets.
Restricted assets
The cash and equity in pooled investments is $3.5 million both at December 31, 2010 and December 31, 2009. Long‐term
investments consist of U.S. Treasury Strips purchased in 2000 for $387,000 and will have a value at maturity, in 2018, of
$1.1 million. These investments are restricted to exercise the Pantages Theater purchase option in 2018 or 2028. The
current balance of unamortized discount on long‐term investments is $362,000.
Capital assets
Capital assets, net of accumulated depreciation, are $38,000 more than in 2009. Building improvements and equipment
increased $518,000, and accumulated depreciation increased $481,000. The major projects which constitute the increase
are:
Theater On The Square rehearsal and associated rooms modification for $71,000
Pantages major water damage repairs for $183,000
Installation of new roof at Rialto for $29,000
Pantages carpet replacement for $16,000
Theater On The Square lobby lighting system upgrade for $64,000
Rialto lighting fixtures upgrade for $21,000
Pantages, Rialto, Theater On the Square HVAC system upgrade for $131,000
Other miscellaneous projects for a total of $3,000
Total liabilities
The total liabilities decreased $69,000 from 2009. The $35,000 principal loan repayment by the BCPA was applied to
reduce the Theater Fund’s loan with the General Fund, and to reduce the deferred revenue which was recorded to offset
the transaction recording the receivable from the BCPA.
6
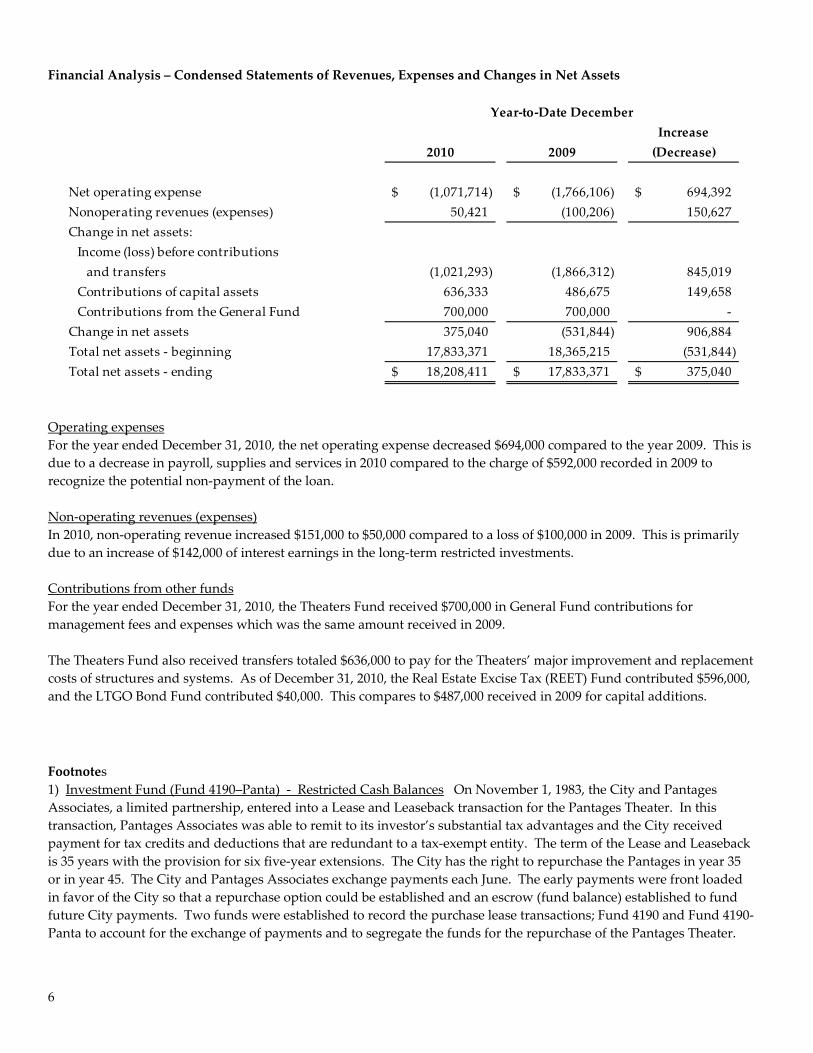
Financial Analysis – Condensed Statements of Revenues, Expenses and Changes in Net Assets
Increase
2010 2009 (Decrease)
Net operating expense (1,071,714)$ (1,766,106)$ 694,392$
Nonoperating revenues (expenses) 50,421 (100,206) 150,627
Change in net assets:
Income (loss) before contributions
and transfers (1,021,293) (1,866,312) 845,019
Contributions of capital assets 636,333 486,675 149,658
Contributions from the General Fund 700,000 700,000 ‐
Change in net assets 375,040 (531,844) 906,884
Total net assets ‐ beginning 17,833,371 18,365,215 (531,844)
Total net assets ‐ ending 18,208,411$ 17,833,371$ 375,040$
Year‐to‐Date December
Operating expenses
For the year ended December 31, 2010, the net operating expense decreased $694,000 compared to the year 2009. This is
due to a decrease in payroll, supplies and services in 2010 compared to the charge of $592,000 recorded in 2009 to
recognize the potential non‐payment of the loan.
Non‐operating revenues (expenses)
In 2010, non‐operating revenue increased $151,000 to $50,000 compared to a loss of $100,000 in 2009. This is primarily
due to an increase of $142,000 of interest earnings in the long‐term restricted investments.
Contributions from other funds
For the year ended December 31, 2010, the Theaters Fund received $700,000 in General Fund contributions for
management fees and expenses which was the same amount received in 2009.
The Theaters Fund also received transfers totaled $636,000 to pay for the Theaters’ major improvement and replacement
costs of structures and systems. As of December 31, 2010, the Real Estate Excise Tax (REET) Fund contributed $596,000,
and the LTGO Bond Fund contributed $40,000. This compares to $487,000 received in 2009 for capital additions.
Footnotes
1) Investment Fund (Fund 4190–Panta) ‐ Restricted Cash Balances On November 1, 1983, the City and Pantages
Associates, a limited partnership, entered into a Lease and Leaseback transaction for the Pantages Theater. In this
transaction, Pantages Associates was able to remit to its investor’s substantial tax advantages and the City received
payment for tax credits and deductions that are redundant to a tax‐exempt entity. The term of the Lease and Leaseback
is 35 years with the provision for six five‐year extensions. The City has the right to repurchase the Pantages in year 35
or in year 45. The City and Pantages Associates exchange payments each June. The early payments were front loaded
in favor of the City so that a repurchase option could be established and an escrow (fund balance) established to fund
future City payments. Two funds were established to record the purchase lease transactions; Fund 4190 and Fund 4190‐
Panta to account for the exchange of payments and to segregate the funds for the repurchase of the Pantages Theater.

7
2) BCPA loan for the Pantages Theater remodel In 2005, the City of Tacoma (City) and the Broadway Center for
Performing Arts (BCPA) entered into an agreement for the Pantages Theater remodel. The total cost was estimated to be
approximately $5 million. The City invested $1.3 million in December 2005. The BCPA was to invest the remaining $3.7
million by borrowing $2.5 million from the City and contributing cash of $1.2 million from its capital campaign. The
actual cost of the remodel came in under the original amount of $5.0 million and the unspent funds of $334,000 were
used to pay down the loan. As of December 31, 2010, $557,000 in principal on the loan is still owed, and a request was
approved by Ordinance Number 27859 to authorize a due date extension to December 31, 2011.

8
(This page intentionally left blank.)

9
Financial Statements

10
City of Tacoma, WashingtonPublic Assembly FacilityPerforming Arts Center
Balance Sheets (Unaudited)
As of December 31, Increase
2010 2009 (Decrease)
ASSETS
Current assets:
Cash and equity in pooled investments 231,841$ 56,312$ 175,529$
Due from other government units 557,000 592,000 (35,000)
Allowance for uncollectible accounts (557,000) (592,000) 35,000
Due from other funds 31,408 460 30,948
Prepaid Insurance 14,126 14,478 (352)
Total current assets 277,375 71,250 206,125
Restricted assets:
Cash and equity in pooled investments 3,464,219 3,491,391 (27,172)
Investments long‐term 1,256,415 1,215,855 40,560
Unamortized discount on investment long‐term (361,574) (410,617) 49,043
Total restricted assets 4,359,060 4,296,629 62,431
Capital assets:
Land 1,500,000 1,500,000 ‐
Buildings 17,081,934 16,733,730 348,204
Machinery and equipment 1,048,081 877,807 170,274
Other improvements 122,398 122,398 ‐
Less accumulated depreciation (5,000,525) (4,519,949) (480,576)
Total capital assets, net of accumulated
depreciation 14,751,888 14,713,986 37,902
Total assets 19,388,323$ 19,081,865$ 306,458$
LIABILITIES
Current liabilities:
Accrued wages and benefits payable ‐$ 586$ (586)$
Interest payable 2,948 4,596 (1,648)
Accounts payable 53,180 50,666 2,514
Advances from other funds 557,000 592,000 (35,000)
Deferred revenue 557,000 592,000 (35,000)
Due other funds 9,784 8,646 1,138
Total current liabilities 1,179,912 1,248,494 (68,582)
Total liabilities 1,179,912 1,248,494 (68,582)
NET ASSETS
Invested in capital assets net of related debt 14,751,888 14,713,986 37,902
Restricted assets 4,359,060 4,296,629 62,431
Unrestricted (902,537) (1,177,244) 274,707
Total net assets 18,208,411 17,833,371 375,040
TOTAL LIABILITIES AND NET ASSETS 19,388,323$ 19,081,865$ 306,458$
These statements should be read in conjunction with the Notes to Financial Statements contained in the City of Tacoma’s
appropriate Comprehensive Annual Financial Report (CAFR).

11
City of Tacoma, WashingtonPublic Assembly FacilitiesPerforming Arts Center
Statements of Revenues, Expenses and Changes in Net Assets (Unaudited)
Month of December Year‐to‐Date December Increase
2010 2009 2010 2009 (Decrease)
OPERATING EXPENSES
Personnel salaries and benefits ‐$ 1,549$ 2,192$ 19,362$ (17,170)$
Supplies, services and charges 102,243 88,384 623,946 694,223 (70,277)
Bad debts expense (35,000) ‐ (35,000) 592,000 (627,000)
Depreciation expense 40,111 38,377 480,576 460,521 20,055
Total operating expenses 107,354 128,310 1,071,714 1,766,106 (694,392)
Net operating expenses (107,354) (128,310) (1,071,714) (1,766,106) 694,392
NONOPERATING REVENUES (EXPENSES)
Investment earnings on cash and
pooled investments:
Operating Fund (664) 146 1,701 2,665 (964)
Restricted Fund 30,528 (160,014) 146,130 3,753 142,377
Pantages lease/leaseback ‐ ‐ (83,000) (83,000) ‐
Interest expense (973) (1,532) (14,410) (23,624) 9,214
Total nonoperating revenues (expenses) 28,891 (161,400) 50,421 (100,206) 150,627
CHANGE IN NET ASSETS
Net revenue (loss) before contributions
and transfers (78,463) (289,710) (1,021,293) (1,866,312) 845,019
Payment on loan 60,000 ‐ 60,000 147,793 (87,793)
Contributions of capital assets 140,679 108,675 636,333 486,675 149,658
Contributions from the General Fund 58,333 58,333 700,000 700,000 ‐
Change in net assets 180,549$ (122,702)$ 375,040 (531,844) 906,884
Total net assets ‐ beginning 17,833,371 18,365,215 (531,844)
Total net assets ‐ ending 18,208,411$ 17,833,371$ 375,040$
These statements should be read in conjunction with the Notes to Financial Statements contained in the City of Tacoma’s
appropriate Comprehensive Annual Financial Report (CAFR).

12
City of Tacoma, WashingtonPublic Assembly FacilitiesPerforming Arts Center
Statements of Cash Flows (Unaudited)
Year‐to‐Date December Increase
2010 2009 (Decrease)
CASH FLOWS FROM OPERATING ACTIVITIES
Receipts from customers (35,000)$ 592,000$ (627,000)$
Payments to employees (2,778) (18,776) 15,998
Payments to suppliers (615,890) (1,245,520) 629,630
Net cash provided (used) by operating activities (653,668) (672,296) 18,628
CASH FLOWS FROM NONCAPITAL
FINANCING ACTIVITIES
Contributions from General Fund 700,000 700,000 ‐
Net cash provided (used) by noncapital and related
financing activities 700,000 700,000 ‐
CASH FLOWS FROM CAPITAL AND
RELATED FINANCING ACTIVITIES
Pantages lease/leaseback (83,000) (83,000) ‐
Acquitision of capital assets (608,081) 1,928,999 (2,537,080)
Contribution of capital assets 636,333 486,675 149,658
Interest payable (16,058) (26,794) 10,736
Long‐term debt loan for Theater remodel 25,000 12,265 12,735
Net cash provided (used) by capital and related
financing activities (45,806) 2,318,145 (2,363,951)
CASH FLOWS FROM INVESTING ACTIVITIES
Investment earnings on cash and pooled investments 147,831 6,418 141,413
Net cash provided (used) by investing activities 147,831 6,418 141,413
Net change cash and cash equivalents 148,357 2,352,267 (2,203,910)
Cash and equity in pooled investments ‐ beginning 3,547,703 1,195,436 2,352,267
Cash and equity in pooled investments ‐ ending 3,696,060$ 3,547,703$ 148,357$
These statements should be read in conjunction with the Notes to Financial Statements contained in the City of Tacoma’s
appropriate Comprehensive Annual Financial Report (CAFR).

13
City of Tacoma, WashingtonPublic Assembly FacilitiesPerforming Arts Center
Statements of Cash Flows (Unaudited)
Year‐to‐Date December Increase
2010 2009 (Decrease)
Reconciliation of cash and equity in pooled
investments to balance sheet:
Cash and equity in pooled investments in Operating Fund 231,841$ 56,312$ 175,529$
Restricted cash and equity in pooled investments
in Investments Fund 3,464,219 3,491,391 (27,172)
Total cash and equity in pooled investments 3,696,060$ 3,547,703$ 148,357$
Reconciliation of operating income to net cash
provided (used) by operating activities:
Operating income (expense) (1,071,714)$ (1,766,106)$ 694,392$
Adjustments to reconcile operating income to net
from operating activities:
Depreciation expense 480,576 460,521 20,055
Allowance for uncollectible accounts (35,000) 592,000 (627,000)
Deferred revenue (35,000) 592,000 (627,000)
Due from other government units 35,000 (592,000) 627,000
Due to / due from other funds (29,810) 8,022 (37,832)
Prepaid expenses 352 (14,478) 14,830
Change in accounts payable 2,514 47,159 (44,645)
Accrued wages and benefits payable (586) 586 (1,172)
Total adjustments 418,046 1,093,810 (675,764)
Net cash provided (used) by operating activities (653,668)$ (672,296)$ 18,628$
These statements should be read in conjunction with the Notes to Financial Statements contained in the City of Tacoma’s
appropriate Comprehensive Annual Financial Report (CAFR).

14
(This page intentionally left blank.)

15