
The XENON1T Dark Matter Experiment2 Abstract The XENON1T experiment at the Laboratori Na-zionali del...
22
Eur. Phys. J. C manuscript No. (will be inserted by the editor) The XENON1T Dark Matter Experiment E. Aprile 1 , J. Aalbers 2 , F. Agostini 3,4 , M. Alfonsi 5 , F. D. Amaro 6 , M. Anthony 1 , B. Antunes 6 , F. Arneodo 7 , M. Balata 3 , P. Barrow 8 , L. Baudis 8 , B. Bauermeister 9 , M. L. Benabderrahmane 7 , T. Berger 10 , A. Breskin 11 , P. A. Breur 2 , A. Brown 2 , E. Brown 10 , S. Bruenner 12 , G. Bruno 3 , R. Budnik 11 , L. Bütikofer 13,a , J. Calvén 9 , J. M. R. Cardoso 6 , M. Cervantes 14 , A. Chiarini 4 , D. Cichon 12 , D. Coderre 13 , A. P. Colijn 2,d , J. Conrad 9,b , R. Corrieri 3 , J. P. Cussonneau 15 , M. P. Decowski 2 , P. de Perio 1 , P. Di Gangi 4 , A. Di Giovanni 7 , S. Diglio 15 , J.-M. Disdier 3 , M. Doets 2 , E. Duchovni 11 , G. Eurin 12 , J. Fei 16 , A. D. Ferella 9 , A. Fieguth 17 , D. Florin 8 , D. Front 11 , W. Fulgione 3,18 , A. Gallo Rosso 3 , M. Galloway 8 , F. Gao 1 , M. Garbini 4 , C. Geis 5 , K.-L. Giboni 1 , L. W. Goetzke 1 , L. Grandi 19 , Z. Greene 1 , C. Grignon 5 , C. Hasterok 12 , E. Hogenbirk 2 , C. Huhmann 17 , R. Itay 11 , A. James 8 , B. Kaminsky 13,a , S. Kazama 8 , G. Kessler 8 , A. Kish 8 , H. Landsman 11 , R. F. Lang 14 , D. Lellouch 11 , L. Levinson 11 , Q. Lin 1 , S. Lindemann 13,12 , M. Lindner 12 , F. Lombardi 16 , J. A. M. Lopes 6,c , R. Maier 8 , A. Manfredini 11 , I. Maris 7 , T. Marrodán Undagoitia 12 , J. Masbou 15 , F. V. Massoli 4 , D. Masson 14 , D. Mayani 8 , M. Messina 7,1,e , K. Micheneau 15 , A. Molinario 3 , K. Morå 9 , M. Murra 17 , J. Naganoma 20 , K. Ni 16 , U. Oberlack 5 , D. Orlandi 3 , R. Othegraven 5 , P. Pakarha 8 , S. Parlati 3 , B. Pelssers 9 , R. Persiani 15 , F. Piastra 8 , J. Pienaar 19,14 , V. Pizzella 12 , M.-C. Piro 10 , G. Plante 1 , N. Priel 11 , D. Ramírez García 13,5 , L. Rauch 12 , S. Reichard 14 , C. Reuter 8,14 , A. Rizzo 1 , S. Rosendahl 17 , N. Rupp 12 , J. M. F. dos Santos 6 , R. Saldahna 19 , G. Sartorelli 4 , M. Scheibelhut 5 , S. Schindler 5 , J. Schreiner 12 , M. Schumann 13,f , L. Scotto Lavina 21 , M. Selvi 4 , P. Shagin 20 , E. Shockley 19 , M. Silva 6 , H. Simgen 12 , M. v. Sivers 13,a , M. Stern 1 , A. Stein 22 , D. Tatananni 1 , L. Tatananni 3 , D. Thers 15 , A. Tiseni 2 , G. Trinchero 18 , C. Tunnell 19 , N. Upole 19 , M. Vargas 17 , O. Wack 12 , R. Walet 2 , H. Wang 22 , Z. Wang 3 , Y. Wei 16,8 , C. Weinheimer 17 , C. Wittweg 17 , J. Wulf 8 , J. Ye 16 , Y. Zhang 1 (XENON Collaboration g ). 1 Physics Department, Columbia University, New York, NY 10027, USA 2 Nikhef and the University of Amsterdam, Science Park, 1098XG Amsterdam, Netherlands 3 INFN-Laboratori Nazionali del Gran Sasso and Gran Sasso Science Institute, 67100 L’Aquila, Italy 4 Department of Physics and Astrophysics, University of Bologna and INFN-Bologna, 40126 Bologna, Italy 5 Institut für Physik & Exzellenzcluster PRISMA, Johannes Gutenberg-Universität Mainz, 55099 Mainz, Germany 6 LIBPhys, Department of Physics, University of Coimbra, 3004-516 Coimbra, Portugal 7 New York University Abu Dhabi, Abu Dhabi, United Arab Emirates 8 Physik Institut, University of Zurich, 8057 Zurich, Switzerland 9 Oskar Klein Centre, Department of Physics, Stockholm University, AlbaNova, Stockholm SE-10691, Sweden 10 Department of Physics, Applied Physics and Astronomy, Rensselaer Polytechnic Institute, Troy, NY 12180, USA 11 Department of Particle Physics and Astrophysics, Weizmann Institute of Science, Rehovot 7610001, Israel 12 Max-Planck-Institut für Kernphysik, 69117 Heidelberg, Germany 13 Physikalisches Institut, Universität Freiburg, 79104 Freiburg, Germany 14 Department of Physics and Astronomy, Purdue University, West Lafayette, IN 47907, USA 15 SUBATECH, IMT Atlantique, CNRS/IN2P3, Université de Nantes, Nantes 44307, France 16 Department of Physics, University of California, San Diego, CA 92093, USA 17 Institut für Kernphysik, Westfälische Wilhelms-Universität Münster, 48149 Münster, Germany 18 INFN-Torino and Osservatorio Astrofisico di Torino, 10125 Torino, Italy 19 Department of Physics & Kavli Institute of Cosmological Physics, University of Chicago, Chicago, IL 60637, USA 20 Department of Physics and Astronomy, Rice University, Houston, TX 77005, USA 21 LPNHE, Université Pierre et Marie Curie, Université Paris Diderot, CNRS/IN2P3, Paris 75252, France 22 Physics & Astronomy Department, University of California, Los Angeles, CA 90095, USA arXiv:1708.07051v1 [astro-ph.IM] 23 Aug 2017
Transcript of The XENON1T Dark Matter Experiment2 Abstract The XENON1T experiment at the Laboratori Na-zionali del...

Eur. Phys. J. C manuscript No.(will be inserted by the editor)
The XENON1T Dark Matter Experiment
E. Aprile1, J. Aalbers2, F. Agostini3,4, M. Alfonsi5, F. D. Amaro6, M. Anthony1,B. Antunes6, F. Arneodo7, M. Balata3, P. Barrow8, L. Baudis8, B. Bauermeister9,M. L. Benabderrahmane7, T. Berger10, A. Breskin11, P. A. Breur2, A. Brown2,E. Brown10, S. Bruenner12, G. Bruno3, R. Budnik11, L. Bütikofer13,a, J. Calvén9,J. M. R. Cardoso6, M. Cervantes14, A. Chiarini4, D. Cichon12, D. Coderre13,A. P. Colijn2,d, J. Conrad9,b, R. Corrieri3, J. P. Cussonneau15, M. P. Decowski2,P. de Perio1, P. Di Gangi4, A. Di Giovanni7, S. Diglio15, J.-M. Disdier3, M. Doets2,E. Duchovni11, G. Eurin12, J. Fei16, A. D. Ferella9, A. Fieguth17, D. Florin8, D. Front11,W. Fulgione3,18, A. Gallo Rosso3, M. Galloway8, F. Gao1, M. Garbini4, C. Geis5,K.-L. Giboni1, L. W. Goetzke1, L. Grandi19, Z. Greene1, C. Grignon5, C. Hasterok12,E. Hogenbirk2, C. Huhmann17, R. Itay11, A. James8, B. Kaminsky13,a, S. Kazama8,G. Kessler8, A. Kish8, H. Landsman11, R. F. Lang14, D. Lellouch11, L. Levinson11,Q. Lin1, S. Lindemann13,12, M. Lindner12, F. Lombardi16, J. A. M. Lopes6,c, R. Maier8,A. Manfredini11, I. Maris7, T. Marrodán Undagoitia12, J. Masbou15, F. V. Massoli4,D. Masson14, D. Mayani8, M. Messina7,1,e, K. Micheneau15, A. Molinario3, K. Morå9,M. Murra17, J. Naganoma20, K. Ni16, U. Oberlack5, D. Orlandi3, R. Othegraven5,P. Pakarha8, S. Parlati3, B. Pelssers9, R. Persiani15, F. Piastra8, J. Pienaar19,14,V. Pizzella12, M.-C. Piro10, G. Plante1, N. Priel11, D. Ramírez García13,5, L. Rauch12,S. Reichard14, C. Reuter8,14, A. Rizzo1, S. Rosendahl17, N. Rupp12, J. M. F. dos Santos6,R. Saldahna19, G. Sartorelli4, M. Scheibelhut5, S. Schindler5, J. Schreiner12,M. Schumann13,f, L. Scotto Lavina21, M. Selvi4, P. Shagin20, E. Shockley19, M. Silva6,H. Simgen12, M. v. Sivers13,a, M. Stern1, A. Stein22, D. Tatananni1, L. Tatananni3,D. Thers15, A. Tiseni2, G. Trinchero18, C. Tunnell19, N. Upole19, M. Vargas17, O. Wack12,R. Walet2, H. Wang22, Z. Wang3, Y. Wei16,8, C. Weinheimer17, C. Wittweg17, J. Wulf8,J. Ye16, Y. Zhang1 (XENON Collaborationg).1Physics Department, Columbia University, New York, NY 10027, USA2Nikhef and the University of Amsterdam, Science Park, 1098XG Amsterdam, Netherlands3INFN-Laboratori Nazionali del Gran Sasso and Gran Sasso Science Institute, 67100 L’Aquila, Italy4Department of Physics and Astrophysics, University of Bologna and INFN-Bologna, 40126 Bologna, Italy5Institut für Physik & Exzellenzcluster PRISMA, Johannes Gutenberg-Universität Mainz, 55099 Mainz, Germany6LIBPhys, Department of Physics, University of Coimbra, 3004-516 Coimbra, Portugal7New York University Abu Dhabi, Abu Dhabi, United Arab Emirates8Physik Institut, University of Zurich, 8057 Zurich, Switzerland9Oskar Klein Centre, Department of Physics, Stockholm University, AlbaNova, Stockholm SE-10691, Sweden10Department of Physics, Applied Physics and Astronomy, Rensselaer Polytechnic Institute, Troy, NY 12180, USA11Department of Particle Physics and Astrophysics, Weizmann Institute of Science, Rehovot 7610001, Israel12Max-Planck-Institut für Kernphysik, 69117 Heidelberg, Germany13Physikalisches Institut, Universität Freiburg, 79104 Freiburg, Germany14Department of Physics and Astronomy, Purdue University, West Lafayette, IN 47907, USA15SUBATECH, IMT Atlantique, CNRS/IN2P3, Université de Nantes, Nantes 44307, France16Department of Physics, University of California, San Diego, CA 92093, USA17Institut für Kernphysik, Westfälische Wilhelms-Universität Münster, 48149 Münster, Germany18INFN-Torino and Osservatorio Astrofisico di Torino, 10125 Torino, Italy19Department of Physics & Kavli Institute of Cosmological Physics, University of Chicago, Chicago, IL 60637, USA20Department of Physics and Astronomy, Rice University, Houston, TX 77005, USA21LPNHE, Université Pierre et Marie Curie, Université Paris Diderot, CNRS/IN2P3, Paris 75252, France22Physics & Astronomy Department, University of California, Los Angeles, CA 90095, USA
arX
iv:1
708.
0705
1v1
[as
tro-
ph.I
M]
23
Aug
201
7
2
Abstract The XENON1T experiment at the Laboratori Na-zionali del Gran Sasso (LNGS) is the first WIMP dark mat-ter detector operating with a liquid xenon target mass abovethe ton-scale. Out of its 3.2 t liquid xenon inventory, 2.0 tconstitute the active target of the dual-phase time projec-tion chamber. The scintillation and ionization signals fromparticle interactions are detected with low-background pho-tomultipliers. This article describes the XENON1T instru-ment and its subsystems as well as strategies to achieve anunprecedented low background level. First results on the de-tector response and the performance of the subsystems arealso presented.
1 Introduction
The fact that dark matter exists, as evidenced by a largenumber of indirect observations in astronomy and cosmol-ogy [1], is seen as a striking indication that there must benew physics beyond the Standard Model (BSM) of particlephysics. The postulated dark matter particle has not beendirectly observed yet, and theoretical predictions about itsmass, couplings and production mechanisms span a largeparameter space [2]. A well-motivated candidate, whicharises naturally in several BSM models, is the weakly inter-acting massive particle (WIMP) [3]. It might be directly de-tectable in sensitive Earth-based detectors, as it is expectedto scatter off the detector’s target nuclei. Most models pre-dict an exponentially falling nuclear recoil spectrum, withmean energies of a few keV [4].
The XENON dark matter project aims at the detec-tion of WIMP dark matter with dual-phase time projec-tion chambers filled with a liquid xenon (LXe) target.The first WIMP search conducted with XENON10 [5, 6]featured a target mass of 14 kg (25 kg total). It was fol-lowed by XENON100 (62 kg target, 161 kg total mass) [7],which published competitive results on spin-independent [8,9], spin-dependent [10] and other WIMP-nucleon interac-tions [11–13], axions and axion-like particles [14], and chal-lenged the interpretation of the DAMA/LIBRA signal as be-ing due to leptophilic dark matter interacting with atomicelectrons [15–17].
The XENON1T experiment described in this article islocated underground in Hall B of the Laboratori Nazionalidel Gran Sasso (LNGS), Italy, at a depth of 3600 meter wa-ter equivalent. With its large target mass of 2.0 t (2000 kg) it
aAlso at Albert Einstein Center for Fundamental Physics, University ofBern, 3012 Bern, SwitzerlandbWallenberg Academy FellowcAlso at Coimbra Engineering Institute, Coimbra, [email protected]@[email protected]@lngs.infn.it
aims at probing spin-independent WIMP-nucleon scatteringcross sections of 1.6×10−47 cm2 at a WIMP mass of mχ =
50 GeV/c2, with an exposure of 2.0 t× y [18]. At low WIMPmasses, the sensitivity approaches the predicted “neutrinofloor” [19] caused by background events from the coherentscattering of solar 8B neutrinos off the xenon nuclei. Thefirst dark matter search results from XENON1T (from “sci-ence run 0”) probe spin-independent WIMP-nucleon crosssections below 1×10−46 cm2 for the first time [20].
Most XENON1T subsystems were designed such thatthey can also support a significantly larger dark matter de-tector, with a target of ∼6 t. This phase of the project,XENONnT, is being prepared during XENON1T data tak-ing to allow for a rapid exchange of the larger instrument af-ter the science goals of XENON1T will have been reached.XENONnT aims at improving the spin-independent WIMPsensitivity by another order of magnitude compared toXENON1T [18].
The article is structured as follows: in section 2, theXENON1T experiment with all its subsystems is introducedin detail. Section 3 presents selected results from detectorcommissioning and from science run 0, and section 4 pro-vides an outlook.
2 The XENON1T Experiment
This section describes the XENON1T detector. The dual-phase TPC (section 2.1) is installed inside a double-walledvacuum cryostat (section 2.1.4) in the center of a large wa-ter tank. The tank serves as passive shield as well as aCherenkov muon veto (section 2.2.1). A three-floor buildingaccommodates all auxiliary systems. These include the sys-tems to cool (section 2.1.4), store, and purify the xenon gas(section 2.1.5), the cryogenic distillation column for kryp-ton removal (section 2.2.3), the data acquisition system (sec-tion 2.4) as well as the control and monitoring systems forthe entire experiment (section 2.5). The TPC calibration sys-tems are installed on the purification system as well as on thetop of the water shield (section 2.3).
2.1 Time Projection Chamber
This section describes the working principle and design ofthe XENON1T TPC, the photosensors (photomultipliers,PMTs) to register particle interactions, and the systems thathandle the ∼3.2 t of xenon in liquid and gaseous form. Allmaterials and components constituting the TPC were se-lected for a low intrinsic radioactivity (see section 2.2.2).
2.1.1 Working Principle
Dual-phase TPCs [21] were first used for WIMP dark mattersearches by the ZEPLIN-II [22] and XENON10 [5] collab-
3
Am
plitu
de Dark Matter WIMP
Background (β, γ)
Background (neutron)
Top Screen
Anode
Gate
Cathode
Bottom Screen
DriftField
Top PMTs
Time
e–
S1
S2
Bottom PMTs
S2S1
Liquid Xe
Gas Xe
Am
plitu
deA
mpl
itude
Time
Time
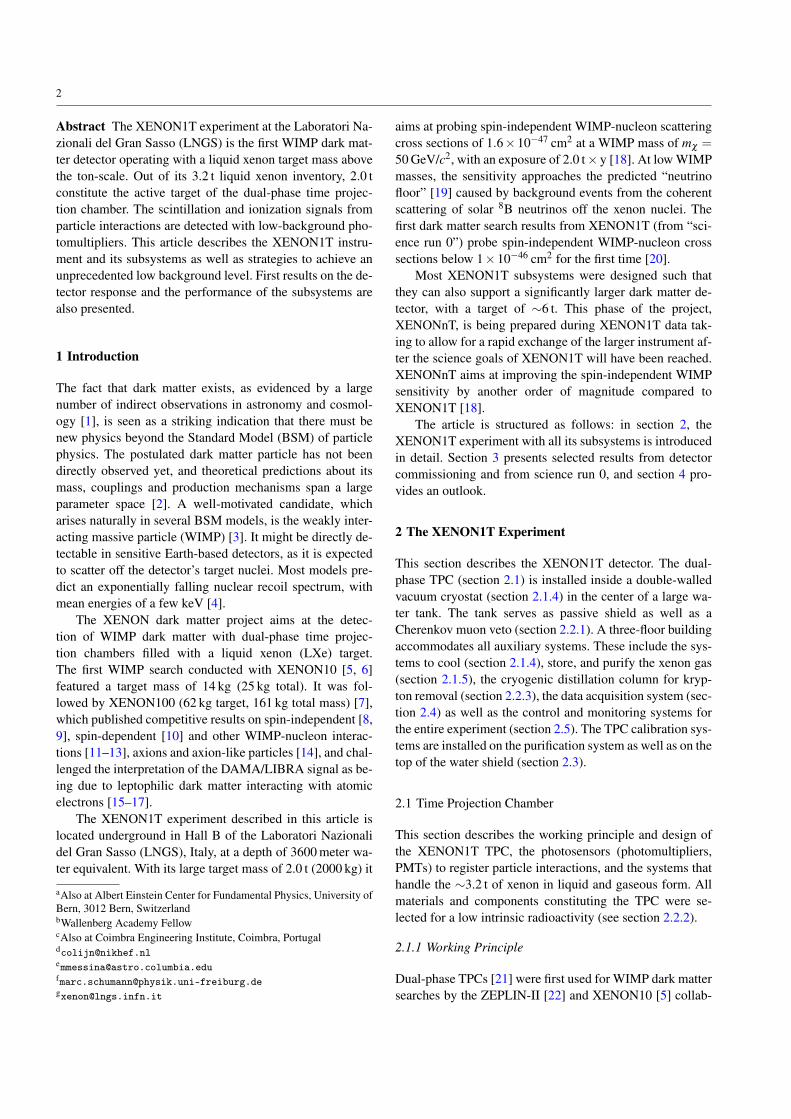
Fig. 1 Working principle of a dual-phase LXe TPC: The prompt scin-tillation light (S1) generated in the LXe is recorded by PMTs installedabove and below the target. The same PMTs also measure the delayedsecondary-light signal S2, which is created by proportional scintilla-tion induced by ionization electrons (e−) in the gas phase. A set ofTPC electrodes is used to establish the required electric fields. The in-teraction position can be reconstructed in 3-dimensions by means ofthe S2-signal pattern observed by the top PMTs (lateral) and the timedifference between S1 and S2 (depth). Background events are rejectedby the charge to light (S2/S1) ratio and the scatter multiplicity (numberof S2 signals), as indicated on the panels on the right.
orations and are now successfully employed by number ofexperiments [23, 24]. The working principle is illustratedin figure 1: particles entering a cylindrical LXe target canscatter off xenon nuclei (in case of WIMPs or neutrons) orcan interact with atomic electrons (γ rays and β electrons),generating nuclear recoils or electronic recoils, respectively.The recoils excite and ionize the LXe; some energy is lostto heat. The partition into the different energy-loss chan-nels depends on the recoil type and energy and can there-fore be used to distinguish a WIMP signal from electronicrecoil backgrounds, provided that the resulting excitationand ionization signals can be measured independently [25].The Xe∗2 excimers, that are eventually formed, de-excite un-der the emission of 178 nm scintillation light. In dual-phaseTPCs, this light signal (S1) is observed by photosensors in-stalled above and below the target. An electric field acrossthe target, established between the negatively biased cathodeat the bottom of the TPC and the gate electrode at groundpotential at the top, is used to move the ionization electronsaway from the interaction site, drifting them to the liquid-gas interface. A second field, generated between the gateand the positively-biased anode, extracts them into the gasphase and provides the electrons sufficient energy to exciteand ionize the gas atoms. This generates a secondary scin-tillation signal (S2) which is proportional to the number ofextracted electrons [26]. The position of the initial interac-tion, as well as the scatter multiplicity, can be reconstructedin 3-dimensions from the position and number of S2 signalsobserved by the top photosensors and the S1-S2 time differ-
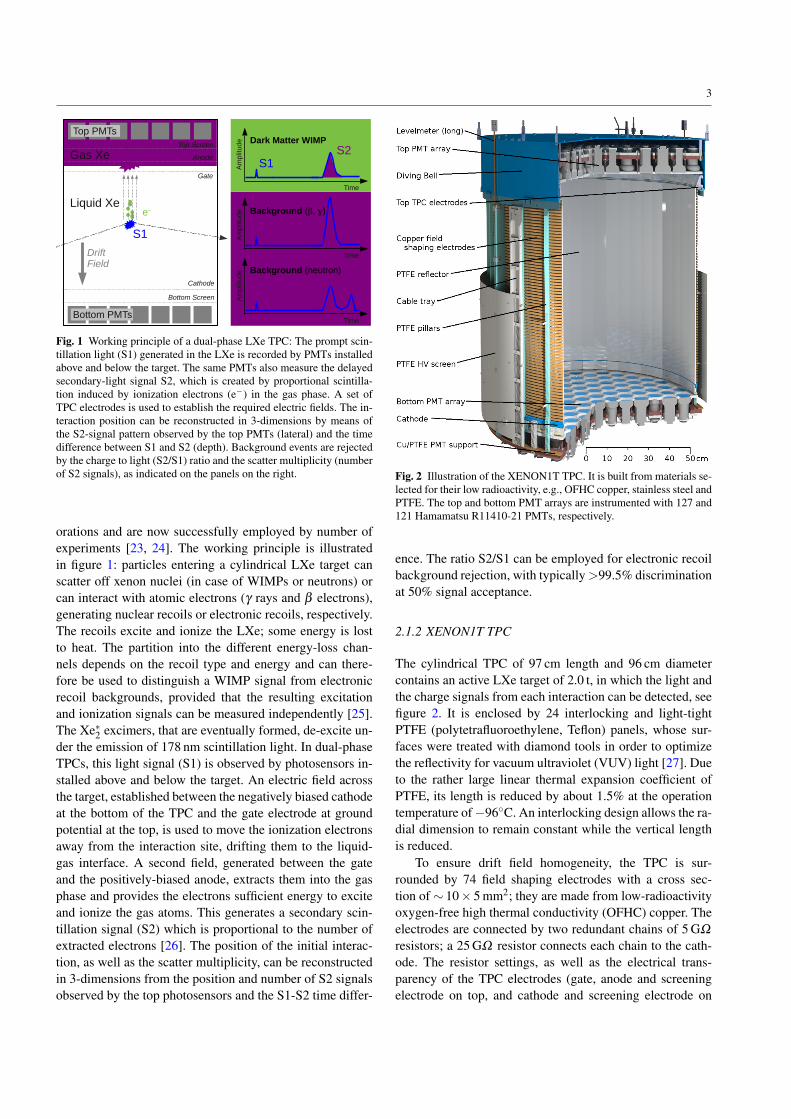
Fig. 2 Illustration of the XENON1T TPC. It is built from materials se-lected for their low radioactivity, e.g., OFHC copper, stainless steel andPTFE. The top and bottom PMT arrays are instrumented with 127 and121 Hamamatsu R11410-21 PMTs, respectively.
ence. The ratio S2/S1 can be employed for electronic recoilbackground rejection, with typically >99.5% discriminationat 50% signal acceptance.
2.1.2 XENON1T TPC
The cylindrical TPC of 97 cm length and 96 cm diametercontains an active LXe target of 2.0 t, in which the light andthe charge signals from each interaction can be detected, seefigure 2. It is enclosed by 24 interlocking and light-tightPTFE (polytetrafluoroethylene, Teflon) panels, whose sur-faces were treated with diamond tools in order to optimizethe reflectivity for vacuum ultraviolet (VUV) light [27]. Dueto the rather large linear thermal expansion coefficient ofPTFE, its length is reduced by about 1.5% at the operationtemperature of −96C. An interlocking design allows the ra-dial dimension to remain constant while the vertical lengthis reduced.
To ensure drift field homogeneity, the TPC is sur-rounded by 74 field shaping electrodes with a cross sec-tion of ∼ 10× 5 mm2; they are made from low-radioactivityoxygen-free high thermal conductivity (OFHC) copper. Theelectrodes are connected by two redundant chains of 5 GΩ
resistors; a 25 GΩ resistor connects each chain to the cath-ode. The resistor settings, as well as the electrical trans-parency of the TPC electrodes (gate, anode and screeningelectrode on top, and cathode and screening electrode on
4
Table 1 Specifications of the five TPC electrodes. The bottom screening electrode features a single wire installed perpendicularly mid-way to allothers to minimize elastic deformation of the frame. The last column indicates the vertical position of the electrodes inside the TPC. The distancebetween the top (bottom) screen to the top (bottom) PMTs is 11 mm (12 mm).
TPC Electrode Type Material Wire Diameter Pitch/Cell opening Transparency Position
Top screen hex etched stainless steel 178 µm 10.2 mm 96.5% 63 mmAnode hex etched stainless steel 178 µm 3.5 mm 89.8% 5 mmGate hex etched stainess steel 127 µm 3.5 mm 92.7% 0 mmCathode parallel wires Au plated stainless steel 216 µm 7.75 mm 97.2% −969 mmBottom screen parallel wires Au plated stainless steel 216 µm 7.75 mm 97.2% −1017 mm
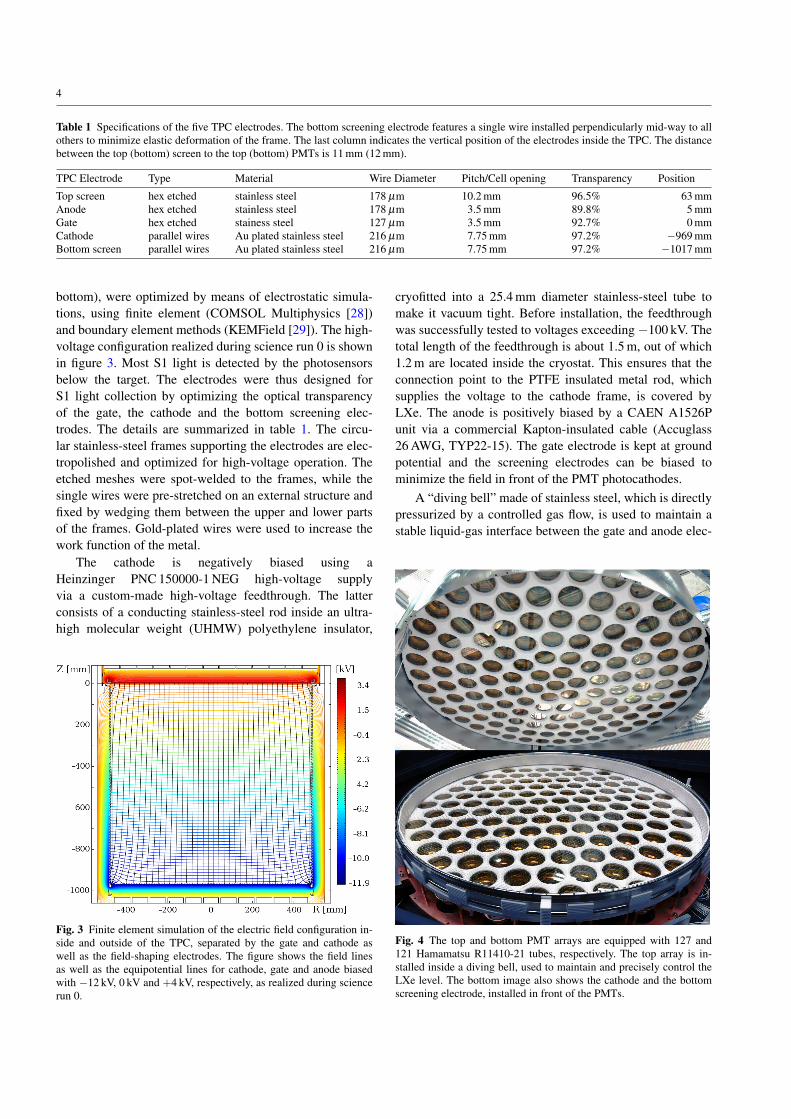
bottom), were optimized by means of electrostatic simula-tions, using finite element (COMSOL Multiphysics [28])and boundary element methods (KEMField [29]). The high-voltage configuration realized during science run 0 is shownin figure 3. Most S1 light is detected by the photosensorsbelow the target. The electrodes were thus designed forS1 light collection by optimizing the optical transparencyof the gate, the cathode and the bottom screening elec-trodes. The details are summarized in table 1. The circu-lar stainless-steel frames supporting the electrodes are elec-tropolished and optimized for high-voltage operation. Theetched meshes were spot-welded to the frames, while thesingle wires were pre-stretched on an external structure andfixed by wedging them between the upper and lower partsof the frames. Gold-plated wires were used to increase thework function of the metal.
The cathode is negatively biased using aHeinzinger PNC 150000-1 NEG high-voltage supplyvia a custom-made high-voltage feedthrough. The latterconsists of a conducting stainless-steel rod inside an ultra-high molecular weight (UHMW) polyethylene insulator,
Fig. 3 Finite element simulation of the electric field configuration in-side and outside of the TPC, separated by the gate and cathode aswell as the field-shaping electrodes. The figure shows the field linesas well as the equipotential lines for cathode, gate and anode biasedwith −12 kV, 0 kV and +4 kV, respectively, as realized during sciencerun 0.
cryofitted into a 25.4 mm diameter stainless-steel tube tomake it vacuum tight. Before installation, the feedthroughwas successfully tested to voltages exceeding −100 kV. Thetotal length of the feedthrough is about 1.5 m, out of which1.2 m are located inside the cryostat. This ensures that theconnection point to the PTFE insulated metal rod, whichsupplies the voltage to the cathode frame, is covered byLXe. The anode is positively biased by a CAEN A1526Punit via a commercial Kapton-insulated cable (Accuglass26 AWG, TYP22-15). The gate electrode is kept at groundpotential and the screening electrodes can be biased tominimize the field in front of the PMT photocathodes.
A “diving bell” made of stainless steel, which is directlypressurized by a controlled gas flow, is used to maintain astable liquid-gas interface between the gate and anode elec-
Fig. 4 The top and bottom PMT arrays are equipped with 127 and121 Hamamatsu R11410-21 tubes, respectively. The top array is in-stalled inside a diving bell, used to maintain and precisely control theLXe level. The bottom image also shows the cathode and the bottomscreening electrode, installed in front of the PMTs.
5
X [cm]-40 -20 0 20 40
Y [
cm]
-40
-20
0
20
40
2830323436384042
0 1 2 34
5
6
7
8
9
10
11
12
13
14
15
1617
1819202122
23
24
25
26
27
28
29
30
31
32
33
3435
36 37 3839
40
41
42
43
44
45
46
47
48
4950
51525354
55
56
57
58
59
60
61
62
63
6465
66 67 6869
70
71
72
73
74
75
76
77787980
81
82
83
84
85
86
87
88
8990 91
92
93
94
95
96
97
9899100
101
102
103
104
105
106
107108 109
110
111
112
113114115
116
117
118
119120
121
122
123124
125126
Top array
X [cm]-40 -20 0 20 40
Y [
cm]
-40
-20
0
20
40
28
30
32
34
36
38
40
42
127128
129130
131
132133
134135
136137
138139
140141
142143
144145
146147
148
149150
151152
153154
155156
157158
159160
161162
163164
165166
167168
169
170171
172173
174175
176177
178179
180181
182183
184185
186187
188189
190191
192
193194
195196
197198
199200
201202
203204
205206
207208
209210
211212
213214
215
216217
218219
220221
222223
224225
226227
228229
230231
232233
234
235236
237238
239240
241242
243244
245246
247
Bottom array
Qua
ntum
eff
icie
ncy
[%]
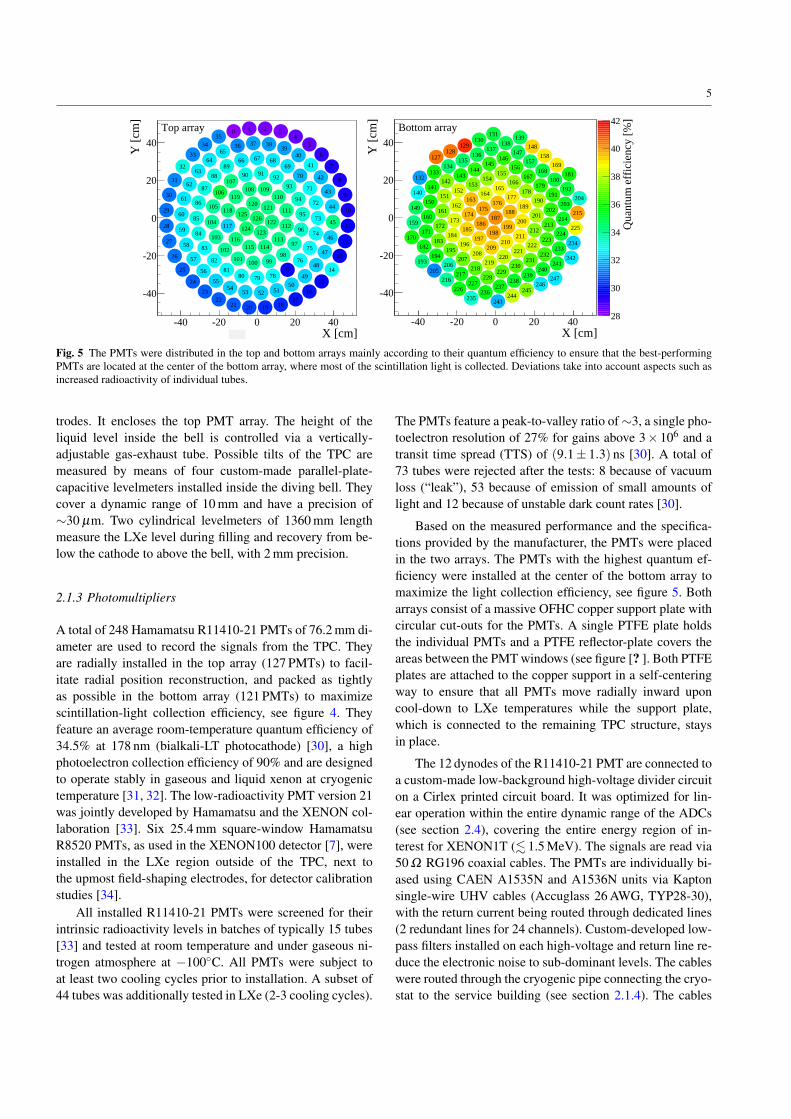
Fig. 5 The PMTs were distributed in the top and bottom arrays mainly according to their quantum efficiency to ensure that the best-performingPMTs are located at the center of the bottom array, where most of the scintillation light is collected. Deviations take into account aspects such asincreased radioactivity of individual tubes.
trodes. It encloses the top PMT array. The height of theliquid level inside the bell is controlled via a vertically-adjustable gas-exhaust tube. Possible tilts of the TPC aremeasured by means of four custom-made parallel-plate-capacitive levelmeters installed inside the diving bell. Theycover a dynamic range of 10 mm and have a precision of∼30 µm. Two cylindrical levelmeters of 1360 mm lengthmeasure the LXe level during filling and recovery from be-low the cathode to above the bell, with 2 mm precision.
2.1.3 Photomultipliers
A total of 248 Hamamatsu R11410-21 PMTs of 76.2 mm di-ameter are used to record the signals from the TPC. Theyare radially installed in the top array (127 PMTs) to facil-itate radial position reconstruction, and packed as tightlyas possible in the bottom array (121 PMTs) to maximizescintillation-light collection efficiency, see figure 4. Theyfeature an average room-temperature quantum efficiency of34.5% at 178 nm (bialkali-LT photocathode) [30], a highphotoelectron collection efficiency of 90% and are designedto operate stably in gaseous and liquid xenon at cryogenictemperature [31, 32]. The low-radioactivity PMT version 21was jointly developed by Hamamatsu and the XENON col-laboration [33]. Six 25.4 mm square-window HamamatsuR8520 PMTs, as used in the XENON100 detector [7], wereinstalled in the LXe region outside of the TPC, next tothe upmost field-shaping electrodes, for detector calibrationstudies [34].
All installed R11410-21 PMTs were screened for theirintrinsic radioactivity levels in batches of typically 15 tubes[33] and tested at room temperature and under gaseous ni-trogen atmosphere at −100C. All PMTs were subject toat least two cooling cycles prior to installation. A subset of44 tubes was additionally tested in LXe (2-3 cooling cycles).
The PMTs feature a peak-to-valley ratio of ∼3, a single pho-toelectron resolution of 27% for gains above 3× 10⁶ and atransit time spread (TTS) of (9.1± 1.3) ns [30]. A total of73 tubes were rejected after the tests: 8 because of vacuumloss (“leak”), 53 because of emission of small amounts oflight and 12 because of unstable dark count rates [30].
Based on the measured performance and the specifica-tions provided by the manufacturer, the PMTs were placedin the two arrays. The PMTs with the highest quantum ef-ficiency were installed at the center of the bottom array tomaximize the light collection efficiency, see figure 5. Botharrays consist of a massive OFHC copper support plate withcircular cut-outs for the PMTs. A single PTFE plate holdsthe individual PMTs and a PTFE reflector-plate covers theareas between the PMT windows (see figure [? ]. Both PTFEplates are attached to the copper support in a self-centeringway to ensure that all PMTs move radially inward uponcool-down to LXe temperatures while the support plate,which is connected to the remaining TPC structure, staysin place.
The 12 dynodes of the R11410-21 PMT are connected toa custom-made low-background high-voltage divider circuiton a Cirlex printed circuit board. It was optimized for lin-ear operation within the entire dynamic range of the ADCs(see section 2.4), covering the entire energy region of in-terest for XENON1T (. 1.5 MeV). The signals are read via50 Ω RG196 coaxial cables. The PMTs are individually bi-ased using CAEN A1535N and A1536N units via Kaptonsingle-wire UHV cables (Accuglass 26 AWG, TYP28-30),with the return current being routed through dedicated lines(2 redundant lines for 24 channels). Custom-developed low-pass filters installed on each high-voltage and return line re-duce the electronic noise to sub-dominant levels. The cableswere routed through the cryogenic pipe connecting the cryo-stat to the service building (see section 2.1.4). The cables
6
were potted into Conflat flanges (RH seals), with certifiedleak rates below 1×10⁻⁸ mbar l/s, to ensure that the coaxialshields, as well as the high-voltage returns, remain separatedfrom each other and from the detector ground. Installationwas eased by integrating two custom-made low-backgroundconnectors for each bunch of 24 coaxial or 26 high-voltagecables (24 PMTs plus 2 return lines) [35, 36]. One connectorwas placed above the TPC and the second one in front of theConflat flanges in the gaseous xenon.
2.1.4 Cryogenics
This section describes the cryostat, which contains the TPCwith the LXe target, and the cryogenic system for gas lique-faction and compensating for heat losses.
Cryostat and Support Frame The TPC is installed inside adouble-walled, cylindrical stainless-steel cryostat made oflow-radioactivity material [37]. The inner vessel is 1960 mm
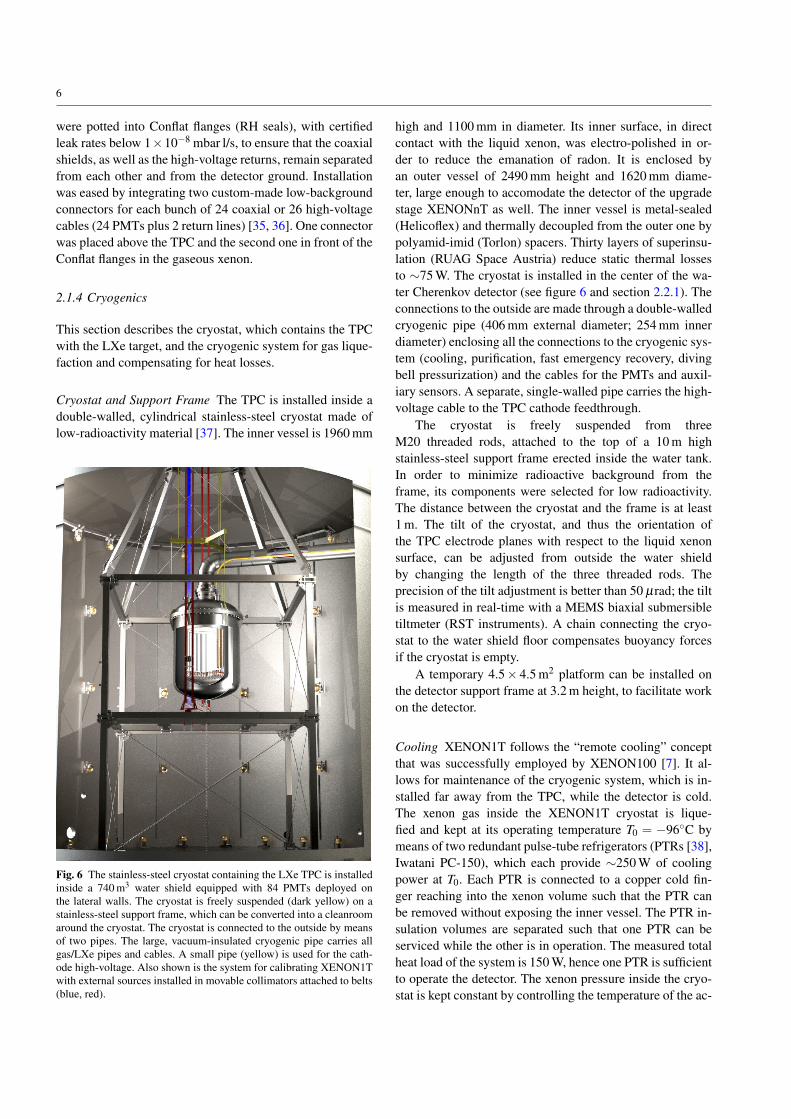
Fig. 6 The stainless-steel cryostat containing the LXe TPC is installedinside a 740 m3 water shield equipped with 84 PMTs deployed onthe lateral walls. The cryostat is freely suspended (dark yellow) on astainless-steel support frame, which can be converted into a cleanroomaround the cryostat. The cryostat is connected to the outside by meansof two pipes. The large, vacuum-insulated cryogenic pipe carries allgas/LXe pipes and cables. A small pipe (yellow) is used for the cath-ode high-voltage. Also shown is the system for calibrating XENON1Twith external sources installed in movable collimators attached to belts(blue, red).
high and 1100 mm in diameter. Its inner surface, in directcontact with the liquid xenon, was electro-polished in or-der to reduce the emanation of radon. It is enclosed byan outer vessel of 2490 mm height and 1620 mm diame-ter, large enough to accomodate the detector of the upgradestage XENONnT as well. The inner vessel is metal-sealed(Helicoflex) and thermally decoupled from the outer one bypolyamid-imid (Torlon) spacers. Thirty layers of superinsu-lation (RUAG Space Austria) reduce static thermal lossesto ∼75 W. The cryostat is installed in the center of the wa-ter Cherenkov detector (see figure 6 and section 2.2.1). Theconnections to the outside are made through a double-walledcryogenic pipe (406 mm external diameter; 254 mm innerdiameter) enclosing all the connections to the cryogenic sys-tem (cooling, purification, fast emergency recovery, divingbell pressurization) and the cables for the PMTs and auxil-iary sensors. A separate, single-walled pipe carries the high-voltage cable to the TPC cathode feedthrough.
The cryostat is freely suspended from threeM20 threaded rods, attached to the top of a 10 m highstainless-steel support frame erected inside the water tank.In order to minimize radioactive background from theframe, its components were selected for low radioactivity.The distance between the cryostat and the frame is at least1 m. The tilt of the cryostat, and thus the orientation ofthe TPC electrode planes with respect to the liquid xenonsurface, can be adjusted from outside the water shieldby changing the length of the three threaded rods. Theprecision of the tilt adjustment is better than 50 µrad; the tiltis measured in real-time with a MEMS biaxial submersibletiltmeter (RST instruments). A chain connecting the cryo-stat to the water shield floor compensates buoyancy forcesif the cryostat is empty.
A temporary 4.5× 4.5 m2 platform can be installed onthe detector support frame at 3.2 m height, to facilitate workon the detector.
Cooling XENON1T follows the “remote cooling” conceptthat was successfully employed by XENON100 [7]. It al-lows for maintenance of the cryogenic system, which is in-stalled far away from the TPC, while the detector is cold.The xenon gas inside the XENON1T cryostat is lique-fied and kept at its operating temperature T0 = −96C bymeans of two redundant pulse-tube refrigerators (PTRs [38],Iwatani PC-150), which each provide ∼250 W of coolingpower at T0. Each PTR is connected to a copper cold fin-ger reaching into the xenon volume such that the PTR canbe removed without exposing the inner vessel. The PTR in-sulation volumes are separated such that one PTR can beserviced while the other is in operation. The measured totalheat load of the system is 150 W, hence one PTR is sufficientto operate the detector. The xenon pressure inside the cryo-stat is kept constant by controlling the temperature of the ac-
7
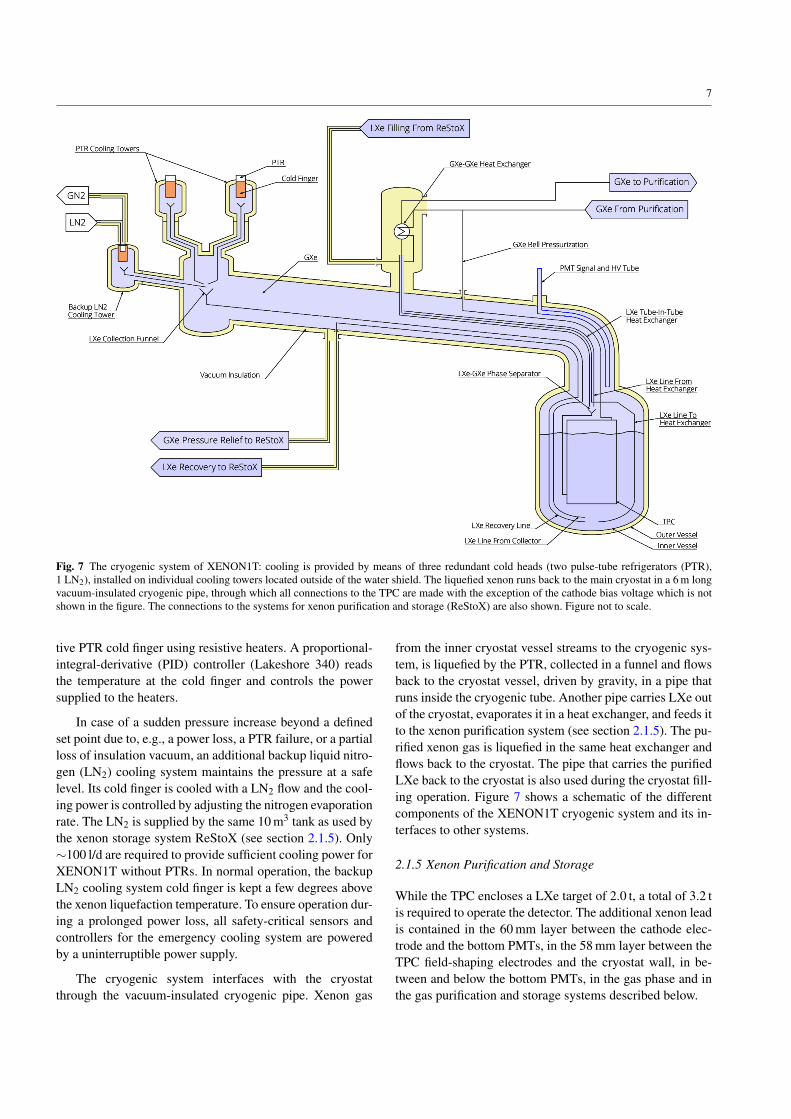
Fig. 7 The cryogenic system of XENON1T: cooling is provided by means of three redundant cold heads (two pulse-tube refrigerators (PTR),1 LN2), installed on individual cooling towers located outside of the water shield. The liquefied xenon runs back to the main cryostat in a 6 m longvacuum-insulated cryogenic pipe, through which all connections to the TPC are made with the exception of the cathode bias voltage which is notshown in the figure. The connections to the systems for xenon purification and storage (ReStoX) are also shown. Figure not to scale.
tive PTR cold finger using resistive heaters. A proportional-integral-derivative (PID) controller (Lakeshore 340) readsthe temperature at the cold finger and controls the powersupplied to the heaters.
In case of a sudden pressure increase beyond a definedset point due to, e.g., a power loss, a PTR failure, or a partialloss of insulation vacuum, an additional backup liquid nitro-gen (LN2) cooling system maintains the pressure at a safelevel. Its cold finger is cooled with a LN2 flow and the cool-ing power is controlled by adjusting the nitrogen evaporationrate. The LN2 is supplied by the same 10 m3 tank as used bythe xenon storage system ReStoX (see section 2.1.5). Only∼100 l/d are required to provide sufficient cooling power forXENON1T without PTRs. In normal operation, the backupLN2 cooling system cold finger is kept a few degrees abovethe xenon liquefaction temperature. To ensure operation dur-ing a prolonged power loss, all safety-critical sensors andcontrollers for the emergency cooling system are poweredby a uninterruptible power supply.
The cryogenic system interfaces with the cryostatthrough the vacuum-insulated cryogenic pipe. Xenon gas
from the inner cryostat vessel streams to the cryogenic sys-tem, is liquefied by the PTR, collected in a funnel and flowsback to the cryostat vessel, driven by gravity, in a pipe thatruns inside the cryogenic tube. Another pipe carries LXe outof the cryostat, evaporates it in a heat exchanger, and feeds itto the xenon purification system (see section 2.1.5). The pu-rified xenon gas is liquefied in the same heat exchanger andflows back to the cryostat. The pipe that carries the purifiedLXe back to the cryostat is also used during the cryostat fill-ing operation. Figure 7 shows a schematic of the differentcomponents of the XENON1T cryogenic system and its in-terfaces to other systems.
2.1.5 Xenon Purification and Storage
While the TPC encloses a LXe target of 2.0 t, a total of 3.2 tis required to operate the detector. The additional xenon leadis contained in the 60 mm layer between the cathode elec-trode and the bottom PMTs, in the 58 mm layer between theTPC field-shaping electrodes and the cryostat wall, in be-tween and below the bottom PMTs, in the gas phase and inthe gas purification and storage systems described below.

8
Fig. 8 Piping and instrumentation diagram (P&ID) of the XENON1T purification system. The system also serves as the main interface to the othercomponents of the gas-handling system (see figure 9) and allows the insertion of short-lived isotopes for calibration. Some instrumentation suchas temperature and pressure sensors, as well as several access ports are omitted for clarity. The path of the xenon gas during standard purificationis indicated in blue.
Fig. 9 The gas-handling system of XENON1T consists of the cryogenic system (cooling), the purification system (online removal of electronega-tive impurities), the cryogenic distillation column (natKr removal), ReStoX (LXe storage, filling and recovery), the gas bottle rack (injection of gasinto the system) and gas analytics station (gas chromatograph). The cryostat inside the water shield accomodates the TPC.
The total xenon inventory from various suppliers com-prises research-grade gas with a low concentration of im-purities, especially natKr. The impurity level was measuredin sets of four gas bottles by gas chromatography (custom-optimized Trace GC Ultra from Thermo Fisher) [39]. In casea higher level than specified was detected, the bottles were
purified using the distillation system (section 2.2.3) beforeadding the gas to the storage system.
Xenon Purification Electronegative impurities, such as wa-ter or oxygen, absorb scintillation light and reduce the num-ber of ionization electrons by capture in an electron drift-time dependent fashion. These impurities are constantly out-gassing into the xenon from all detector components. There-

9
fore, the gas must be continuously purified to reduce the im-purities to the 10−9 O2-equivalent level (ppb). Driven by gastransfer pumps, LXe is extracted from the cryostat at its bot-tom, next to the LXe condensate inlet from the cryogenicsystem. The LXe is evaporated in a heat exchanger system,made from a concentric tube in combination with a plateheat exchanger, which also cools the return gas from the pu-rification system [40]. It is 96% efficient and reduces theheat input into the cryostat to only 0.39 W/slpm (standardliters per minute).
Two redundant and independently serviceable purifica-tion loops are operated in parallel, see figure 8. The com-ponents of one loop can be serviced or replaced withoutstopping the xenon purification. Each loop consists of agas transfer pump (CHART QDrive; one loop is equippedwith two pumps to improve operational conditions and sta-bility), a mass-flow controller (MKS 1579A) and a high-temperature rare-gas purifier (getter, SAES PS4-MT50-R);the latter removes oxide, carbide and nitride impurities byforming irreducible chemical bonds with the getter material(zirconium). The high-capacity magnetic-resonance QDrivepumps feature a hermetically sealed pump volume and trans-fer the gas by means of externally-driven pistons oscillatingin a compression space. Since all pistons, motors and valvesare unlubricated, the QDrive is well-suited for high-purityapplications. As the re-condensed, purified LXe flows backdirectly into the TPC, at two opposite locations below thecathode electrode (see also figure 7), a low 222Rn emanationof purification system is crucial for a low ER background,see also section 2.2.
More than 30 actuated pneumatic valves, shown in fig-ures 8 and 9 (green), are controlled by the slow control sys-tem (section 2.5). Besides state-changes of individual com-ponents, it allows for automated changes between differentoperation modes. For safety reasons, a few manual valveswere added at selected locations. Various pressure, temper-ature and other sensors are used to monitor the key param-eters and instruments of the system, which was constructedfrom electropolished components and can be baked to 80-120C. Oil-free vacuum pumps allow for the evacuation ofeither the whole system or of individual sections, to easeservicing.
The purification efficiency can be monitored by a TigerOptics HALO+ H2O monitor, which measures the waterconcentration in the xenon gas, and can be useful for de-tecting possible leaks. The purification system is also usedto inject calibration sources into the detector, which are dis-solved in the xenon gas (see section 2.3).
Xenon Storage In the past, LXe detectors were filled by liq-uefying xenon from the gas phase and emptied by evap-orating the liquid target. This technique poses operationalchallenges for experiments at the multi-ton scale. Filling
Fig. 10 Drawing of the xenon storage facility ReStoX, which can holdup to 7.6 t of xenon in liquid or gaseous state. The condenser in thecenter of the 2.1 m diameter sphere provides >3 kW of cooling power.
XENON1T starting with xenon gas at 15C would require∼2 months using 250 W of cooling power. In addition, afast recovery of the LXe in case of an emergency would beimpossible.
The newly developed xenon-storage systemReStoX [41] addresses these problems. It consists of avacuum-insulated stainless-steel sphere with 2.1 m diameter(4.95 m3 volume), see figure 10. Its volume and the wallthickness of 28 mm allow for storage of up to 7.6 t ofxenon as a liquid, as a gas and even as a super-criticalfluid (being capable to withstand pressures up to 73 bar).Superinsulation and minimized thermal contact between theinner and the outer cryostat spheres reduce the external heatload to ∼50 W.
Cooling is achieved by means of LN2, provided by anexternal 10 m3 dewar. A total of 16 LN2 lines are weldedto the outer surface of the inner vessel to cool down thesphere. Sixteen thin stainless-steel fins inside the volumeadditionally increase the heat exchange. In normal opera-tion, i.e., while storing xenon in the liquid state, a condenserand heater system mounted in the center of the vessel pre-cisely controls the pressure and ensures that the entrancepipe does not get blocked by frozen xenon. Its cooling powerof >3 kW is distributed over a total of 4.3 m2 of copper sur-face.
The vessel and its cryogenic valves are all metal sealedand electropolished to allow for the storage of pre-purifiedLXe without sacrificing the target purity. To this end,ReStoX is connected to the detector (for filling and fast re-covery) and to the purification system via an independentheat exchanger (for purification of the gas in ReStoX). Thelatter also provides access to the distillation column (for
10
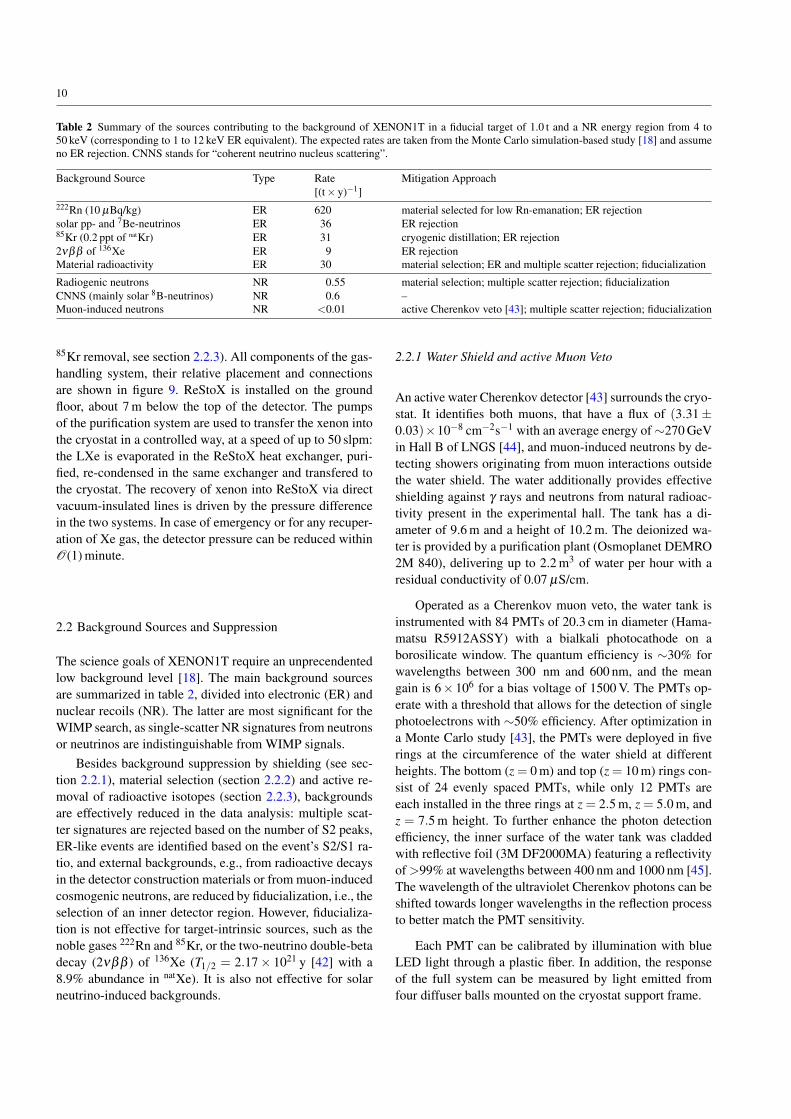
Table 2 Summary of the sources contributing to the background of XENON1T in a fiducial target of 1.0 t and a NR energy region from 4 to50 keV (corresponding to 1 to 12 keV ER equivalent). The expected rates are taken from the Monte Carlo simulation-based study [18] and assumeno ER rejection. CNNS stands for “coherent neutrino nucleus scattering”.
Background Source Type Rate Mitigation Approach[(t× y)−1]
222Rn (10 µBq/kg) ER 620 material selected for low Rn-emanation; ER rejectionsolar pp- and 7Be-neutrinos ER 36 ER rejection85Kr (0.2 ppt of natKr) ER 31 cryogenic distillation; ER rejection2νββ of 136Xe ER 9 ER rejectionMaterial radioactivity ER 30 material selection; ER and multiple scatter rejection; fiducialization
Radiogenic neutrons NR 0.55 material selection; multiple scatter rejection; fiducializationCNNS (mainly solar 8B-neutrinos) NR 0.6 –Muon-induced neutrons NR <0.01 active Cherenkov veto [43]; multiple scatter rejection; fiducialization
85Kr removal, see section 2.2.3). All components of the gas-handling system, their relative placement and connectionsare shown in figure 9. ReStoX is installed on the groundfloor, about 7 m below the top of the detector. The pumpsof the purification system are used to transfer the xenon intothe cryostat in a controlled way, at a speed of up to 50 slpm:the LXe is evaporated in the ReStoX heat exchanger, puri-fied, re-condensed in the same exchanger and transfered tothe cryostat. The recovery of xenon into ReStoX via directvacuum-insulated lines is driven by the pressure differencein the two systems. In case of emergency or for any recuper-ation of Xe gas, the detector pressure can be reduced withinO(1) minute.
2.2 Background Sources and Suppression
The science goals of XENON1T require an unprecendentedlow background level [18]. The main background sourcesare summarized in table 2, divided into electronic (ER) andnuclear recoils (NR). The latter are most significant for theWIMP search, as single-scatter NR signatures from neutronsor neutrinos are indistinguishable from WIMP signals.
Besides background suppression by shielding (see sec-tion 2.2.1), material selection (section 2.2.2) and active re-moval of radioactive isotopes (section 2.2.3), backgroundsare effectively reduced in the data analysis: multiple scat-ter signatures are rejected based on the number of S2 peaks,ER-like events are identified based on the event’s S2/S1 ra-tio, and external backgrounds, e.g., from radioactive decaysin the detector construction materials or from muon-inducedcosmogenic neutrons, are reduced by fiducialization, i.e., theselection of an inner detector region. However, fiducializa-tion is not effective for target-intrinsic sources, such as thenoble gases 222Rn and 85Kr, or the two-neutrino double-betadecay (2νββ ) of 136Xe (T1/2 = 2.17 × 10²¹ y [42] with a8.9% abundance in natXe). It is also not effective for solarneutrino-induced backgrounds.
2.2.1 Water Shield and active Muon Veto
An active water Cherenkov detector [43] surrounds the cryo-stat. It identifies both muons, that have a flux of (3.31 ±0.03)×10−8 cm−2s−1 with an average energy of ∼270 GeVin Hall B of LNGS [44], and muon-induced neutrons by de-tecting showers originating from muon interactions outsidethe water shield. The water additionally provides effectiveshielding against γ rays and neutrons from natural radioac-tivity present in the experimental hall. The tank has a di-ameter of 9.6 m and a height of 10.2 m. The deionized wa-ter is provided by a purification plant (Osmoplanet DEMRO2M 840), delivering up to 2.2 m3 of water per hour with aresidual conductivity of 0.07 µS/cm.
Operated as a Cherenkov muon veto, the water tank isinstrumented with 84 PMTs of 20.3 cm in diameter (Hama-matsu R5912ASSY) with a bialkali photocathode on aborosilicate window. The quantum efficiency is ∼30% forwavelengths between 300 nm and 600 nm, and the meangain is 6× 10⁶ for a bias voltage of 1500 V. The PMTs op-erate with a threshold that allows for the detection of singlephotoelectrons with ∼50% efficiency. After optimization ina Monte Carlo study [43], the PMTs were deployed in fiverings at the circumference of the water shield at differentheights. The bottom (z = 0 m) and top (z = 10 m) rings con-sist of 24 evenly spaced PMTs, while only 12 PMTs areeach installed in the three rings at z = 2.5 m, z = 5.0 m, andz = 7.5 m height. To further enhance the photon detectionefficiency, the inner surface of the water tank was claddedwith reflective foil (3M DF2000MA) featuring a reflectivityof >99% at wavelengths between 400 nm and 1000 nm [45].The wavelength of the ultraviolet Cherenkov photons can beshifted towards longer wavelengths in the reflection processto better match the PMT sensitivity.
Each PMT can be calibrated by illumination with blueLED light through a plastic fiber. In addition, the responseof the full system can be measured by light emitted fromfour diffuser balls mounted on the cryostat support frame.

11
2.2.2 Detector Construction Materials
In order to reduce ER and NR background events, that arisefrom radioactive decays in the detector materials, all mate-rials of the TPC, the cryostat and the support structure wereselected for a low content of radioactive isotopes. MonteCarlo simulations were used to define the acceptable lev-els. The radioactivity measurements were performed us-ing low-background high-purity germanium spectrometersof the XENON collaboration [46–48]. The most sensitivespectrometers, located at the LNGS underground laboratory,can reach sensitivities down to the µBq/kg level. In addi-tion, standard analytical mass spectroscopy methods (ICP-MS, GD-MS) were employed at LNGS and at external com-panies. The measured radioactivity levels of the PMTs aresummarized in [33]; that of all other materials and compo-nents in [37].
Most materials in contact with the liquid or gaseousxenon during standard operation were additionally selectedfor a low 222Rn emanation rate. This includes most compo-nents of the TPC, the inner cryostat and its connection pipes,the cryogenic system with its heat exchangers and the pu-rification system. The LXe storage vessel and the cryogenicdistillation column are irrelevant sources of Rn-emanationas they are not continuously connected to the TPC. Thus all222Rn originating from these systems will rapidly decay to anegligible level. Even though the emanation rate is usuallyrelated to the 226Ra content of a material, which is obtainedby γ spectrometry, it must be measured independently sincein most cases emanation is dominated by surface impurities.The measurements were performed according to the proce-dure described in [49] using the 222Rn emanation facility atMPIK Heidelberg [50] and a similar one at LNGS. The re-sults are summarized in [51].
To remove radioactive isotopes from surfaces, all TPCcomponents were cleaned after production according to thefollowing procedures: after degreasing, all copper pieceswere pickled in a solution of 1% H2SO4 and 3% H2O2and passivated in a 1% citric acid (C6H8O7) solution. Af-terwards the pieces were rinsed with de-ionized water andethanol. The large stainless-steel pieces (diving bell, TPCelectrode frames) were electropolished and cleaned withacetone, de-ionized water and ethanol. All small stainless-steel components (screws, rods, etc.) were degreased, pick-led in a solution of both 20% HNO3 and 2% HF, and finallypassivated in a 15% HNO3 solution before rinsing with de-ionized water and ethanol. The degreased PTFE componentswere immersed in a 5% HNO3 solution and rinsed with de-ionized water and ethanol. Care was taken to not touch thereflecting TPC surfaces during cleaning, and all PTFE partswere stored under vacuum after the cleaning procedure. Incases of size limitations, the HNO3-step was omitted and thesample was instead immersed in ethanol for a few hours.
The TPC was assembled above ground at LNGS, insidea custom-designed ISO 5 class cleanroom with a measuredparticle concentration just above the ISO 4 specification, us-ing a movable installation and transport frame. The double-bagged TPC (aluminized mylar), fixed to the transportationframe, was moved to the underground laboratory by truckand attached to the top flange of the inner cryostat. A mobileclass ISO 6 softwall cleanroom (4.5× 4.5 m2) was erectedaround the cryostat for this purpose.
2.2.3 Krypton Removal by Cryogenic Distillation
Natural krypton, which contains the β -decaying isotope85Kr (T1/2 = 10.76 y) at the 2× 10⁻¹¹ level, is removed bycryogenic distillation, exploiting the 10.8 times larger vaporpressure of Kr compared to Xe at −96C. In a cryogenicdistillation column, the more volatile Kr will hence be col-lected at the top while Kr-depleted Xe will be collected atthe bottom. Given a natKr/Xe concentration of <0.02 ppm incommercial high-purity Xe gas, a Kr reduction factor around105 is required to reach the design goal of natKr/Xe<0.2 ppt.To achieve this goal, a distillation column using 2.8 m ofstructured stainless-steel package material (Sulzer, type EX)was built following ultra-high vacuum standards. The totalheight of the XENON1T distillation system is 5.5 m (seefigure 11). The system is described in [52] and can be op-erated stably at Xe gas flows up to 18 slpm, correspondingto 6.5 kg/h.
The Kr particle flux inside the column and the separa-tion efficiency can be monitored using the short-lived iso-tope 83mKr as a tracer [53, 54]. After installation at LNGS,a separation factor of (6.4+1.9
−1.4)× 105 was measured [52,55], reaching a concentration natKr/Xe< 0.026 ppt and
Package tube
Input condenser
Reboiler
Top condenser
Heat exchanger
Gas inlet
Gas outlet(low Kr)
Off-gas(high Kr)
5.5m
Fig. 11 The custom-designed XENON1T cryogenic distillation col-umn. The outer vessels for vacuum insulation and most of the columnpackage material were omitted for clarity.
12
demonstrating that the system fulfills the requirements forXENON1T and for the future XENONnT. Such low con-centrations are measured with a gas chromatography systemcoupled to a mass spectrometer (rare gas mass spectrome-ter, RGMS [56]). The possibility for online removal of Rnwas demonstrated first in a single stage setup [57] and byinstalling a shortened (1 m package material) version of thefinal cryogenic distillation column in reverse and losslessmode on XENON100. A radon reduction factor of >27 (at95% CL) was achieved [58].
For the most efficient purification, the entire gas in-ventory would have to be transferred from ReStoX (sec-tion 2.1.5), via the distillation column, into the evacuatedcryostat. This procedure would last for ∼3 weeks, for a totalXe amount of 3.2 t. However, to allow for data acquisitionwith a fully operational dual-phase TPC while at the sametime reducing the Kr concentration, the XENON1T col-laboration has successfully established the online removalof Kr. To this end, 7% of the purification gas flow wasrouted through the distillation column and the Kr-enrichedgas (0.07% of the total flow) was removed from the sys-tem. After continuously operating in this mode for 70 days,with an initial measured natKr/Xe concentration of 60 ppb,a final concentration of (0.36± 0.06) ppt was measured byRGMS. This concentration is the lowest ever achieved ina LXe dark matter experiment. Being only a factor of ∼2above the XENON1T design goal, the concentration wassufficient for a first science run [20].
2.3 TPC Calibration System
The PMT gains are calibrated by stimulating the emissionof single photoelectrons from the photocathode by meansof low-level light pulses from a blue LED. A total of fourLEDs, installed in the counting room for easy accessibil-ity, are simultaneously controlled by a 4-channel BNC-505pulse generator. The light is guided into the cryostat via fouroptical fibers using SMA-SMA optical feedthroughs. Stan-dard plastic fibers (980 µm diameter core, light-tight jacket)are used externally. Bakeable synthetic silica fibers (600 µmcore, −190C to +350C) transfer the light to the cryostat.To reach uniform illumination of all PMTs and to minimizethe calibration time, each of the silica fibers is split intosix thin plastic fibers (250 µm core) that feed the light intothe TPC at various angular positions and heights around thefield cage. A periodic external signal triggers the pulser andthe TPC DAQ system; the LED calibration procedure is theonly measurement which is not self-triggered (see also sec-tion 2.4).
Neutrons with energies around 2.2 MeV and 2.7 MeVfrom a Deuterium-Deuterium (DD) fusion neutron genera-tor (NSD Gradel Fusion NSD-35-DD-C-W-S) are used to
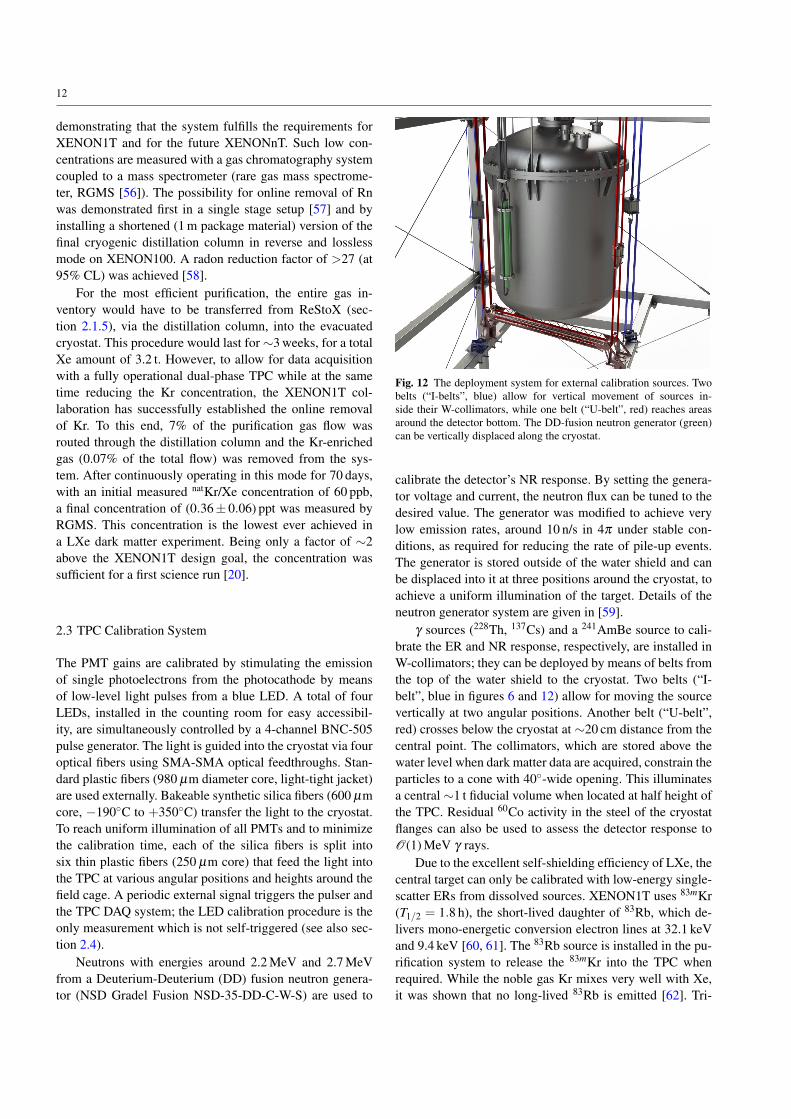
Fig. 12 The deployment system for external calibration sources. Twobelts (“I-belts”, blue) allow for vertical movement of sources in-side their W-collimators, while one belt (“U-belt”, red) reaches areasaround the detector bottom. The DD-fusion neutron generator (green)can be vertically displaced along the cryostat.
calibrate the detector’s NR response. By setting the genera-tor voltage and current, the neutron flux can be tuned to thedesired value. The generator was modified to achieve verylow emission rates, around 10 n/s in 4π under stable con-ditions, as required for reducing the rate of pile-up events.The generator is stored outside of the water shield and canbe displaced into it at three positions around the cryostat, toachieve a uniform illumination of the target. Details of theneutron generator system are given in [59].
γ sources (228Th, 137Cs) and a 241AmBe source to cali-brate the ER and NR response, respectively, are installed inW-collimators; they can be deployed by means of belts fromthe top of the water shield to the cryostat. Two belts (“I-belt”, blue in figures 6 and 12) allow for moving the sourcevertically at two angular positions. Another belt (“U-belt”,red) crosses below the cryostat at ∼20 cm distance from thecentral point. The collimators, which are stored above thewater level when dark matter data are acquired, constrain theparticles to a cone with 40-wide opening. This illuminatesa central ∼1 t fiducial volume when located at half height ofthe TPC. Residual 60Co activity in the steel of the cryostatflanges can also be used to assess the detector response toO(1) MeV γ rays.
Due to the excellent self-shielding efficiency of LXe, thecentral target can only be calibrated with low-energy single-scatter ERs from dissolved sources. XENON1T uses 83mKr(T1/2 = 1.8 h), the short-lived daughter of 83Rb, which de-livers mono-energetic conversion electron lines at 32.1 keVand 9.4 keV [60, 61]. The 83Rb source is installed in the pu-rification system to release the 83mKr into the TPC whenrequired. While the noble gas Kr mixes very well with Xe,it was shown that no long-lived 83Rb is emitted [62]. Tri-

13
MongoDB
TPC
PMT0PMT1
PMT246PMT247
MV_PMT0MV_PMT1
MV_PMT82 MV_PMT83
x10x10
x10x10
ClockGPS 50 MHz
EventBuilder
Trigger FileBuilder
MV_FileBuilder
processing
V1495Logic
MV_Reader
Sumbottomarray
Sumtopring
DDC-10Veto
Reader 1
Reader 2
Reader 3
Reader 4
Reader 5
AcqMonitor
Reader 0
MV TrgMV Trg
MV Trg
BusyV1724ADC
V1724ADC
Veto
V1724ADC
Veto
V1724ADC
Trg Maj
V1724ADC
Trg Maj
MongoDB
TPC
MV
data storage
...... ... ...
...
yes
no
TPC
Muon Veto
Fig. 13 Illustration of the XENON1T DAQ system for the TPC and the muon veto. The two detectors are time-synchronized. The acquisitionmonitor consists of one high-data bandwidth ADC which records the sum of all bottom array PMTs and selected digital information, even whenthe other ADCs are busy or vetoed.
tiated methane (CH3T), which delivers the tritium β spec-trum with the endpoint of 18.6 keV and was pioneered byLUX [63], can also be injected into the XENON1T gas sys-tem. Due to its long half-life of 12.3 y, it has to be removedfrom the LXe by the hot Zr-getters of the purification sys-tem [64]. The last intrinsic source is the noble gas isotope220Rn (T1/2 = 56 s) which is efficiently emanated by an elec-trodeposited 228Th source (T1/2 = 1.9 y). The 220Rn decaychain produces α , β and γ particles that are all useful for de-tector calibration [65], as demonstrated in XENON100 [66].The β decay of 212Pb (12.3% branching ratio to the groundstate, Q = 570 keV) delivers single-scatter ERs in the darkmatter region of interest. Due to the rather short half-lifeT1/2 = 10.6 h of 212Pb, which dominates the chain, the ac-tivity is reduced by a factor 6×10⁴ within one week.
2.4 Data Acquisition, Electronics and Computing
The XENON1T TPC and the muon veto share a commondata aquisition (DAQ) system; it can operate the two sub-detectors either simultaneously, during acquisition of darkmatter search data, or separately for calibration. The over-all DAQ scheme is illustrated in figure 13. The PMT sig-nals from the TPC and the muon veto are digitized by100 MHz CAEN V1724 flash ADC boards with 14 bit res-olution, 40 MHz bandwidth and a 2.25 V or 0.5 V dynamicrange, respectively. The TPC channels are first amplified by
a factor of 10 using Phillips Scientific 776 amplifiers (band-width: DC to 275 MHz). All ADCs share a common externalclock signal to ensure that the two detectors and all digitizersare properly synchronized and share identical time stamps.The time signal can be optionally provided by a custom-developed module to obtain absolute GPS timing, relevantfor the detection of supernova neutrinos [67]. The modulealso provides a 0.1 Hz synchronization signal. The DAQ iscontrolled via a web interface that also allows monitoring ofthe incoming data quality. Both DAQ systems are installedin the temperature stabilized XENON counting room anddiffer mainly in their trigger mode.
The TPC DAQ is trigger-less in the sense that everypulse above a ∼0.3 photoelectron (PE) digitization thresh-old, from every PMT, is read asynchronously and indepen-dently from all other channels. The baseline in-between suchpulses is not digitized (zero suppression). To this end, anovel digitizer firmware was developed in cooperation withCAEN. Six computers (“readers”) are used for the paral-lel read-out of the 32 ADC boards, at a maximum rate of300 MB/s, corresponding to an event rate of ∼100 Hz in cal-ibration mode. The time-stamped digitized pulses are storedin a MongoDB noSQL database, along with some basicquantities of each pulse (time, channel). The sum signal ofall bottom PMTs, generated by adding the individual signalsby means of linear fan-in/fan-out modules, is continuouslyread by another computer (“acquisition monitor”) together
14
with additional veto/busy information. The latter is used toprecisely determine the measurement deadtime.
To reduce the input data rate during TPC calibration, aveto module based on a Skutek DDC-10 was developed. De-pending on the size of the bottom array sum-signal or therelative amount of signal in the outer detector region, it is-sues a real-time veto signal which blocks the entire PMTdata stream from being digitized. The digitizer firmware de-lays the incoming data for the required amount of time.
The trigger decision whether a particle interaction hasoccurred in the TPC is made in real-time by a softwareeventbuilder running on three server-grade machines (Fu-jitsu). It scans the MongoDB database for relevant signals,groups the data into causally connected events and storesthem in a file. While a variety of trigger algorithms maybe adapted to specific use cases, the standard dark matterand calibration S2 trigger is based on the time-clustering ofpulses in individual PMT channels. A >99% trigger effi-ciency is achieved at 200 PE (≈7 e−). Meta-data on the trig-ger decision is stored with the raw data. It is available foronline monitoring of the eventbuilder performance and of-fline analysis.
The muon veto employs a classical coincidence trig-ger, managed by a custom-programmed CAEN V1495 VMEunit, which requires at least Npmt PMT signals in coinci-dence within a certain time window. The logic trigger signalis also sent to a channel of TPC acquisition monitor. For ev-ery muon veto PMT, the digitized waveform has a length of5.12 µs around the trigger signal. The data are written to thecentral MongoDB database and stored in files in the sameway as the TPC data.
Raw data from the DAQ system are temporarilymoved to a buffer-storage at LNGS by an underground-to-aboveground connection using two 10 Gbps fibers. Sub-sequently, the data are automatically transferred [68] todedicated storage points on the U.S. Open Science Grid(OSG) [69] and the European Grid Infrastructure (EGI) [70].The data are backed up in Stockholm. Data processing fol-lows a similar philosophy and leverages the CI Connect ser-vice [71]. It allows for a unique submission portal whilegranting access to shared resources on OSG and EGI (usingHTCondor [72] and glideinWMS services [73]) as well asdedicated allocations on local clusters at the member institu-tions. The data processor (see section 3.2) derives high-levelquantities from the digitized waveforms which are storedin files accessible through a JupyterHub infrastructure [74].The data quality is constantly monitored by the DAQ system(noise, baselines, trigger, etc.). Certain high-level quantitiessuch as electron lifetime or light yield are computed offlineand monitored as well.
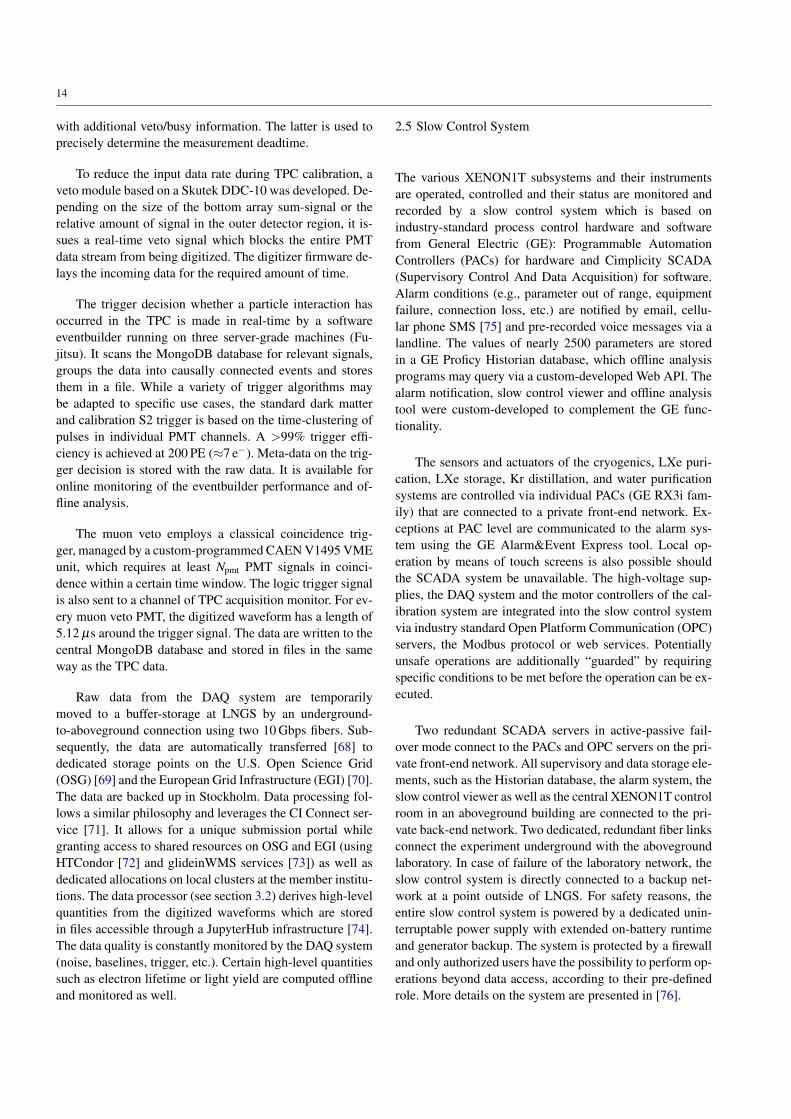
2.5 Slow Control System
The various XENON1T subsystems and their instrumentsare operated, controlled and their status are monitored andrecorded by a slow control system which is based onindustry-standard process control hardware and softwarefrom General Electric (GE): Programmable AutomationControllers (PACs) for hardware and Cimplicity SCADA(Supervisory Control And Data Acquisition) for software.Alarm conditions (e.g., parameter out of range, equipmentfailure, connection loss, etc.) are notified by email, cellu-lar phone SMS [75] and pre-recorded voice messages via alandline. The values of nearly 2500 parameters are storedin a GE Proficy Historian database, which offline analysisprograms may query via a custom-developed Web API. Thealarm notification, slow control viewer and offline analysistool were custom-developed to complement the GE func-tionality.
The sensors and actuators of the cryogenics, LXe puri-cation, LXe storage, Kr distillation, and water purificationsystems are controlled via individual PACs (GE RX3i fam-ily) that are connected to a private front-end network. Ex-ceptions at PAC level are communicated to the alarm sys-tem using the GE Alarm&Event Express tool. Local op-eration by means of touch screens is also possible shouldthe SCADA system be unavailable. The high-voltage sup-plies, the DAQ system and the motor controllers of the cal-ibration system are integrated into the slow control systemvia industry standard Open Platform Communication (OPC)servers, the Modbus protocol or web services. Potentiallyunsafe operations are additionally “guarded” by requiringspecific conditions to be met before the operation can be ex-ecuted.
Two redundant SCADA servers in active-passive fail-over mode connect to the PACs and OPC servers on the pri-vate front-end network. All supervisory and data storage ele-ments, such as the Historian database, the alarm system, theslow control viewer as well as the central XENON1T controlroom in an aboveground building are connected to the pri-vate back-end network. Two dedicated, redundant fiber linksconnect the experiment underground with the abovegroundlaboratory. In case of failure of the laboratory network, theslow control system is directly connected to a backup net-work at a point outside of LNGS. For safety reasons, theentire slow control system is powered by a dedicated unin-terruptable power supply with extended on-battery runtimeand generator backup. The system is protected by a firewalland only authorized users have the possibility to perform op-erations beyond data access, according to their pre-definedrole. More details on the system are presented in [76].
15
3 Detector Commissioning Results
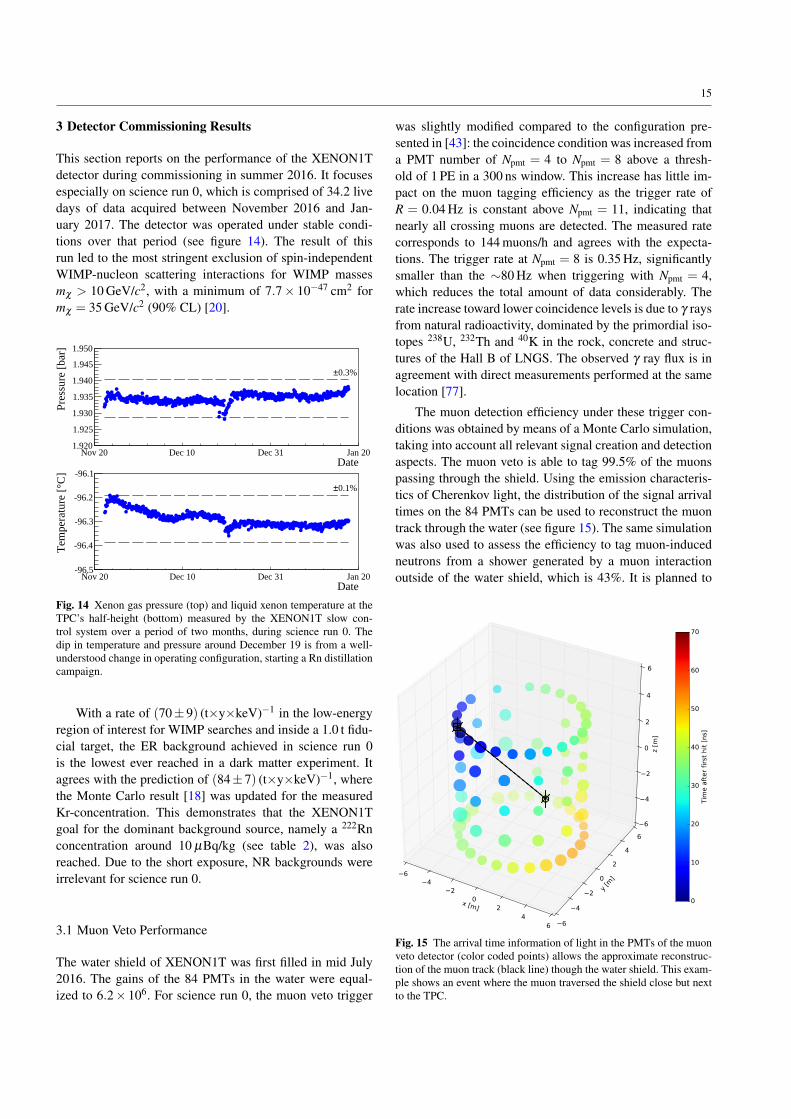
This section reports on the performance of the XENON1Tdetector during commissioning in summer 2016. It focusesespecially on science run 0, which is comprised of 34.2 livedays of data acquired between November 2016 and Jan-uary 2017. The detector was operated under stable condi-tions over that period (see figure 14). The result of thisrun led to the most stringent exclusion of spin-independentWIMP-nucleon scattering interactions for WIMP massesmχ > 10 GeV/c2, with a minimum of 7.7× 10−47 cm2 formχ = 35 GeV/c2 (90% CL) [20].
DateNov 20 Dec 10 Dec 31 Jan 20
Pres
sure
[ba
r]
1.920
1.925
1.930
1.935
1.940
1.945
1.950
0.3%±
DateNov 20 Dec 10 Dec 31 Jan 20
Tem
pera
ture
[°C
]
-96.5
-96.4
-96.3
-96.2
-96.1
0.1%±
Fig. 14 Xenon gas pressure (top) and liquid xenon temperature at theTPC’s half-height (bottom) measured by the XENON1T slow con-trol system over a period of two months, during science run 0. Thedip in temperature and pressure around December 19 is from a well-understood change in operating configuration, starting a Rn distillationcampaign.
With a rate of (70± 9) (t×y×keV)−1 in the low-energyregion of interest for WIMP searches and inside a 1.0 t fidu-cial target, the ER background achieved in science run 0is the lowest ever reached in a dark matter experiment. Itagrees with the prediction of (84±7) (t×y×keV)−1, wherethe Monte Carlo result [18] was updated for the measuredKr-concentration. This demonstrates that the XENON1Tgoal for the dominant background source, namely a 222Rnconcentration around 10 µBq/kg (see table 2), was alsoreached. Due to the short exposure, NR backgrounds wereirrelevant for science run 0.
3.1 Muon Veto Performance
The water shield of XENON1T was first filled in mid July2016. The gains of the 84 PMTs in the water were equal-ized to 6.2× 10⁶. For science run 0, the muon veto trigger
was slightly modified compared to the configuration pre-sented in [43]: the coincidence condition was increased froma PMT number of Npmt = 4 to Npmt = 8 above a thresh-old of 1 PE in a 300 ns window. This increase has little im-pact on the muon tagging efficiency as the trigger rate ofR = 0.04 Hz is constant above Npmt = 11, indicating thatnearly all crossing muons are detected. The measured ratecorresponds to 144 muons/h and agrees with the expecta-tions. The trigger rate at Npmt = 8 is 0.35 Hz, significantlysmaller than the ∼80 Hz when triggering with Npmt = 4,which reduces the total amount of data considerably. Therate increase toward lower coincidence levels is due to γ raysfrom natural radioactivity, dominated by the primordial iso-topes 238U, 232Th and 40K in the rock, concrete and struc-tures of the Hall B of LNGS. The observed γ ray flux is inagreement with direct measurements performed at the samelocation [77].
The muon detection efficiency under these trigger con-ditions was obtained by means of a Monte Carlo simulation,taking into account all relevant signal creation and detectionaspects. The muon veto is able to tag 99.5% of the muonspassing through the shield. Using the emission characteris-tics of Cherenkov light, the distribution of the signal arrivaltimes on the 84 PMTs can be used to reconstruct the muontrack through the water (see figure 15). The same simulationwas also used to assess the efficiency to tag muon-inducedneutrons from a shower generated by a muon interactionoutside of the water shield, which is 43%. It is planned to
Fig. 15 The arrival time information of light in the PMTs of the muonveto detector (color coded points) allows the approximate reconstruc-tion of the muon track (black line) though the water shield. This exam-ple shows an event where the muon traversed the shield close but nextto the TPC.
16
s]µTime [400 500 600 700 800 900 1000 1100 1200 1300
Am
plitu
de [
PE/b
in]
0.0
0.5
1.0
1.5
2.0
2.5
3.0
3.5
4.0 S1: 4.3 PES2: 250 PE
s]µTime [473.0 473.2 473.4 473.6 473.8 474.0
Am
plitu
de [
PE/b
in]
-0.2
0.0
0.2
0.4
0.6
0.8
1.0
1.2
S1: 4.3 PE
S2: 250 PE
s]µTime [998 1000 1002 1004 1006 1008
Am
plitu
de [
PE/b
in]
0.0
0.5
1.0
1.5
2.0
2.5
3.0
3.5
4.0S1: 4.3 PES2: 250 PE
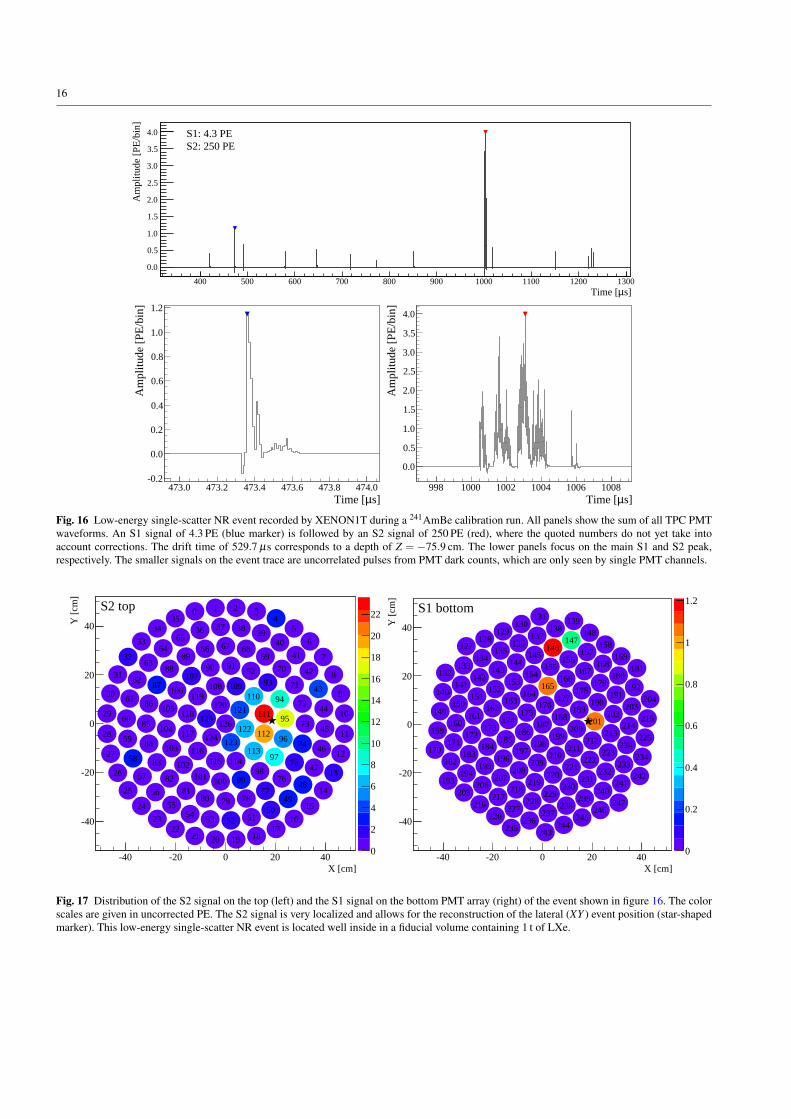
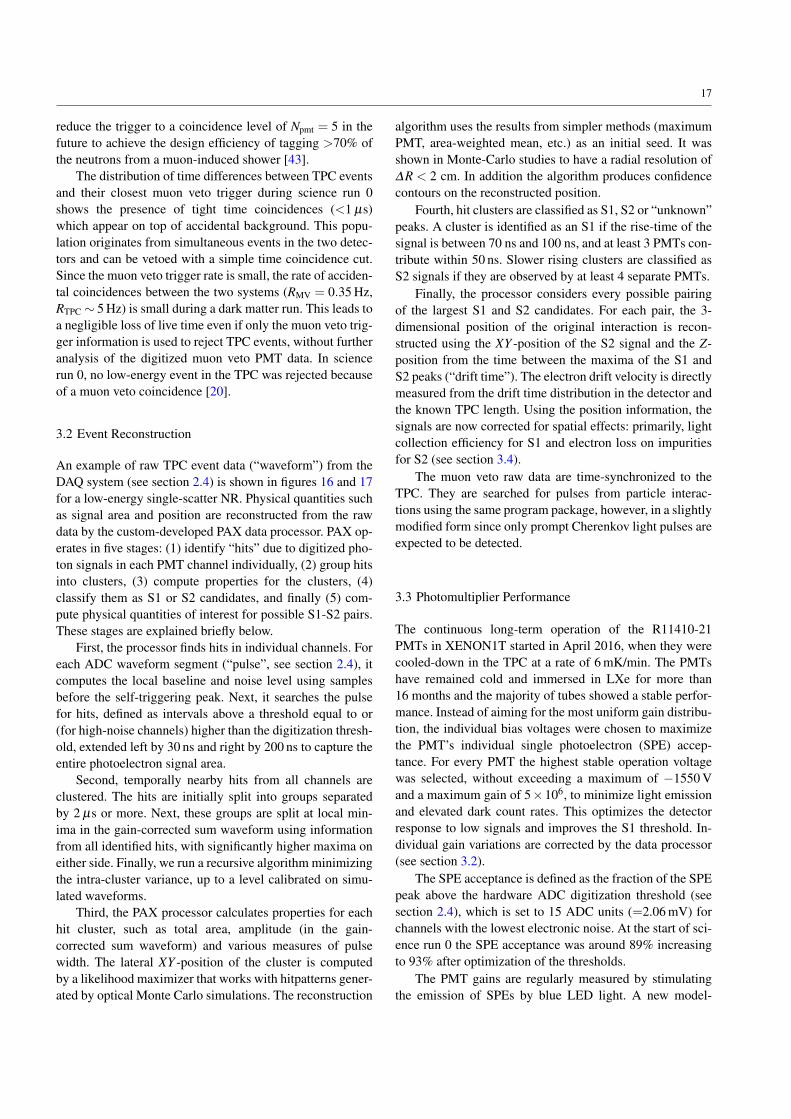
Fig. 16 Low-energy single-scatter NR event recorded by XENON1T during a 241AmBe calibration run. All panels show the sum of all TPC PMTwaveforms. An S1 signal of 4.3 PE (blue marker) is followed by an S2 signal of 250 PE (red), where the quoted numbers do not yet take intoaccount corrections. The drift time of 529.7 µs corresponds to a depth of Z = −75.9 cm. The lower panels focus on the main S1 and S2 peak,respectively. The smaller signals on the event trace are uncorrelated pulses from PMT dark counts, which are only seen by single PMT channels.
X [cm]-40 -20 0 20 40
Y [
cm]
-40
-20
0
20
40
0
2
4
6
8
10
12
14
16
18
20
220 1 2 34
5
6
7
8
9
10
11
12
13
14
15
1617
1819202122
23
24
25
26
27
28
29
30
31
32
33
3435
36 37 3839
40
41
42
43
44
45
46
47
48
4950
51525354
55
56
57
58
59
60
61
62
63
6465
66 67 6869
70
71
72
73
74
75
76
77787980
81
82
83
84
85
86
87
88
8990 91
9293
94
95
96
97
9899100
101102
103
104
105
106
107108 109
110
111
112
113114115
116
117
118
119120 121
122
123124
125126
S2 topEvent 2963 from 161021_1814
X [cm]-40 -20 0 20 40
Y [
cm]
-40
-20
0
20
40
0
0.2
0.4
0.6
0.8
1
1.2
127128
129130
131
132133
134135
136137
138139
140141
142143
144145
146147
148
149150
151152
153154
155156
157158
159160
161162
163164
165166
167168
169
170171
172173
174175
176177
178179
180181
182183
184185
186187
188189
190191
192
193194
195196
197198
199200
201202
203204
205206
207208
209210
211212
213214
215
216217
218219
220221
222223
224225
226227
228229
230231
232233
234
235236
237238
239240
241242
243244
245246
247
S1 bottomEvent 2963 from 161021_1814
Fig. 17 Distribution of the S2 signal on the top (left) and the S1 signal on the bottom PMT array (right) of the event shown in figure 16. The colorscales are given in uncorrected PE. The S2 signal is very localized and allows for the reconstruction of the lateral (XY ) event position (star-shapedmarker). This low-energy single-scatter NR event is located well inside in a fiducial volume containing 1 t of LXe.
17
reduce the trigger to a coincidence level of Npmt = 5 in thefuture to achieve the design efficiency of tagging >70% ofthe neutrons from a muon-induced shower [43].
The distribution of time differences between TPC eventsand their closest muon veto trigger during science run 0shows the presence of tight time coincidences (<1 µs)which appear on top of accidental background. This popu-lation originates from simultaneous events in the two detec-tors and can be vetoed with a simple time coincidence cut.Since the muon veto trigger rate is small, the rate of acciden-tal coincidences between the two systems (RMV = 0.35 Hz,RTPC ∼ 5 Hz) is small during a dark matter run. This leads toa negligible loss of live time even if only the muon veto trig-ger information is used to reject TPC events, without furtheranalysis of the digitized muon veto PMT data. In sciencerun 0, no low-energy event in the TPC was rejected becauseof a muon veto coincidence [20].
3.2 Event Reconstruction
An example of raw TPC event data (“waveform”) from theDAQ system (see section 2.4) is shown in figures 16 and 17for a low-energy single-scatter NR. Physical quantities suchas signal area and position are reconstructed from the rawdata by the custom-developed PAX data processor. PAX op-erates in five stages: (1) identify “hits” due to digitized pho-ton signals in each PMT channel individually, (2) group hitsinto clusters, (3) compute properties for the clusters, (4)classify them as S1 or S2 candidates, and finally (5) com-pute physical quantities of interest for possible S1-S2 pairs.These stages are explained briefly below.
First, the processor finds hits in individual channels. Foreach ADC waveform segment (“pulse”, see section 2.4), itcomputes the local baseline and noise level using samplesbefore the self-triggering peak. Next, it searches the pulsefor hits, defined as intervals above a threshold equal to or(for high-noise channels) higher than the digitization thresh-old, extended left by 30 ns and right by 200 ns to capture theentire photoelectron signal area.
Second, temporally nearby hits from all channels areclustered. The hits are initially split into groups separatedby 2 µs or more. Next, these groups are split at local min-ima in the gain-corrected sum waveform using informationfrom all identified hits, with significantly higher maxima oneither side. Finally, we run a recursive algorithm minimizingthe intra-cluster variance, up to a level calibrated on simu-lated waveforms.
Third, the PAX processor calculates properties for eachhit cluster, such as total area, amplitude (in the gain-corrected sum waveform) and various measures of pulsewidth. The lateral XY -position of the cluster is computedby a likelihood maximizer that works with hitpatterns gener-ated by optical Monte Carlo simulations. The reconstruction
algorithm uses the results from simpler methods (maximumPMT, area-weighted mean, etc.) as an initial seed. It wasshown in Monte-Carlo studies to have a radial resolution of∆R < 2 cm. In addition the algorithm produces confidencecontours on the reconstructed position.
Fourth, hit clusters are classified as S1, S2 or “unknown”peaks. A cluster is identified as an S1 if the rise-time of thesignal is between 70 ns and 100 ns, and at least 3 PMTs con-tribute within 50 ns. Slower rising clusters are classified asS2 signals if they are observed by at least 4 separate PMTs.
Finally, the processor considers every possible pairingof the largest S1 and S2 candidates. For each pair, the 3-dimensional position of the original interaction is recon-structed using the XY -position of the S2 signal and the Z-position from the time between the maxima of the S1 andS2 peaks (“drift time”). The electron drift velocity is directlymeasured from the drift time distribution in the detector andthe known TPC length. Using the position information, thesignals are now corrected for spatial effects: primarily, lightcollection efficiency for S1 and electron loss on impuritiesfor S2 (see section 3.4).
The muon veto raw data are time-synchronized to theTPC. They are searched for pulses from particle interac-tions using the same program package, however, in a slightlymodified form since only prompt Cherenkov light pulses areexpected to be detected.
3.3 Photomultiplier Performance
The continuous long-term operation of the R11410-21PMTs in XENON1T started in April 2016, when they werecooled-down in the TPC at a rate of 6 mK/min. The PMTshave remained cold and immersed in LXe for more than16 months and the majority of tubes showed a stable perfor-mance. Instead of aiming for the most uniform gain distribu-tion, the individual bias voltages were chosen to maximizethe PMT’s individual single photoelectron (SPE) accep-tance. For every PMT the highest stable operation voltagewas selected, without exceeding a maximum of −1550 Vand a maximum gain of 5×10⁶, to minimize light emissionand elevated dark count rates. This optimizes the detectorresponse to low signals and improves the S1 threshold. In-dividual gain variations are corrected by the data processor(see section 3.2).
The SPE acceptance is defined as the fraction of the SPEpeak above the hardware ADC digitization threshold (seesection 2.4), which is set to 15 ADC units (=2.06 mV) forchannels with the lowest electronic noise. At the start of sci-ence run 0 the SPE acceptance was around 89% increasingto 93% after optimization of the thresholds.
The PMT gains are regularly measured by stimulatingthe emission of SPEs by blue LED light. A new model-
18
independent approach is employed [78] which allows ex-tracting PMT parameters such as gain and occupancy with-out making assumptions on the underlying SPE distribu-tion. The average gain is 2.6 × 10⁷ when the additional×10 amplification stage is taken into account. The gainsare distributed between (2.0-5.0)× 107; the distribution hasa rather wide standard deviation of 1.5×10⁷. All gains werestable in time within 2%, reflecting the uncertainty of thecalibration method.
After installation in XENON1T, the PMT’s average darkcount rate decreased from ∼40 Hz measured during thecharacterization campaign in gaseous N2 at −100C [30] to∼12 Hz and ∼24 Hz for the top and bottom PMT arrays, re-spectively. The difference between the arrays is explainedby the contribution of a larger fraction of LXe scintillationevents to the dark count rate, which cannot be distinguishedfrom “real” PMT dark counts. The overall reduction, likelythanks to the lower environmental radioactivity, is impor-tant to minimize the probability of accidental coincidencesof uncorrelated dark count pulses, mimicking a low-energyS1 signal.
Even though PMTs indicating a loss of vacuum by thepresence of lines from xenon ions (Xe+, Xe++) in their af-terpulse spectra [30, 31] were not installed in the XENON1TPMT arrays, some tubes have developed new leaks duringthe operation in the cryogenic environment. The afterpulsespectra are thus investigated regularly to identify such tubesand to monitor the leak’s evolution with time. The PMTs re-main fully operational if the loss of vacuum is not too large.28 PMTs showed a Xe-induced afterpulse rate of rXe > 1%.Reducing their bias voltage helps to improve their perfor-mance, however, once their afterpulse rate becomes too largethey have to be turned off. The PMTs with rXe . 1% wereoperated normally without a negative impact on the dataanalysis. Tubes with an identified leak showed a slight in-crease of the afterpulse rate of ∆rXe < 0.1%/month.
During science run 0, a total of 27 R11410 PMTs (11 onthe top and 16 on the bottom array) were switched off, corre-sponding to a loss of 11% of the channels. While the issueswith 6 of the tubes are related to cabling and bad connec-tions, the majority of the non-operational PMTs shows leak-related problems. The observed symptoms are PMT trips atrather low bias voltages, a high signal rate at the SPE leveland a “flashing behavior”. The latter is characterized by asudden increase of the PMT’s trigger rate which lasts for afew minutes. The affected PMTs showed a high afterpulserate, a clear indication for a leak, and seem to emit light dur-ing these periods as the rate of neighboring channels andof channels in the opposing array also increased. In manycases, these flashes appear to be triggered by high-energydepositions (e.g., from muons). Thanks to the large numberof PMTs installed inside the XENON1T TPC, the impact ofthe missing channels on fiducialization is minor.
3.4 Target Purification
The loss of ionization electrons is caused by their attach-ment to electronegative impurities in the LXe target (H2O,O2, etc.) and it is described by the finite electron lifetime τe,which thus serves as a measurement of the target purity. Aninitial charge signal of size S20 is exponentially reduced de-pending on the drift time t between the interaction point andthe liquid-gas interface:
S2(t) = S20 exp(−t/τe). (1)
This drift-time dependent effect is the most important chargesignal correction and is applied to every event. To compen-sate for outgassing from materials and to maximize τe, theLXe target is constantly purified (see Sect. 2.1.5). The elec-tron lifetime τe is regularly measured by characterizing thesignal loss of mono-energetic charge signals (e.g., full ab-sorption peaks) across the TPC. Figure 18 shows such ameasurement using the mono-energetic conversion electronline at 32.1 keV from metastable 83mKr, which is very welldescribed by an exponential function.
Figure 19 shows the electron lifetime evolution overa period of approximately two months, during science
s]µDrift Time [100 200 300 400 500 600
S2 [
PE]
5000
10000
15000
20000
0
100
200
300
400
500
600
700
Fig. 18 The loss of electrons due to the presence of electronegative im-purities in the LXe is measured via the drift time-dependent decreaseof the charge signal size, e.g., from the mono-energetic 32.1 keV linefrom 83mKr. The example shown here corresponds to an electron life-time τe = (467±5) µs, derived from the exponential fit (red line).
DateNov 16 Dec 09 Jan 01 Jan 23
s]µE
lect
ron
Lif
etim
e [
350
400
450
500
550
Fig. 19 Evolution of the electron lifetime over science run 0, whichis indicated by the vertical lines. The two step-like decreases are well-understood and related to detector operation (e.g., online 222Rn distil-lation which started on December 19). The model (red line) describesthe data well.
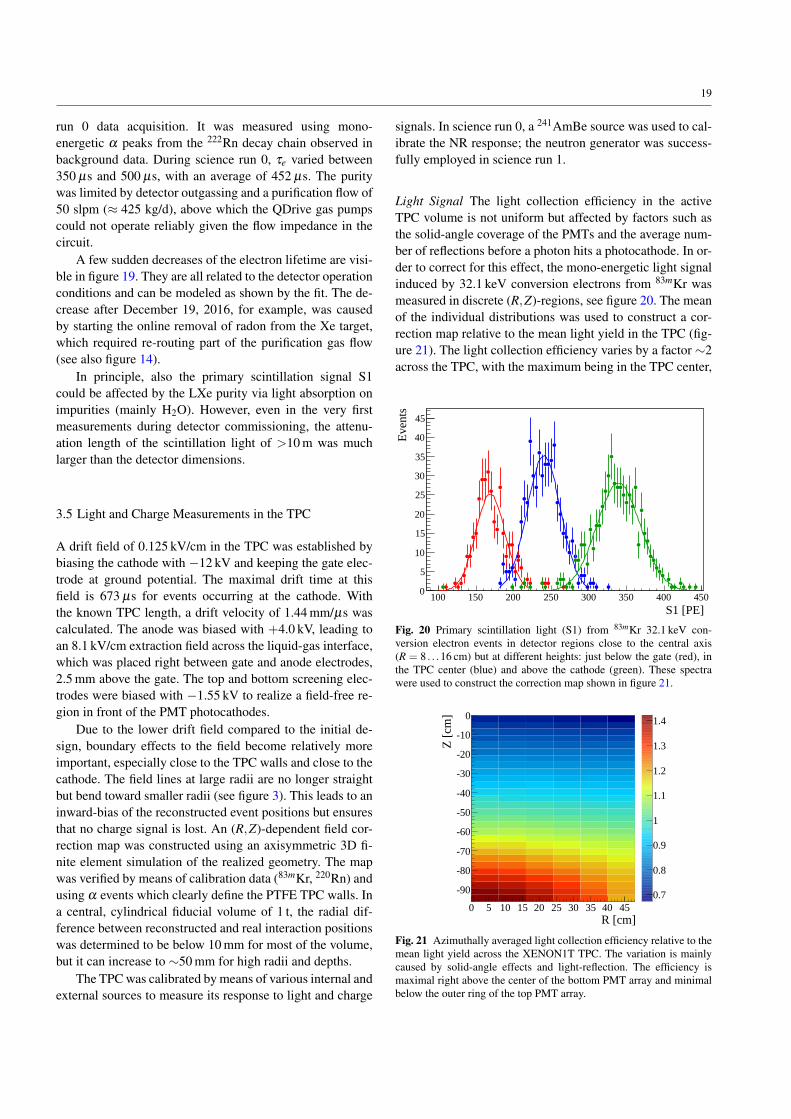
19
run 0 data acquisition. It was measured using mono-energetic α peaks from the 222Rn decay chain observed inbackground data. During science run 0, τe varied between350 µs and 500 µs, with an average of 452 µs. The puritywas limited by detector outgassing and a purification flow of50 slpm (≈ 425 kg/d), above which the QDrive gas pumpscould not operate reliably given the flow impedance in thecircuit.
A few sudden decreases of the electron lifetime are visi-ble in figure 19. They are all related to the detector operationconditions and can be modeled as shown by the fit. The de-crease after December 19, 2016, for example, was causedby starting the online removal of radon from the Xe target,which required re-routing part of the purification gas flow(see also figure 14).
In principle, also the primary scintillation signal S1could be affected by the LXe purity via light absorption onimpurities (mainly H2O). However, even in the very firstmeasurements during detector commissioning, the attenu-ation length of the scintillation light of >10 m was muchlarger than the detector dimensions.
3.5 Light and Charge Measurements in the TPC
A drift field of 0.125 kV/cm in the TPC was established bybiasing the cathode with −12 kV and keeping the gate elec-trode at ground potential. The maximal drift time at thisfield is 673 µs for events occurring at the cathode. Withthe known TPC length, a drift velocity of 1.44 mm/µs wascalculated. The anode was biased with +4.0 kV, leading toan 8.1 kV/cm extraction field across the liquid-gas interface,which was placed right between gate and anode electrodes,2.5 mm above the gate. The top and bottom screening elec-trodes were biased with −1.55 kV to realize a field-free re-gion in front of the PMT photocathodes.
Due to the lower drift field compared to the initial de-sign, boundary effects to the field become relatively moreimportant, especially close to the TPC walls and close to thecathode. The field lines at large radii are no longer straightbut bend toward smaller radii (see figure 3). This leads to aninward-bias of the reconstructed event positions but ensuresthat no charge signal is lost. An (R,Z)-dependent field cor-rection map was constructed using an axisymmetric 3D fi-nite element simulation of the realized geometry. The mapwas verified by means of calibration data (83mKr, 220Rn) andusing α events which clearly define the PTFE TPC walls. Ina central, cylindrical fiducial volume of 1 t, the radial dif-ference between reconstructed and real interaction positionswas determined to be below 10 mm for most of the volume,but it can increase to ∼50 mm for high radii and depths.
The TPC was calibrated by means of various internal andexternal sources to measure its response to light and charge
signals. In science run 0, a 241AmBe source was used to cal-ibrate the NR response; the neutron generator was success-fully employed in science run 1.
Light Signal The light collection efficiency in the activeTPC volume is not uniform but affected by factors such asthe solid-angle coverage of the PMTs and the average num-ber of reflections before a photon hits a photocathode. In or-der to correct for this effect, the mono-energetic light signalinduced by 32.1 keV conversion electrons from 83mKr wasmeasured in discrete (R,Z)-regions, see figure 20. The meanof the individual distributions was used to construct a cor-rection map relative to the mean light yield in the TPC (fig-ure 21). The light collection efficiency varies by a factor ∼2across the TPC, with the maximum being in the TPC center,
S1 [PE]100 150 200 250 300 350 400 450
Eve
nts
0
5
10
15
20
25
30
35
40
45
Fig. 20 Primary scintillation light (S1) from 83mKr 32.1 keV con-version electron events in detector regions close to the central axis(R = 8 . . .16 cm) but at different heights: just below the gate (red), inthe TPC center (blue) and above the cathode (green). These spectrawere used to construct the correction map shown in figure 21.
R [cm]0 5 10 15 20 25 30 35 40 45
Z [
cm]
-90
-80
-70
-60
-50
-40
-30
-20
-10
0
0.7
0.8
0.9
1
1.1
1.2
1.3
1.4
Fig. 21 Azimuthally averaged light collection efficiency relative to themean light yield across the XENON1T TPC. The variation is mainlycaused by solid-angle effects and light-reflection. The efficiency ismaximal right above the center of the bottom PMT array and minimalbelow the outer ring of the top PMT array.
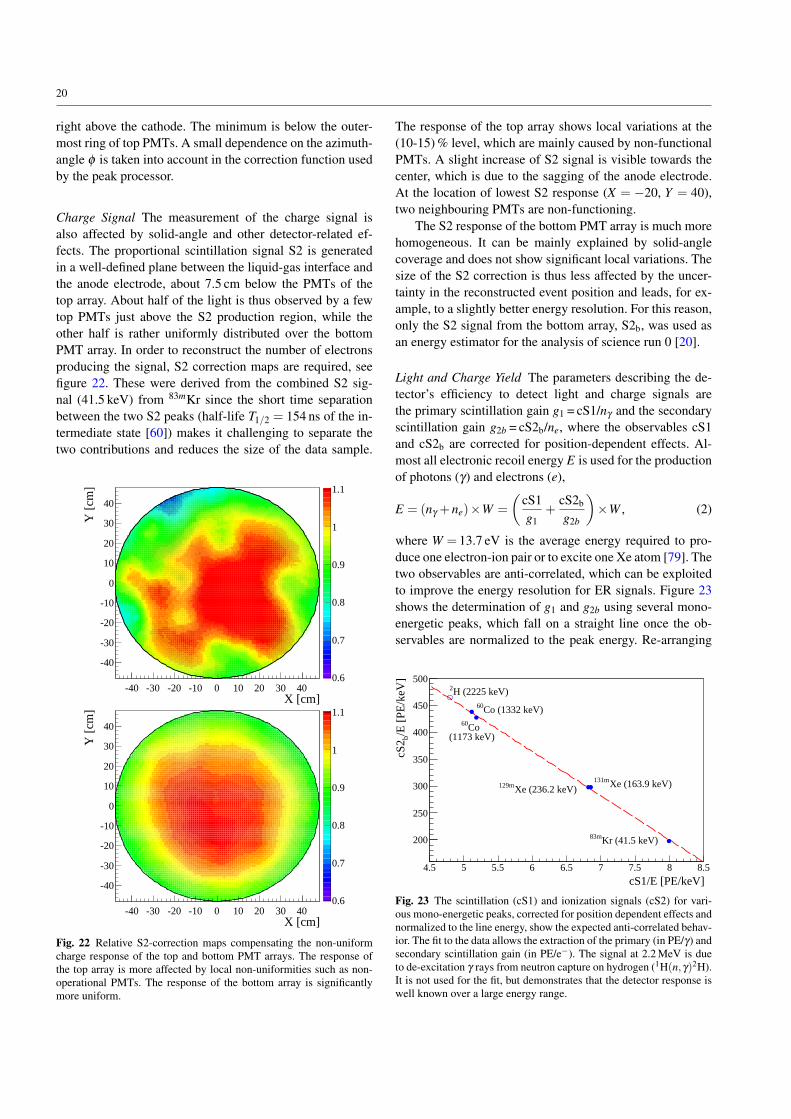
20
right above the cathode. The minimum is below the outer-most ring of top PMTs. A small dependence on the azimuth-angle φ is taken into account in the correction function usedby the peak processor.
Charge Signal The measurement of the charge signal isalso affected by solid-angle and other detector-related ef-fects. The proportional scintillation signal S2 is generatedin a well-defined plane between the liquid-gas interface andthe anode electrode, about 7.5 cm below the PMTs of thetop array. About half of the light is thus observed by a fewtop PMTs just above the S2 production region, while theother half is rather uniformly distributed over the bottomPMT array. In order to reconstruct the number of electronsproducing the signal, S2 correction maps are required, seefigure 22. These were derived from the combined S2 sig-nal (41.5 keV) from 83mKr since the short time separationbetween the two S2 peaks (half-life T1/2 = 154 ns of the in-termediate state [60]) makes it challenging to separate thetwo contributions and reduces the size of the data sample.
X [cm]-40 -30 -20 -10 0 10 20 30 40
Y [
cm]
-40
-30
-20
-10
0
10
20
30
40
0.6
0.7
0.8
0.9
1
1.1
0.60.70.80.911.1
X [cm]-40 -30 -20 -10 0 10 20 30 40
Y [
cm]
-40
-30
-20
-10
0
10
20
30
40
0.6
0.7
0.8
0.9
1
1.1
Fig. 22 Relative S2-correction maps compensating the non-uniformcharge response of the top and bottom PMT arrays. The response ofthe top array is more affected by local non-uniformities such as non-operational PMTs. The response of the bottom array is significantlymore uniform.
The response of the top array shows local variations at the(10-15) % level, which are mainly caused by non-functionalPMTs. A slight increase of S2 signal is visible towards thecenter, which is due to the sagging of the anode electrode.At the location of lowest S2 response (X = −20, Y = 40),two neighbouring PMTs are non-functioning.
The S2 response of the bottom PMT array is much morehomogeneous. It can be mainly explained by solid-anglecoverage and does not show significant local variations. Thesize of the S2 correction is thus less affected by the uncer-tainty in the reconstructed event position and leads, for ex-ample, to a slightly better energy resolution. For this reason,only the S2 signal from the bottom array, S2b, was used asan energy estimator for the analysis of science run 0 [20].
Light and Charge Yield The parameters describing the de-tector’s efficiency to detect light and charge signals arethe primary scintillation gain g1 = cS1/nγ and the secondaryscintillation gain g2b = cS2b/ne, where the observables cS1and cS2b are corrected for position-dependent effects. Al-most all electronic recoil energy E is used for the productionof photons (γ) and electrons (e),
E = (nγ +ne)×W =
(cS1g1
+cS2b
g2b
)×W , (2)
where W = 13.7 eV is the average energy required to pro-duce one electron-ion pair or to excite one Xe atom [79]. Thetwo observables are anti-correlated, which can be exploitedto improve the energy resolution for ER signals. Figure 23shows the determination of g1 and g2b using several mono-energetic peaks, which fall on a straight line once the ob-servables are normalized to the peak energy. Re-arranging
cS1/E [PE/keV]4.5 5 5.5 6 6.5 7 7.5 8 8.5
/E [
PE/k
eV]
bcS
2
200
250
300
350
400
450
500
Kr (41.5 keV)83m
Xe (163.9 keV)131m
Xe (236.2 keV)129m
Co (1332 keV)60
Co60
(1173 keV)
H (2225 keV)2
Fig. 23 The scintillation (cS1) and ionization signals (cS2) for vari-ous mono-energetic peaks, corrected for position dependent effects andnormalized to the line energy, show the expected anti-correlated behav-ior. The fit to the data allows the extraction of the primary (in PE/γ) andsecondary scintillation gain (in PE/e−). The signal at 2.2 MeV is dueto de-excitation γ rays from neutron capture on hydrogen (1H(n,γ)2H).It is not used for the fit, but demonstrates that the detector response iswell known over a large energy range.
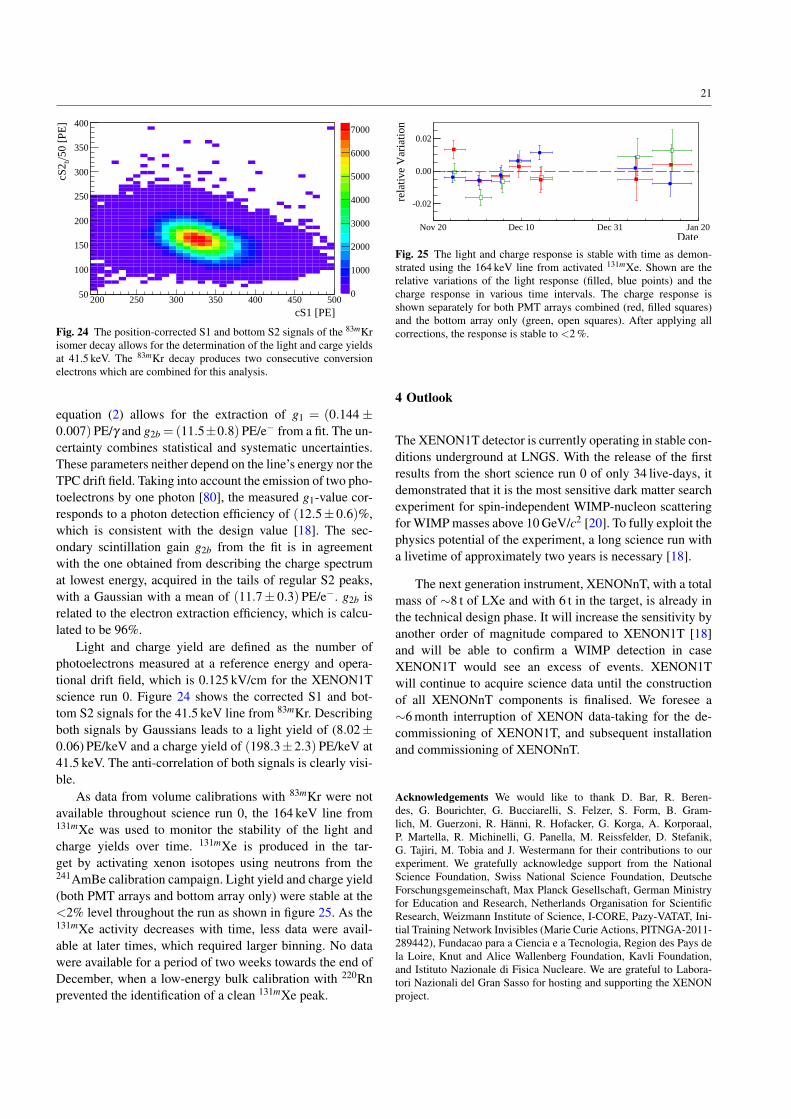
21
cS1 [PE]200 250 300 350 400 450 500
/50
[PE
]b
cS2
50
100
150
200
250
300
350
400h5
Entries 498353
Mean x 329.9
Mean y 160.2
RMS x 33.74
RMS y 24.85
0
1000
2000
3000
4000
5000
6000
7000h5Entries 498353
Mean x 329.9
Mean y 160.2
RMS x 33.74
RMS y 24.85
Fig. 24 The position-corrected S1 and bottom S2 signals of the 83mKrisomer decay allows for the determination of the light and carge yieldsat 41.5 keV. The 83mKr decay produces two consecutive conversionelectrons which are combined for this analysis.
equation (2) allows for the extraction of g1 = (0.144 ±0.007)PE/γ and g2b = (11.5±0.8)PE/e− from a fit. The un-certainty combines statistical and systematic uncertainties.These parameters neither depend on the line’s energy nor theTPC drift field. Taking into account the emission of two pho-toelectrons by one photon [80], the measured g1-value cor-responds to a photon detection efficiency of (12.5±0.6)%,which is consistent with the design value [18]. The sec-ondary scintillation gain g2b from the fit is in agreementwith the one obtained from describing the charge spectrumat lowest energy, acquired in the tails of regular S2 peaks,with a Gaussian with a mean of (11.7± 0.3)PE/e−. g2b isrelated to the electron extraction efficiency, which is calcu-lated to be 96%.
Light and charge yield are defined as the number ofphotoelectrons measured at a reference energy and opera-tional drift field, which is 0.125 kV/cm for the XENON1Tscience run 0. Figure 24 shows the corrected S1 and bot-tom S2 signals for the 41.5 keV line from 83mKr. Describingboth signals by Gaussians leads to a light yield of (8.02±0.06) PE/keV and a charge yield of (198.3±2.3)PE/keV at41.5 keV. The anti-correlation of both signals is clearly visi-ble.
As data from volume calibrations with 83mKr were notavailable throughout science run 0, the 164 keV line from131mXe was used to monitor the stability of the light andcharge yields over time. 131mXe is produced in the tar-get by activating xenon isotopes using neutrons from the241AmBe calibration campaign. Light yield and charge yield(both PMT arrays and bottom array only) were stable at the<2% level throughout the run as shown in figure 25. As the131mXe activity decreases with time, less data were avail-able at later times, which required larger binning. No datawere available for a period of two weeks towards the end ofDecember, when a low-energy bulk calibration with 220Rnprevented the identification of a clean 131mXe peak.
DateNov 20 Dec 10 Dec 31 Jan 20
rela
tive
Var
iatio
n
-0.02
0.00
0.02
Fig. 25 The light and charge response is stable with time as demon-strated using the 164 keV line from activated 131mXe. Shown are therelative variations of the light response (filled, blue points) and thecharge response in various time intervals. The charge response isshown separately for both PMT arrays combined (red, filled squares)and the bottom array only (green, open squares). After applying allcorrections, the response is stable to <2 %.
4 Outlook
The XENON1T detector is currently operating in stable con-ditions underground at LNGS. With the release of the firstresults from the short science run 0 of only 34 live-days, itdemonstrated that it is the most sensitive dark matter searchexperiment for spin-independent WIMP-nucleon scatteringfor WIMP masses above 10 GeV/c2 [20]. To fully exploit thephysics potential of the experiment, a long science run witha livetime of approximately two years is necessary [18].
The next generation instrument, XENONnT, with a totalmass of ∼8 t of LXe and with 6 t in the target, is already inthe technical design phase. It will increase the sensitivity byanother order of magnitude compared to XENON1T [18]and will be able to confirm a WIMP detection in caseXENON1T would see an excess of events. XENON1Twill continue to acquire science data until the constructionof all XENONnT components is finalised. We foresee a∼6 month interruption of XENON data-taking for the de-commissioning of XENON1T, and subsequent installationand commissioning of XENONnT.
Acknowledgements We would like to thank D. Bar, R. Beren-des, G. Bourichter, G. Bucciarelli, S. Felzer, S. Form, B. Gram-lich, M. Guerzoni, R. Hänni, R. Hofacker, G. Korga, A. Korporaal,P. Martella, R. Michinelli, G. Panella, M. Reissfelder, D. Stefanik,G. Tajiri, M. Tobia and J. Westermann for their contributions to ourexperiment. We gratefully acknowledge support from the NationalScience Foundation, Swiss National Science Foundation, DeutscheForschungsgemeinschaft, Max Planck Gesellschaft, German Ministryfor Education and Research, Netherlands Organisation for ScientificResearch, Weizmann Institute of Science, I-CORE, Pazy-VATAT, Ini-tial Training Network Invisibles (Marie Curie Actions, PITNGA-2011-289442), Fundacao para a Ciencia e a Tecnologia, Region des Pays dela Loire, Knut and Alice Wallenberg Foundation, Kavli Foundation,and Istituto Nazionale di Fisica Nucleare. We are grateful to Labora-tori Nazionali del Gran Sasso for hosting and supporting the XENONproject.
22
References
1. P.A.R Ade et al. (Planck), Astron. Astrophys. 594, A13 (2016);V. Springel et al., Nature 435, 629 (2005).
2. G. Bertone, D. Hooper and J. Silk, Phys. Rep. 405, 279 (2005).3. G. Steigman, and M.S. Turner, Nucl. Phys. B 253, 375 (1985).4. M. W. Goodman and E. Witten, Phys. Rev. D 31, 3059 (1985).5. J. Angle et al. (XENON10), Phys. Rev. Lett. 100, 021303 (2008).6. E. Aprile et al. (XENON10), Astropart. Phys. 34, 679 (2011).7. E. Aprile et al. (XENON100), Astropart. Phys. 35, 573 (2012).8. E. Aprile et al. (XENON100), Phys. Rev. Lett. 109, 181301
(2012).9. E. Aprile et.al. (XENON100), Phys. Rev. D 94, 122001 (2016).
10. E. Aprile et al. (XENON100), Phys. Rev. Lett. 111, 021301(2013).
11. E. Aprile et al. (XENON100), Phys. Rev. D 84, 061101 (2011).12. E. Aprile et al. (XENON100), arXiv:1704.05804.13. E. Aprile et al. (XENON100), arXiv:1705.02614.14. E. Aprile et al. (XENON100), Phys. Rev. D 90, 062009 (2014).15. E. Aprile et al. (XENON100), Phys. Rev. Lett. 115, 091302
(2015).16. E. Aprile et al. (XENON100), Phys. Rev. Lett. 118, 101101
(2017).17. E. Aprile et al. (XENON100), Science 349, 851 (2015).18. E. Aprile et al. (XENON), JCAP 04, 027 (2016).19. J. Billard, L. Strigari, E. Figueroa-Feliciano, Phys. Rev. D 89,
023524 (2014).20. E. Aprile et al. (XENON), arXiv:1705.06655.21. B.A. Dolgoshein, V.N Lebedenko, B.U. Rodionov, JETP Lett. 11,
513 (1970).22. G.J. Alner et al. (ZEPLIN-II), Astropart. Phys. 28, 287 (2007).23. V. Chepel, H. Araujo, JINST 8, R04001 (2013).24. M. Schumann, JINST 9, C08004 (2014).25. E. Aprile et al., Phys. Rev. Lett. 97, 081302 (2006).26. A. Lansiart et al., Nucl. Inst. Meth. 135, 47 (1976).27. M. Yamashita et al., Nucl. Instr. Meth. A 535, 692 (2004).28. www.comsol.com29. F. Glück et al., New J. Phys. 15, 083025 (2013).30. P. Barrow et al., JINST 12, P01024 (2017).31. L. Baudis et al., JINST 8, P04026 (2013).32. K. Lung et al., Nucl. Instr. Meth. A 696, 32 (2012).33. E. Aprile et al. (XENON1T), Eur. Phys. J C 75, 546 (2015).34. E. Aprile et al. (XENON100), Astropart. Phys. 54, 11 (2014).35. G. Kessler, PhD thesis, University of Zürich (2016),
http://dx.doi.org/10.5167/uzh-127035.36. M. v. Sivers et al., JINST 11, P12017 (2016).37. E. Aprile et al. (XENON1T), arXiv:1705.01828.38. T. Haruyama et al., AIP Conf. Proc. 823, 1695 (2006).39. V. Pizzella, Master thesis, Università di Roma (2016),
hdl.handle.net/11858/00-001M-0000-002B-B3FD-C40. E. Aprile et al., JINST 7, P10001 (2012).41. E. Aprile et al., Facility and method for supplying liquid xenon,
patent FR2986061 (A1) (2013).42. J.B. Albert et al. (EXO-200), Phys. Rev. C 89, 015502 (2014).43. E. Aprile et al. (XENON1T), JINST 9, 072008 (2014).44. M. Aglietta et al., Phys. Rev. D 58, 092005 (1998).45. C. Geis et al., JINST 12, P06017 (2017).46. G. Heusser et al., in Povinec, P.P. and Sanchez-Cabeza, J.A.
(eds.): Radionuclides in the Environment (2006) 495.47. L. Baudis et al., JINST 6, 092005 (2011).48. G. Heusser et al., Eur. Phys. J. C 75, 531 (2015).49. G. Zuzel, H. Simgen, Appl. Rad. Isot. 67, 889 (2009).50. W. Rau, G. Heusser, Appl. Rad. Isot. 53, 371 (2000).51. N. Rupp, Master thesis, Heidelberg University (2015),
hdl.handle.net/11858/00-001M-0000-0027-797D-D52. E. Aprile et al. (XENON), Eur. Phys. J. C 77, 275 (2017).
53. S. Rosendahl et al., JINST 9, P10010 (2014).54. S. Rosendahl et al., Rev. Sci. Instr. 86, 115104 (2015).55. E. Brown et al., JINST 8, P02011 (2013).56. S. Lindemann and H. Simgen, Eur. Phys. J. C 74, 2746 (2014).57. S. Bruenner et al., Eur. Phys. J. C 77, 143 (2017).58. E. Aprile et al. (XENON), Eur. Phys. J. C 77, 358 (2017).59. R.F. Lang et al., arXiv:1705.04741.60. A. Manalaysay et al., Rev. Sci. Instrum. 81, 073303 (2010).61. L.W. Kastens et al., Phys. Rev. C 80, 045809 (2009).62. V. Hannen et al., JINST 6, P10013 (2011).63. D.S. Akerib et al. (LUX), Phys. Rev. D 93, 072009 (2016).64. A. Dobi et al., Nucl. Instrum. Meth. A 620, 594 (2010).65. R. Lang et al., JINST 11, P04004 (2016).66. E. Aprile et al. (XENON100), Phys. Rev. D 95, 072008 (2017).67. R. Lang et al., Phys. Rev. D 94, 103009 (2016).68. V. Garonne et al., J. Phys.: Conf. Ser. 13, 042021 (2014).69. R. Pordes, et al., J. Phys.: Conf. Ser. 78, 012057 (2007).70. EGI: Advanced Computing for Research: www.egi.eu.71. CI Connect Project: http://ci-connect.net.72. HTCondor Project: www.cs.wisc.edu/condor.73. I. Sfiligoi et al., WRI World Congress on Computer Science and
Information Engineering (2009) 428.74. The Jupyter Project: http://jupyter.org.75. Nexmo: http://www.nexmo.com.76. J. Cardoso et al., Proceedings of IEEE RT2016,
http://dx.doi.org/10.1109/RTC.2016.7543178.77. M. Haffke et al., Nucl. Instr. Meth. A 643, 36 (2011).78. R. Saldanha et al., Nucl. Instr. Meth. A 863, 35 (2017).79. M. Szydagis et al., JINST 6, P10002 (2011).80. C.H. Faham et al., JINST 10, P09010, (2015).