Physics reach of the XENON1T dark matter experiment. · Physics reach of the XENON1T dark matter...
36
Prepared for submission to JCAP Physics reach of the XENON1T dark matter experiment. The XENON collaboration: E. Aprile, a J. Aalbers, b F. Agostini, c,d M. Alfonsi, e F. D. Amaro, f M. Anthony, a L. Arazi, g F. Arneodo, h C. Balan, f P. Barrow, i L. Baudis, i B. Bauermeister, e,j T. Berger, k P. Breur, b A. Breskin, g A. Brown, b E. Brown, k S. Bruenner, l G. Bruno, m,c R. Budnik, g L. Bütikofer, n J. M. R. Cardoso, f M. Cervantes, o D. Cichon, l D. Coderre, n A. P. Colijn, b J. Conrad, j,1 H. Contreras, a J. P. Cussonneau, p M. P. Decowski, b P. de Perio, a P. Di Gangi, d A. Di Giovanni, h E. Duchovni, g S. Fattori, e A. D. Ferella, c,j A. Fieguth, m D. Franco, i W. Fulgione, c,q M. Galloway, i M. Garbini, d C. Geis, e L. W. Goetzke, a Z. Greene, a C. Grignon, e,2 E. Gross, g W. Hampel, l C. Hasterok, l R. Itay, g F. Kaether, l B. Kaminsky, n G. Kessler, i A. Kish, i H. Landsman, g R. F. Lang, o D. Lellouch, g L. Levinson, g M. Le Calloch, p C. Levy, k S. Lindemann, l M. Lindner, l J. A. M. Lopes, f A. Lyashenko, r S. Macmullin, o A. Manfredini, g T. Marrodán Undagoitia, l J. Masbou, p F. V. Massoli, d D. Mayani, i A. J. Melgarejo Fernandez, a Y. Meng, r M. Messina, a K. Micheneau, p B. Miguez, q A. Molinario, c M. Murra, m J. Naganoma, s U. Oberlack, e S. E. A. Orrigo, f,3 P. Pakarha, i B. Pelssers, j R. Persiani, p F. Piastra, i J. Pienaar, o G. Plante, a N. Priel, g L. Rauch, l S. Reichard, o C. Reuter, o A. Rizzo, a S. Rosendahl, m N. Rupp, l J. M. F. dos Santos, f G. Sartorelli, d M. Scheibelhut, e S. Schindler, e J. Schreiner, l M. Schumann, n L. Scotto Lavina, p M. Selvi, d,2 P. Shagin, s H. Simgen, l A. Stein, r D. Thers, p A. Tiseni, b G. Trinchero, q C. Tunnell, b M. von Sivers, n R. Wall, s H. Wang, r M. Weber, a Y. Wei, i C. Weinheimer, m J. Wulf, i Y. Zhang. a 1 Wallenberg Academy Fellow 2 Corresponding author 3 Present address: IFIC, CSIC-Universidad de Valencia, Valencia, Spain arXiv:1512.07501v2 [physics.ins-det] 15 Apr 2016
Transcript of Physics reach of the XENON1T dark matter experiment. · Physics reach of the XENON1T dark matter...

Prepared for submission to JCAP
Physics reach of the XENON1Tdark matter experiment.
The XENON collaboration:E. Aprile,a J. Aalbers,b F. Agostini,c,d M. Alfonsi,e
F. D. Amaro,f M. Anthony,a L. Arazi,g F. Arneodo,h C. Balan,fP. Barrow,i L. Baudis,i B. Bauermeister,e,j T. Berger,kP. Breur,b A. Breskin,g A. Brown,b E. Brown,k S. Bruenner,lG. Bruno,m,c R. Budnik,g L. Bütikofer,n J. M. R. Cardoso,fM. Cervantes,o D. Cichon,l D. Coderre,n A. P. Colijn,bJ. Conrad,j,1 H. Contreras,a J. P. Cussonneau,pM. P. Decowski,b P. de Perio,a P. Di Gangi,d A. Di Giovanni,hE. Duchovni,g S. Fattori,e A. D. Ferella,c,j A. Fieguth,mD. Franco,i W. Fulgione,c,q M. Galloway,i M. Garbini,d C. Geis,eL. W. Goetzke,a Z. Greene,a C. Grignon,e,2 E. Gross,gW. Hampel,l C. Hasterok,l R. Itay,g F. Kaether,l B. Kaminsky,nG. Kessler,i A. Kish,i H. Landsman,g R. F. Lang,o D. Lellouch,gL. Levinson,g M. Le Calloch,p C. Levy,k S. Lindemann,lM. Lindner,l J. A. M. Lopes,f A. Lyashenko,r S. Macmullin,oA. Manfredini,g T. Marrodán Undagoitia,l J. Masbou,pF. V. Massoli,d D. Mayani,i A. J. Melgarejo Fernandez,aY. Meng,r M. Messina,a K. Micheneau,p B. Miguez,qA. Molinario,c M. Murra,m J. Naganoma,s U. Oberlack,eS. E. A. Orrigo,f,3 P. Pakarha,i B. Pelssers,j R. Persiani,pF. Piastra,i J. Pienaar,o G. Plante,a N. Priel,g L. Rauch,lS. Reichard,o C. Reuter,o A. Rizzo,a S. Rosendahl,m N. Rupp,lJ. M. F. dos Santos,f G. Sartorelli,d M. Scheibelhut,eS. Schindler,e J. Schreiner,l M. Schumann,n L. Scotto Lavina,pM. Selvi,d,2 P. Shagin,s H. Simgen,l A. Stein,r D. Thers,pA. Tiseni,b G. Trinchero,q C. Tunnell,b M. von Sivers,n R. Wall,sH. Wang,r M. Weber,a Y. Wei,i C. Weinheimer,m J. Wulf,iY. Zhang.a
1Wallenberg Academy Fellow2Corresponding author3Present address: IFIC, CSIC-Universidad de Valencia, Valencia, Spain
arX
iv:1
512.
0750
1v2
[ph
ysic
s.in
s-de
t] 1
5 A
pr 2
016
aPhysics Department, Columbia University, New York, NY, USAbNikhef and the University of Amsterdam, Science Park, Amsterdam, NetherlandscINFN-Laboratori Nazionali del Gran Sasso and Gran Sasso Science Institute, L’Aquila, ItalydDepartment of Physics and Astrophysics, University of Bologna and INFN-Bologna, Bo-logna, ItalyeInstitut für Physik & Exzellenzcluster PRISMA, Johannes Gutenberg-Universität Mainz,Mainz, GermanyfDepartment of Physics, University of Coimbra, Coimbra, PortugalgDepartment of Particle Physics and Astrophysics, Weizmann Institute of Science, Rehovot,IsraelhNew York University Abu Dhabi, Abu Dhabi, United Arab EmiratesiPhysik-Institut, University of Zurich, Zurich, SwitzerlandjDepartment of Physics, Stockholm University, AlbaNova, SE-106 91 Stockholm, SwedenkDepartment of Physics, Applied Physics and Astronomy, Rensselaer Polytechnic Institute,Troy, NY, USAlMax-Planck-Institut für Kernphysik, Heidelberg, GermanymInstitut für Kernphysik, Westfälische Wilhelms-Universität Münster, Münster, GermanynAlbert Einstein Center for Fundamental Physics, University of Bern, Bern, SwitzerlandoDepartment of Physics and Astronomy, Purdue University, West Lafayette, IN, USApSubatech, Ecole des Mines de Nantes, CNRS/In2p3, Université de Nantes, Nantes, FranceqINFN-Torino and Osservatorio Astrofisico di Torino, Torino, ItalyrPhysics & Astronomy Department, University of California, Los Angeles, CA, USAsDepartment of Physics and Astronomy, Rice University, Houston, TX, USA
E-mail: [email protected], [email protected]
Abstract. The XENON1T experiment is currently in the commissioning phase at theLaboratori Nazionali del Gran Sasso, Italy. In this article we study the experiment’s expectedsensitivity to the spin-independent WIMP-nucleon interaction cross section, based on MonteCarlo predictions of the electronic and nuclear recoil backgrounds.
The total electronic recoil background in 1 tonne fiducial volume and (1, 12) keV elec-tronic recoil equivalent energy region, before applying any selection to discriminate betweenelectronic and nuclear recoils, is (1.80±0.15) ·10−4 (kg ·day ·keV)−1, mainly due to the decayof 222Rn daughters inside the xenon target. The nuclear recoil background in the correspond-ing nuclear recoil equivalent energy region (4, 50) keV, is composed of (0.6 ± 0.1) (t · y)−1
from radiogenic neutrons, (1.8 ± 0.3) · 10−2 (t · y)−1 from coherent scattering of neutrinos,and less than 0.01 (t · y)−1 from muon-induced neutrons.
The sensitivity of XENON1T is calculated with the Profile Likelihood Ratio method,after converting the deposited energy of electronic and nuclear recoils into the scintillationand ionization signals seen in the detector. We take into account the systematic uncertaintieson the photon and electron emission model, and on the estimation of the backgrounds, treatedas nuisance parameters. The main contribution comes from the relative scintillation efficiencyLeff , which affects both the signal from WIMPs and the nuclear recoil backgrounds. After a2 y measurement in 1 t fiducial volume, the sensitivity reaches a minimum cross section of1.6 · 10−47 cm2 at mχ=50 GeV/c2.
Keywords: Dark matter experiments, dark matter simulations

Contents
1 Introduction 1
2 The XENON1T experiment and its simulation in GEANT4 32.1 Detector model 42.2 Radioactive contamination in detector materials 72.3 Physics list in GEANT4 7
3 Electronic recoil background 83.1 Radioactivity from detector components 83.2 222Rn 103.3 85Kr 113.4 136Xe double-beta decay 113.5 Solar neutrinos 123.6 Summary of ER backgrounds 12
4 Nuclear recoil background 134.1 Radiogenic neutrons from detector components 134.2 Muon-induced neutrons 154.3 Coherent neutrino-nucleus scattering 164.4 Summary of NR backgrounds 16
5 Light yield 17
6 Conversion of energy deposition into light and charge signals 196.1 Generation of photons and electrons 196.2 Generation of S1 and S2 signals 206.3 Signal and background distributions in S1 21
7 Sensitivity prediction for XENON1T 217.1 Sensitivity projection towards XENONnT 24
8 Summary and Conclusions 25
A Appendix: XENON1T sensitivity with the LUX2015 emission model 27
1 Introduction
Astronomical and cosmological observations indicate that a large fraction of the energy con-tent of the Universe is composed of cold dark matter [1–4]. Recently, increasingly detailedstudies of the cosmic microwave background anisotropies have inferred the abundance of darkmatter with remarkable precision at (26.0 ± 0.5)% [5, 6]. One of the most favored particlecandidate, under the generic name of Weakly Interacting Massive Particles (WIMPs), arisesnaturally in many theories beyond the Standard Model of particle physics, such as supersym-metry, universal extra dimensions, or little Higgs models [7–9]. Although other candidates
– 1 –

exist, like axions [10], superheavy particles [11] and sterile neutrinos [12], in this study wewill focus on the detection of WIMPs.
Among the various experimental strategies to directly detect WIMP interactions, de-tectors using liquid xenon (LXe) as target have demonstrated the highest sensitivities overthe past years, for WIMP mass mχ > 6 GeV/c2 [13]. In 2012 and 2013 the XENON100experiment published the world’s best upper limits on the spin-independent [14] and spin-dependent [15] coupling of WIMPs to nucleons and neutrons, respectively. At the end of2013, the spin-independent result was confirmed and improved by the LUX experiment [16],also using LXe. To significantly increase the sensitivity with respect to the current scen-ario, the XENON collaboration is focusing on the XENON1T experiment [17]. The detectorconstruction in Hall B of the Laboratori Nazionali del Gran Sasso (LNGS) has started insummer 2013. At the end of 2015 the detector commissioning begun and the first science runis expected in the first months of 2016. With a target mass 32 times larger than XENON100and a reduced background rate, the sensitivity to the spin-independent WIMP-nucleon inter-action cross section is expected to improve by two orders of magnitude with respect to theXENON100 limits.
A robust estimation of the background rate of the XENON1T experiment is a key in-gredient for the sensitivity estimation. We can divide the background sources in two mainclasses: electronic recoils (ER) off the atomic electrons and nuclear recoils (NR) off the Xenuclei. The ER background is from radioactivity in the detector materials, sources intrinsicto the LXe (beta decay of 85Kr, of 222Rn and its daughters, and 136Xe double-beta decay)and from solar neutrinos scattering off electrons. The NR background comes from neutronsoriginated in spontaneous fission, (α, n) reactions and muon-induced interactions (spallations,photo-nuclear and hadronic interactions). Neutrinos, in particular those from the 8B channelin the Sun, also contribute to the NR background through coherent neutrino-nucleus scatter-ing, an interaction predicted in the Standard Model though not yet observed [18]. The WIMPsignal is also expected to be of the NR type, with a single scatter uniformly distributed inthe target volume.
Up to the current generation of direct-search dark matter experiments, ERs constitutethe main source of background. It has been very well characterized through Monte Carlo (MC)simulations, with measurements in good agreement with the predictions, see for instance thestudies in XENON100 [19], EDELWEISS [20] and LUX [21]. The NR background has beenpredicted [20–22], but no direct measurement has been possible so far, given the small numberof expected NR events in the exposure of the current experiments.
The goal of the XENON1T experiment requires an ultra-low background (order of a few10−4 (kg · day · keV)−1 for the total ER background) in the central detector region. Hencewe performed a careful screening and selection campaign for all the detector constructionmaterials, especially those in close proximity to the xenon target, and we developed powerfulpurification techniques to remove the intrinsic contaminants from the xenon. The externalgammas and neutrons from the muons and laboratory environment are reduced to negligiblelevels by operating the experiment deep underground at LNGS and by placing the detectorinside a shield made of at least 4 m of water, contained in a stainless steel tank. The watertank is instrumented with light sensors to be operated as a Cherenkov muon veto [23].
The aim of this paper is to describe the various sources of background in XENON1T,quantify their contribution together with the associated fluctuations when converted into thesignals observed in the detector, and calculate the sensitivity of the experiment in the searchfor WIMP interactions. The work is organized as follows: in section 2 we describe the details
– 2 –

Diving bell
PTFE pillars
Supports
Field shaping
electrodes
PMTs
PMT bases
PTFE reflector
Copper plate
PTFE bottom plateCathode
Figure 1. (Left) Artistic view showing the double-wall stainless steel cryostat positioned in thecenter of the water tank. Also visible are the PMTs of the muon veto system, the support structureand the main pipe. (Right) Rendering of the external part of the TPC, as modeled in the GEANT4simulation. From top to bottom, the diving bell (cyan), PTFE pillars and support parts (brown),field shaping electrodes (yellow), PTFE reflector among the PMTs (red), PMTs in the bottom array(orange), copper plate (green), PMT bases (blue).
of the MC simulation of the detector and the contaminations of the materials used to buildthe experiment. The ER and NR background predictions are described in sections 3 and 4,respectively. In section 5 we describe the simulation of the light collection efficiency of thedetector. The conversion from the energy deposited in LXe to the light and charge signals inthe detector is described in section 6. The physics reach of the XENON1T experiment and ofits upgraded version XENONnT are discussed in section 7. Finally, summary and conclusionsare presented in section 8.
2 The XENON1T experiment and its simulation in GEANT4
The XENON1T detector is a dual phase time projection chamber (TPC) [24] filled withxenon. A particle interaction in the LXe target produces both excited and ionized atoms.De-excitation of excited molecular states leads to a prompt scintillation signal (S1), whichis recorded by photomultiplier tubes (PMTs) placed below the target in the LXe and aboveit in the gaseous phase (GXe). Applying an electric drift field (the design goal is to reach1 kV/cm), a large fraction of the ionization electrons is moved away from the interactionsite to the top of the TPC. Here the electrons are extracted by a strong electric field (of theorder of 10 kV/cm) from the liquid into the gaseous phase creating a secondary scintillationsignal (S2) by collisions with xenon atoms, which is proportional to the number of extractedionization electrons [25]. The S2 signal is detected by the same PMTs, and it is delayed withrespect to S1 by the time required to drift the electron cloud from the interaction site tothe liquid/gas interface. With the information recorded in the TPC, a 3-dimensional vertexreconstruction is possible using the drift time for the vertical coordinate and the hit pattern
– 3 –

of the S2 signal on the top PMT array for the (x, y) position in the horizontal plane. Singlescatter interactions can be distinguished from multiple scatters, as the latter feature morethan one S2 signal. Due to the different specific energy loss along the track, the S2/S1 ratiois different for ER, where the interaction is with atomic electrons (from γ, β and neutrinobackgrounds), and for NR, where the interaction is with the nucleus itself (from WIMPs,neutrons or neutrinos). WIMPs are expected to produce a single interaction in the activeregion, uniformly distributed in the volume, and of the NR type. We thus select NRs using theS2/S1 ratio to discriminate the WIMP signal from the ER background and requiring a singlescatter interaction occurring in the central part of the active volume, since the backgroundfrom the detector components is larger in the outer layers of the TPC.
2.1 Detector model
The MC simulation of the XENON1T experiment is developed using the GEANT4 toolkit[26]. The model features all components of significant mass or impact for the photon collectionefficiency and was built according to the CAD construction drawings. A rendered model ofthe XENON1T detector, as it is implemented in the MC simulation, is shown in figure 1.
The total amount of about 3.5 t of LXe is contained in a vacuum-insulated double-wallcryostat made of 5 mm thick low radioactivity stainless steel (SS). The dimensions of theinner cryostat are chosen to host the XENON1T TPC, while the outer vessel is sufficientlylarge to host also the future upgraded version of the experiment, XENONnT. Both vesselsare composed of a central cylindrical part, closed by a dome on each side. The top domes areattached to the cylindrical part through two flanges, each 45 mm thick. The cryostats areconnected to the XENON1T cryogenic system via a long double-wall vacuum-insulated pipe,starting from a central port in the top domes.
The target inside the TPC consists of about 2 t of LXe, constrained laterally by anapproximately cylindrical structure of 24 interlocking polytetrafluoroethylene (PTFE) panelswith a radius of ∼ 480 mm. The target volume is viewed by two arrays of PMTs. One isdirectly immersed in LXe at the bottom of the TPC, and consists of 121 PMTs in a compacthexagonal structure, to maximize the light collection efficiency. The second is placed in GXeabove the target volume, and is made of 127 PMTs arranged in concentric rings to improve theradial position reconstruction. While the bottom array fits into the TPC radius, the radius ofthe top array is ∼ 40 mm larger, to achieve a good resolution in the position reconstructionalso at the edge of the TPC. The space between the PMTs is covered with PTFE to reflectthe vacuum ultraviolet (VUV) light [27] and ensure a high light collection efficiency. Thestructure of the TPC is sustained on the outside region through PTFE pillars. AdditionalPTFE and copper disks support the two PMT arrays.
The PMTs are 3” Hamamatsu R11410-21, specifically developed for XENON1T, andchosen for their high quantum efficiency (35% on average) and low radioactivity, which wasevaluated through a screening campaign performed by the XENON1T collaboration [28].Their characteristics and performance are described in more detail in [29, 30]. The maincomponents of the PMT, reproduced in the GEANT4 model, are a cobalt-free body made ofKovar, a quartz window and a ceramic stem, with some smaller parts made of SS. We did notinclude in the model some internal components as the dynodes and the getter, nor the tinyones (as the pins). The voltage divider circuit is mounted on a base made of Cirlex, modeledas a simple thin disk.
The electric fields in the TPC are generated through electrodes made of SS meshes orwires stretched onto SS rings. There are two electrodes on the bottom of the TPC: the
– 4 –
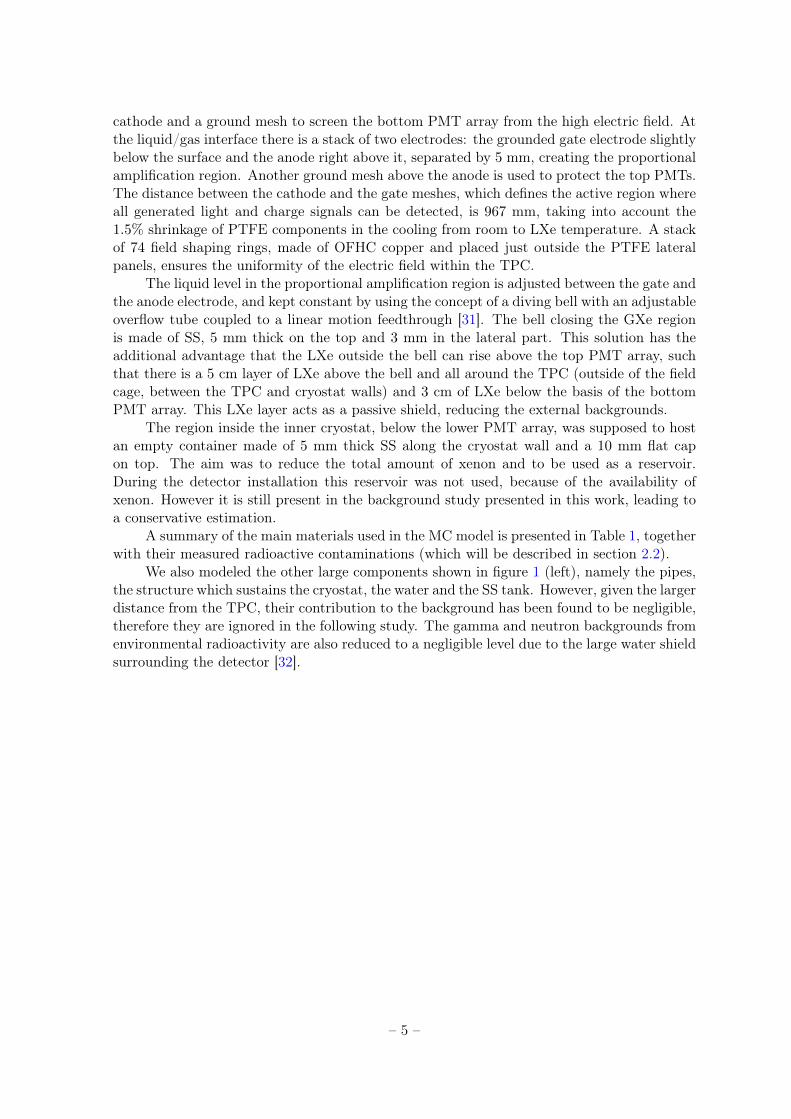
cathode and a ground mesh to screen the bottom PMT array from the high electric field. Atthe liquid/gas interface there is a stack of two electrodes: the grounded gate electrode slightlybelow the surface and the anode right above it, separated by 5 mm, creating the proportionalamplification region. Another ground mesh above the anode is used to protect the top PMTs.The distance between the cathode and the gate meshes, which defines the active region whereall generated light and charge signals can be detected, is 967 mm, taking into account the1.5% shrinkage of PTFE components in the cooling from room to LXe temperature. A stackof 74 field shaping rings, made of OFHC copper and placed just outside the PTFE lateralpanels, ensures the uniformity of the electric field within the TPC.
The liquid level in the proportional amplification region is adjusted between the gate andthe anode electrode, and kept constant by using the concept of a diving bell with an adjustableoverflow tube coupled to a linear motion feedthrough [31]. The bell closing the GXe regionis made of SS, 5 mm thick on the top and 3 mm in the lateral part. This solution has theadditional advantage that the LXe outside the bell can rise above the top PMT array, suchthat there is a 5 cm layer of LXe above the bell and all around the TPC (outside of the fieldcage, between the TPC and cryostat walls) and 3 cm of LXe below the basis of the bottomPMT array. This LXe layer acts as a passive shield, reducing the external backgrounds.
The region inside the inner cryostat, below the lower PMT array, was supposed to hostan empty container made of 5 mm thick SS along the cryostat wall and a 10 mm flat capon top. The aim was to reduce the total amount of xenon and to be used as a reservoir.During the detector installation this reservoir was not used, because of the availability ofxenon. However it is still present in the background study presented in this work, leading toa conservative estimation.
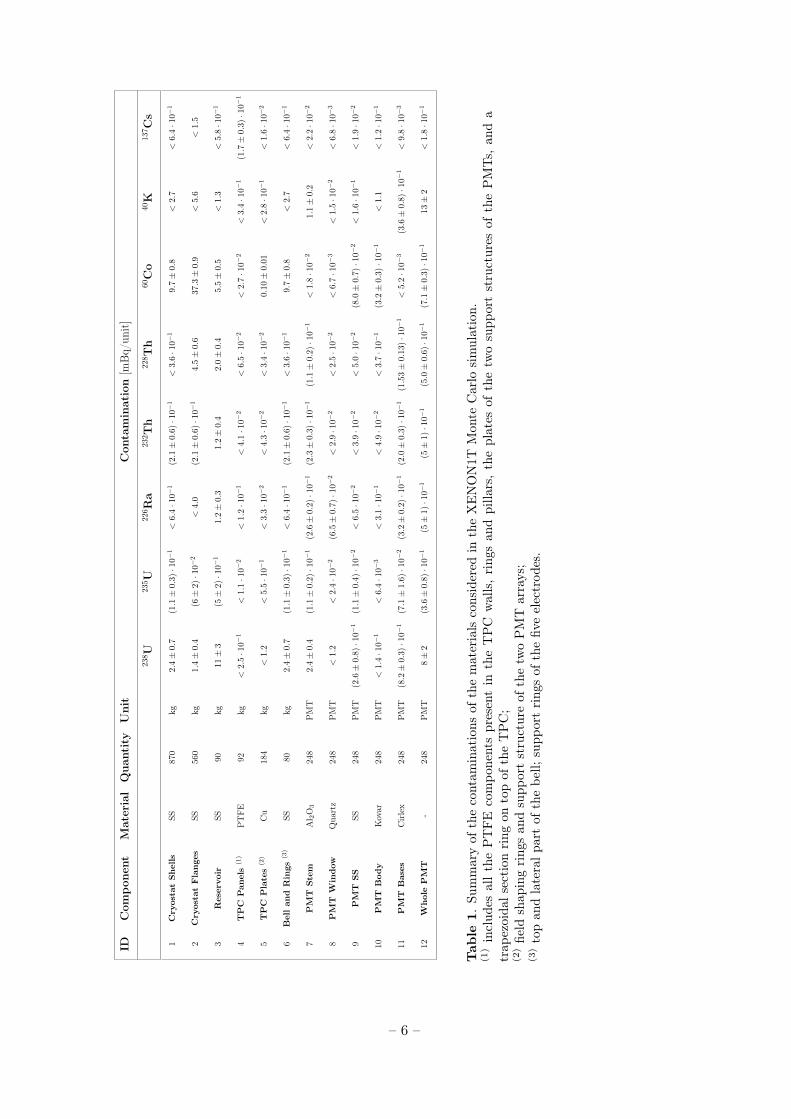
A summary of the main materials used in the MC model is presented in Table 1, togetherwith their measured radioactive contaminations (which will be described in section 2.2).
We also modeled the other large components shown in figure 1 (left), namely the pipes,the structure which sustains the cryostat, the water and the SS tank. However, given the largerdistance from the TPC, their contribution to the background has been found to be negligible,therefore they are ignored in the following study. The gamma and neutron backgrounds fromenvironmental radioactivity are also reduced to a negligible level due to the large water shieldsurrounding the detector [32].
– 5 –
IDC
ompon
ent
Mat
eria
lQ
uant
ity
Uni
tC
onta
min
atio
n[m
Bq/
unit]
238U
235U
226R
a232T
h228T
h60C
o40K
137C
s
1C
ryos
tat
Shel
lsSS
870
kg2.4±
0.7
(1.1±
0.3
)·1
0−1
<6.4·1
0−
1(2.1±
0.6)·1
0−
1<
3.6·1
0−1
9.7±
0.8
<2.
7<
6.4·1
0−
1
2C
ryos
tat
Fla
nge
sSS
560
kg1.4±
0.4
(6±
2)·1
0−2
<4.
0(2.1±
0.6)·1
0−1
4.5±
0.6
37.3±
0.9
<5.
6<
1.5
3R
eser
voir
SS90
kg11±
3(5±
2)·1
0−1
1.2±
0.3
1.2±
0.4
2.0±
0.4
5.5±
0.5
<1.
3<
5.8·1
0−1
4T
PC
Pan
els
(1)
PTFE
92kg
<2.
5·1
0−1
<1.
1·1
0−2
<1.2·1
0−
1<
4.1·1
0−2
<6.5·1
0−2
<2.
7·1
0−2
<3.
4·1
0−1
(1.7±
0.3
)·1
0−1
5T
PC
Pla
tes
(2)
Cu
184
kg<
1.2
<5.
5·1
0−1
<3.3·1
0−
2<
4.3·1
0−2
<3.4·1
0−2
0.10±
0.01
<2.
8·1
0−1
<1.6·1
0−2
6B
ellan
dR
ings
(3)
SS80
kg2.4±
0.7
(1.1±
0.3
)·1
0−1
<6.4·1
0−
1(2.1±
0.6)·1
0−
1<
3.6·1
0−1
9.7±
0.8
<2.
7<
6.4·1
0−
1
7P
MT
Ste
mAl 2O
324
8PMT
2.4±
0.4
(1.1±
0.2
)·1
0−1
(2.6±
0.2
)·1
0−1
(2.3±
0.3)·1
0−
1(1.1±
0.2
)·1
0−1
<1.
8·1
0−2
1.1±
0.2
<2.2·1
0−
2
8P
MT
Win
dow
Qua
rtz
248
PMT
<1.2
<2.
4·1
0−2
(6.5±
0.7
)·1
0−2
<2.9·1
0−2
<2.5·1
0−2
<6.
7·1
0−3
<1.
5·1
0−2
<6.8·1
0−
3
9P
MT
SS
SS24
8PMT
(2.6±
0.8)·1
0−1
(1.1±
0.4
)·1
0−2
<6.5·1
0−2
<3.9·1
0−2
<5.0·1
0−
2(8.0±
0.7
)·1
0−2
<1.6·1
0−1
<1.9·1
0−2
10P
MT
Bod
yKovar
248
PMT
<1.
4·1
0−1
<6.
4·1
0−3
<3.1·1
0−
1<
4.9·1
0−2
<3.7·1
0−1
(3.2±
0.3
)·1
0−1
<1.
1<
1.2·1
0−1
11P
MT
Bas
esCirlex
248
PMT
(8.2±
0.3)·1
0−1
(7.1±
1.6
)·1
0−2
(3.2±
0.2
)·1
0−1
(2.0±
0.3)·1
0−1
(1.5
3±
0.1
3)·1
0−1
<5.
2·1
0−3
(3.6±
0.8
)·1
0−1
<9.8·1
0−3
12W
hol
eP
MT
-24
8PMT
8±
2(3.6±
0.8
)·1
0−1
(5±
1)·1
0−1
(5±
1)·1
0−1
(5.0±
0.6
)·1
0−1
(7.1±
0.3
)·1
0−1
13±
2<
1.8·1
0−1
Tab
le1.
Summaryof
thecontam
inations
ofthematerials
considered
intheXENON1T
Mon
teCarlo
simulation.
(1)includ
esallthePTFE
compo
nentspresentin
theTPC
walls,ring
san
dpilla
rs,theplates
ofthetw
osupp
ortstructures
ofthePMTs,
anda
trap
ezoida
lsection
ring
ontopof
theTPC;
(2)field
shap
ingring
san
dsupp
ortstructureof
thetw
oPMT
arrays;
(3)topan
dlateralp
artof
thebe
ll;supp
ortring
sof
thefiv
eelectrod
es.
– 6 –
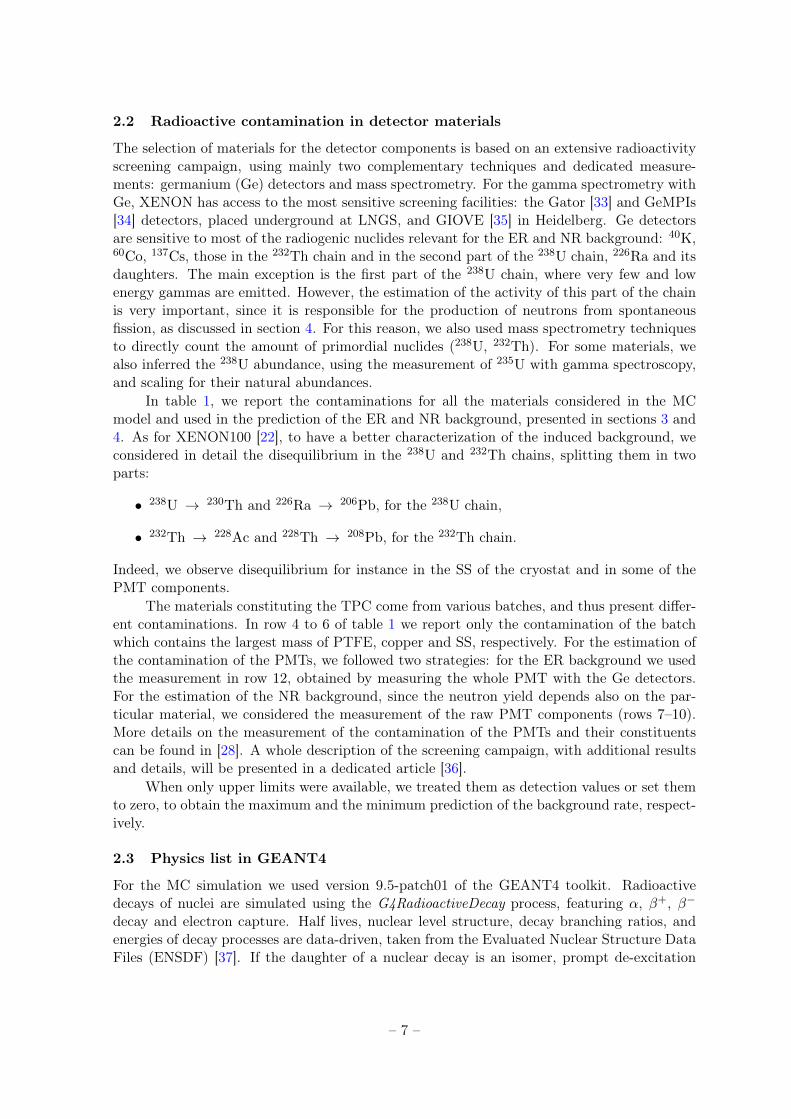
2.2 Radioactive contamination in detector materials
The selection of materials for the detector components is based on an extensive radioactivityscreening campaign, using mainly two complementary techniques and dedicated measure-ments: germanium (Ge) detectors and mass spectrometry. For the gamma spectrometry withGe, XENON has access to the most sensitive screening facilities: the Gator [33] and GeMPIs[34] detectors, placed underground at LNGS, and GIOVE [35] in Heidelberg. Ge detectorsare sensitive to most of the radiogenic nuclides relevant for the ER and NR background: 40K,60Co, 137Cs, those in the 232Th chain and in the second part of the 238U chain, 226Ra and itsdaughters. The main exception is the first part of the 238U chain, where very few and lowenergy gammas are emitted. However, the estimation of the activity of this part of the chainis very important, since it is responsible for the production of neutrons from spontaneousfission, as discussed in section 4. For this reason, we also used mass spectrometry techniquesto directly count the amount of primordial nuclides (238U, 232Th). For some materials, wealso inferred the 238U abundance, using the measurement of 235U with gamma spectroscopy,and scaling for their natural abundances.
In table 1, we report the contaminations for all the materials considered in the MCmodel and used in the prediction of the ER and NR background, presented in sections 3 and4. As for XENON100 [22], to have a better characterization of the induced background, weconsidered in detail the disequilibrium in the 238U and 232Th chains, splitting them in twoparts:
• 238U → 230Th and 226Ra → 206Pb, for the 238U chain,
• 232Th → 228Ac and 228Th → 208Pb, for the 232Th chain.
Indeed, we observe disequilibrium for instance in the SS of the cryostat and in some of thePMT components.
The materials constituting the TPC come from various batches, and thus present differ-ent contaminations. In row 4 to 6 of table 1 we report only the contamination of the batchwhich contains the largest mass of PTFE, copper and SS, respectively. For the estimation ofthe contamination of the PMTs, we followed two strategies: for the ER background we usedthe measurement in row 12, obtained by measuring the whole PMT with the Ge detectors.For the estimation of the NR background, since the neutron yield depends also on the par-ticular material, we considered the measurement of the raw PMT components (rows 7–10).More details on the measurement of the contamination of the PMTs and their constituentscan be found in [28]. A whole description of the screening campaign, with additional resultsand details, will be presented in a dedicated article [36].
When only upper limits were available, we treated them as detection values or set themto zero, to obtain the maximum and the minimum prediction of the background rate, respect-ively.
2.3 Physics list in GEANT4
For the MC simulation we used version 9.5-patch01 of the GEANT4 toolkit. Radioactivedecays of nuclei are simulated using the G4RadioactiveDecay process, featuring α, β+, β−
decay and electron capture. Half lives, nuclear level structure, decay branching ratios, andenergies of decay processes are data-driven, taken from the Evaluated Nuclear Structure DataFiles (ENSDF) [37]. If the daughter of a nuclear decay is an isomer, prompt de-excitation
– 7 –
is managed through the G4PhotonEvaporation process. For gamma and electron interac-tions, we chose the Livermore physics list, particularly suited to describe the electromagneticinteractions of low energy particles. For low energy neutrons (<20 MeV) we use the HighPrecision physics list where the elastic, inelastic and capture processes are described in de-tail, using the neutron data files G4NDL 3.13 with thermal cross sections, which are basedon the ENDF/B-VI/B-VII databases [38].
In GEANT4 the tracking of the various particles is divided into steps, whose length isautomatically chosen according to the type and energy of the particle, and the characteristicsof the medium. For each step of all the particles inside the LXe target, we record the position,time, deposited energy, particle type and the process responsible for the energy loss.
3 Electronic recoil background
In XENON1T, we distinguish ERs from the expected signal of NRs based on their differentS2/S1 ratio. The typical rejection efficiency achieved in XENON100 is of the order of 99.5%at 50% signal acceptance [14]. However, potential statistical leakage of ER events into theNR region can mimic a WIMP signal. Thus, we considered all the relevant sources of ERbackground: radioactive contamination of the detector materials, radioactive isotopes intrinsicto the LXe (222Rn and its daughters, 85Kr, and 136Xe double-beta decays) and solar neutrinosscattering off electrons.
We select the background events requiring a single scatter interaction in the TPC, oc-curring in the fiducial volume (FV, the most internal region of the LXe target), and in thelow energy range.
To determine the single scatter, we adopted the following strategy: we convert thedeposited energy into the number of produced electrons, following the procedure detailedin section 6, and we apply a selection similar to the one currently used in the XENON100analysis [39]. Namely, we require the second largest S2 to be smaller than 5 electrons. Thecapability to distinguish two scatters is related also to the width of the S2 signal peaks in thetime domain, and to the peak separation efficiency of the S2 peak finder algorithm. Basedon the XENON100 performance [31], a multiple scatter event is misidentified as a singlescatter if the interactions occur within 3 mm in the vertical direction. In this analysis, weconservatively did not use the (x, y) information to separate two scatters occurring withinthe same horizontal plane.
The reference 1 t FV is defined as a super-ellipsoid of third degree, centered in the middleof the active region, with radius and semi-height equal to 40 cm, such that a minimum distanceof 4 cm to the borders of the TPC is guaranteed. However, we also considered other FVs inour analysis modifying both radius and semi-height by the same factor.
With the typical velocities from the standard galactic halo model [40], WIMPs areexpected to produce NRs in xenon with kinetic energies mostly below 50 keV, with a strongdependence on the WIMP mass. Considering the different light response of LXe to ERinteractions (a detailed discussion will follow in section 6), this NR energy corresponds to anER energy of about 12 keV. To avoid fake events generated by accidental coincidence of PMTdark counts, we use a lower energy threshold of 1 keV.
3.1 Radioactivity from detector components
For each of the components listed in table 1, we generated the decays of all the isotopes,confining their origin uniformly inside their volume. The background events are due to γ-rays
– 8 –

Electronic Recoil Energy [keV]0 500 1000 1500 2000 2500
] -
1 k
eV )
⋅ d
ay
⋅E
R R
ate
[ (
kg
8−10
7−10
6−10
5−10
4−10
3−10
2−10
1−10
Pb214
Bi214 Bi214
Bi214
Bi214
Bi214Bi214
Bi214
Bi214 Bi214
Bi214
Bi214
Tl208
Tl208 Tl208Bi212
Ac228 Ac228
Ac228 Tl208
Cs137
Co60 Co60
K40
Total Cryostat Shells
Cryostat Flanges SS in the TPC
PMT and Bases PTFE and Cu in the TPC
Figure 2. Energy spectrum in 1 t FV of the total ER background from the detector materials (black),and the separate contributions from the various components (colors).
that reach the internal volume of the active region, producing a low energy Compton scatterand exiting the detector without other interactions. We generated about 109 decays for eachdetector component i and radioactive isotope j. By using the selection criteria introducedabove, we obtain the number of surviving events, Ni,j . The differential background rate, Ri,j ,is calculated as:
Ri,j = Ni,j/(Ti,j ·MFV ·∆E), (3.1)
where MFV is the fiducial mass considered, ∆E is the energy range, and Ti,j is the effectivelivetime given by:
Ti,j = NGi,j/(Mi ·Ai,j), (3.2)
where NGi,j is the number of generated events in each MC simulation, Mi and Ai,j are the
masses and the specific activities reported in table 1.The recoil energy spectrum 1 of background events in the 1 t FV is shown in figure 2.
At low energies, below 200 keV, the spectrum is generated by Compton scatter processes andit is almost flat, while at higher energies the various photo-absorption peaks are visible. Thetotal background rate from materials in the (1, 12) keV energy range is (7.3± 0.7) · 10−6 (kg ·day · keV)−1, corresponding to (30 ± 3) y−1 in 1 t FV. The uncertainty includes those fromthe measurements of the material contaminations, the statistical uncertainty in Ni,j and a10% systematic uncertainty accounting for the potential differences in modeling the actualgeometry of the detector in the MC (e.g. the use of the reservoir, the level of LXe abovethe diving bell). The highest contribution, 61% of the total ER background from materials,comes from the SS of the cryostat (shells and flanges), mainly from its 60Co contamination.The PMTs with their bases contribute 23%, while 15% is due to the other SS componentsinside the TPC (reservoir, diving bell, electrode rings). The ER background contributionfrom the PTFE and copper parts is about 1%.
1The smearing due to the energy resolution of the detector is not applied to the results shown throughoutsection 3 and 4
– 9 –

]2 [mm2R0 20 40 60 80 100 120 140 160 180 200 220
310×
Z [
mm
]
400−
300−
200−
100−
0
100
200
300
400
] -
1 k
eV )
⋅ d
ay
⋅E
R R
ate
[ (
kg
6−10
5−10
4−10
3−10
2−10
1−10
Figure 3. Spatial distribution of the ER back-ground events from the detector materials insidethe active LXe volume, in the (1, 12) keV energyrange. The thick black line indicates the refer-ence 1 t super-ellipsoid fiducial volume. With thepurple, red and brown lines, we indicate the FVscorresponding to 800 kg, 1250 kg and 1530 kg,respectively. The white regions present a back-ground rate smaller than 1·10−6 (kg ·day ·keV)−1.
Fiducial Mass [kg]200 400 600 800 1000 1200 1400 1600 1800
] -
1 k
eV)
⋅ d
ay
⋅E
R R
ate
[ (k
g
7−10
6−10
5−10
4−10
3−10Total Xe136 Total except materials
Rn222 Kr85 materials
νsolar
Figure 4. The total ER background rate as afunction of the fiducial mass (black line), togetherwith the separate contributions from the detectorcomponents (purple), 10 µBq/kg of 222Rn (red),0.2 ppt of natKr (blue), solar neutrinos (green)and 136Xe double-beta decay (brown). With thedashed violet line we show the sum of the back-ground sources uniformly distributed inside theLXe volume. The rate is averaged over the en-ergy range (1, 12) keV.
A lower bound in the background level can be evaluated by setting to zero all thecontaminations that are reported as upper limits in table 1. In this case the total backgroundrate is (6.7 ± 0.7) · 10−6 (kg · day · keV)−1, corresponding to (27 ± 3) y−1 in 1 t FV, about10% smaller than the previous estimate.
The spatial distribution of the background events inside the whole active volume, in theenergy range (1, 12) keV, is shown in figure 3 together with some fiducial volumes (corres-ponding to 800, 1000, 1250 and 1530 kg). The background rate as a function of the fiducialmass is shown in figure 4.
3.2 222Rn
In XENON1T, the main intrinsic source of background in LXe comes from the decays of 222Rndaughters. Being part of the 238U decay chain, 222Rn can emanate from the components ofthe detector and the gas system, or diffuse through the vacuum seals. Due to its relativelylarge half-life (3.8 days), it can homogeneously distribute inside the LXe volume. Considering222Rn daughters, down to the long-lived 210Pb, the most dangerous contribution comes fromthe β decay of 214Pb to the ground state of 214Bi, with an end-point energy of 1019 keV,where no other radiation is emitted. According to GEANT4, version 10.0, the branchingratio for this channel is 10.9% 2. However, especially if the decay occurs close to the bordersof the active region, decays to other energy levels are also potentially dangerous since theaccompanying γ can exit the detector undetected. This is responsible for the slightly higherbackground rate from 222Rn seen at larger fiducial masses in figure 4. Given the increasedtarget mass in XENON1T, this effect is less relevant than what was observed in XENON100[19]. The only other β emitter in the chain (214Bi), also a potential source of background, canbe easily removed by looking at the time correlation with the α decay of its daughter, 214Po,
2Note that up to version 9.6 the branching ratio coded in GEANT4 was significantly smaller: 6.3%.
– 10 –

which occurs with a half-life of 164 µs. Therefore, the contribution of β decays of 214Bi is notconsidered in the background estimation.
To reduce the 222Rn concentration, XENON1T is built with materials selected for theirlow radon emanation. In addition, R&D activities on cryogenic distillation are on-going toimplement an online removal system, following the first assessment of the actual backgroundin XENON1T. In XENON100 we observed [41] that after the α-decay, the recoiling ions(218Po and 214Pb) are drifted towards the cathode. This results in a lower concentrationof the β emitters inside the fiducial volume, thus reducing the background with respect tothe assumption of a uniform distribution in the LXe volume. However, given that the finalreduction in rate due to this effect can be quantified only after the first run of the experiment,in this study we conservatively neglect it. From the measurements of the radon emanation ofthe materials in close contact with LXe (TPC and pipes), we estimate a 222Rn contaminationof 10 µBq/kg, a reduction of a factor ∼ 5 with respect to the current value achieved inXENON100. The predicted ER background in the (1, 12) keV energy region, in 1 t FV, is1.54 · 10−4 (kg · day · keV)−1. A 10% systematic uncertainty is assumed for the backgroundrate from 222Rn, mainly due to the uncertainties in the branching ratio of the 214Pb decay tothe ground state [42].
The other radioactive noble gas, 220Rn, has a lower probability to be diffused into theactive LXe volume, due to its short half-life (56 s). Thus, assuming a concentration <0.1 µBq/kg, the background induced by its daughters is considered negligible.
3.3 85Kr
Xenon is extracted from the atmosphere with a typical natKr/Xe concentration at the ppmlevel. Natural krypton contains traces of the radioactive isotope 85Kr, mainly produced bynuclear fission and released by nuclear fuel reprocessing plants and by nuclear weapon tests.Its relative isotopic abundance in Europe has been determined by low level counting to be2 · 10−11 [43]. 85Kr is a β emitter with a half-life of 10.76 y and an end-point energy of687 keV. The low energy tail of its β spectrum, shown in figure 5 (blue line), extends intothe region of interest for the WIMP search. Due to the uniform distribution of Kr inside theLXe volume, it is not possible to reduce this source of background by fiducialization.
During the 225 live-days science run of XENON100, a natKr/Xe concentration of (19±4) ppt [mol/mol] has been achieved by processing the gas through cryogenic distillation [14].Considering some samples drawn from the output of the XENON100 cryogenic distillationcolumn, the krypton concentration was measured to be (0.95 ± 0.16) ppt, the purest xenontarget ever employed in a LXe particle detector [44]. For XENON1T the goal is to furtherreduce the natKr/Xe concentration to 0.2 ppt, using a new high through-put and high sep-aration cryogenic distillation column [45]. Sub-ppt concentrations have also already beenachieved in tests of the cryogenic distillation column for XENON1T [46, 47].
The corresponding ER background in the low energy region (1, 12) keV is 7.7 ·10−6 (kg ·day · keV)−1, very similar to the ER background from materials in the 1 t FV. We adopta 20% uncertainty on the background rate from 85Kr, mainly due to the uncertainty in theshape of the β spectrum at low energies [48].
3.4 136Xe double-beta decay
Natural xenon contains 8.9% of 136Xe, a two-neutrino double-beta emitter with a Q-value of2458 keV. The most recent measurement of its half-life is 2.17 · 1021 y [49]. The double-betadecay energy spectrum is obtained from the DECAY0 [50] code and is shown in figure 5 (brown
– 11 –
Electronic Recoil Energy [keV]0 500 1000 1500 2000 2500
] -
1 k
eV )
⋅ d
ay
⋅E
R R
ate
[ (
kg
8−10
7−10
6−10
5−10
4−10
3−10
2−10
1−10
Total Rn222
materials Kr85
Xe136 νsolar
Electronic Recoil Energy [keV]0 50 100 150 200 250
] -
1 k
eV )
⋅ d
ay
⋅E
R R
ate
[ (
kg
7−10
6−10
5−10
4−10
3−10
2−10Total Rn222 materials
Kr85 Xe136 νsolar
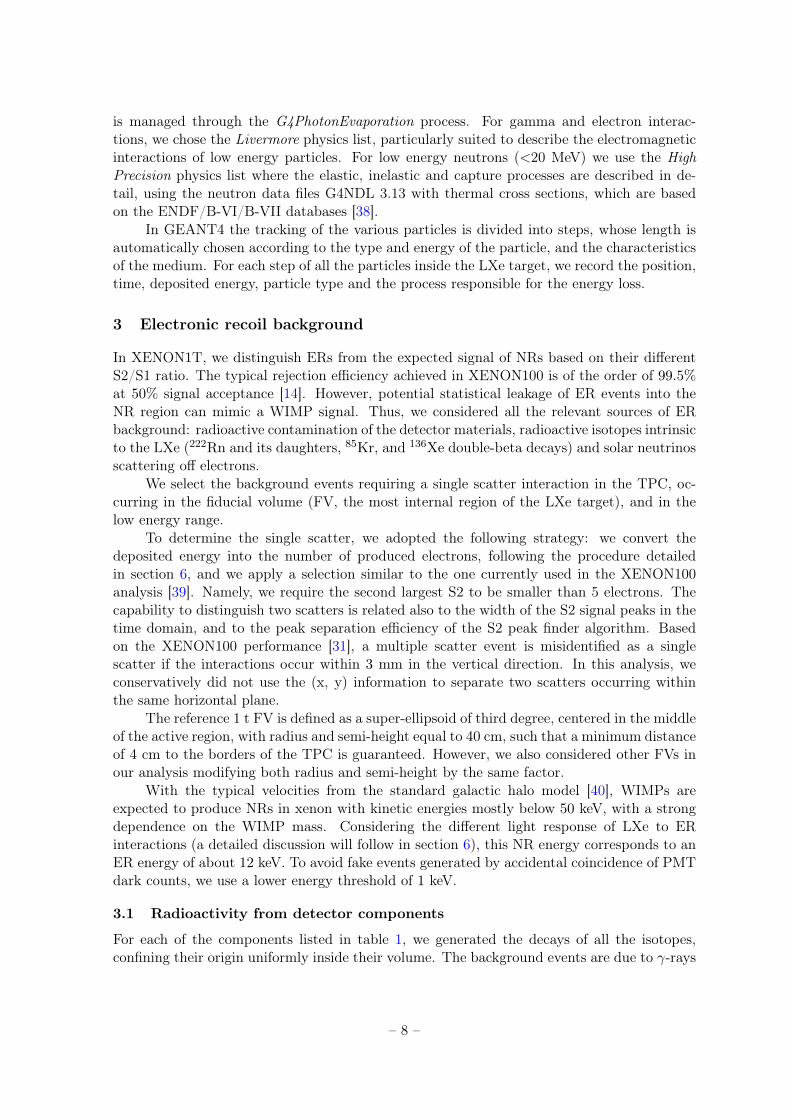
Figure 5. Energy spectrum of the total ER background rate in the 1 t fiducial volume (black), andthe separate contributions from detector components (purple), 10 µBq/kg of 222Rn (red), 0.2 ppt ofnatKr (blue), solar neutrinos (green) and 136Xe double-beta decay (brown). The right plot shows thezoom at low energies.
line). At low energies, its parameterization is given by (3.5 ·E/keV) · 10−7 (kg · day · keV)−1.The average background rate in the energy region (1, 12) keV is 2.3 · 10−6 (kg · day · keV)−1.Following the discussion in [51, 52], we assume a 15% uncertainty for the low energy part ofthe 136Xe double-beta decay spectrum.
3.5 Solar neutrinos
Solar neutrinos scatter elastically off the electrons of the medium, producing ER in the lowenergy region. We considered neutrinos from all nuclear reactions in the Sun [53, 54], takinginto account neutrino oscillation νe → νµ,τ with an electron neutrino survival probabilityPee = 0.55 [1] and the reduced cross section for νµ,τ . The resulting recoil energy spectrum isshown in figure 5 (green line), together with the other ER backgrounds. Most of the interac-tions (92%) come from pp neutrinos, 7Be contributes with 7%, while pep and all the otherssources contribute less than 1%. Below 100 keV the differential rate is slightly decreasing,which we parameterize as (9.155− 0.036 ·E/keV) · 10−6 (kg ·day · keV)−1. The average back-ground rate in the energy region (1, 12) keV is 8.9 · 10−6 (kg · day · keV)−1. This backgroundsource cannot be reduced and the only way to mitigate its impact is to improve the ERrejection [55]. We estimate a total 2% uncertainty on the ER background events from solarneutrinos, obtained by combining the ∼ 1% error in the flux from the pp chain and ∼ 10% inthe 7Be [54], and adding the ∼ 2% uncertainty in the oscillation parameter sin2(2θ12) [1].
3.6 Summary of ER backgrounds
The ER background spectrum in 1 t FV is summarized in figure 5. The average rate of thetotal background in the (1, 12) keV range is (1.80 ± 0.15) · 10−4 (kg · day · keV)−1. Most ofthe background (∼ 85%) comes from 222Rn, where we assumed a 10 µBq/kg contamination.Solar neutrinos, 85Kr (assuming a natKr/Xe concentration of 0.2 ppt), and ER from thematerials contribute each with (4 − 5)%. Even with the 8.9% natural abundance of 136Xe,its contribution to the total ER background is subdominant, less than 2%. The results aresummarized in table 2, together with their uncertainties. For energies larger than 500 keVthe radiation from materials becomes dominant.
– 12 –
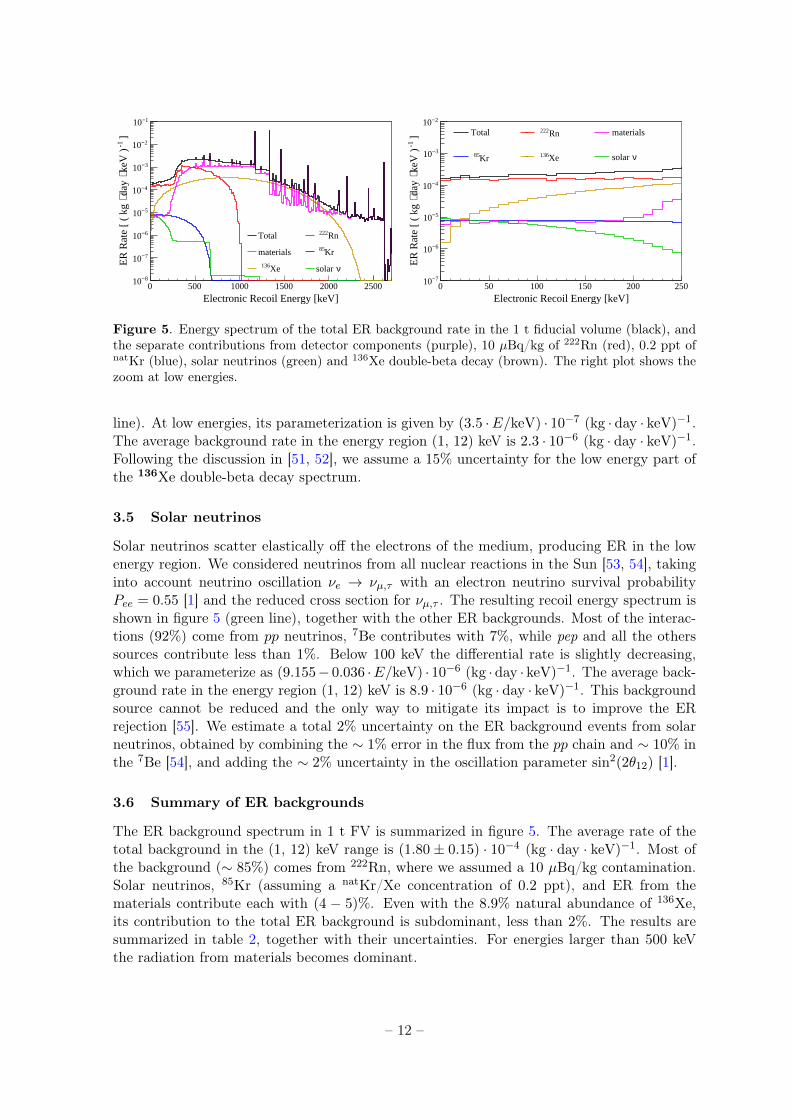
Source Background [(kg · day · keV)−1] Background [y−1] Fraction [%]
Materials (7.3± 0.7) · 10−6 30± 3 4.1222Rn (1.54± 0.15) · 10−4 620± 60 85.485Kr (7.7± 1.5) · 10−6 31± 6 4.3136Xe (2.3± 0.3) · 10−6 9± 1 1.4
Solar neutrinos (8.9± 0.2) · 10−6 36± 1 4.9Total (1.80± 0.15) · 10−4 720± 60 100
Table 2. Summary of the predicted ER backgrounds in XENON1T, evaluated in 1 t fiducial volumeand in (1, 12) keV energy range. We assume 10 µBq/kg of 222Rn, 0.2 ppt of natKr, and naturalabundance of 136Xe.
The dependence of the background rates on the fiducial mass is shown in figure 4: dueto the large contribution of background from 222Rn which is almost uniformly distributed inthe target volume, the one from the detector components becomes larger than the sum of theother backgrounds for fiducial masses larger than 1600 kg.
4 Nuclear recoil background
Neutrons can produce NRs via elastic scattering off xenon nuclei. In addition, fast neutronsare more penetrating than γ-rays, their mean free path in LXe being on the order of tensof cm, thus they are more difficult to shield and their probability to have a single scatter inthe LXe active volume is higher than for γ-rays. They can generate a signal which is, onan event-by-event basis, indistinguishable from that of WIMPs. It is, therefore, crucial tominimize and accurately characterize this potentially dangerous background. The presence ofisotopes of the primordial decay chains 238U, 235U and 232Th in the materials of the detectorgenerates radiogenic neutrons in the MeV range through spontaneous fission (SF), mainly from238U, and (α, n) reactions induced by the various α particles emitted along the decay chains.Additionally, cosmogenic neutrons with energies extending to tens of GeV are produced bymuons along their path through the rock into the underground laboratory and through thematerials that surround the detector.
Astrophysical neutrinos, in particular those produced in the 8B decay in the Sun, alsocontribute to the NR background as they can scatter coherently off the xenon nuclei, throughcoherent neutrino-nucleus scattering (CNNS). In a detector where it is not possible to measurethe direction of the recoil track, this is an irreducible background because it is a single scatterNR, uniformly distributed in the active volume of the TPC, defining the ultimate limitationto WIMP direct detection experiments [56]. See [57] for a review on the potential of futuredirectional detectors.
4.1 Radiogenic neutrons from detector components
The radiogenic neutron production rates and energy spectra were calculated with the SOURCES-4A software [58], with the procedure used for XENON100 [22, 59]. The neutron productionrates for all the relevant materials in the background prediction are presented in table 3, con-sidering also chain disequilibrium. The neutron yield from SF (1.1 · 10−6 neutrons per decay)is included in the 238U column. For heavy nuclei, the high Coulomb barrier suppresses the(α, n) interaction, so the neutron production is almost entirely due to SF. The highest (α, n)yields are from light materials, such as PTFE and the ceramic of the PMT stem. Among the
– 13 –
Neutron Energy [MeV]0 2 4 6 8 10
]-1
Neu
tron
Yie
ld p
er P
aren
t Dec
ay [
MeV
-1610
-1510
-1410
-1310
-1210
-1110
-1010
-910
-810
-710
-610
-510Th230U - 238
Pb207U - 235
Pb206Ra - 226
Ac228Th - 232
Pb208Th - 228
PTFE
Neutron Energy [MeV]0 2 4 6 8 10
]-1
Neu
tron
Yie
ld p
er P
aren
t Dec
ay [
MeV
-1610
-1510
-1410
-1310
-1210
-1110
-1010
-910
-810
-710
-610
-510Th230U - 238
Pb207U - 235
Pb206Ra - 226
Ac228Th - 232
Pb208Th - 228
Copper
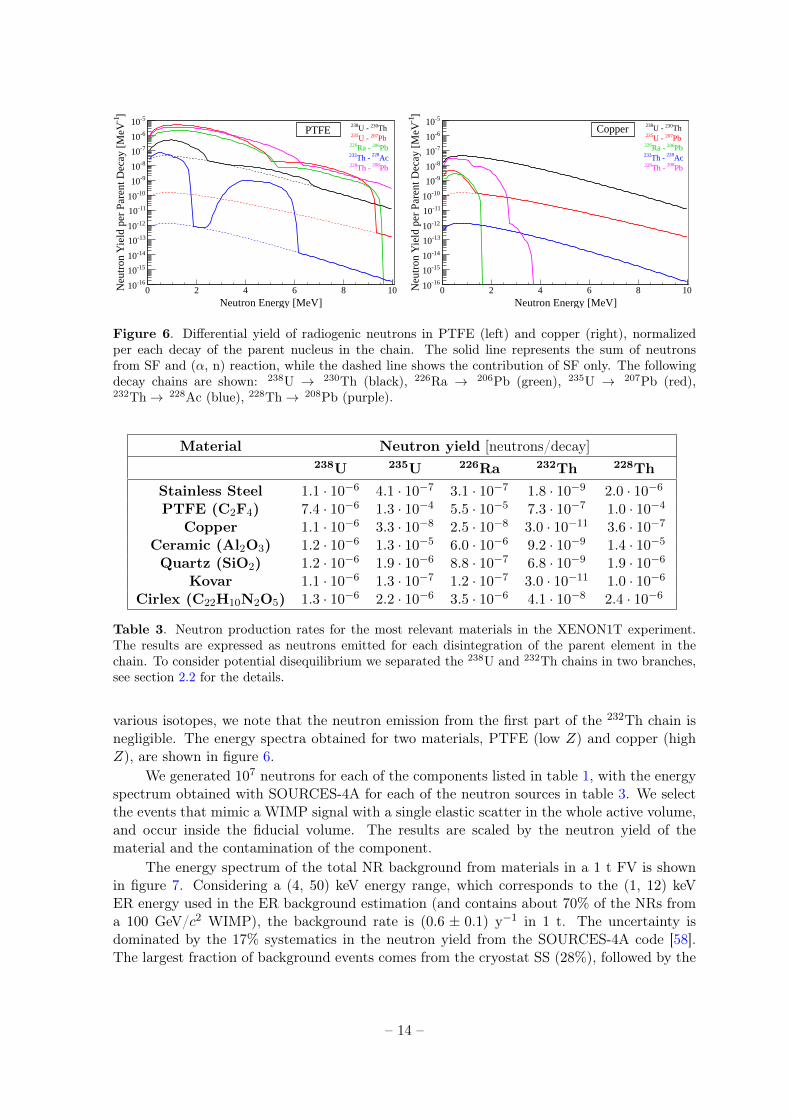
Figure 6. Differential yield of radiogenic neutrons in PTFE (left) and copper (right), normalizedper each decay of the parent nucleus in the chain. The solid line represents the sum of neutronsfrom SF and (α, n) reaction, while the dashed line shows the contribution of SF only. The followingdecay chains are shown: 238U → 230Th (black), 226Ra → 206Pb (green), 235U → 207Pb (red),232Th→ 228Ac (blue), 228Th→ 208Pb (purple).
Material Neutron yield [neutrons/decay]238U 235U 226Ra 232Th 228Th
Stainless Steel 1.1 · 10−6 4.1 · 10−7 3.1 · 10−7 1.8 · 10−9 2.0 · 10−6
PTFE (C2F4) 7.4 · 10−6 1.3 · 10−4 5.5 · 10−5 7.3 · 10−7 1.0 · 10−4
Copper 1.1 · 10−6 3.3 · 10−8 2.5 · 10−8 3.0 · 10−11 3.6 · 10−7
Ceramic (Al2O3) 1.2 · 10−6 1.3 · 10−5 6.0 · 10−6 9.2 · 10−9 1.4 · 10−5
Quartz (SiO2) 1.2 · 10−6 1.9 · 10−6 8.8 · 10−7 6.8 · 10−9 1.9 · 10−6
Kovar 1.1 · 10−6 1.3 · 10−7 1.2 · 10−7 3.0 · 10−11 1.0 · 10−6
Cirlex (C22H10N2O5) 1.3 · 10−6 2.2 · 10−6 3.5 · 10−6 4.1 · 10−8 2.4 · 10−6
Table 3. Neutron production rates for the most relevant materials in the XENON1T experiment.The results are expressed as neutrons emitted for each disintegration of the parent element in thechain. To consider potential disequilibrium we separated the 238U and 232Th chains in two branches,see section 2.2 for the details.
various isotopes, we note that the neutron emission from the first part of the 232Th chain isnegligible. The energy spectra obtained for two materials, PTFE (low Z) and copper (highZ), are shown in figure 6.
We generated 107 neutrons for each of the components listed in table 1, with the energyspectrum obtained with SOURCES-4A for each of the neutron sources in table 3. We selectthe events that mimic a WIMP signal with a single elastic scatter in the whole active volume,and occur inside the fiducial volume. The results are scaled by the neutron yield of thematerial and the contamination of the component.
The energy spectrum of the total NR background from materials in a 1 t FV is shownin figure 7. Considering a (4, 50) keV energy range, which corresponds to the (1, 12) keVER energy used in the ER background estimation (and contains about 70% of the NRs froma 100 GeV/c2 WIMP), the background rate is (0.6 ± 0.1) y−1 in 1 t. The uncertainty isdominated by the 17% systematics in the neutron yield from the SOURCES-4A code [58].The largest fraction of background events comes from the cryostat SS (28%), followed by the
– 14 –
Nuclear Recoil Energy [keV]0 10 20 30 40 50 60 70 80 90 100
]-1
keV
)⋅
day
⋅
NR
Rat
e [(
kg
-1110
-1010
-910
-810
-710
-610
-510
-410
-310
-210
CNNS
Radiogenic neutrons
Muon-induced neutrons
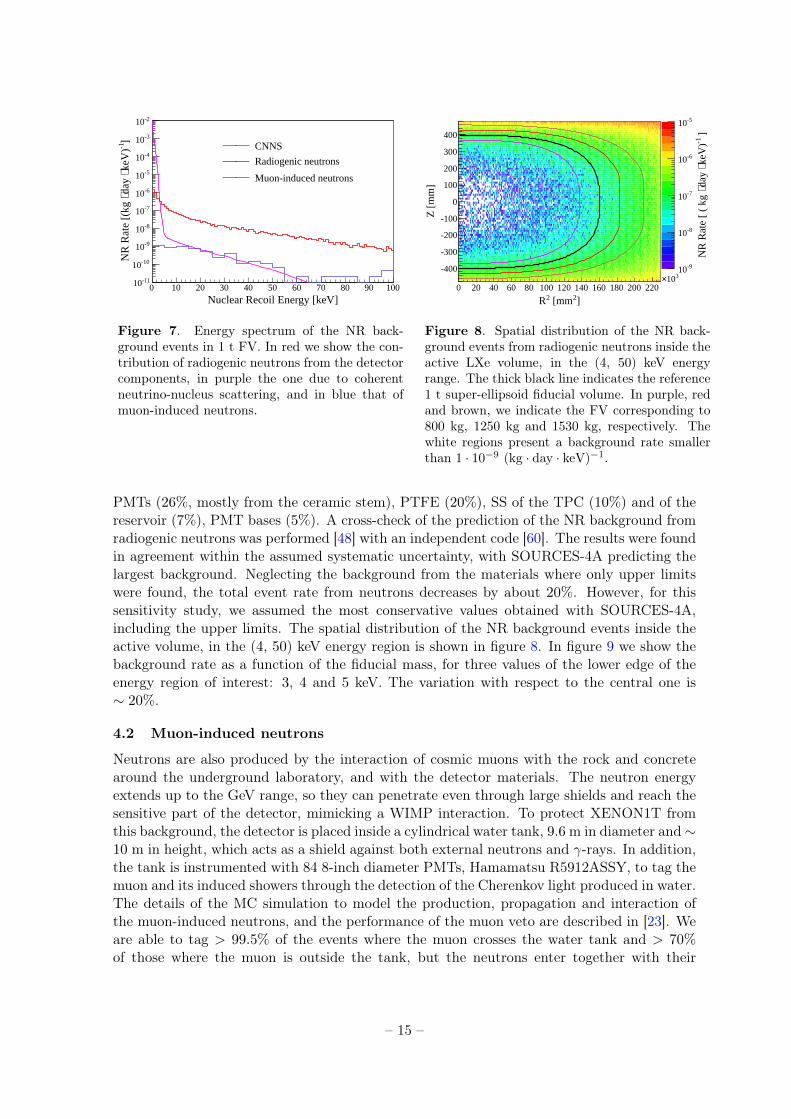
Figure 7. Energy spectrum of the NR back-ground events in 1 t FV. In red we show the con-tribution of radiogenic neutrons from the detectorcomponents, in purple the one due to coherentneutrino-nucleus scattering, and in blue that ofmuon-induced neutrons.
]2 [mm2R0 20 40 60 80 100 120 140 160 180 200 220
310×
Z [
mm
]
-400
-300
-200
-100
0
100
200
300
400 ]-1
keV
)⋅
day
⋅
NR
Rat
e [
( kg
-910
-810
-710
-610
-510
Figure 8. Spatial distribution of the NR back-ground events from radiogenic neutrons inside theactive LXe volume, in the (4, 50) keV energyrange. The thick black line indicates the reference1 t super-ellipsoid fiducial volume. In purple, redand brown, we indicate the FV corresponding to800 kg, 1250 kg and 1530 kg, respectively. Thewhite regions present a background rate smallerthan 1 · 10−9 (kg · day · keV)−1.
PMTs (26%, mostly from the ceramic stem), PTFE (20%), SS of the TPC (10%) and of thereservoir (7%), PMT bases (5%). A cross-check of the prediction of the NR background fromradiogenic neutrons was performed [48] with an independent code [60]. The results were foundin agreement within the assumed systematic uncertainty, with SOURCES-4A predicting thelargest background. Neglecting the background from the materials where only upper limitswere found, the total event rate from neutrons decreases by about 20%. However, for thissensitivity study, we assumed the most conservative values obtained with SOURCES-4A,including the upper limits. The spatial distribution of the NR background events inside theactive volume, in the (4, 50) keV energy region is shown in figure 8. In figure 9 we show thebackground rate as a function of the fiducial mass, for three values of the lower edge of theenergy region of interest: 3, 4 and 5 keV. The variation with respect to the central one is∼ 20%.
4.2 Muon-induced neutrons
Neutrons are also produced by the interaction of cosmic muons with the rock and concretearound the underground laboratory, and with the detector materials. The neutron energyextends up to the GeV range, so they can penetrate even through large shields and reach thesensitive part of the detector, mimicking a WIMP interaction. To protect XENON1T fromthis background, the detector is placed inside a cylindrical water tank, 9.6 m in diameter and∼10 m in height, which acts as a shield against both external neutrons and γ-rays. In addition,the tank is instrumented with 84 8-inch diameter PMTs, Hamamatsu R5912ASSY, to tag themuon and its induced showers through the detection of the Cherenkov light produced in water.The details of the MC simulation to model the production, propagation and interaction ofthe muon-induced neutrons, and the performance of the muon veto are described in [23]. Weare able to tag > 99.5% of the events where the muon crosses the water tank and > 70%of those where the muon is outside the tank, but the neutrons enter together with their
– 15 –
Fiducial Mass [kg]200 400 600 800 1000 1200 1400 1600 1800
]-1
NR
Rat
e [
y
-210
-110
1
[3, 50] keV[4, 50] keV[5, 50] keV
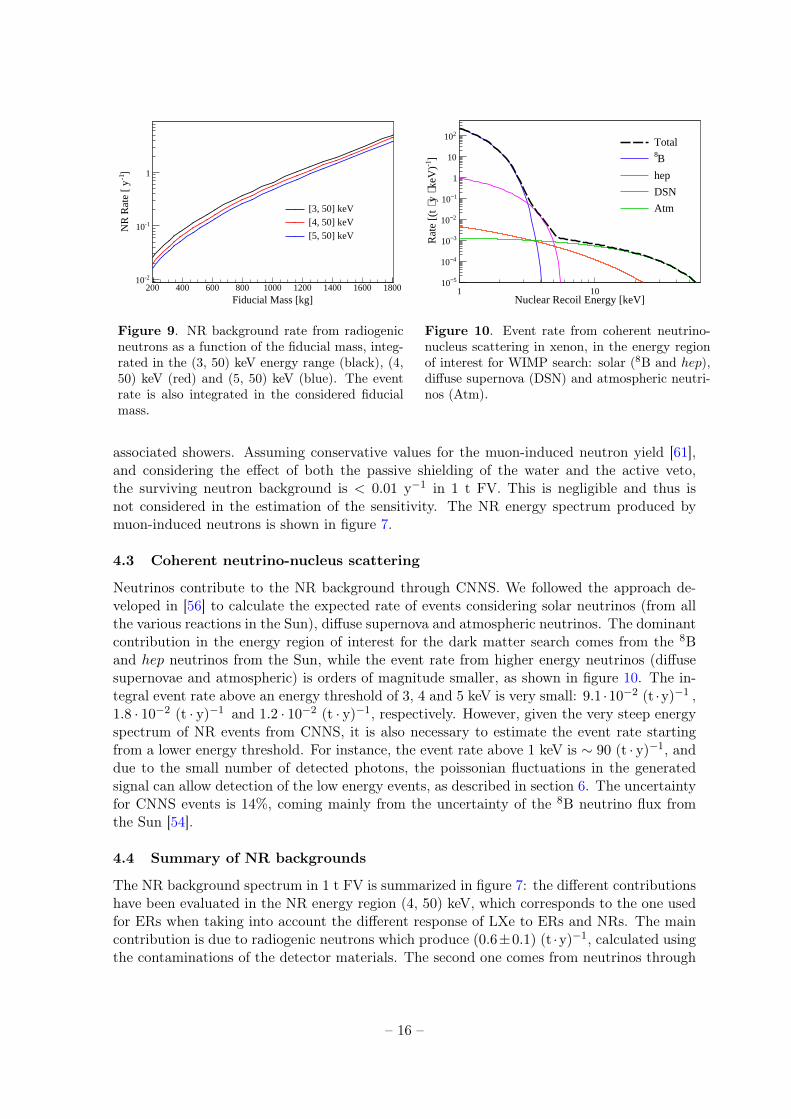
Figure 9. NR background rate from radiogenicneutrons as a function of the fiducial mass, integ-rated in the (3, 50) keV energy range (black), (4,50) keV (red) and (5, 50) keV (blue). The eventrate is also integrated in the considered fiducialmass.
Nuclear Recoil Energy [keV]1 10
]-1
keV
)⋅
y
⋅R
ate
[(t
5−10
4−10
3−10
2−10
1−10
1
10
210 Total
B8
hep
DSN
Atm
Figure 10. Event rate from coherent neutrino-nucleus scattering in xenon, in the energy regionof interest for WIMP search: solar (8B and hep),diffuse supernova (DSN) and atmospheric neutri-nos (Atm).
associated showers. Assuming conservative values for the muon-induced neutron yield [61],and considering the effect of both the passive shielding of the water and the active veto,the surviving neutron background is < 0.01 y−1 in 1 t FV. This is negligible and thus isnot considered in the estimation of the sensitivity. The NR energy spectrum produced bymuon-induced neutrons is shown in figure 7.
4.3 Coherent neutrino-nucleus scattering
Neutrinos contribute to the NR background through CNNS. We followed the approach de-veloped in [56] to calculate the expected rate of events considering solar neutrinos (from allthe various reactions in the Sun), diffuse supernova and atmospheric neutrinos. The dominantcontribution in the energy region of interest for the dark matter search comes from the 8Band hep neutrinos from the Sun, while the event rate from higher energy neutrinos (diffusesupernovae and atmospheric) is orders of magnitude smaller, as shown in figure 10. The in-tegral event rate above an energy threshold of 3, 4 and 5 keV is very small: 9.1 ·10−2 (t ·y)−1 ,1.8 · 10−2 (t · y)−1 and 1.2 · 10−2 (t · y)−1, respectively. However, given the very steep energyspectrum of NR events from CNNS, it is also necessary to estimate the event rate startingfrom a lower energy threshold. For instance, the event rate above 1 keV is ∼ 90 (t · y)−1, anddue to the small number of detected photons, the poissonian fluctuations in the generatedsignal can allow detection of the low energy events, as described in section 6. The uncertaintyfor CNNS events is 14%, coming mainly from the uncertainty of the 8B neutrino flux fromthe Sun [54].
4.4 Summary of NR backgrounds
The NR background spectrum in 1 t FV is summarized in figure 7: the different contributionshave been evaluated in the NR energy region (4, 50) keV, which corresponds to the one usedfor ERs when taking into account the different response of LXe to ERs and NRs. The maincontribution is due to radiogenic neutrons which produce (0.6±0.1) (t ·y)−1, calculated usingthe contaminations of the detector materials. The second one comes from neutrinos through
– 16 –

their coherent scattering off xenon nuclei: their rate in the same energy region is very small,(1.8±0.3) ·10−2 (t ·y)−1, but will become relevant once the detector response and the energyresolution are taken into account (in section 6). Finally, the background from muon-inducedneutrons is reduced to less than 0.01 (t · y)−1 by the water Cherenkov muon veto, and itscontribution is neglected in the study of the experiment sensitivity.
5 Light yield
The main goal of a dual-phase xenon TPC such as XENON1T is to detect low intensity VUVlight signals, produced either directly (S1) or through proportional scintillation (S2), in orderto be sensitive to low energy NRs. The light collection efficiency (LCE) is defined as thefraction of emitted photons reaching the PMTs. It depends on the position of the interactionin the active volume, and on the optical properties of LXe and of the materials around it.
Several measurements of the optical properties of LXe have been performed throughoutthe years, in the following for all of them we refer to the emission wavelength of 178 nm. Forthe refractive index, values were measured between 1.565± 0.002± 0.008 [62] and 1.69± 0.02[63]: in the simulation, we use the average value of 1.63. The second optical parameterrequired is the Rayleigh scattering length, which affects the mean free path of photons. Weadopt in the simulation the theoretical value of 30 cm [64], which is in agreement with thelowest measured values, ranging from ∼ 30 cm to ∼ 50 cm [63, 65, 66]. The last parameter ofinterest is the absorption length which mostly depends on the amount of impurities presentin the LXe (O2 and, more importantly, H2O) and is therefore dependent on the performanceof the purification system. In XENON1T we adopt a similar system to the one used inXENON100 [31] and we aim to reach a sub-ppb level for those impurities. Knowing that in[67] an absorption length of 1 m was achieved with a 100 ppb level of water, and assumingan inversely proportional scaling, we consider a conservative value of 50 m.
Another material whose optical properties must be properly defined is the quartz of thePMT window, as it governs the amount of light transmitted to the photocathode and, thus,the LCE. Using measurements from [68] and [69], we chose a refractive index of 1.59 for awavelength of 178 nm. The photocathode is modeled as a fully-opaque thin layer, placed onthe inner side of the PMT window where photons are absorbed. Apart from the cut-outsneeded to host the PMTs, the inner surface of the TPC is entirely made of PTFE in orderto reflect as much VUV light as possible. The reflectivity of the PTFE strongly depends onthe surface treatment, thus we studied the LCE with PTFE reflectivity values of 90%, 95%and 99%. A very good reflectivity (> 99%) has been obtained in the LUX detector [70]. Thelayer of GXe located between the LXe and the top PMT array is characterized by a refractiveindex equal to 1.
Finally, we also modeled the five electrodes used to define the electric field within theTPC. Four of them are hexagonally etched meshes: the top and bottom screening mesheshave an optical transparency of 94.5%, while that of the anode and gate meshes is 93%. Thecathode is made of thin wires and offers an optical transparency of 96%. In our simulationframework, the electrodes are modeled as a 200 µm thick disks with absorption length cal-culated to match their respective transparency at normal angle. Furthermore, the refractiveindex of each electrode is the same as its surrounding material (LXe or GXe): the reflectivityis, therefore, conservatively neglected here.
In this study, photons are generated uniformly and isotropically in the full volume of theTPC, and the LCE is calculated for each individual (R2,Z) pixel, using the axial symmetry
– 17 –

Absorption length [m]10 20 30 40 50 60 70 80 90 100
LC
E [
%]
20
25
30
35
40
PTFE with 99% reflectivityPTFE with 95% reflectivity
PTFE with 90% reflectivity
Our assumption
Ly
[PE
/keV
]
4.0
4.5
5.0
5.5
6.0
6.5
7.0
7.5
8.0
Figure 11. Average light collection efficiency inthe TPC as a function of the absorption length ofLXe, for different PTFE reflectivities. For eachPTFE reflectivity, the upper line corresponds toa LXe refractive index of 1.565, while the lowerline is for 1.69. In the right side of the Y axiswe show the corresponding light yield. The greentriangle marks the values of the optical parametersassumed for the sensitivity study presented in thefollowing sections.
]2 [mm2R0 20 40 60 80 100 120 140 160 180 200 220
310×
Z [
mm
]
400−
300−
200−
100−
0
100
200
300
400
LC
E [
%]
26
28
30
32
34
36
38
40
42
44
Figure 12. LCE as a function of the position inthe TPC, calculated with the parameters assumedfor the XENON1T model (green triangle in figure11). The LCE is the fraction of generated photonsreaching a PMT photocathode.
of the TPC. In figure 11, the LCE averaged over the active LXe volume is shown for differentPTFE reflectivities and different absorption lengths: improving the reflectivity from 90% to99% leads to a 37% gain in LCE, for a 50 m absorption length. Furthermore, increasing theabsorption length from 10 m to 50 m raises the LCE by 28%, for a fixed PTFE reflectivity of99%. The variation of LCE inside the TPC is shown in figure 12. Given the internal reflectionoccurring at the liquid/gas interface, the LCE is higher close to the bottom PMT array, inparticular in the center of the TPC, and decreases when moving closer to the anode due tothe increase in path length, leading to absorption of photons.
The light yield Ly(~r) is defined as the specific number of detected photoelectrons (PE)per keV, and it is traditionally referred to the 122 keV γ emitted by a 57Co source, at zeroelectric field. The average photon yield Phy of this γ line is estimated with a phenomenologicalmodel in NEST [71, 72] as 63.4 ph/keV. Ly(~r) is calculated as:
Ly(~r) = fPE(~r) · Phy = LCE(~r) ·QE · CE · Phy (5.1)
where fPE is the probability for an emitted photon to produce a photoelectron, LCE is thelight collection efficiency, QE is the average quantum efficiency of the PMTs (35%) 3, andCE is the average collection efficiency from the photocathode to the first dynode (90%) [29].The light yield is shown in the right vertical axis of figure 11.
In the following sections, we will estimate the sensitivity of XENON1T assuming a 99%PTFE reflectivity, 50 m in absorption length and the central value of the LXe refractionindex, as shown by the green triangle in figure 11: with this choice we obtain an average light
3The quoted QE has been measured at room temperature. However in [73] it was reported an increase ofQE at the LXe temperature, so the performances can be even better. In this study we conservatively assumethe room temperature QE.
– 18 –
yield in the TPC of 7.7 PE/keV at zero field. This result is about twice the one obtained inXENON100 (3.8 PE/keV [14]) and close to the one measured in LUX (8.8 PE/keV [16]).
6 Conversion of energy deposition into light and charge signals
To convert the energy deposited in the active LXe (Ed) into the light (S1) and charge (S2)signals, we first need a model which predicts the amount of generated photons and electrons.Then all the efficiencies in collecting the signals must be taken into account, together with thesignal statistical fluctuations. Even if the design goal is to use an electric field in the TPC of1 kV/cm, in the following we will conservatively assume 530 V/cm, as in XENON100, so thatwe can apply directly some of the measurements obtained with that detector, in particularthe specific charge yield for NR Qy.
6.1 Generation of photons and electrons
ER and NR present different scintillation and ionization yields, hence they are treated in thesimulation using two separate models.
For ERs, we used the approach developed in NEST (version 0.98) [71, 72]: first thetotal number of quanta 〈NQ〉 = (73 · Ed/keV) is calculated and smeared using a Gaussiandistribution with a 0.03 Fano factor [74]. Then they are shared between Nph photons andNel electrons, such that NQ = Nph + Nel, to ensure the anti-correlation between the twosignals. The amount of photons and electrons is evaluated following the Doke-Birks [75]recombination model or the Thomas-Imel [76] model for short length tracks, correspondingto energies smaller than ∼ (10 − 15) keV. The recombination is calculated directly in theGEANT4 simulation, on a event-by-event basis, considering the dE/dX of each particle forDoke-Birks, and its energy for the Thomas-Imel model. The fluctuations on Nph (and thecorresponding ones for Nel) are properly taken into account using sampling from a Binomialdistribution.
Traditionally, for NR, the photon yield is parameterized in terms of the so-called relativescintillation efficiency in LXe (Leff). Similarly to the light yield described in equation 5.1,also Leff is defined with reference to Phy, the light emitted by the 122 keV γ from 57Co. Weused a strategy similar to that described in [77], obtaining the average number of photons〈NNR
ph 〉 as:
〈NNRph 〉 = Ed · Leff · Phy · SNR
where SNR = 0.95 is the light yield suppression factor for NR, due to the electric field. Asin the previous analyses of the XENON100 experiment, Leff is taken from an average of thevarious direct measurements, as shown in figure 1 in [78]. The average number of electrons isobtained from the charge yield (Qy) measured in [77] as
〈NNRel 〉 = Ed · Qy
In NRs, a large fraction of the deposited energy is dissipated into heat and is not availableto generate light and charge signals, therefore 〈NNR
Q 〉 = 〈NNRph 〉+ 〈NNR
el 〉 is smaller than the〈NQ〉 obtained for ER of the same energy. We model the fluctuations in the available quantawith a sampling from a Binomial distribution with probability fNR = 〈NNR
Q 〉/〈NQ〉:
NNRQ = Binomial(NQ, fNR).
– 19 –

Electron Recoil Energy [keV]0 10 20 30 40 50 60 70 80 90 100
S1 y
ield
[PE
/keV
]
0
1
2
3
4
5
6
7
8
9
10
0.01
0.02
0.03
0.04
0.05
0.06
-310×
ER, S1
Electron Recoil Energy [keV]0 10 20 30 40 50 60 70 80 90 100
S2 y
ield
[PE
/keV
]
0
200
400
600
800
1000
1200
1400
1600
1800
2000
norm
aliz
ed u
nits
0.01
0.02
0.03
0.04
0.05
0.06
0.07
0.08
-310×
ER, S2
Nuclear Recoil Energy [keV]0 10 20 30 40 50 60 70 80 90 100
S1 y
ield
[PE
/keV
]
0
0.5
1
1.5
2
2.5
3
norm
aliz
ed u
nits
0.02
0.04
0.06
0.08
0.1
-310×
NR, S1
Nuclear Recoil Energy [keV]0 10 20 30 40 50 60 70 80 90 100
S2 y
ield
[PE
/keV
]
0
50
100
150
200
250
300
norm
aliz
ed u
nits
0.05
0.1
0.15
0.2
0.25
0.3
0.35
-310×
NR, S2
Figure 13. Distribution of the S1 (left) and S2 (right) yield as a function of the deposited energy:top row is for ERs, bottom row for NRs. The z-axis for all the plots is expressed by the colors interms of normalized units, the same number of events has been generated in each 1 keV slice of thex-axis. The black dots represent the average value of the signal yield in each energy slice.
The number of photons Nph is obtained from NNRQ with another Binomial sampling with
probability fph = 〈NNRph 〉/〈NNR
Q 〉,
Nph = Binomial(NNRQ , fph).
The number of electrons is given by Nel = NNRQ − Nph. Hence we also consider the anti-
correlation between the light and charge signal for NRs.
6.2 Generation of S1 and S2 signals
Photons are converted into the S1 signal by applying the position-dependent light collectionefficiency derived in section 5, see eq 5.1. The average value of fPE , over the whole TPC, is∼ 12%, corresponding to an S1-yield (defined as the number of detected PE normalized bythe deposited energy) of 4.6 PE/keV for a 122 keV γ at 530 V/cm. The fluctuations are takeninto account considering a Binomial sampling from the number of generated photons to thedetected PE:
NPE = Binomial(Nph, fPE(~r)).
To reproduce the response of the PMT, we apply to each single PE a convolution with aGaussian distribution with width 0.4 [28]:
S1 = Gauss(NPE , 0.4 ·√NPE).
– 20 –

Then the result is corrected for the average value of the light collection efficiency in thatposition. The distribution of the S1-yield as a function of Ed is shown in figure 13 (leftcolumn).
For the charge signal, the attenuation of electrons as they drift towards the anode isaccounted for by considering the drift time td(z) corresponding to the interaction position,and the level of impurities in the TPC, parameterized by the electron lifetime τe:
N ′e = Binomial(Ne, fe), with fe = exp−(td(z)/τe) .
In this study, however, we considered no electron absorption, assuming the performanceof the detector after a complete purification from electronegative impurities. Then the S2signal is generated assuming a full extraction efficiency (as obtained in XENON100), a meanamplification of 20 PE/e−, and a Gaussian smearing with width 7 PE/e− [79]:
S2 = Gauss(20 ·N ′e, 7 ·√N ′e).
The energy dependency of the S2-yield is shown in figure 13 (right column).The description of the full simulation of the digitization of the S1 and S2 signals, to
reproduce their shape in the waveform, so that they can be analyzed with the same softwarechain as the real data from the detector, is beyond the scope of this work.
6.3 Signal and background distributions in S1
After the conversion of the deposited energy into the detector signals, the ER and NR back-grounds, as well as the signal from WIMPs, can be shown together in the same energy scale.In this study, we estimate the NR energy using information only from S1, as it was done inprevious XENON100 analyses [39]. In figure 14, the total background in 1 t FV is presentedas a function of S1, together with the separate contributions of ERs and NRs. We require tohave an S1-S2 pair, with S2 > 150 PE (the same XENON100 trigger threshold), even if withthe new XENON1T DAQ we expect an improved S2 threshold. We assume an ER rejectionefficiency of 99.75% with a flat 40% NR acceptance. The total background is dominated byERs, except below ∼ 5 PE, where the NRs from CNNS become more relevant. For compar-ison, we superimpose also the NR spectrum induced by WIMPs for three different masses andcross-sections, with the halo properties assumed in [14].
7 Sensitivity prediction for XENON1T
We now calculate the sensitivity of the XENON1T experiment based on the backgroundprediction and the conversion from deposited energy into observable signals presented in theprevious sections. The sensitivity is defined as the median upper limit we would obtain inrepeated experiments with only background present and null signal. For statistical inference,in particular the calculation of upper limits, we use the Profile Likelihood Ratio method[80]. The approach was already used for the analysis of the XENON100 data [14, 78] and isdescribed in detail in [39, 81].
The observables for the analysis are the prompt scintillation signals S1, and an idealizeddiscrimination variable Y , which for simplicity in our analysis replaces the usual log10(S2/S1).The S1 distributions for the WIMPmass-dependent signal and the various background sourcesare taken from the spectra shown in figure 14. Both ER and NR backgrounds are assumed tobe Gaussian distributed in the discrimination variable Y : ERs have mean = 0 and σ = 1, while
– 21 –

S1 [PE]0 10 20 30 40 50 60 70 80
]-1
PE
)⋅
day
⋅
Eve
nt R
ate
[ (
kg
-1110
-1010
-910
-810
-710
-610
-510
-410Total (ER+NR) backgroundER backgroundNR background from neutrons
νNR background from 2 cm-46 = 2 10σ, 2WIMP, m = 10 GeV/c
2 cm-47 = 2 10σ, 2WIMP, m = 100 GeV/c2 cm-46 = 2 10σ, 2WIMP, m = 1000 GeV/c
Figure 14. Spectrum of the total background as a function of S1 (black) and of its components:ERs (blue), NRs from radiogenic neutrons (red) and NRs from CNNS (purple). NR spectra for threeexamples of WIMP signals (green): mass mχ = 10 GeV/c2 and cross section σ = 2 · 10−46 cm2
(dashed), mχ = 100 GeV/c2 and σ = 2 · 10−47 cm2 (solid), mχ = 1000 GeV/c2 and σ = 2 · 10−46 cm2
(dotted). The vertical dashed blue lines delimit the S1 region used in the sensitivity calculation. Inthis plot we select the events with S2 > 150 PE, and assume a 99.75% ER rejection with a flat 40%NR acceptance.
NRs have mean = −2.58 and σ = 0.92. With this choice we reproduce the discriminationperformance obtained in XENON100, namely: 99.5% ER rejection at 50% NR acceptance;99.75% ER rejection at 40% NR acceptance; and 99.9% ER rejection at 30% NR acceptance[31]. In the profile likelihood analysis we use the whole data sample without applying anyhard cut in the discrimination space Y , i.e. a marked Poisson distribution [82].
The expectation values for signal and backgrounds, considering a 2 year-long measure-ment with a 1 t FV, are summarized in table 4. The S1 range used in the analysis is (3, 70) PE:the lower edge corresponds to the XENON100 S1 threshold, while the higher one marks theregion where the ER background starts to be larger by more than an order of magnitude thanthe signal from a 100 GeV/c2 WIMP. On average, it corresponds to the NR energy range (4,50) keV.
The main systematic uncertainty in the prediction of the signal and the NR backgroundcomes from the relative scintillation efficiency in LXe, Leff . We adopt the Leff parameteriza-tion shown in figure 1 of [78], using the median of several direct measurements as the centralvalue and parameterizing the uncertainty by a Gaussian distribution. We extrapolated Leff
also below 3 keV, where no direct measurements exist so far (although there are hints of non-vanishing Leff from the neutron calibration in LUX [83]): the median value reaches zero at 1keV and the 1σ and 2σ bands are increased to reflect the larger systematic uncertainty. Wechecked that the sensitivity is not significantly affected (at most 20% at low WIMP masses,
– 22 –

Expectation values of events in XENON1T, in 2 t·y exposureNo 99.75% ER
discrimination discriminationSignal (µs)6 GeV/c2 WIMP (σ = 2 · 10−45 cm2) 0.68 0.2710 GeV/c2 WIMP (σ = 2 · 10−46 cm2) 4.65 1.86100 GeV/c2 WIMP (σ = 2 · 10−47 cm2) 7.13 2.851 TeV/c2 WIMP (σ = 2 · 10−46 cm2) 8.85 3.54BackgroundTotal ER (µbER) 1300 3.25
NR from neutrons 1.10 0.44NR from CNNS 1.18 0.47
Total NR (µbNR) 2.28 0.91
Table 4. Number of expected events in XENON1T before and after 99.75% ER discrimination (40%NR acceptance) in 1 t fiducial volume and 2 years of measurement. The S1 range is (3, 70) PE.
where the impact is the largest) if we adopt a uniform uncertainty parameterization betweenthe ±2σ bands below 3 keV, instead of the Gaussian one. Leff and its uncertainty are para-meterized with a single nuisance parameter tL, normally distributed with zero mean and unitvariance. For each value of tL, we calculate the corresponding expected number of events andspectra for the NR background from neutrons and CNNS, and for the WIMP signal from eachof the considered WIMP masses. We checked that the shape of the spectra is not significantlyaffected by the variation in tL, therefore only the variation in the expected number of eventsis considered in the analysis, as it was done also in [81]. The largest impact is observed forlow energy signals, especially for CNNS and the low mass WIMPs, below 10 GeV/c2. VaryingLeff to its ±2σ values produces a variation up to a factor 4 for CNNS and 6 GeV/c2 WIMPs,while for NR background from neutrons and 50 GeV/c2 WIMPs the variation is about ±10%.
We also included in the model other additional uncertainties, also treated as nuisanceparameters in the likelihood. They include the charge yield Qy, treated in the same way asLeff through the nuisance parameter tQ, and the systematic uncertainty on the predictionof the ER and NR backgrounds, assumed conservatively as 10% and 20%, respectively, andparameterized with tER and tNR. We found them to be less relevant than the one comingfrom Leff , at the level of a few percent in the final sensitivity with respect to the use of theLeff term only.
We use an un-binned, extended likelihood defined as:
− 2 ln L(σ; tL, tQ, tER, tNR) = 2 [ µs(σ; tL, tQ) + µbER(tER) + µbNR(tL, tQ, tNR) ]
− 2
nobs∑i=1
ln{ [ µs(σ; tL, tQ) · fs(S1i) · gs(Yi) ]
+ [ µbER(tER) · fbER(S1i) · gbER(Yi) ]
+ [ µbNR(tL, tQ, tNR) · fbNR(S1i) · gbNR(Yi) ] }+ [ (tL − t0L)2 + (tQ − t0Q)2
+ (tER − t0ER)2 + (tNR − t0NR)2 ] (7.1)
where σ is the spin-independent WIMP-nucleon cross section, µs, µbER and µbNR are theexpectation values of the signal, the ER and NR background, respectively. nobs is the total
– 23 –

number of observed events, f(S1) and g(Y ) are the probability distributions in the twoobservables S1 and Y . The last term,
∑j(tj − t0j )2, with j running over the four nuisance
parameters, describes the Gaussian constraint on them, where t0j is the expected value ofthe j-th nuisance parameter (e.g. t0L = 0 describes the median of Leff). Note that both theWIMP signal and the NR background are affected by the uncertainty on Leff and Qy.
Since we are interested in determining upper limits, we use the test statistic defined as:
qσ =
−2 lnL(σ; ˆ̂tj)
L(σ̂; t̂j)if σ ≥ σ̂
0 if σ < σ̂(7.2)
where σ̂ and t̂j are the maximum likelihood estimators (MLE), while ˆ̂tj is the conditionalMLE obtained for the nuisance parameters at the fixed value of σ under test.
In order to calculate the sensitivity, we perform Monte Carlo simulations (104 in eachconfiguration) of the measurement process to obtain distributions of the test statistic underthe background-only (H0) and the signal hypotheses (Hσ, for all considered cross-sections).The 90% C.L. upper limit is found using the CLs method, which prevents over-optimisticresults due to under-fluctuations of the background. Following the nomenclature used in [81],we require a p′-value equal to 0.1 for the Hσ hypothesis to determine the upper limit σ90.The sensitivity is then obtained by repeating these calculations for 104 simulations of thebackground-only case, thereby obtaining the distribution of upper limits and in particulartheir median. It should be noted that we treat the nuisance parameters as a random variable,i.e. for each MC experiment we draw also an estimate of t0j according to the assumed Gaussiandistribution. This corresponds to the unconditional ensemble discussed in [84].
Considering a XENON1T exposure of 2 years in 1 t FV, we obtain the result shownin figure 15. The minimum is achieved at mχ = 50 GeV/c2 for a spin-independent WIMP-nucleon cross section of 1.6 · 10−47 cm2. The improvement with respect to the current bestlimit (from LUX [16]) at the same WIMP mass is a factor ∼ 50. Assuming a cutoff in theemission model, with Leff set to zero below 3 keV, the sensitivity decreases significantly onlyat low WIMP masses, below 10 GeV/c2, as it is shown with the blue dotted line. At mχ = 6GeV/c2, the decrease in sensitivity with this pessimistic assumption is about a factor 3. Infigure 16 we show the XENON1T sensitivity at mχ = 50 GeV/c2 as a function of time,assuming a 1 t FV. In about 2 (5) days we can achieve the upper limit set by the XENON100(LUX) experiment.
7.1 Sensitivity projection towards XENONnT
Many of the subsystems of the XENON1T experiment, e.g., water shield, Cherenkov muonveto, cryostat support, outer cryostat, LXe cooling, storage and purification systems, dataacquisition system, etc., have been designed such that they can be used for an upgradedlarger phase of the experiment, XENONnT, containing about 7 tonnes of LXe. The TPCwill be enlarged by (20− 30)% and the number of PMTs will increase to about 450. Due tothe improved self-shielding and capability to detect multiple scatters in the larger detector,it is more effective to define a FV in which the ER and NR backgrounds from the materialscan be reduced to a negligible level. In addition, there are on-going R&D studies to furtherimprove the purification of the LXe target from the intrinsic contaminants 222Rn and 85Kr.Thus, we calculate the sensitivity of the XENONnT experiment assuming negligible ER andNR backgrounds from the detector materials, assuming 0.1 µBq/kg of 222Rn, and 0.02 ppt of
– 24 –
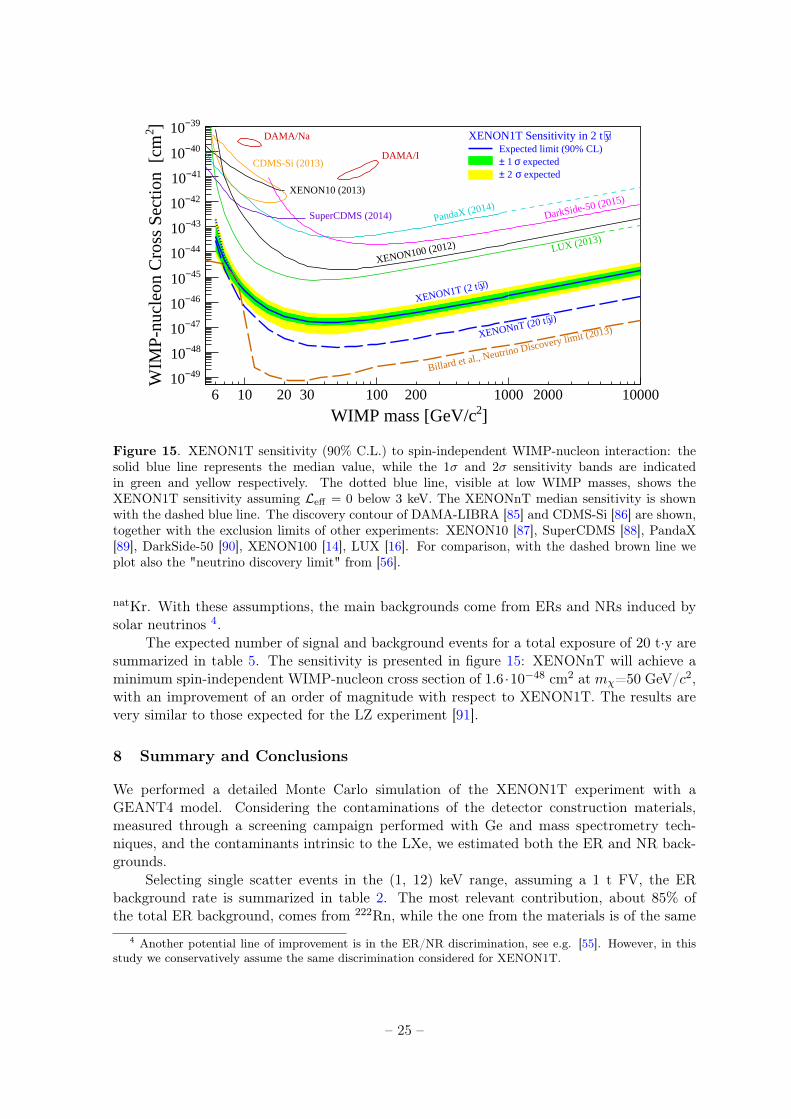
] 2WIMP mass [GeV/c6 10 20 30 100 200 1000 2000 10000
]2W
IMP-
nucl
eon
Cro
ss S
ectio
n [
cm
49−10
48−10
47−10
46−10
45−10
44−10
43−10
42−10
41−10
40−10
39−10DAMA/Na
DAMA/ICDMS-Si (2013)
XENON10 (2013)
SuperCDMS (2014) PandaX (2014)DarkSide-50 (2015)
XENON100 (2012) LUX (2013)
y)⋅XENON1T (2 t
y)⋅XENONnT (20 t
Billard et al., Neutrino Discovery limit (2013)
y⋅XENON1T Sensitivity in 2 tExpected limit (90% CL)
expectedσ 2 ± expectedσ 1 ±
Figure 15. XENON1T sensitivity (90% C.L.) to spin-independent WIMP-nucleon interaction: thesolid blue line represents the median value, while the 1σ and 2σ sensitivity bands are indicatedin green and yellow respectively. The dotted blue line, visible at low WIMP masses, shows theXENON1T sensitivity assuming Leff = 0 below 3 keV. The XENONnT median sensitivity is shownwith the dashed blue line. The discovery contour of DAMA-LIBRA [85] and CDMS-Si [86] are shown,together with the exclusion limits of other experiments: XENON10 [87], SuperCDMS [88], PandaX[89], DarkSide-50 [90], XENON100 [14], LUX [16]. For comparison, with the dashed brown line weplot also the "neutrino discovery limit" from [56].
natKr. With these assumptions, the main backgrounds come from ERs and NRs induced bysolar neutrinos 4.
The expected number of signal and background events for a total exposure of 20 t·y aresummarized in table 5. The sensitivity is presented in figure 15: XENONnT will achieve aminimum spin-independent WIMP-nucleon cross section of 1.6 ·10−48 cm2 at mχ=50 GeV/c2,with an improvement of an order of magnitude with respect to XENON1T. The results arevery similar to those expected for the LZ experiment [91].
8 Summary and Conclusions
We performed a detailed Monte Carlo simulation of the XENON1T experiment with aGEANT4 model. Considering the contaminations of the detector construction materials,measured through a screening campaign performed with Ge and mass spectrometry tech-niques, and the contaminants intrinsic to the LXe, we estimated both the ER and NR back-grounds.
Selecting single scatter events in the (1, 12) keV range, assuming a 1 t FV, the ERbackground rate is summarized in table 2. The most relevant contribution, about 85% ofthe total ER background, comes from 222Rn, while the one from the materials is of the same
4 Another potential line of improvement is in the ER/NR discrimination, see e.g. [55]. However, in thisstudy we conservatively assume the same discrimination considered for XENON1T.
– 25 –
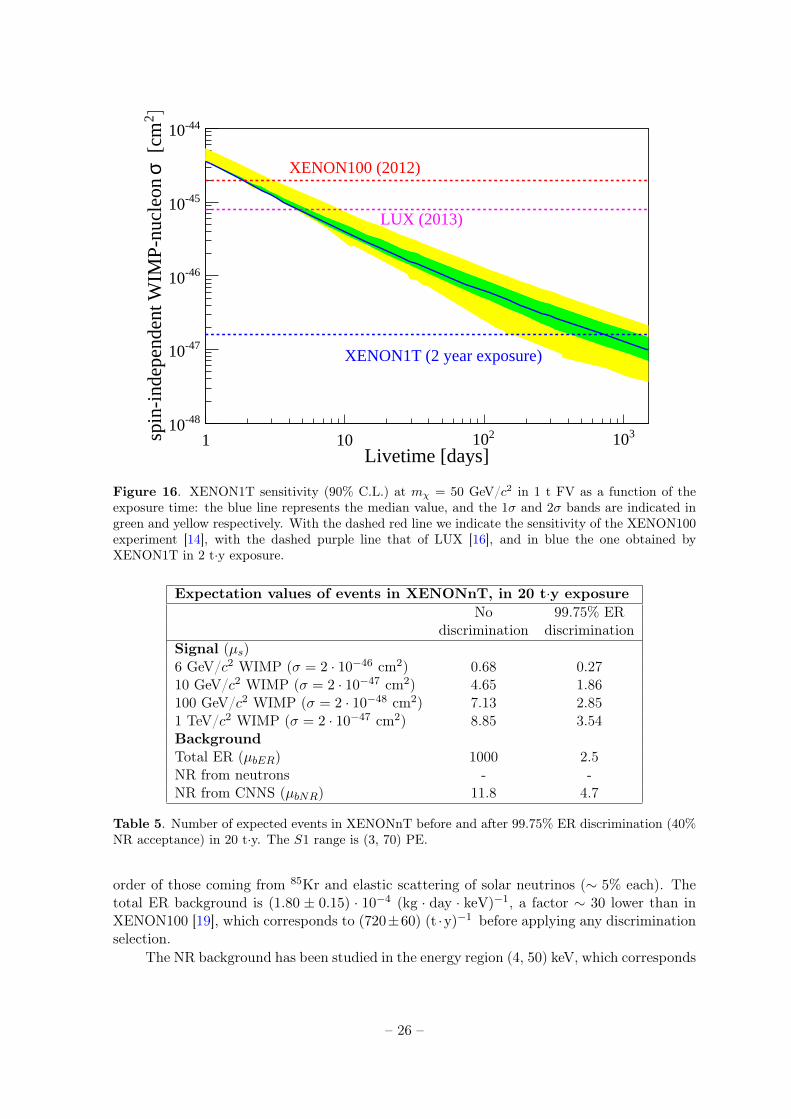
Livetime [days]1 10 210 310
]2 [
cmσ
spin
-ind
epen
dent
WIM
P-nu
cleo
n
-4810
-4710
-4610
-4510
-4410
XENON100 (2012)
LUX (2013)
XENON1T (2 year exposure)
Figure 16. XENON1T sensitivity (90% C.L.) at mχ = 50 GeV/c2 in 1 t FV as a function of theexposure time: the blue line represents the median value, and the 1σ and 2σ bands are indicated ingreen and yellow respectively. With the dashed red line we indicate the sensitivity of the XENON100experiment [14], with the dashed purple line that of LUX [16], and in blue the one obtained byXENON1T in 2 t·y exposure.
Expectation values of events in XENONnT, in 20 t·y exposureNo 99.75% ER
discrimination discriminationSignal (µs)6 GeV/c2 WIMP (σ = 2 · 10−46 cm2) 0.68 0.2710 GeV/c2 WIMP (σ = 2 · 10−47 cm2) 4.65 1.86100 GeV/c2 WIMP (σ = 2 · 10−48 cm2) 7.13 2.851 TeV/c2 WIMP (σ = 2 · 10−47 cm2) 8.85 3.54BackgroundTotal ER (µbER) 1000 2.5NR from neutrons - -NR from CNNS (µbNR) 11.8 4.7
Table 5. Number of expected events in XENONnT before and after 99.75% ER discrimination (40%NR acceptance) in 20 t·y. The S1 range is (3, 70) PE.
order of those coming from 85Kr and elastic scattering of solar neutrinos (∼ 5% each). Thetotal ER background is (1.80 ± 0.15) · 10−4 (kg · day · keV)−1, a factor ∼ 30 lower than inXENON100 [19], which corresponds to (720±60) (t ·y)−1 before applying any discriminationselection.
The NR background has been studied in the energy region (4, 50) keV, which corresponds
– 26 –

to the same S1 range used for ER when taking into account the different response of LXe toER and NR. Using the measured radio-activities of materials, we estimated a rate of (0.6±0.1)(t · y)−1 from radiogenic neutrons. Due to the performance of the water Cherenkov muonveto, the background from muon-induced neutrons is reduced to less than 1 · 10−2 (t · y)−1.A different approach is needed for the NR background from coherent scattering of neutrinos:indeed their rate in the same energy region is very small, (1.8±0.3) ·10−2 (t ·y)−1. Given theirvery steep energy spectrum, it is relevant to calculate their contribution after the conversionfrom energy into the signal seen in the detector, to correctly take into account the fluctuationsdue to the small number of detected photons at low energies.
The LCE for the S1 signal has been calculated with a MC simulation of the propagationof photons inside the TPC, considering the effects of the refractive index, the absorption lengthin LXe, the transparency of the various electrodes and the reflectivity of PTFE. Assumingrealistic values for all these parameters, the resulting LCE averaged over the whole TPC activevolume is 35%. This corresponds to a light yield at zero field of 7.7 PE/keV (4.6 PE/keV at530 V/cm) at 122 keV γ energy.
We have studied the WIMP signal and the expected backgrounds by converting energydepositions from ERs and NRs into observable signals, taking into account the detector res-olution. Considering as reference a 99.75% ER discrimination with a corresponding 40% NRacceptance, the background in the (3, 70) PE S1 range is (1.62 ± 0.15) (t · y)−1 from ER,(0.22± 0.04) (t · y)−1 from NR of radiogenic neutrons, and (0.23± 0.04) (t · y)−1 from NR ofneutrino coherent scattering. The uncertainties reflect only those coming from the knowledgeof the sources of background, and not those from the LXe response which have been directlyincluded in the sensitivity estimation.
We calculated the XENON1T sensitivity using the Profile Likelihood Ratio method,without any ER/NR discrimination cut. The main systematic uncertainty comes from Leff ,treated as a nuisance parameter affecting both the signal from WIMPs and the NR back-grounds. After a 2 y measurement in 1 t FV, we obtain the sensitivity shown in figure15, where the median value of the spin-independent WIMP-nucleon cross section reaches aminimum of 1.6 · 10−47 cm2 at mχ=50 GeV/c2.
We also estimated the sensitivity of XENONnT, a future upgrade to XENON1T, whichwill be hosted in the same experimental area and will contain up to 7 t of LXe. Consideringa FV where the ER and NR backgrounds from the detector materials are suppressed to anegligible level and assuming an improved purification from intrinsic contaminants, the mostrelevant background comes from ERs and NRs from solar neutrinos. Assuming a 20 t·yexposure, the sensitivity reaches 1.6 · 10−48 cm2 at mχ=50 GeV/c2, an order of magnitudebetter than XENON1T.
In conclusion, with the XENON1T and XENONnT experiments we will be able toreach an unprecedented sensitivity to galactic dark matter particles, more than two orders ofmagnitude with respect to the currently running experiments. This will allow us to probe theregion of electroweak parameter space favored by theoretical calculations in supersymmetricand other WIMP models [9, 92, 93].
A Appendix: XENON1T sensitivity with the LUX2015 emission model
Recently, when we already were at the completion of this work, a new analysis of the dataof the LUX experiment has been presented [94]. In that work a new model for the light andcharge emission in LXe, driven by an in situ neutron calibration with a D-D source, was
– 27 –

Nuclear Recoil Energy [keV]1 10 210
Phot
on Y
ield
[ph
/keV
]
0
2
4
6
8
10
12
14
modelXENON100
modelLUX2015
Nuclear Recoil Energy [keV]1 10 210
/keV
]-
Ele
ctro
n Y
ield
[e
0
2
4
6
8
10
12 modelXENON100
modelLUX2015
Figure 17. Comparison of the LXe models for the emission of photons (left) and electrons (right)assumed in XENON100 (blue) and LUX (red). The thick line shows the median value, while theshaded areas represent the 1σ and 2σ bands. The vertical dashed line represents the cutoff energybelow which the yields are assumed to be zero in both models.
considered. In figure 17, we compare the photon and electron yields measured in LUX (herecalled LUX2015 model) to the one used in section 6 (called XENON100 model). For energieslarger than 3 keV, the photon yields are very similar, while at lower energies the LUX2015model is significantly larger. Indeed, due to the lack of direct measurements below 3 keV, inthe XENON100 model a photon yield extrapolated down to zero at 1 keV was conservativelyassumed. The electron yield is larger in the LUX2015 model for most of the energy rangeof interest for WIMP-induced NRs. With the new measurement, the systematic uncertaintyin the yields is significantly decreased, as shown by the narrow 1σ and 2σ bands around themedian value. The higher yields allow the LUX experiment to obtain a large increase insensitivity, in particular at low WIMP masses, with respect to their previous analysis [16].
The emission model in LXe impacts all LXe-based detectors in the same way, independ-ent of detector-specific details. Therefore, a proper comparison of results or sensitivities mustemploy the same emission model in LXe. Here we study the XENON1T sensitivity adoptingthe LUX2015 model. Thus, we repeat the procedure described in section 6, but with the newmodel and its uncertainties. As it was done in the LUX analysis, we also consider a cutoff at1 keV, below which the emission is set to zero.
The expected number of events in XENON1T for signal and backgrounds, in 2 t·yexposure, are summarized in table 6 and compared to those calculated with the XENON100model. We can see the increase in particular for the CNNS background (×5) and in therates for low mass WIMPs (×4 at mχ=6 GeV/c2). The sensitivity of XENON1T, calculatedassuming the LUX2015 model and following the method described in section 7, is shown infigure 18 and compared to the 2015 LUX results and to those of previous experiments. Theminimum sensitivity is still at 1.6 ·10−47 cm2 at mχ=50 GeV/c2, but the improvement at lowmass WIMP is significant, about an order of magnitude at mχ=6 GeV/c2 with respect to theone obtained with the XENON100 model. In the same figure we also show the sensitivity ofXENONnT, calculated in 20 t·y exposure with the assumptions described in section 7.1, herewith the LUX2015 model.
– 28 –

Expectation values of events in XENON1T, in 2 t·y exposureXENON100 LUX2015
model modelSignal (µs)6 GeV/c2 WIMP (σ = 2 · 10−45 cm2) 0.68 2.7210 GeV/c2 WIMP (σ = 2 · 10−46 cm2) 4.65 5.96100 GeV/c2 WIMP (σ = 2 · 10−47 cm2) 7.13 7.131 TeV/c2 WIMP (σ = 2 · 10−46 cm2) 8.85 8.85BackgroundTotal ER (µbER) 1300 1300
NR from neutrons 1.10 1.13NR from CNNS 1.18 5.36
Total NR (µbNR) 2.28 6.49
Table 6. Comparison of the number of expected events in XENON1T, considering the XENON100and LUX2015 emission models, before ER discrimination, in 1 t fiducial volume and 2 years ofmeasurement. The S1 range is (3, 70) PE.
] 2WIMP mass [GeV/c6 10 20 30 100 200 1000 2000 10000
]2W
IMP-
nucl
eon
Cro
ss S
ectio
n [
cm
49−10
48−10
47−10
46−10
45−10
44−10
43−10
42−10
41−10
40−10
39−10DAMA/Na
DAMA/ICDMS-Si (2013)
XENON10 (2013)
SuperCDMS (2014) PandaX (2014)DarkSide-50 (2015)
XENON100 (2012) LUX (2015)
y)⋅XENON1T (2 t
y)⋅XENONnT (20 t
Billard et al., Neutrino Discovery limit (2013)
y⋅XENON1T Sensitivity in 2 tExpected limit (90% CL)
expectedσ 2 ± expectedσ 1 ±
Figure 18. XENON1T sensitivity (90% C.L.) to spin-independent WIMP-nucleon interaction, cal-culated with the LUX2015 emission model: the solid blue line represents the median value, while the1σ and 2σ sensitivity bands are indicated in green and yellow respectively. The XENONnT mediansensitivity, also calculated with the LUX2015 model, is shown with the dashed blue line. The discov-ery contour of DAMA-LIBRA [85] and CDMS-Si [86] are shown, together with the exclusion limitsof other experiments: XENON10 [87], SuperCDMS [88], PandaX [89], DarkSide-50 [90], XENON100[14] and LUX with the 2015 re-analysis [94]. For comparison, with the dashed brown line we plot alsothe "neutrino discovery limit" from [56].
– 29 –
Acknowledgments
We gratefully acknowledge support from: the National Science Foundation, Swiss NationalScience Foundation, Bundesministerium für Bildung und Forschung, Max Planck Gesellschaft,Foundation for Fundamental Research on Matter, Weizmann Institute of Science, I-CORE,Initial Training Network Invisibles (Marie Curie Actions, PITN- GA-2011-289442), Fundacaopara a Ciencia e a Tecnologia, Region des Pays de la Loire, Knut and Alice WallenbergFoundation, and Istituto Nazionale di Fisica Nucleare.
We are grateful to Laboratori Nazionali del Gran Sasso for hosting and supporting theXENON project.
References
[1] Particle Data Group Collaboration, K. A. Olive et al., Review of Particle Physics, Chin.Phys. C38 (2014) 090001.
[2] G. R. Blumenthal, S. Faber, J. R. Primack and M. J. Rees, Formation of Galaxies and LargeScale Structure with Cold Dark Matter, Nature 311 (1984) 517–525.
[3] M. Davis, G. Efstathiou, C. S. Frenk and S. D. White, The Evolution of Large Scale Structurein a Universe Dominated by Cold Dark Matter, Astrophys.J. 292 (1985) 371–394.
[4] D. Clowe et al., A direct empirical proof of the existence of dark matter, Astrophys.J. 648(2006) L109–L113, [astro-ph/0608407].
[5] WMAP Collaboration, C. Bennett et al., Nine-Year Wilkinson Microwave Anisotropy Probe(WMAP) Observations: Final Maps and Results, Astrophys.J.Suppl. 208 (2013) 20,[arXiv:1212.5225].
[6] Planck Collaboration, P. A. R. Ade et al., Planck 2015 results. XIII. Cosmological parameters,arXiv:1502.01589.
[7] G. Steigman and M. S. Turner, Cosmological Constraints on the Properties of WeaklyInteracting Massive Particles, Nucl.Phys. B253 (1985) 375.
[8] G. Jungman, M. Kamionkowski and K. Griest, Supersymmetric dark matter, Phys.Rept. 267(1996) 195–373, [hep-ph/9506380].
[9] G. Bertone et al., Particle Dark Matter - Observations, Models and Searches. CambridgeUniversity Press, 2010.
[10] L. Visinelli and P. Gondolo, Dark Matter Axions Revisited, Phys. Rev. D80 (2009) 035024,[arXiv:0903.4377].
[11] D. J. H. Chung, E. W. Kolb and A. Riotto, Superheavy dark matter, Phys. Rev. D59 (1999)023501, [hep-ph/9802238].
[12] A. Boyarsky, O. Ruchayskiy and M. Shaposhnikov, The Role of sterile neutrinos in cosmologyand astrophysics, Ann. Rev. Nucl. Part. Sci. 59 (2009) 191–214, [arXiv:0901.0011].
[13] T. Marrodán Undagoitia and L. Rauch, Dark matter direct-detection experiments, J. Phys.G43 (2016), no. 1 013001, [arXiv:1509.08767].
[14] XENON Collaboration, E. Aprile et al., Dark Matter Results from 225 Live Days ofXENON100 Data, Phys.Rev.Lett. 109 (2012) 181301, [arXiv:1207.5988].
[15] XENON Collaboration, E. Aprile et al., Limits on spin-dependent WIMP-nucleon crosssections from 225 live days of XENON100 data, Phys.Rev.Lett. 111 (2013) 021301,[arXiv:1301.6620].
– 30 –

[16] LUX Collaboration, D. Akerib et al., First results from the LUX dark matter experiment at theSanford Underground Research Facility, Phys.Rev.Lett. 112 (2014) 091303, [arXiv:1310.8214].
[17] XENON Collaboration, E. Aprile, The XENON1T Dark Matter Search Experiment, SpringerProc.Phys. C12-02-22 (2013) 93–96, [arXiv:1206.6288].
[18] D. Z. Freedman, Coherent neutrino nucleus scattering as a probe of the weak neutral current,Phys. Rev. D9 (1974) 1389–1392.
[19] XENON Collaboration, E. Aprile et al., Study of the electromagnetic background in theXENON100 experiment, Phys.Rev. D83 (2011) 082001, [arXiv:1101.3866]. [Erratum ibidD85 (2012) 029904].
[20] EDELWEISS Collaboration, E. Armengaud et al., Background studies for the EDELWEISSdark matter experiment, Astropart.Phys. 47 (2013) 1–9, [arXiv:1305.3628].
[21] LUX Collaboration, D. Akerib et al., Radiogenic and Muon-Induced Backgrounds in the LUXDark Matter Detector, Astropart.Phys. 62 (2015) 33–46, [arXiv:1403.1299].
[22] XENON Collaboration, E. Aprile et al., The neutron background of the XENON100 darkmatter search experiment, J.Phys. G40 (2013) 115201, [arXiv:1306.2303].
[23] XENON Collaboration, E. Aprile et al., Conceptual design and simulation of a waterCherenkov muon veto for the XENON1T experiment, JINST 9 (2014) 11006,[arXiv:1406.2374].
[24] A. Bolozdynya, Two-phase emission detectors and their applications, Nucl.Instrum.Meth.A422 (1999) 314–320.
[25] A. Lansiart et al., Development research on a highly luminous condensed xenon scintillator,Nucl.Instrum.Meth. 135 (1976) 47–52.
[26] GEANT4 Collaboration, S. Agostinelli et al., GEANT4: A Simulation toolkit,Nucl.Instrum.Meth. A506 (2003) 250–303.
[27] M. Yamashita, T. Doke, K. Kawasaki, J. Kikuchi and S. Suzuki, Scintillation response of liquidXe surrounded by PTFE reflector for gamma rays, Nucl.Instrum.Meth. A535 (2004) 692–698.
[28] XENON Collaboration, E. Aprile et al., Lowering the radioactivity of the photomultiplier tubesfor the XENON1T dark matter experiment, Eur.Phys.J. C75 (2015) 546, [arXiv:1503.07698].
[29] K. Lung et al., Characterization of the Hamamatsu R11410-10 3-Inch Photomultiplier Tube forLiquid Xenon Dark Matter Direct Detection Experiments, Nucl.Instrum.Meth. A696 (2012)32–39, [arXiv:1202.2628].
[30] L. Baudis et al., Performance of the Hamamatsu R11410 Photomultiplier Tube in cryogenicXenon Environments, JINST 8 (2013) P04026, [arXiv:1303.0226].
[31] XENON Collaboration, E. Aprile et al., The XENON100 Dark Matter Experiment,Astropart.Phys. 35 (2012) 573–590, [arXiv:1107.2155].
[32] XENON Collaboration, M. Selvi, Study of the performances of the shield and muon veto ofthe XENON1T experiment, PoS IDM2010 (2011) 053.
[33] L. Baudis, A. Ferella, A. Askin, J. Angle, E. Aprile et al., Gator: a low-background countingfacility at the Gran Sasso Underground Laboratory, JINST 6 (2011) P08010,[arXiv:1103.2125].
[34] G. Heusser, M. Laubenstein and H. Neder, Low-level germanium gamma-ray spectrometry atthe µBq/kg level and future developments towards higher sensitivity, in Radionuclides in theEnvironmentInt. Conf. On Isotopes in Env. Studies (P. Povinec and J. Sanchez-Cabeza, eds.),vol. 8 of Radioactivity in the Environment, pp. 495 – 510. Elsevier, 2006.
[35] G. Heusser et al., GIOVE - A new detector setup for high sensitivity germanium spectroscopyat shallow depth, Eur. Phys. J. C75 (2015), no. 11 531, [arXiv:1507.03319].
– 31 –
[36] XENON Collaboration, Material screening and selection for XENON1T, in preparation.
[37] Evaluated Nuclear Structure Data, http://www.nndc.bnl.gov/ensdf/.
[38] http://geant4.web.cern.ch/geant4/support/datafiles_origin.shtml.
[39] XENON Collaboration, E. Aprile et al., Analysis of the XENON100 Dark Matter SearchData, Astropart.Phys. 54 (2014) 11–24, [arXiv:1207.3458].
[40] M. C. Smith et al., The RAVE Survey: Constraining the Local Galactic Escape Speed,Mon.Not.Roy.Astron.Soc. 379 (2007) 755–772, [astro-ph/0611671].
[41] M. Weber, Gentle Neutron Signals and Noble Background in the XENON100 Dark MatterSearch Experiment. PhD thesis, Max Planck Institut fur KernPhysik - Heidelberg, 2013.http://pubman.mpdl.mpg.de/pubman/faces/viewItemOverviewPage.jsp?itemId=escidoc:1798465.
[42] http://www.nucleide.org/DDEP_WG/Ra-226D_NT08-059.pdf.
[43] X. Du, K. Bailey, Z.-T. Lu, P. Mueller, T. P. O’Connor and L. Young, An atom trap system forpractical 81Kr dating, Rev.Sci.Instr. 75 (2004) 3224–3232.
[44] S. Lindemann and H. Simgen, Krypton assay in xenon at the ppq level using a gaschromatographic system and mass spectrometer, Eur. Phys. J. C74 (2014) 2746,[arXiv:1308.4806].
[45] S. Rosendahl et al., A cryogenic distillation column for the XENON1T experiment,J.Phys.Conf.Ser. 564 (2014), no. 1 012006.
[46] D. Stolzenburg, On the krypton background of the XENON100 and XENON1T dark mattersearch experiments, Master’s thesis, Max Planck Institut fur KernPhysik - Heidelberg, 2014.http://pubman.mpdl.mpg.de/pubman/faces/viewItemOverviewPage.jsp?itemId=escidoc:2057509.
[47] S. Rosendahl, Gas purification of the XENON dark matter search. PhD thesis, University ofMünster, 2015.
[48] M. Selvi, Review of Monte Carlo simulations for backgrounds from radioactivity, in LOWRADIOACTIVITY TECHNIQUES 2013 (LRT 2013): Proceedings of the IV InternationalWorkshop in Low Radioactivity Techniques, vol. 1549, pp. 213–218, AIP Publishing, 2013.
[49] EXO-200 Collaboration, J. Albert et al., Improved measurement of the 2νββ half-life of 136Xewith the EXO-200 detector, Phys.Rev. C89 (2014) 015502, [arXiv:1306.6106].
[50] O. Ponkratenko, V. Tretyak and Y. Zdesenko, The Event generator DECAY4 for simulation ofdouble beta processes and decay of radioactive nuclei, Phys.Atom.Nucl. 63 (2000) 1282–1287,[nucl-ex/0104018].
[51] J. Kotila and F. Iachello, Phase space factors for double-β decay, Phys. Rev. C85 (2012)034316, [arXiv:1209.5722].
[52] http://nucleartheory.yale.edu/double-beta-decay-phase-space-factors.
[53] J. N. Bahcall, A. M. Serenelli and S. Basu, New solar opacities, abundances, helioseismology,and neutrino fluxes, Astrophys.J. 621 (2005) L85–L88, [astro-ph/0412440].
[54] A. M. Serenelli, W. C. Haxton and C. Pena-Garay, Solar models with accretion. I. Applicationto the solar abundance problem, Astrophys. J. 743 (2011) 24, [arXiv:1104.1639].
[55] M. Schumann, L. Baudis, L. Bütikofer, A. Kish and M. Selvi, Dark matter sensitivity ofmulti-ton liquid xenon detectors, JCAP 1510 (2015), no. 10 016, [arXiv:1506.08309].
[56] J. Billard, L. Strigari and E. Figueroa-Feliciano, Implication of neutrino backgrounds on thereach of next generation dark matter direct detection experiments, Phys.Rev. D89 (2014)023524, [arXiv:1307.5458].
– 32 –

[57] P. Grothaus, M. Fairbairn and J. Monroe, Directional Dark Matter Detection Beyond theNeutrino Bound, Phys. Rev. D90 (2014), no. 5 055018, [arXiv:1406.5047].
[58] W. Wilson et al., SOURCES-4A, tech. rep., LA-13639-MS, Los Alamos, 1999.
[59] A. Kish, Dark Matter Search with the XENON100 Experiment. PhD thesis, Universität Zürich,2011. http://jinst.sissa.it/jinst/theses/2015_JINST_TH_005.pdf.
[60] D.-M. Mei, C. Zhang and A. Hime, Evaluation of (α,n) Induced Neutrons as a Background forDark Matter Experiments, Nucl.Instrum.Meth. A606 (2009) 651–660, [arXiv:0812.4307].
[61] D. Mei and A. Hime, Muon-induced background study for underground laboratories, Phys.Rev.D73 (2006) 053004, [astro-ph/0512125].
[62] L. Barkov, A. Grebenyuk, N. Ryskulov, P. Y. Stepanov and S. Zverev, Measurement of therefractive index of liquid xenon for intrinsic scintillation light, Nucl.Instrum.Meth. A379(1996) 482–483.
[63] V. Solovov, V. Chepel, M. Lopes and A. Hitachi, Measurement of the refractive index andattenuation length of liquid xenon for its scintillation light, Nucl.Instrum.Meth. A516 (2004)462–474, [physics/0307044].
[64] G. Seidel, R. Lanou and W. Yao, Rayleigh scattering in rare gas liquids, Nucl.Instrum.Meth.A489 (2002) 189–194, [hep-ex/0111054].
[65] A. Braem et al., Observation of the UV scintillation light from high-energy electron showers inliquid xenon, Nucl.Instrum.Meth. A320 (1992) 228–237.
[66] V. Y. Chepel, M. Lopes, R. F. Marques and A. Policarpo, Purification of liquid xenon andimpurity monitoring for a PET detector, Nucl.Instrum.Meth. A349 (1994) 500–505.
[67] A. Baldini et al., Absorption of scintillation light in a 100 l liquid xenon gamma ray detectorand expected detector performance, Nucl.Instrum.Meth. A545 (2005) 753–764,[physics/0407033].
[68] I. Malitson, Interspecimen comparison of the refractive index of fused silica, JOSA 55 (1965)1205–1208.
[69] R. Kitamura, L. Pilon and M. Jonasz, Optical constants of silica glass from extreme ultravioletto far infrared at near room temperature, Appl.Opt. 46 (2007) 8118–8133.
[70] LUX Collaboration, D. S. Akerib et al., Technical Results from the Surface Run of the LUXDark Matter Experiment, Astropart. Phys. 45 (2013) 34–43, [arXiv:1210.4569].
[71] M. Szydagis et al., NEST: A Comprehensive Model for Scintillation Yield in Liquid Xenon,JINST 6 (2011) P10002, [arXiv:1106.1613].
[72] M. Szydagis, A. Fyhrie, D. Thorngren and M. Tripathi, Enhancement of NEST Capabilities forSimulating Low-Energy Recoils in Liquid Xenon, JINST 8 (2013) C10003, [arXiv:1307.6601].
[73] A. Lyashenko, T. Nguyen, A. Snyder, H. Wang and K. Arisaka, Measurement of the absoluteQuantum Efficiency of Hamamatsu model R11410-10 photomultiplier tubes at low temperaturesdown to liquid xenon boiling point, JINST 9 (2014), no. 11 P11021, [arXiv:1410.3890].
[74] J. Seguinot, T. Ypsilantis and J. Tischhauser, Liquid xenon scintillation: Photon yield andFano factor measurements, Nucl. Instrum. Meth. A354 (1995) 280–287.
[75] T. Doke, H. J. Crawford, A. Hitachi, J. Kikuchi, P. J. Lindstrom, K. Masuda, E. Shibamuraand T. Takahashi, Let Dependence of Scintillation Yields in Liquid Argon, Nucl. Instrum.Meth. A269 (1988) 291–296.
[76] J. Thomas and D. A. Imel, Recombination of electron-ion pairs in liquid argon and liquidxenon, Phys. Rev. A36 (1987) 614–616.
– 33 –
[77] XENON Collaboration, E. Aprile et al., Response of the XENON100 Dark Matter Detector toNuclear Recoils, Phys.Rev. D88 (2013) 012006, [arXiv:1304.1427].
[78] XENON Collaboration, E. Aprile et al., Dark Matter Results from 100 Live Days ofXENON100 Data, Phys.Rev.Lett. 107 (2011) 131302, [arXiv:1104.2549].
[79] XENON Collaboration, E. Aprile et al., Observation and applications of single-electron chargesignals in the XENON100 experiment, J.Phys. G41 (2014) 035201, [arXiv:1311.1088].
[80] G. Cowan, K. Cranmer, E. Gross and O. Vitells, Asymptotic formulae for likelihood-based testsof new physics, Eur.Phys.J. C71 (2011) 1554, [arXiv:1007.1727].
[81] XENON Collaboration, E. Aprile et al., Likelihood Approach to the First Dark Matter Resultsfrom XENON100, Phys.Rev. D84 (2011) 052003, [arXiv:1103.0303].
[82] J. Conrad, Statistical Issues in Astrophysical Searches for Particle Dark Matter, Astropart.Phys. 62 (2014) 165–177, [arXiv:1407.6617].
[83] LUX Collaboration, J. Verbus, A Novel Nuclear Recoil Calibration in the LUX Detector Usinga D-D Neutron Generator, in APS Meeting Abstracts, p. 16006, 2015.
[84] ATLAS Collaboration, statistic forum, “Frequentist limit recommendation.”http://indico.cern.ch/event/126652/contribution/0/attachments/80222/115004/Frequentist_Limit_Recommendation.pdf.
[85] C. Savage, G. Gelmini, P. Gondolo and K. Freese, Compatibility of DAMA/LIBRA dark matterdetection with other searches, Journal of Cosmology and Astroparticle Physics 2009 (2009),no. 04 010.
[86] CDMS Collaboration, R. Agnese et al., Silicon Detector Dark Matter Results from the FinalExposure of CDMS II, Phys. Rev. Lett. 111 (2013), no. 25 251301, [arXiv:1304.4279].
[87] XENON10 Collaboration, J. Angle, Erratum: Search for Light Dark Matter in XENON10Data [Phys. Rev. Lett. 107 , 051301 (2011)], Phys. Rev. Lett. 110 (Jun, 2013) 249901.
[88] SuperCDMS Collaboration, R. Agnese et al., Search for Low-Mass Weakly InteractingMassive Particles with SuperCDMS, Phys. Rev. Lett. 112 (2014), no. 24 241302,[arXiv:1402.7137].
[89] PandaX Collaboration, M. Xiao et al., First dark matter search results from the PandaX-Iexperiment, Science China Physics, Mechanics & Astronomy 57 (2014), no. 11 2024–2030.
[90] DarkSide-50 Collaboration, P. Agnes et al., Low radioactivity argon dark matter searchresults from the DarkSide-50 experiment, arXiv:1510.00702.
[91] LZ Collaboration, D. S. Akerib et al., LUX-ZEPLIN (LZ) Conceptual Design Report,arXiv:1509.02910.
[92] C. Strege, G. Bertone, F. Feroz, M. Fornasa, R. Ruiz de Austri and R. Trotta, Global Fits ofthe cMSSM and NUHM including the LHC Higgs discovery and new XENON100 constraints,JCAP 1304 (2013) 013, [arXiv:1212.2636].
[93] E. A. Bagnaschi et al., Supersymmetric Dark Matter after LHC Run 1, arXiv:1508.01173.
[94] LUX Collaboration, D. S. Akerib et al., Improved WIMP scattering limits from the LUXexperiment, arXiv:1512.03506. v2.
– 34 –